1. Introduction
Chemical mechanical polishing (CMP), as the core technology for achieving global planarization in the semiconductor manufacturing field, has witnessed a simultaneous increase in process complexity and the number of process steps with the continuous evolution of chip manufacturing processes toward smaller nodes, so as to meet the increasingly stringent flatness requirements of device surfaces [
1]. As a key functional component in the polishing system, the stability of the surface pore structure of the CMP pad directly determines the polishing efficiency and the surface quality of workpieces. Trimmers loaded with irregular diamond particles on their surfaces can effectively restore the original porosity of the polishing pad surface and maintain its polishing performance [
2,
3,
4,
5].
With the continuous shrinkage of chip manufacturing process nodes, the control standards for metal contaminants in devices have become increasingly strict. Chemical vapor deposition (CVD)-type diamond trimmers are gradually replacing traditional trimmers due to their excellent wear resistance, chemical stability, and low-metal-contamination characteristics, becoming an important direction for industrial technological upgrading. A number of traditional trimmer manufacturers have also launched research, development and industrialization of such products.
At present, most studies on CMP trimmers focus on anti-metal-contamination modification, substrate material selection, pyramid-shaped diamond abrasive spacing [
6], laser parameter optimization [
7,
8,
9], and precision processing technology of ceramic substrates [
10,
11,
12]. However, systematic in-depth analysis has not been carried out on key scientific issues such as the precise regulation of diamond film roughness, the quantitative characterization of film–substrate bonding strength, and the friction and wear mechanism of diamond films under CMP conditions, resulting in obvious shortcomings in related research.
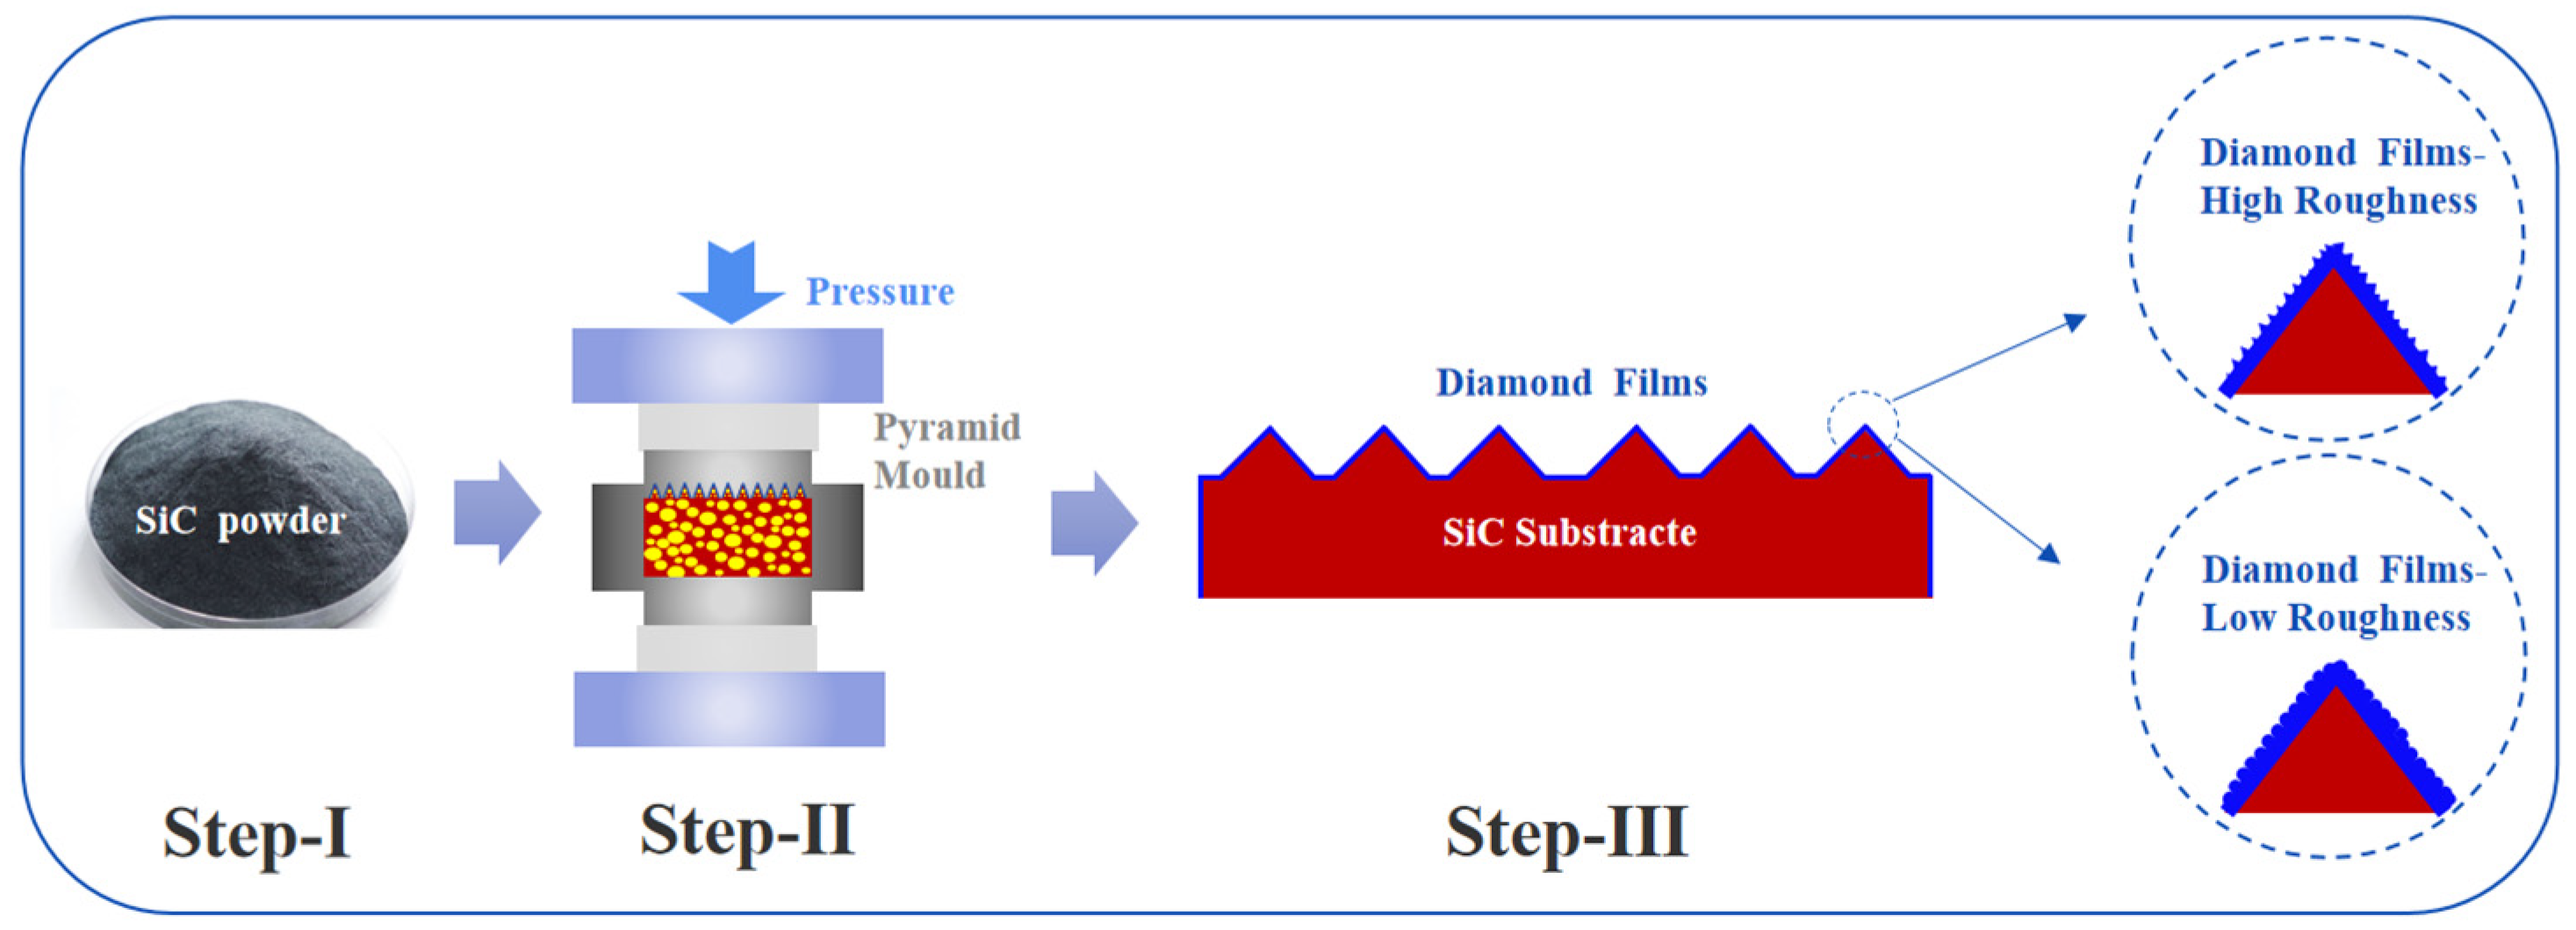
With the aim of optimizing the performance of diamond trimmers for CMP, this study prepared diamond films with gradient roughness by CVD technology. Scanning electron microscopy (SEM), Raman spectroscopy, and atomic force microscopy (AFM) were used to characterize and analyze the films, while a nanoindenter was employed to quantitatively test the bonding strength between the carbide substrate and the diamond film. Under wettability conditions simulating the actual operating environment, friction and wear experiments and wear mechanism analysis were carried out to screen out the optimal diamond film suitable for the CMP field. This work lays a foundation for the application of diamond in this field and further explores its application potential.
3. Results
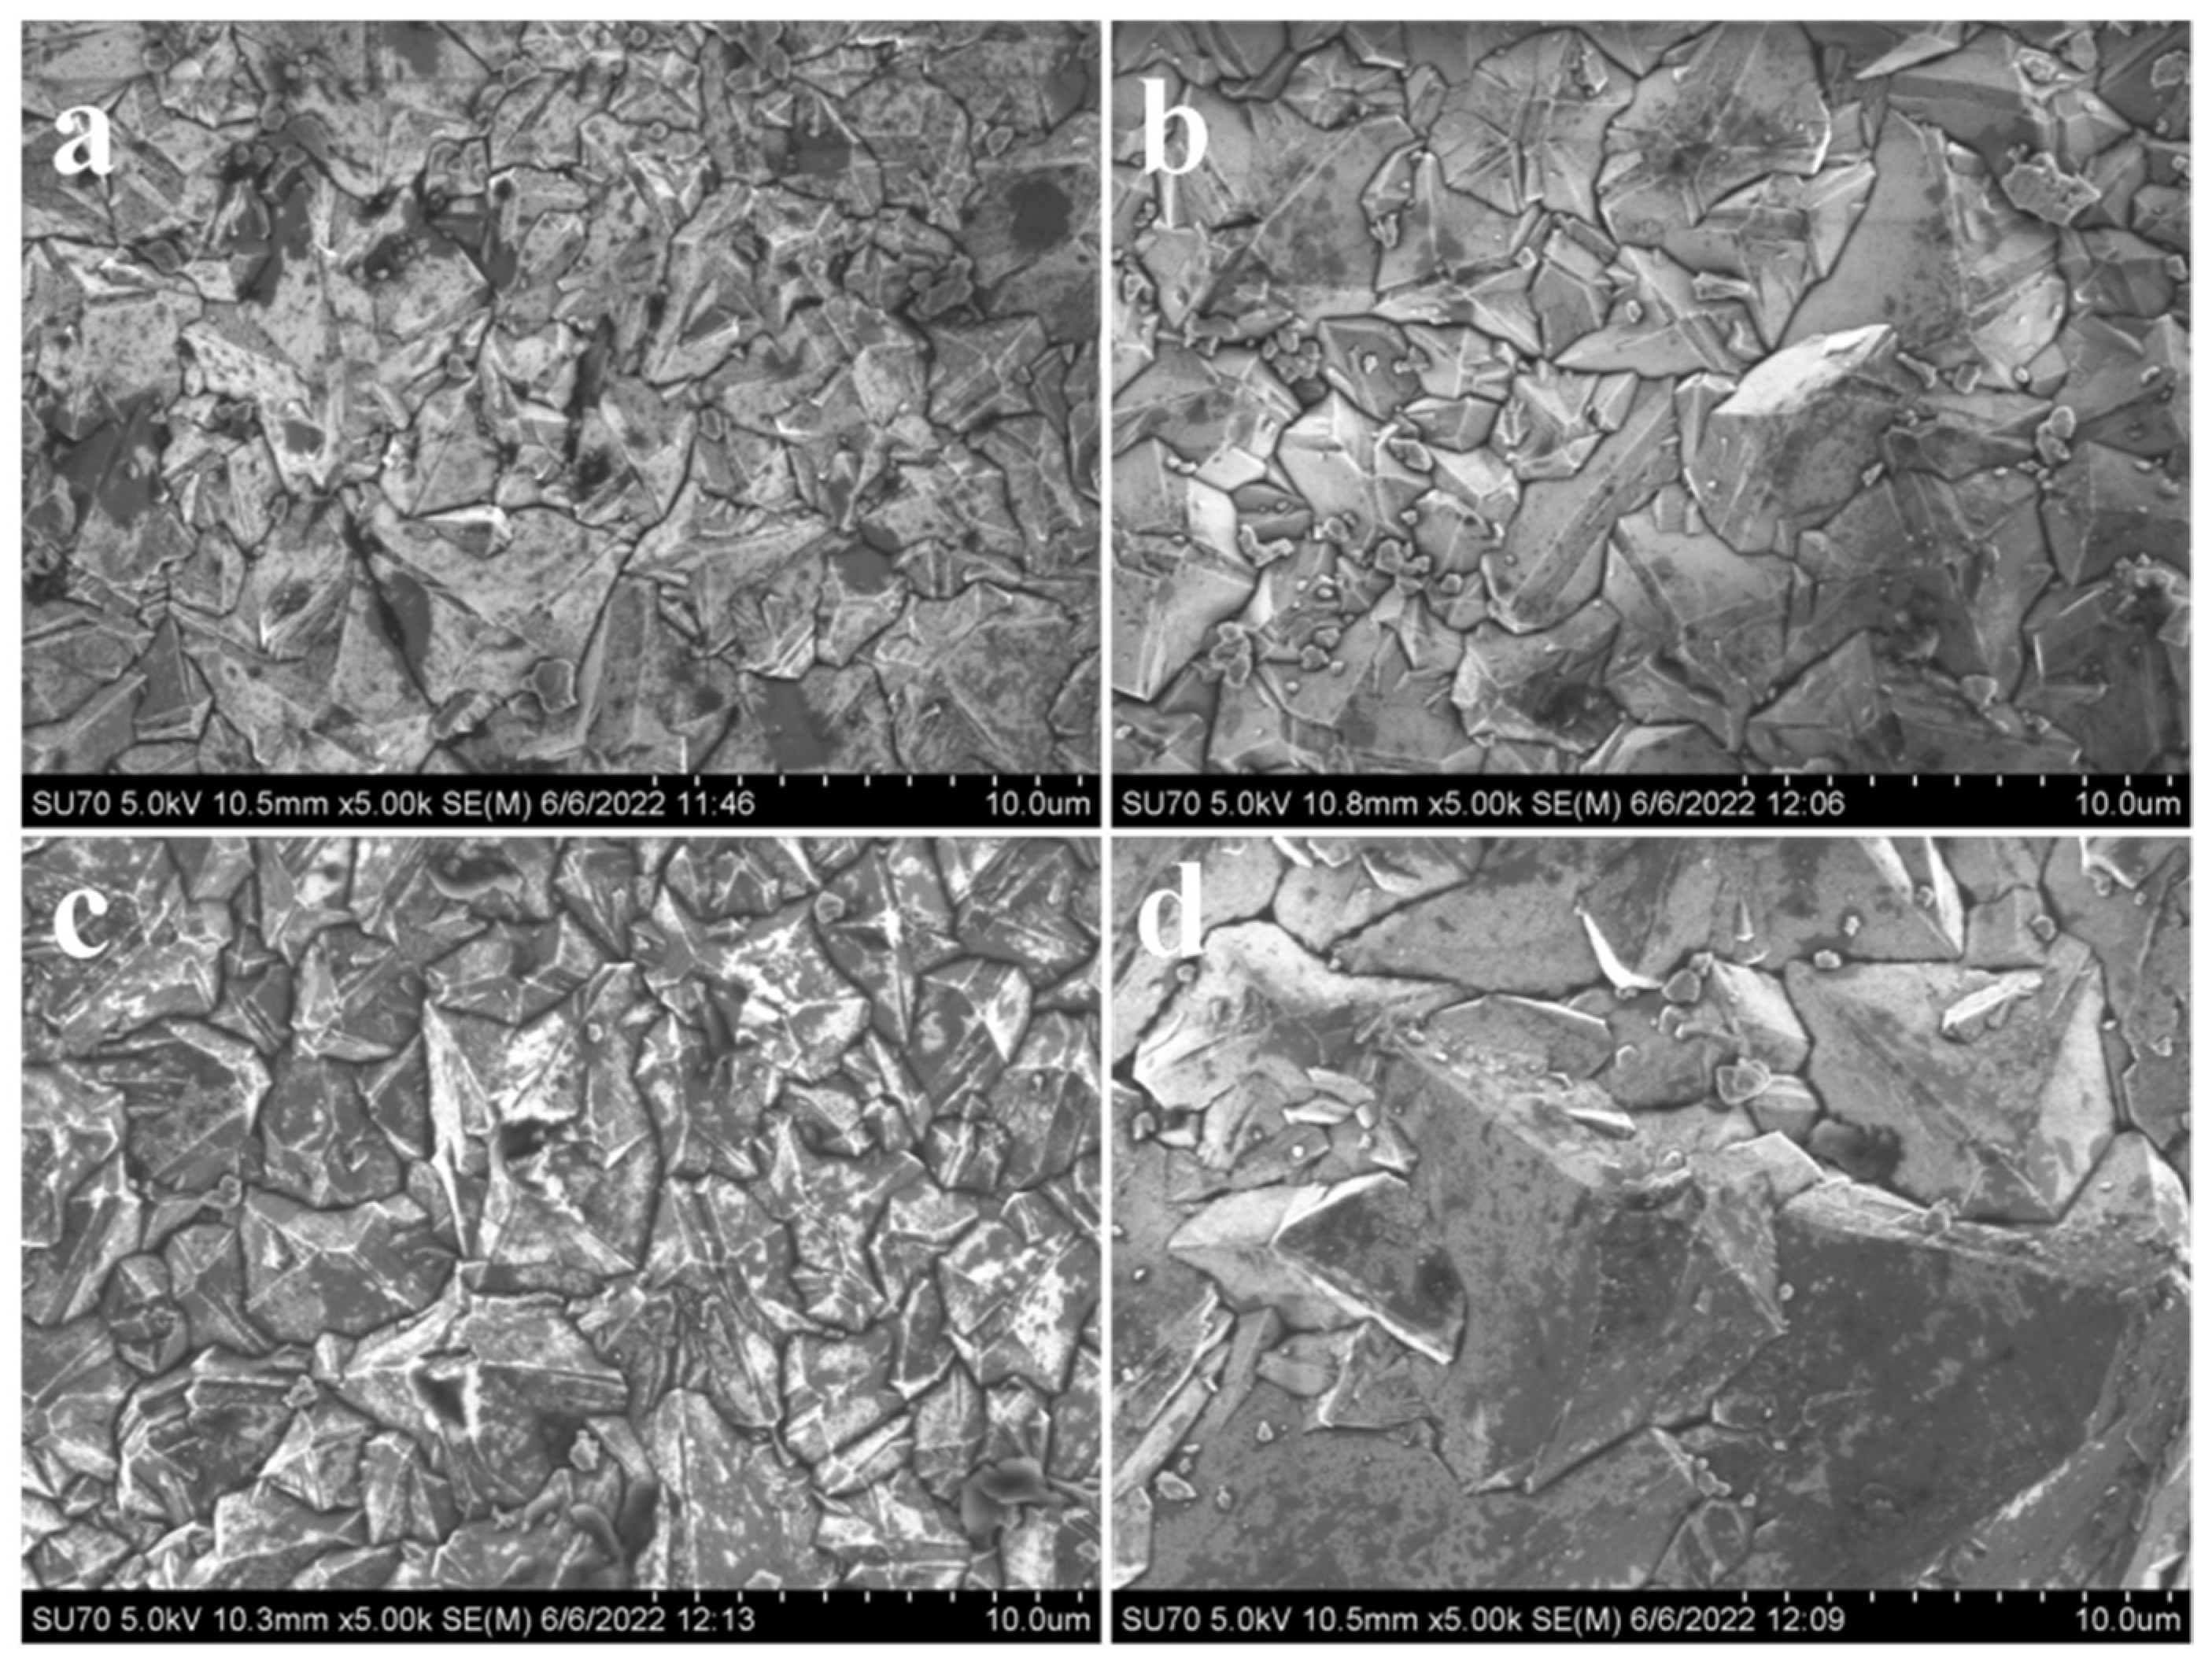
Figure 2 shows the scanning electron microscope (SEM) images of different samples. By observing these images, it can be found that as the methane concentration decreases, the grain size of the film significantly increases. When the methane concentration is low, the concentration of active H atoms is high, which has a good etching effect on sp
2 graphite carbon, easily causing the CH
3-methyl group to dehydrogenate and form a diamond structure with sp
3 bonds [
13]. As a result, the grain facets are clear and the edges are distinct. The morphology of the diamond film with high methane concentration shows a relatively smooth surface (
Figure 2a), while when the concentration decreases, the surface smoothness also decreases (
Figure 2b). The roughness of the observed patterns varies with different methane concentrations. The higher the methane concentration, the lower the roughness. When the methane concentration decreases from 2.5% to 1.5%, the grain sizes of Samples 1#, 2#, and 3# change slightly, to approximately 5 µm. When the methane concentration drops to 1%, the grain size of Sample 4# significantly increases, reaching approximately 10 µm.
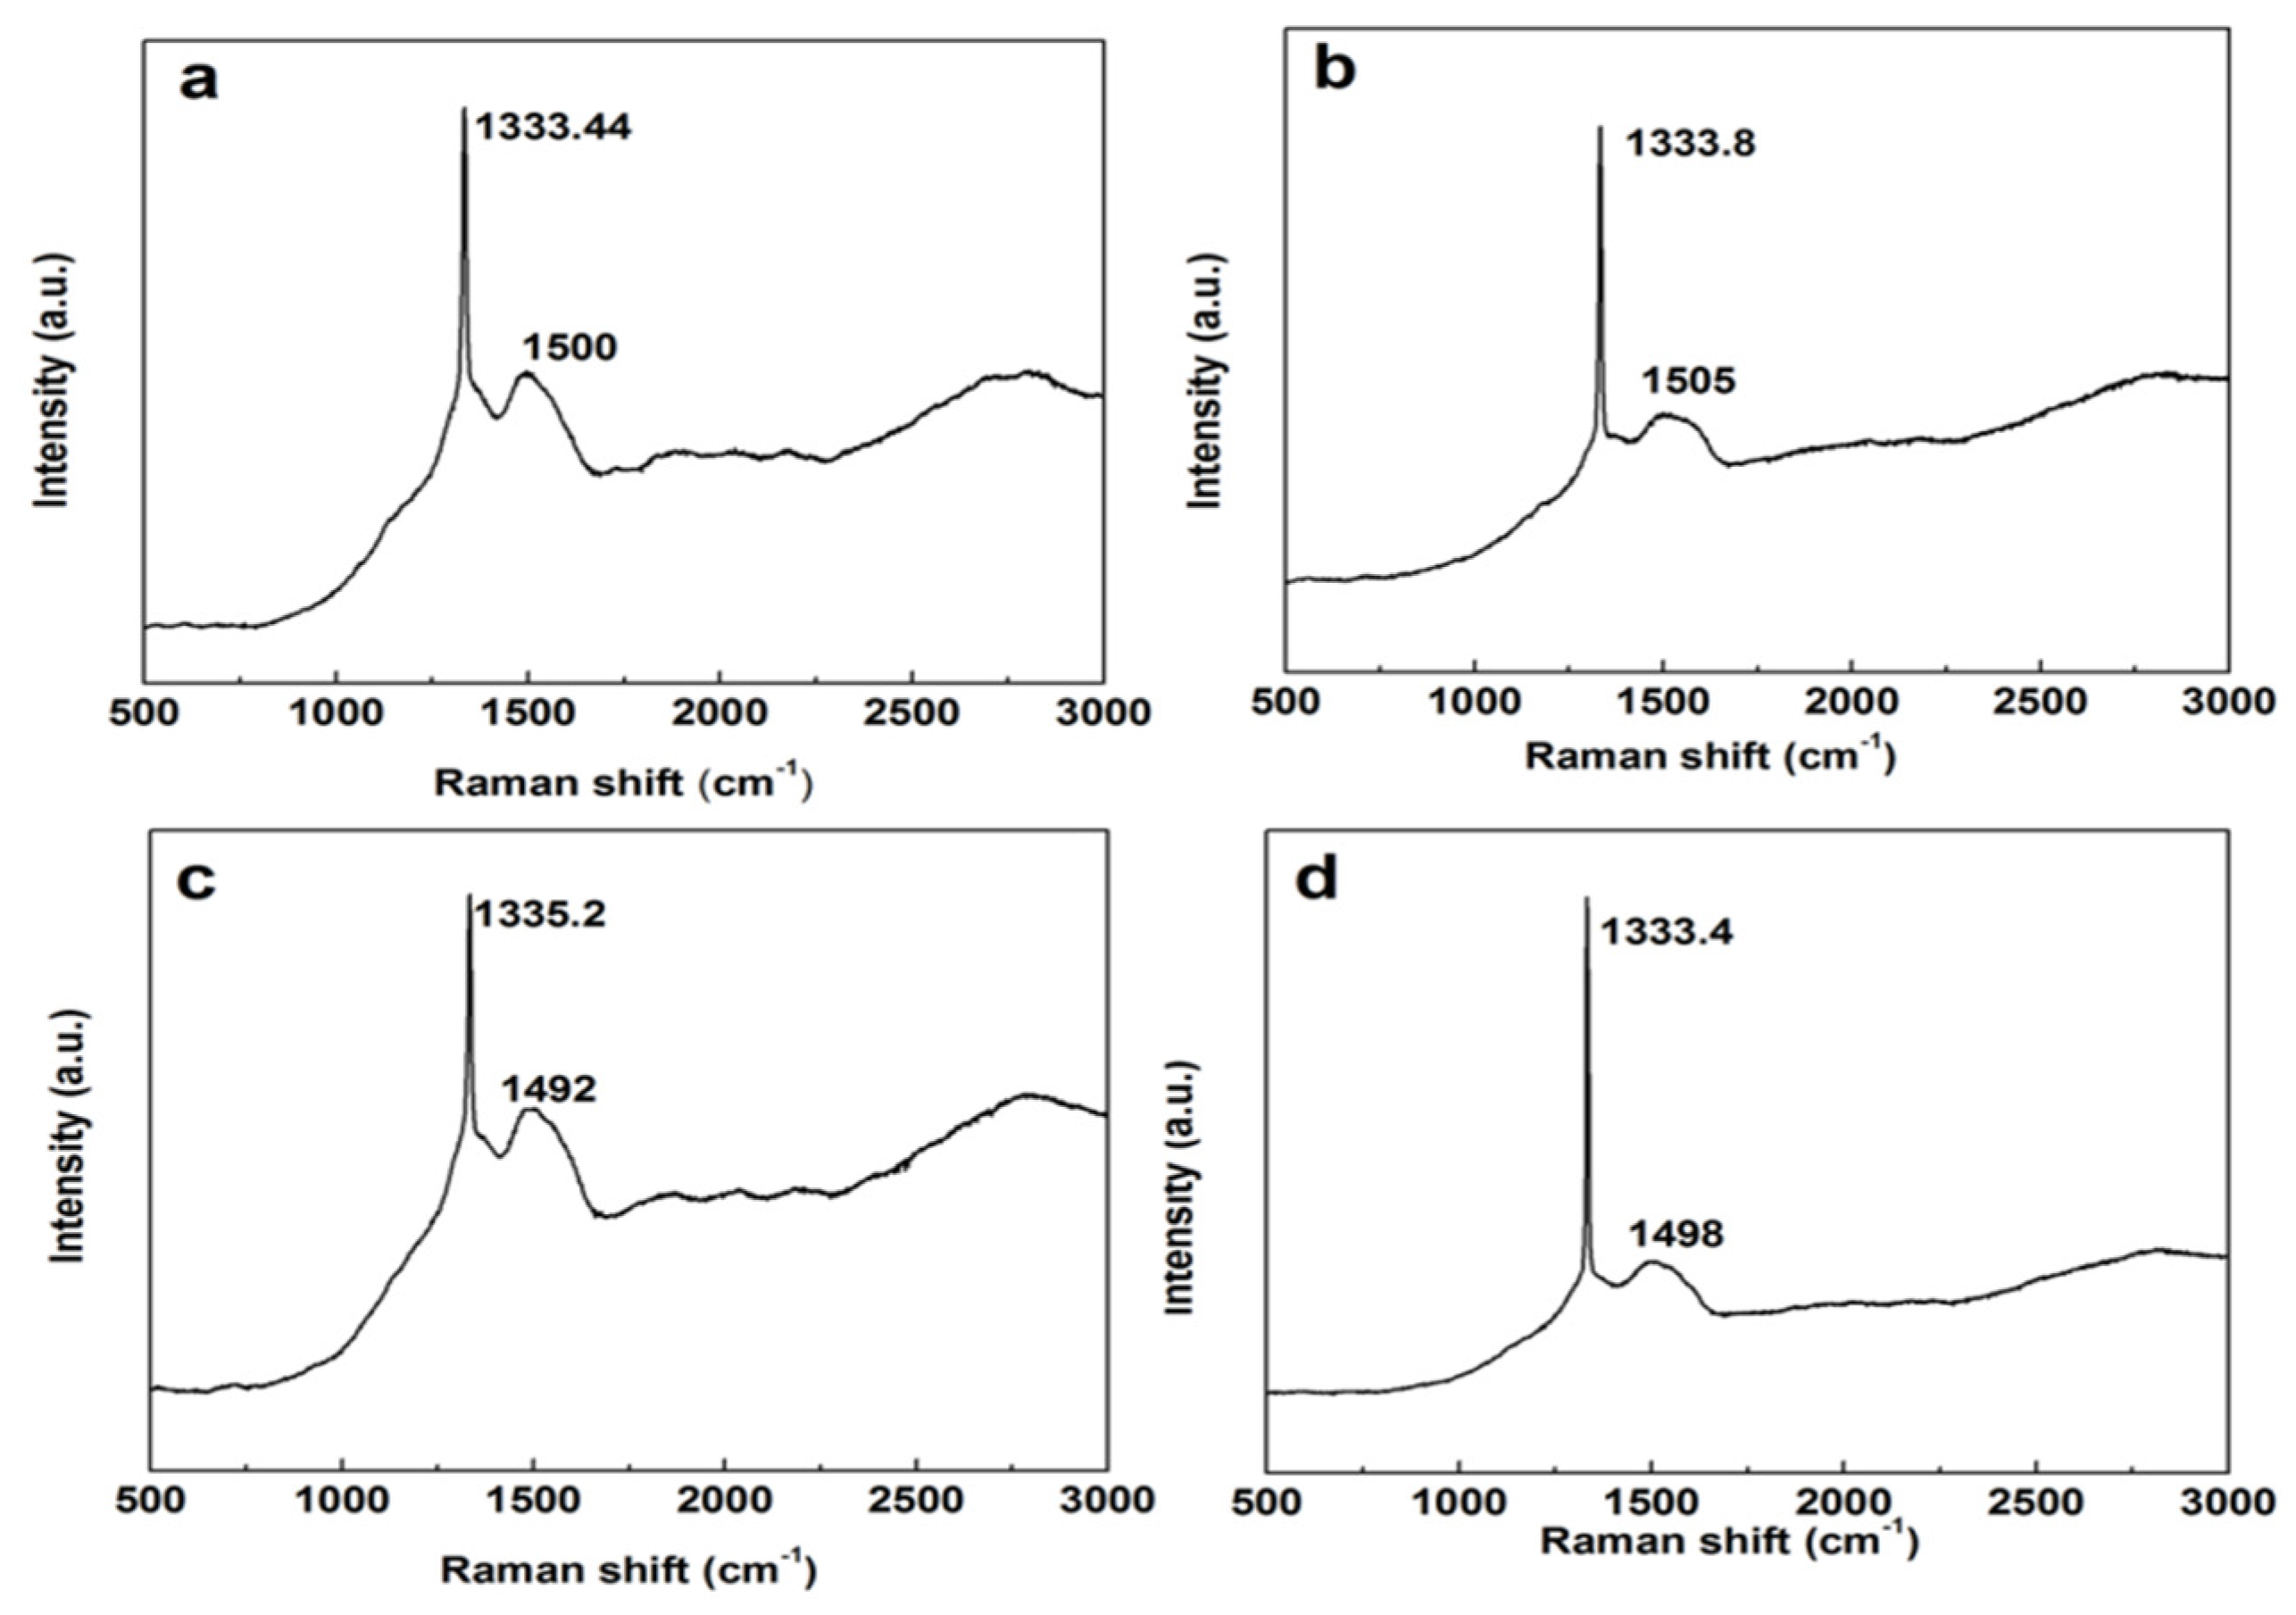
Figure 3 presents the Raman spectra of different samples. There are mainly three forms of carbon atoms on the diamond surface. The first form consists of a diamond structure with sp
3 carbon bonds, manifested as a characteristic peak around 1332 cm
−1. A broad peak envelope observed in the range of 1450–1550 cm
−1 is attributed to the vibrational modes of disordered carbon at grain boundaries, which indicates the presence of disordered carbon in the sample. Meanwhile, a distinct peak envelope at 2700 cm
−1 demonstrates the existence of a small amount of graphite [
14,
15,
16]. From
Figure 3, it can be observed that the Raman characteristic peak of the diamond film shifts towards a higher wavenumber. This is primarily due to the difference in thermal expansion coefficients between diamond and the silicon carbide substrate, resulting in compressive stress on the diamond film at room temperature. The magnitude of the residual stress can be determined according to the formula σ = −0.567 (ν − ν
0) GPa/cm
−1, where ν
0 = 1332 cm
−1 and ν is the measured Raman shift of diamonds with different coating structures [
17]. Therefore, the compressive stresses experienced by Samples 1#–4# are −0.816 GPa, −1.02 GPa, −1.81 GPa, and −0.79 GPa, respectively. Compared with other substrates such as tungsten carbide, tantalum, and niobium, the thermal stress is approximately half as small, indicating that diamond has more compatible lattice matching with silicon carbide.
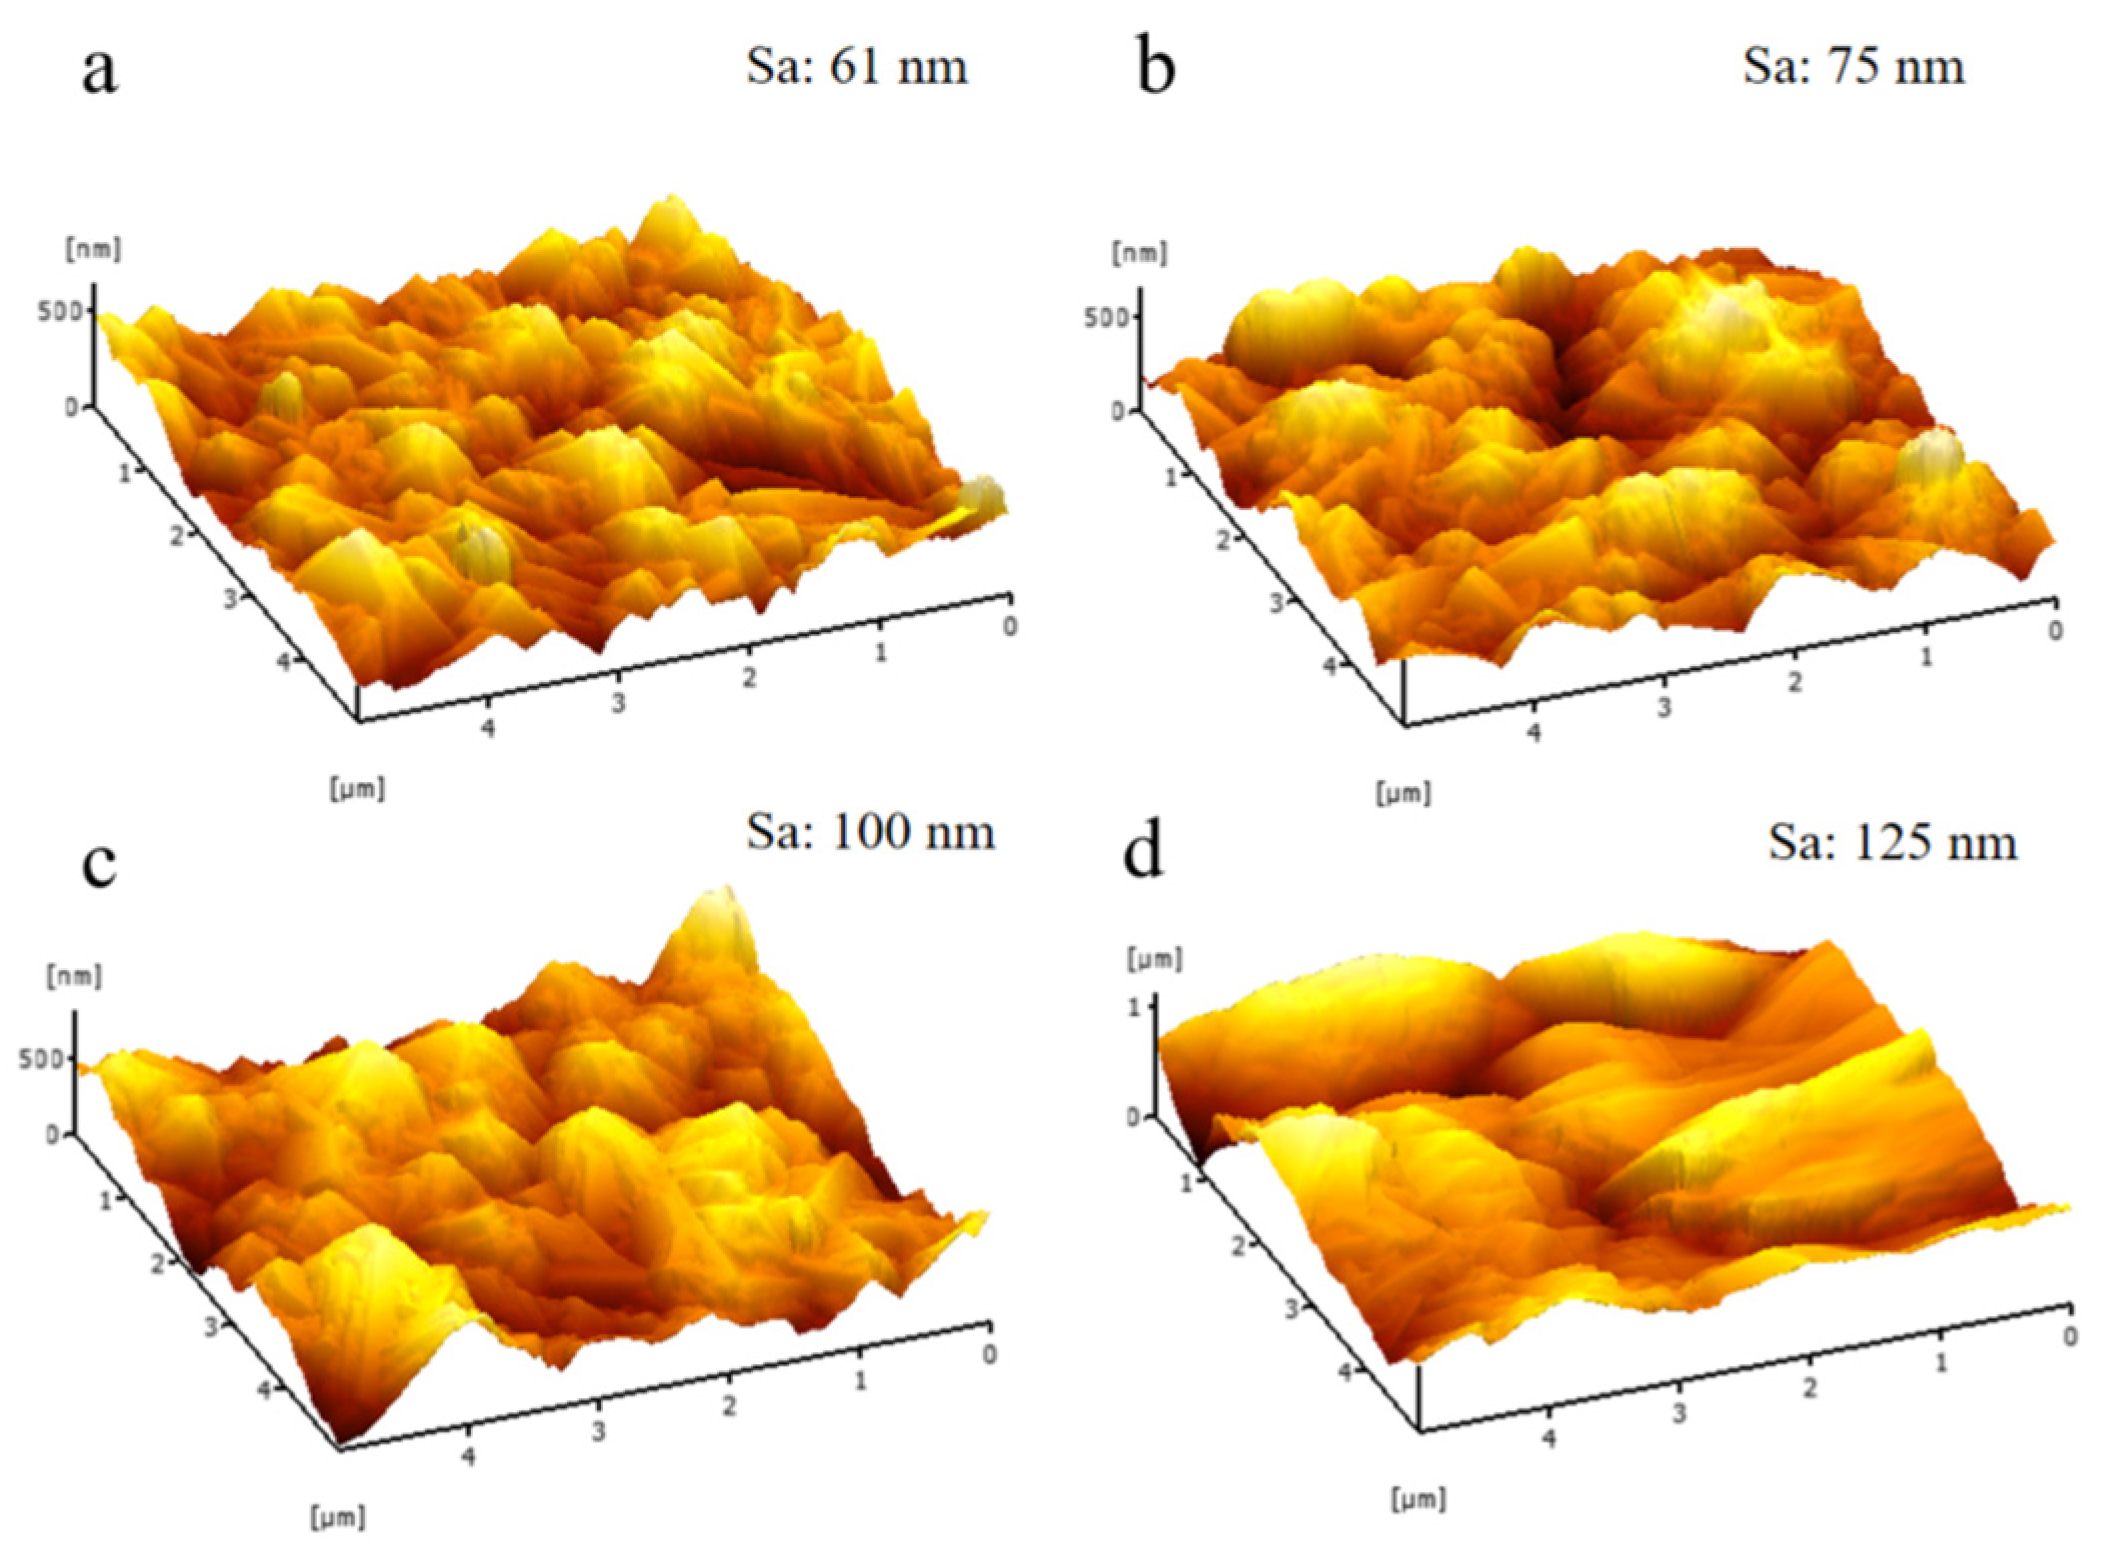
Using atomic force microscopy (AFM), the surface topography of four diamond films with varying roughness levels was quantitatively characterized. The areal roughness parameter Sa was determined to be 61 nm (Sample 1#), 75 nm (Sample 2#), 100 nm (Sample 3#), and 125 nm (Sample 4#), as illustrated in
Figure 4. The results indicate a clear trend of increasing surface roughness with decreasing methane concentration during deposition. This correlation is consistent with prior scanning electron microscopy (SEM) observations.
The Rockwell scratch tester is employed to quantitatively characterize the critical load of the coating. The initial load and the final load are set at 0 and 100 N, respectively. During the testing process, the scratch length is 3 mm, the loading time is 1 min, and the loading rate is 100 N/min [
18,
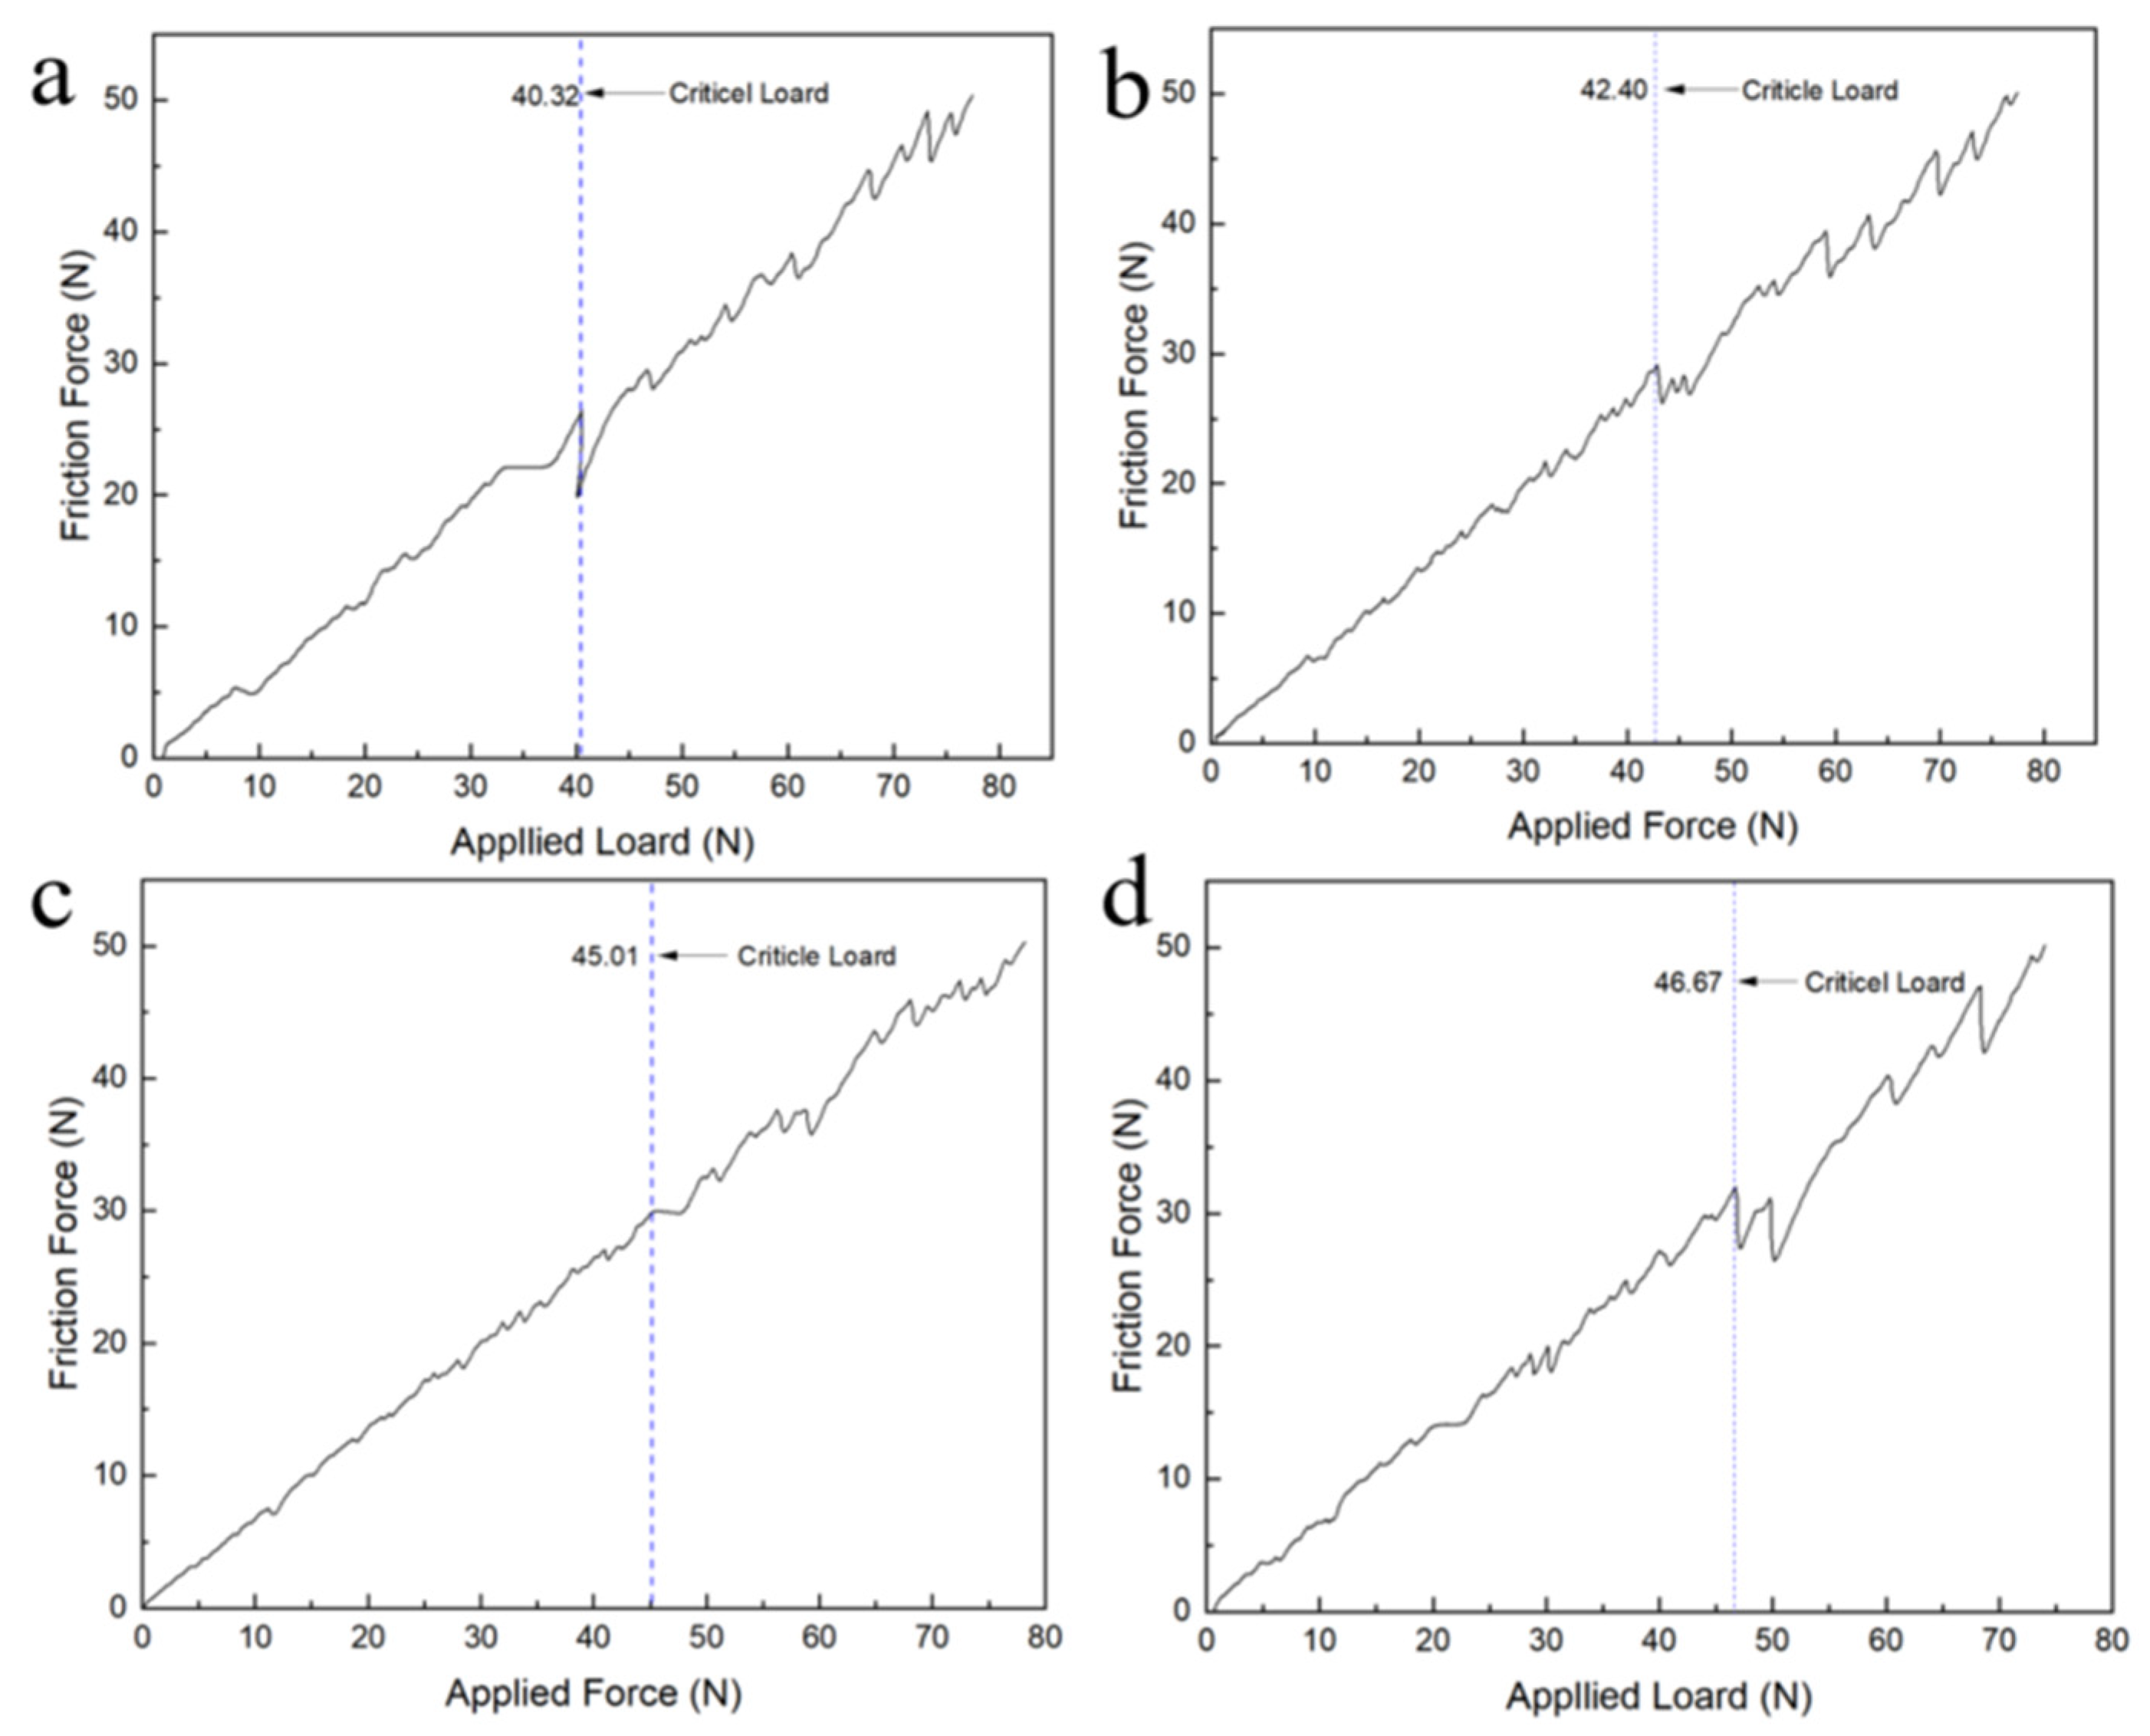
19]. The friction force signal is collected during the test, and the critical load of the coating is determined by the corresponding loading force when the friction force changes abruptly. As illustrated in
Figure 5, the measured critical loads for Samples #1 through #4 are 40.32 N, 42.40 N, 45.01 N, and 46.67 N, respectively. The consistently high adhesion strength observed across all specimens can be attributed to the favorable formation of Si–C covalent bonds between the diamond films and the silicon carbide substrate [
20,
21]. Furthermore, a positive correlation is noted between the critical load and the surface grain size of the films. This trend is likely due to the predominance of sp
3-hybridized carbon structures promoted under lower carbon-source conditions during the initial nucleation stage of diamond growth, which effectively suppresses sp
2 formation and enhances covalent bonding at the film–substrate interface.
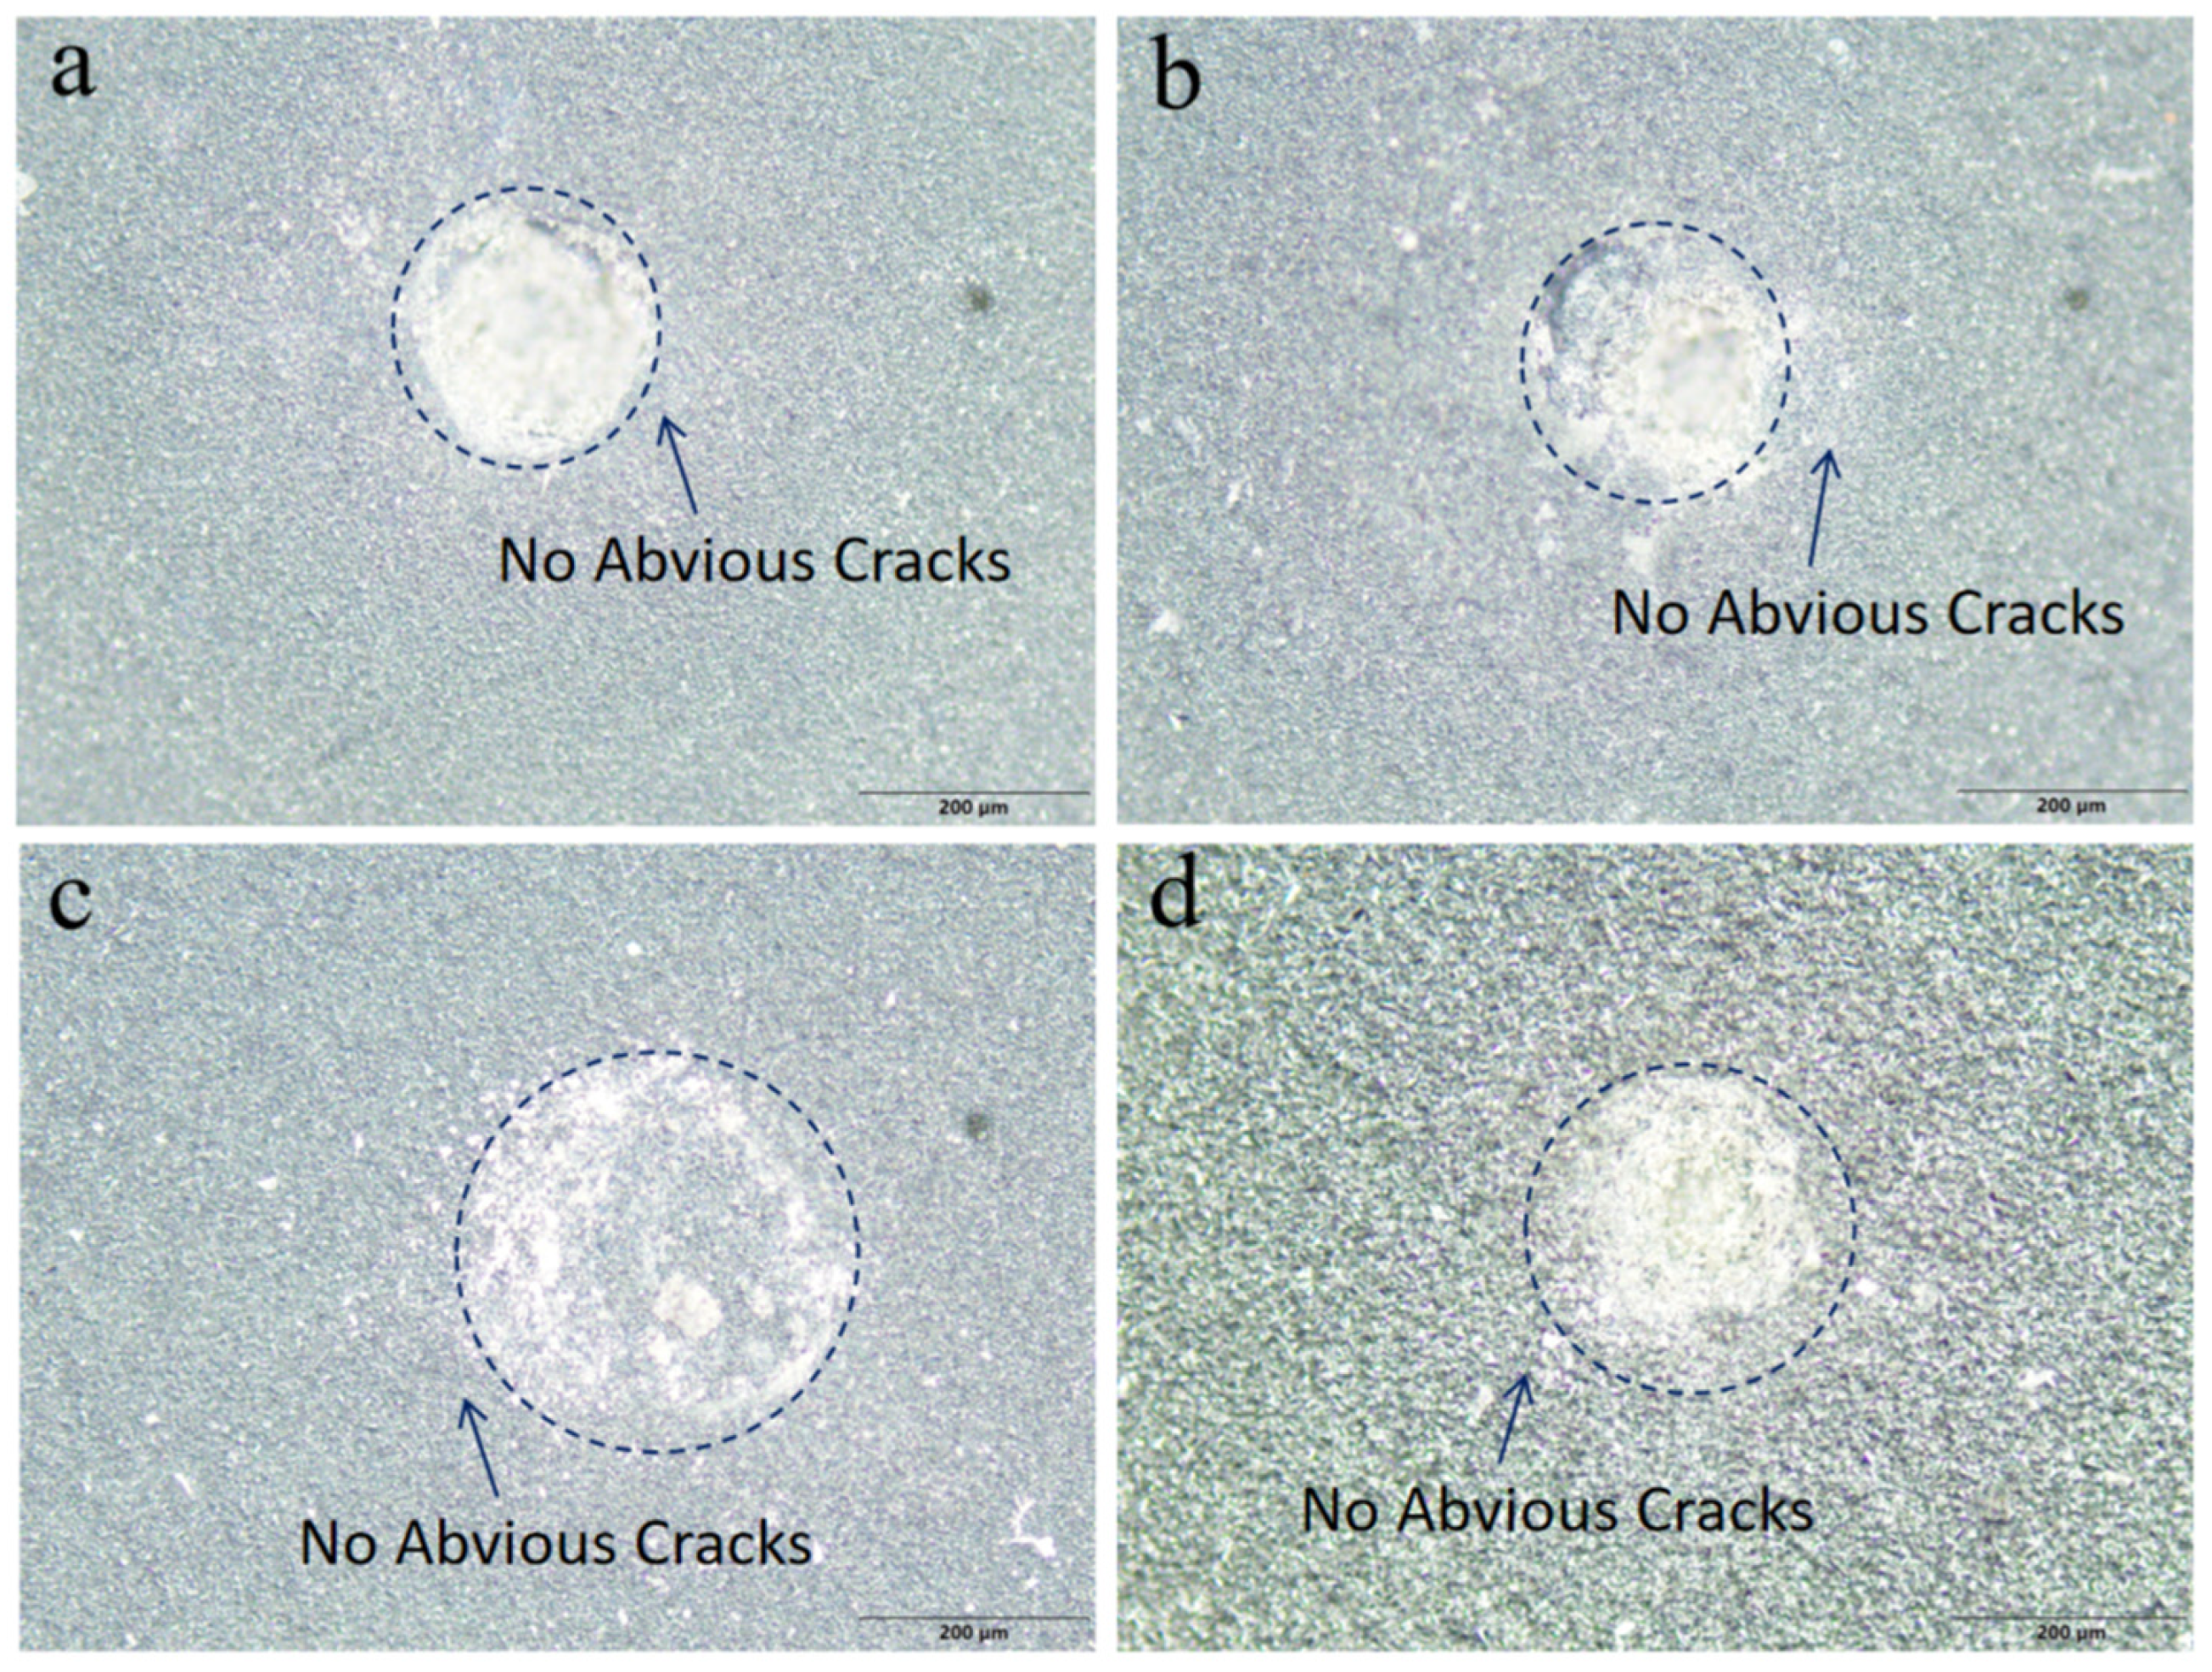
To intuitively evaluate the bonding strength between the diamond film and the silicon carbide substrate, the Rockwell indentation test was performed under a load of 100 kgf, with the crack morphology around the indentation observed and analyzed, as shown in
Figure 6. No cracks or extended delamination areas of the film were observed around the indentations of all samples under the applied load of 100 kgf. Consistent with the results of the scratch test, a robust interface was formed between the diamond film and the silicon carbide substrate, which lays a solid foundation for subsequent friction and wear tests.
Based on the above analyses, we obtained four types of diamond film samples with progressively increasing roughness, which exhibit high bonding strength. To further investigate the friction and wear properties corresponding to different roughness levels, systematic analyses were conducted on the friction coefficient and wear rate of zirconia grinding balls.
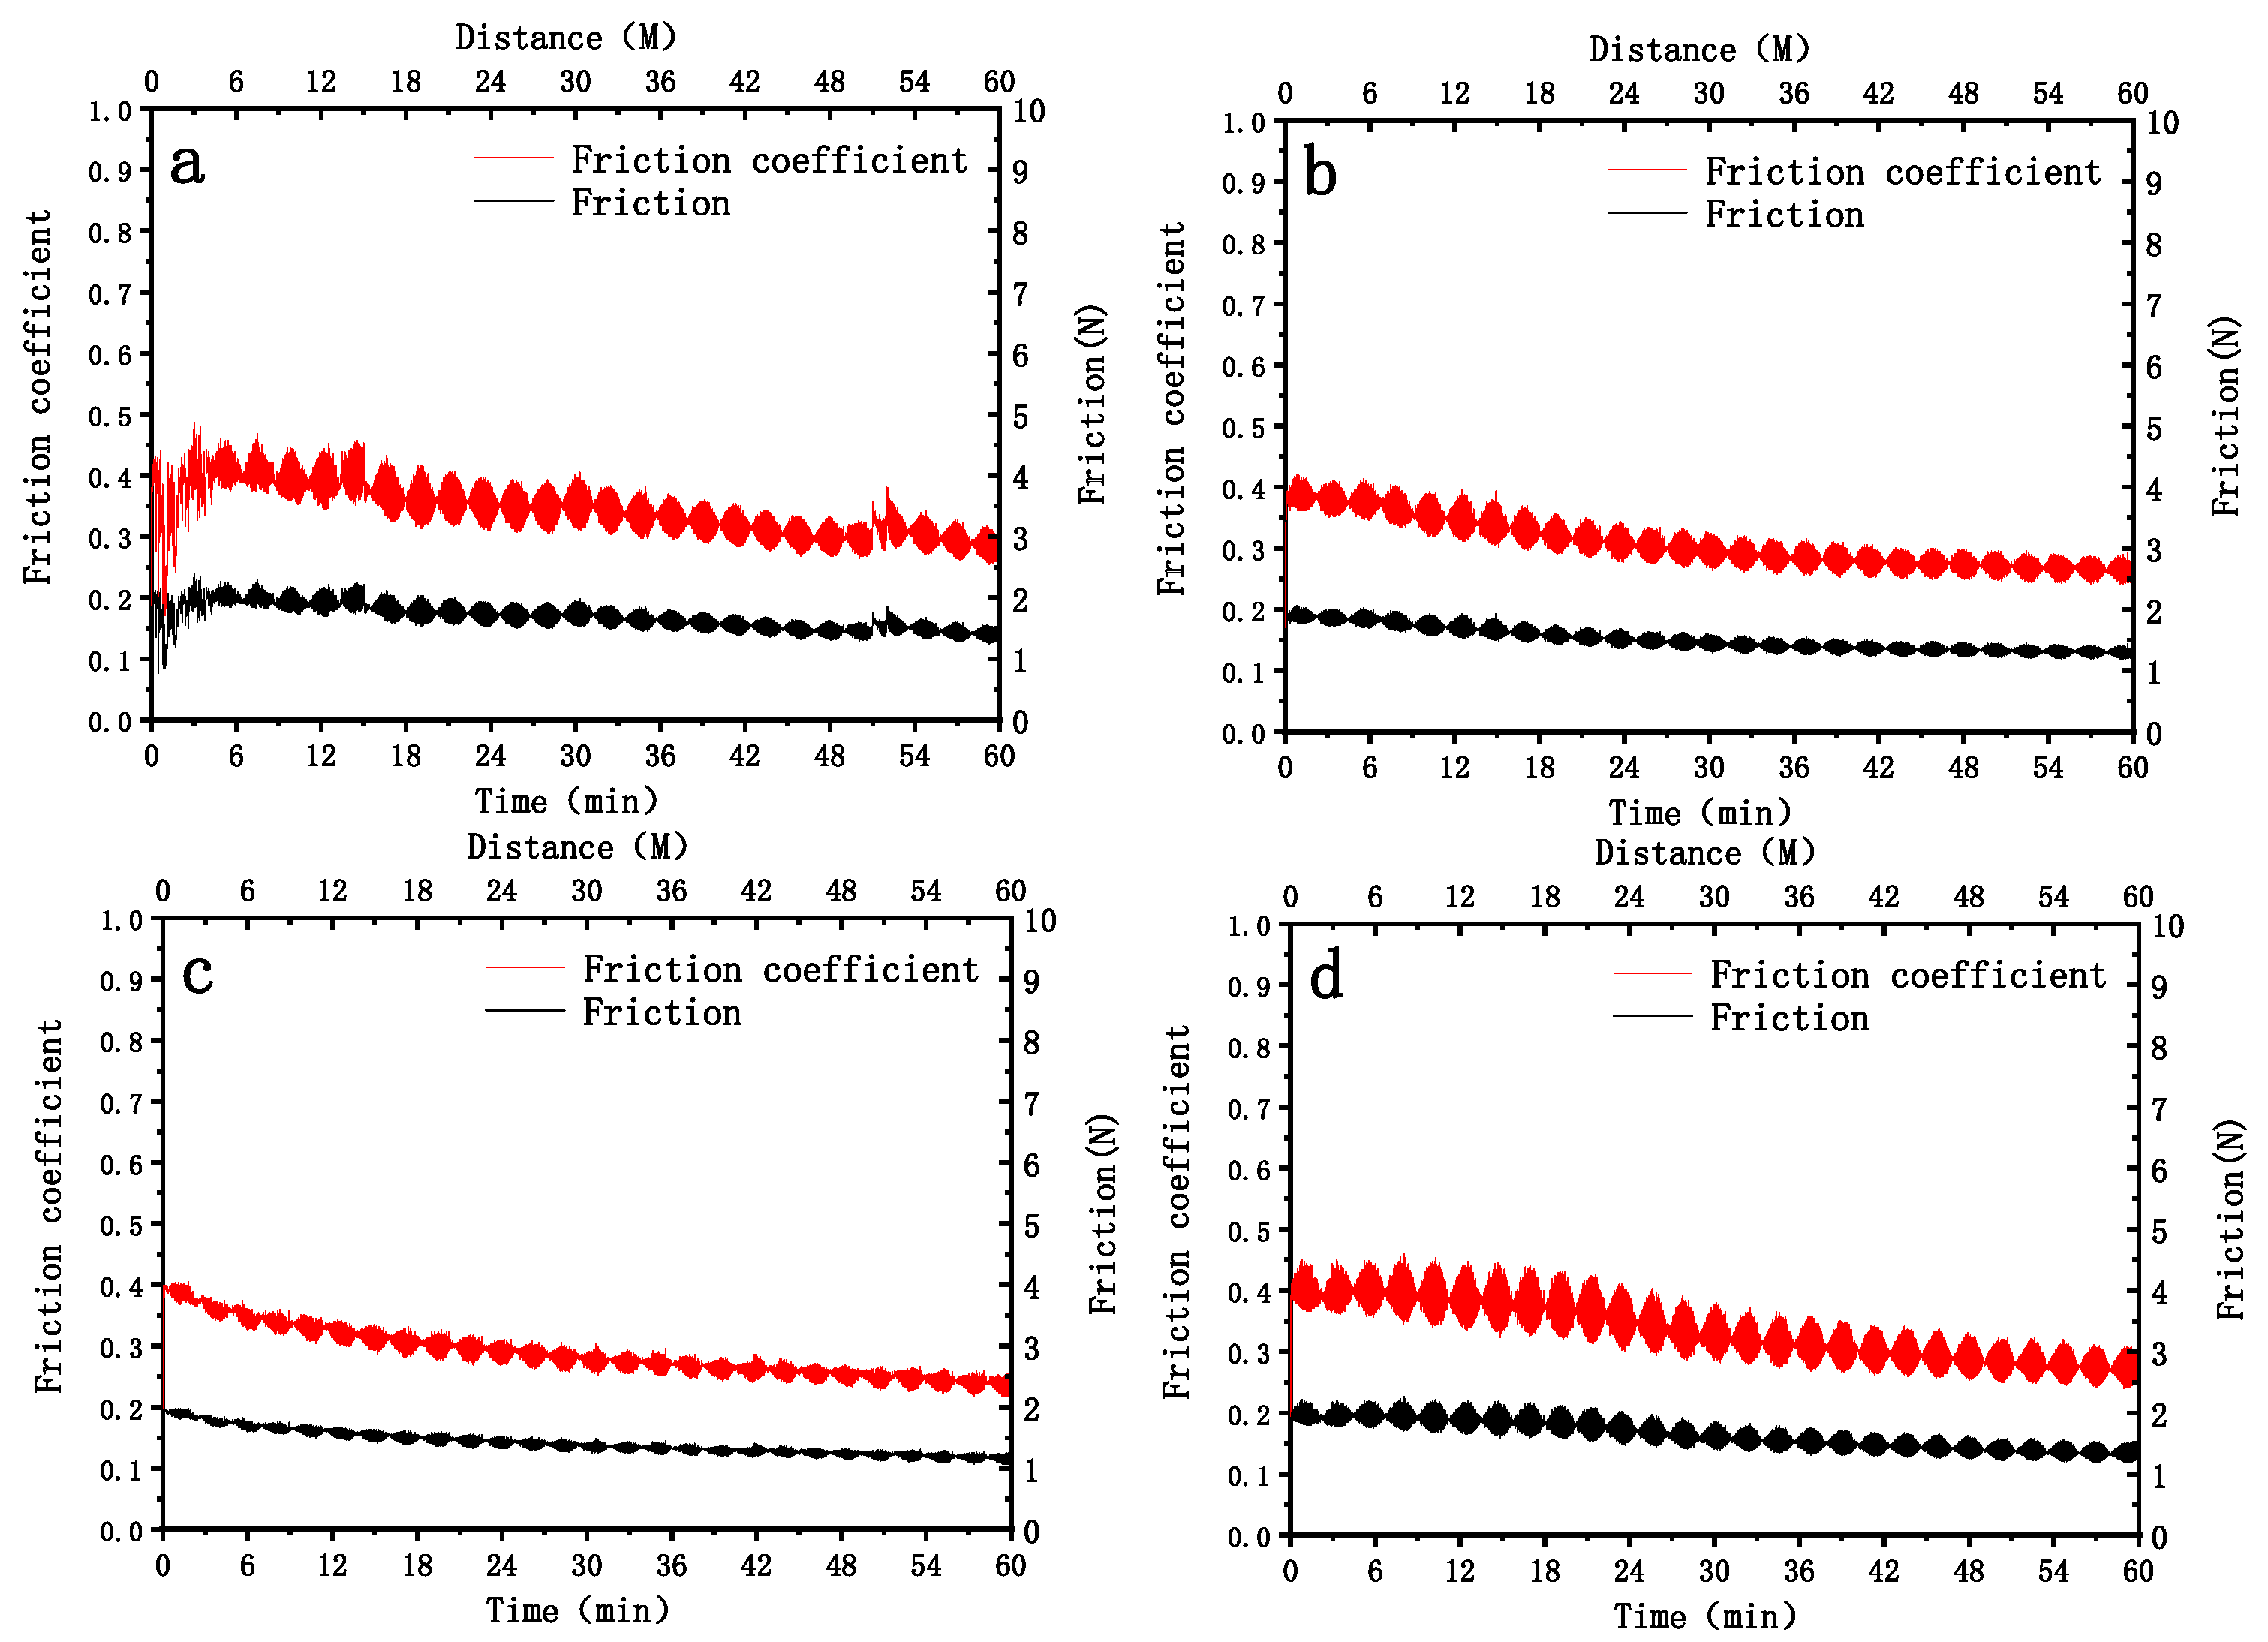
Figure 7 shows the friction coefficient and friction force variation curves of four groups of samples under a constant underwater load of 500 g. The data reveal significant quantitative differences in the friction responses among the groups, reflecting the heterogeneity of interfacial friction behaviors. According to the graph data, the friction coefficient of Sample 1# rapidly rises to approximately 0.4 within the initial 5 min and then enters a stable fluctuation stage, with the fluctuation range controlled between 0.3 and 0.4. For Sample 2#, the friction coefficient quickly converges to 0.35, and the overall fluctuation amplitude is less than 0.03, exhibiting the optimal interfacial stability among the four groups. Sample 3# presents an obvious decreasing trend in the friction coefficient, gradually dropping from an initial value of 0.4 to a stable value of 0.3 with a decreasing rate of about 0.02 per minute. Sample 4# shows the most intense fluctuation in the friction coefficient, with a range of 0.3 to 0.5 and a difference of 0.2 between the peak and valley values, and there is no obvious stable stage, indicating an extremely unstable interfacial friction state. The underwater wet environment maintains the friction coefficients of all samples within the range of 0.2 to 0.5, which is significantly lower than that in the dry environment (usually >0.5), confirming the fluid lubrication effect of the aqueous medium.
The quantitative differences in friction performance among the groups essentially stem from the variations in material surface properties and underwater interfacial interaction mechanisms, providing key data support for the design of underwater wear-resistant materials. From the perspective of quantitative indicators, taking friction coefficient stability and fluctuation amplitude as the core evaluation criteria, the performance ranking of the four groups of samples is Sample 2# > Sample 1# > Sample 3# > Sample 4#. The low-fluctuation characteristic of Sample 2# is attributed to its excellent underwater wettability and surface homogeneity, which can form a continuous and stable water film lubrication layer to avoid sudden changes in local friction states. The decreasing friction coefficient behavior of Sample 3# corresponds to the underwater interfacial running-in process; after the wear of surface asperities, the contact area is optimized, and the mixed composite lubrication film formed by wear debris and water gradually enhances the friction-reducing effect, with its final stable value of 0.3 demonstrating potential late-stage friction-reducing advantages. The root cause of the intense fluctuation of Sample 4# lies in the heterogeneity of surface wettability, which leads to frequent rupture and reconstruction of the water film, alternating local dry friction and fluid lubrication states, and triggering sudden changes in the friction coefficient. This data suggests that such materials need to improve the uniformity of wettability through surface modification to avoid interfacial failure risks (
Table 2).
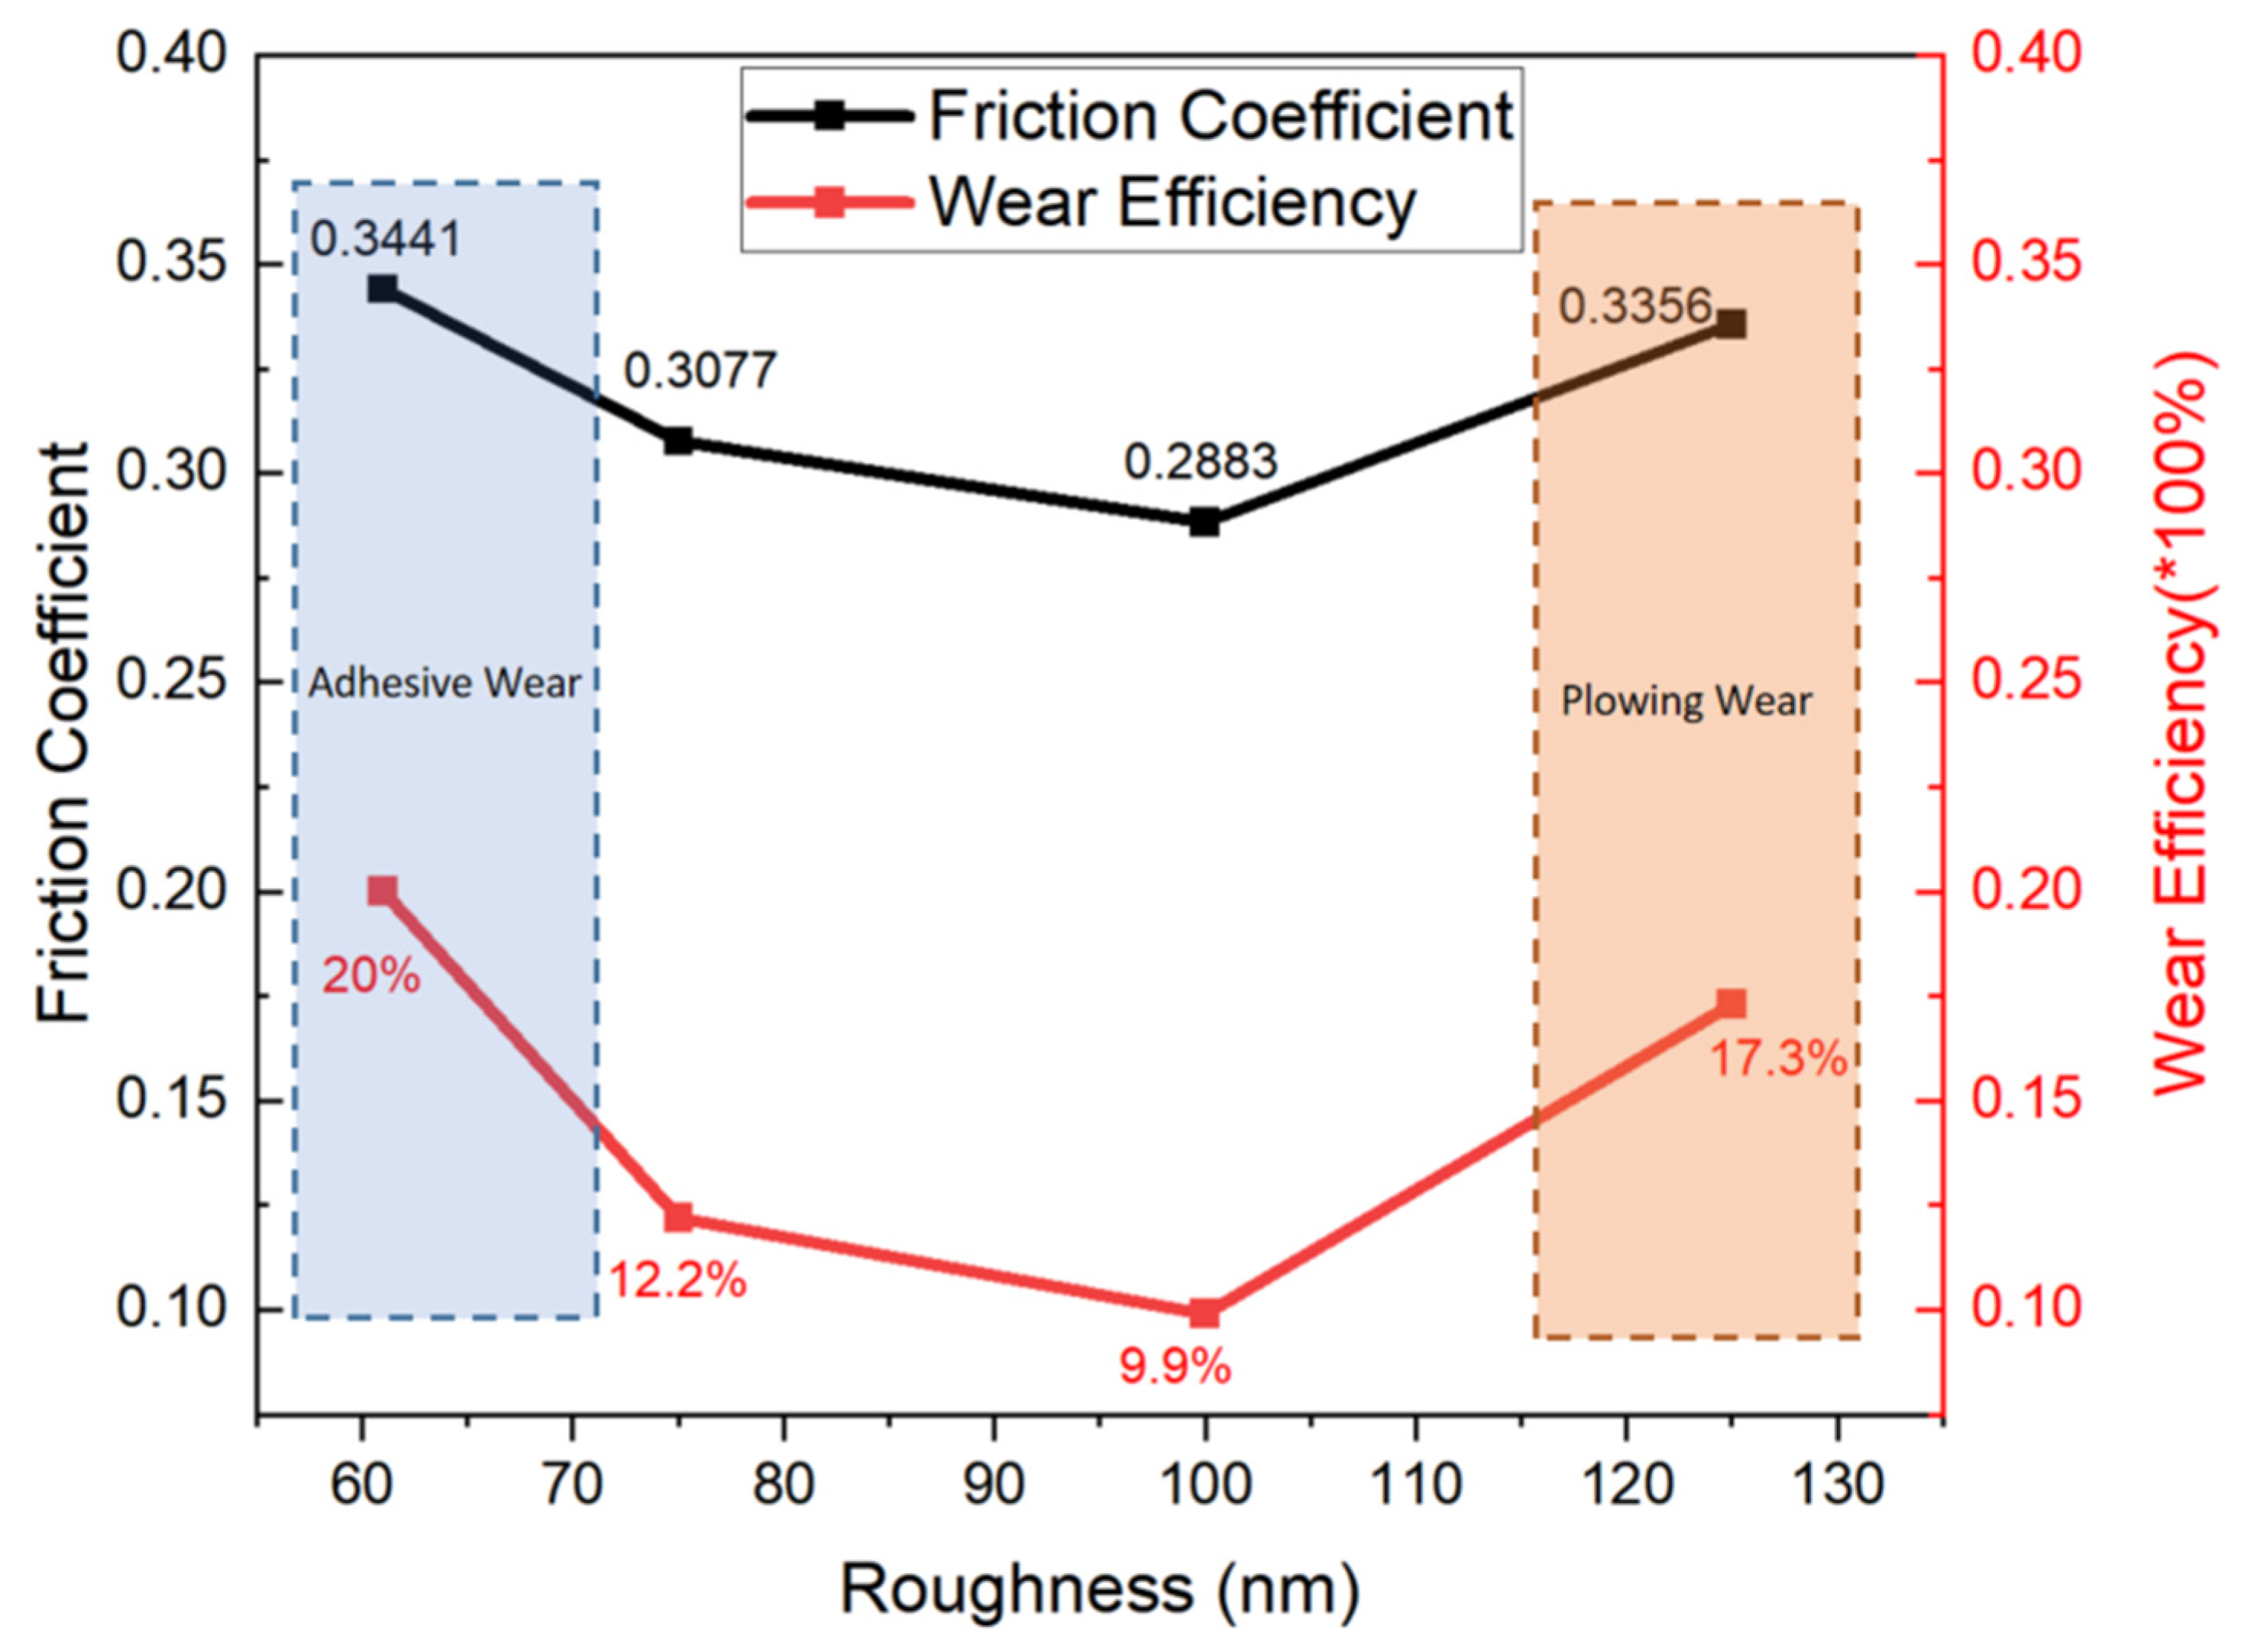
In the application scenario of CMP dressers, maximizing the removal rate of zirconia grinding balls is the core demand. As shown in the experimental chart (
Figure 8), the diamond film with a roughness of 61 nm exhibits the optimal performance, corresponding to a grinding ball wear efficiency of 20%, which is significantly higher than that of samples with other roughness values—when the roughness increases to 100 nm, the wear efficiency drops to 9.9%, and it further rises to 17.3% as the roughness reaches 125 nm. Notably, this experimental phenomenon deviates from the traditional speculation that “wear efficiency increases with rising roughness”, presenting a distinct non-monotonic variation law. Meanwhile, the friction coefficient data in the chart also shows a completely consistent trend with the wear efficiency: it decreases from 0.3441 at 61 nm to 0.2883 at 100 nm, and then rebounds to 0.3356 at 125 nm, both following a “first decrease and then increase” characteristic.
Analysis of the correlated trends observed in this study offers valuable guidance for the parameter optimization of diamond films for CMP dressers. From the perspective of interface interaction mechanisms, under low roughness (61 nm), the diamond film surface roughness is smaller than the surface undulation scale of the zirconia grinding balls, which likely leads to the largest real contact area between the two interfaces. This is consistent with established theories that enhanced van der Waals forces and mechanical interlocking at the interface can promote adhesive wear. The zirconia grinding balls exhibit fatigue peeling during cyclic adhesion–detachment, which aligns with the highest wear efficiency of 20% observed in our experimental data, as reported in prior studies on similar contact systems.
When roughness increases to 100 nm, discrete micro-protrusions on the diamond surface may lead to a substantial reduction in the real contact area. Concurrently, under wet conditions, it is well-documented that zirconia particles can form a continuous hydrated lubricating layer with water molecules via hydrogen bonding, which would effectively block direct contact between diamond and grinding balls. This is supported by our observation that the friction coefficient reached a minimum of 0.2883, and the wear efficiency was the lowest at 9.9%, consistent with the lubrication behavior reported in the literature.
When roughness further increases to 125 nm, the conical micro-protrusions on the diamond surface are likely to penetrate the hydrated lubricating layer, resulting in intense mechanical interlocking and scraping with the zirconia ball surface. This transition to plowing wear is supported by our data showing a rebound in the friction coefficient to 0.3356 and an increase in wear efficiency to 17.3%, which remains lower than the peak value at 61 nm. This trend aligns with the established understanding of how surface protrusions disrupt lubrication layers in abrasive contact scenarios.
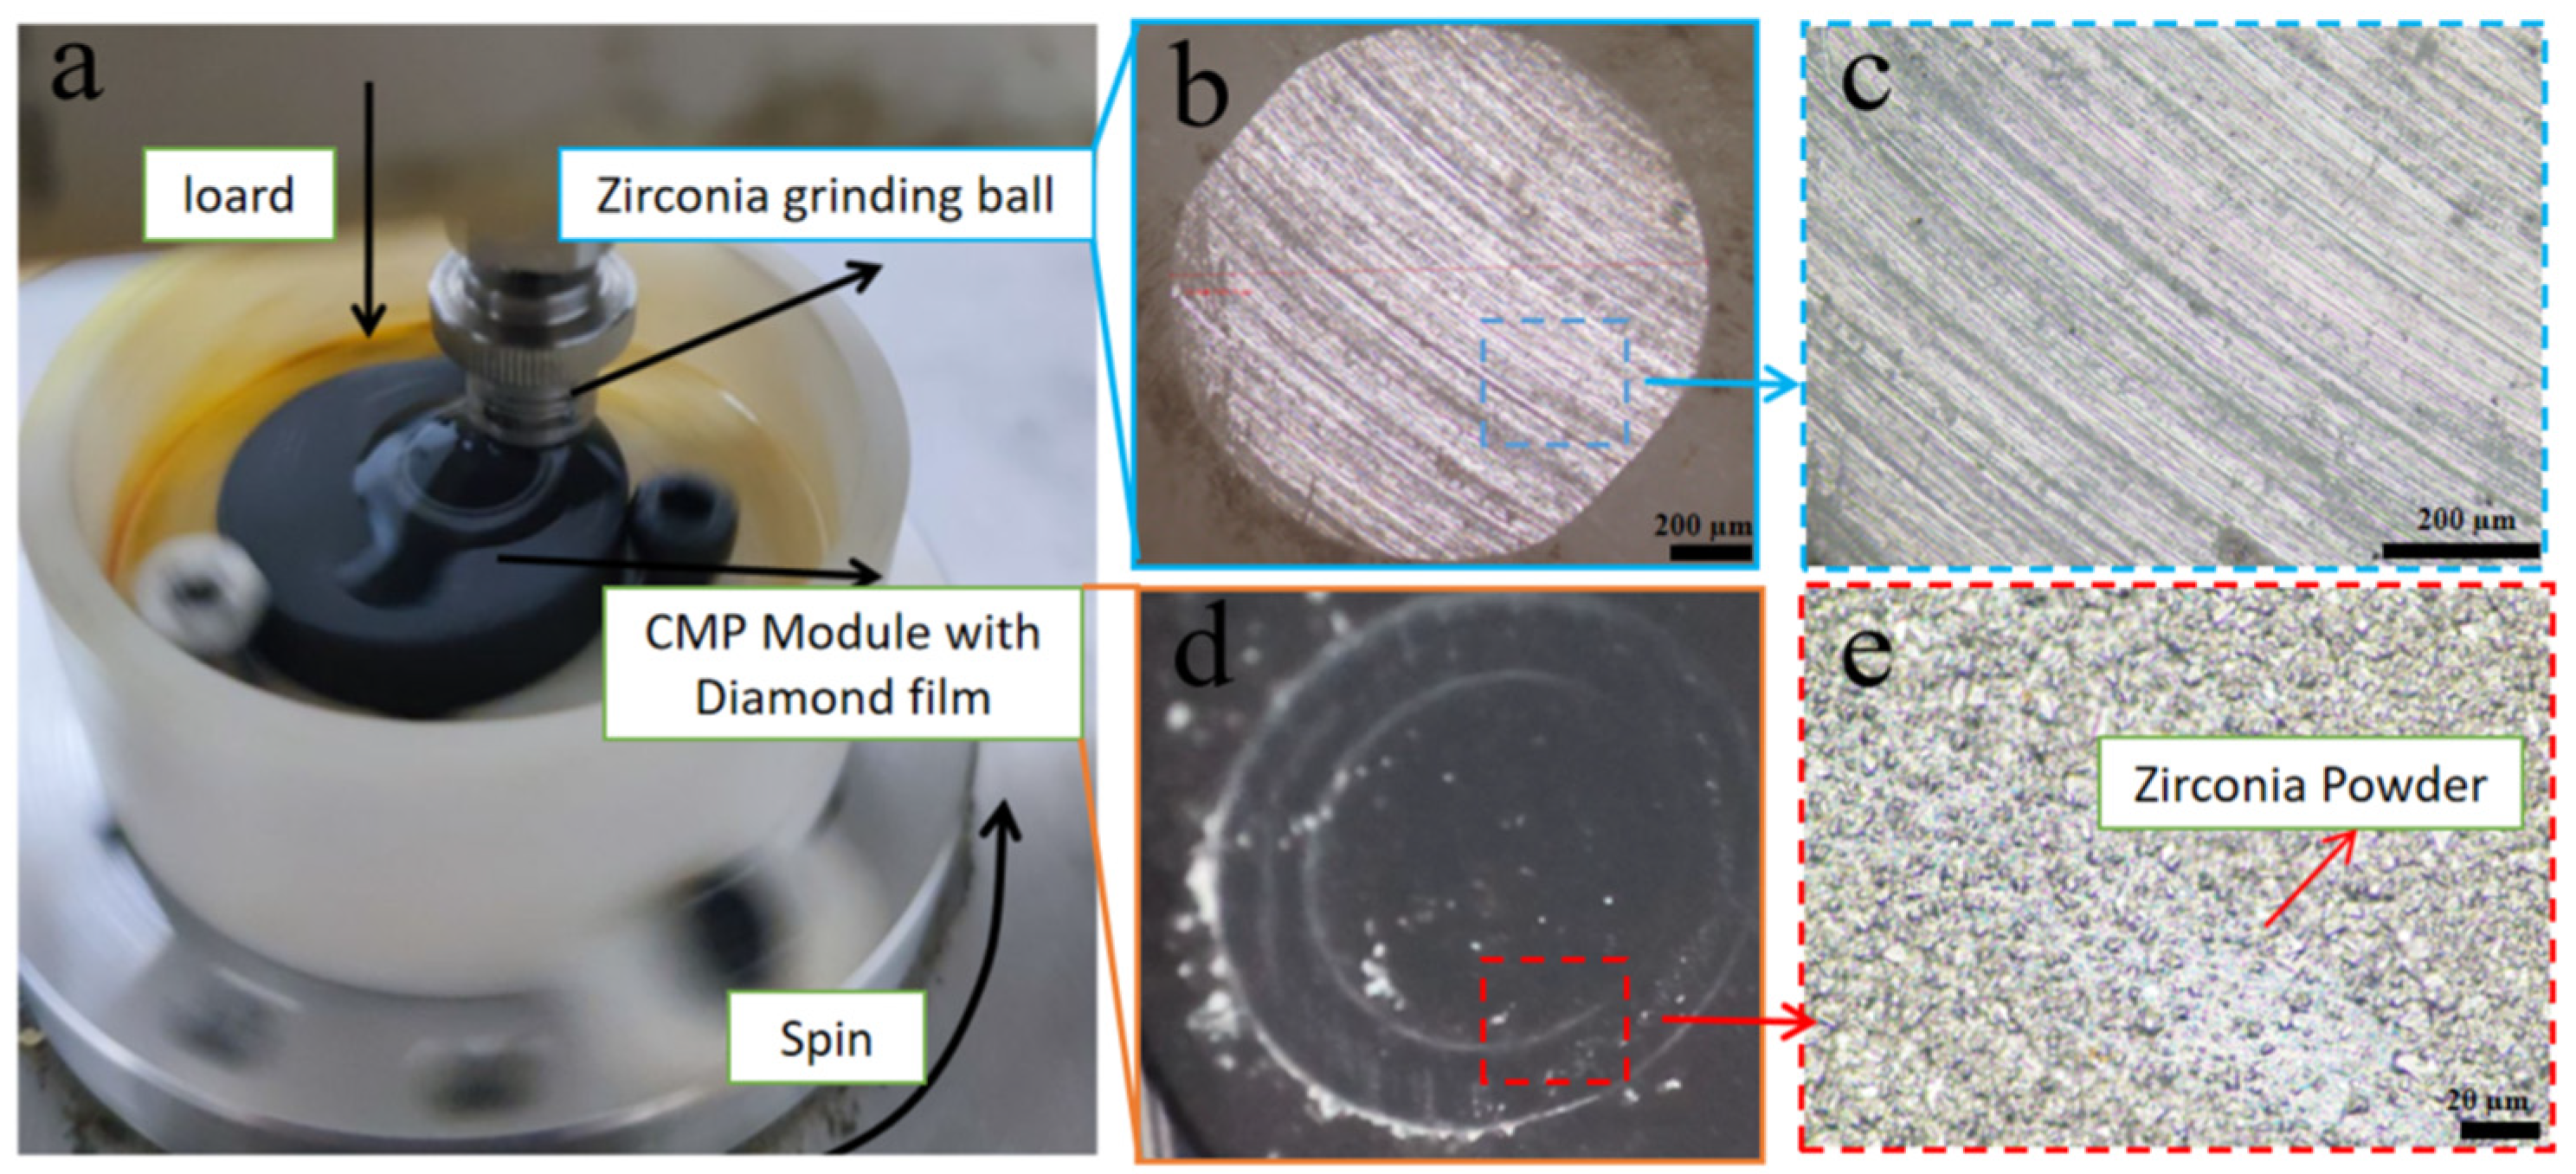
Figure 9 presents the surface morphologies of zirconia grinding balls and diamond films after friction.
Figure 9b,c show uniform scratches on the zirconia surface, while
Figure 9d,e reveal the accumulation of zirconia wear debris on the diamond film surface. It is precisely these scratches and wear debris accumulation that affect the friction behavior and wear rate.




 ,
,