
Influence of Fluorine Doping on Rutile TiO2 Nanostructures for Visible-Light-Driven Photocatalysis: A DFT + U Study


Abstract
1. Introduction
2. Computational Details
3. Results and Discussion
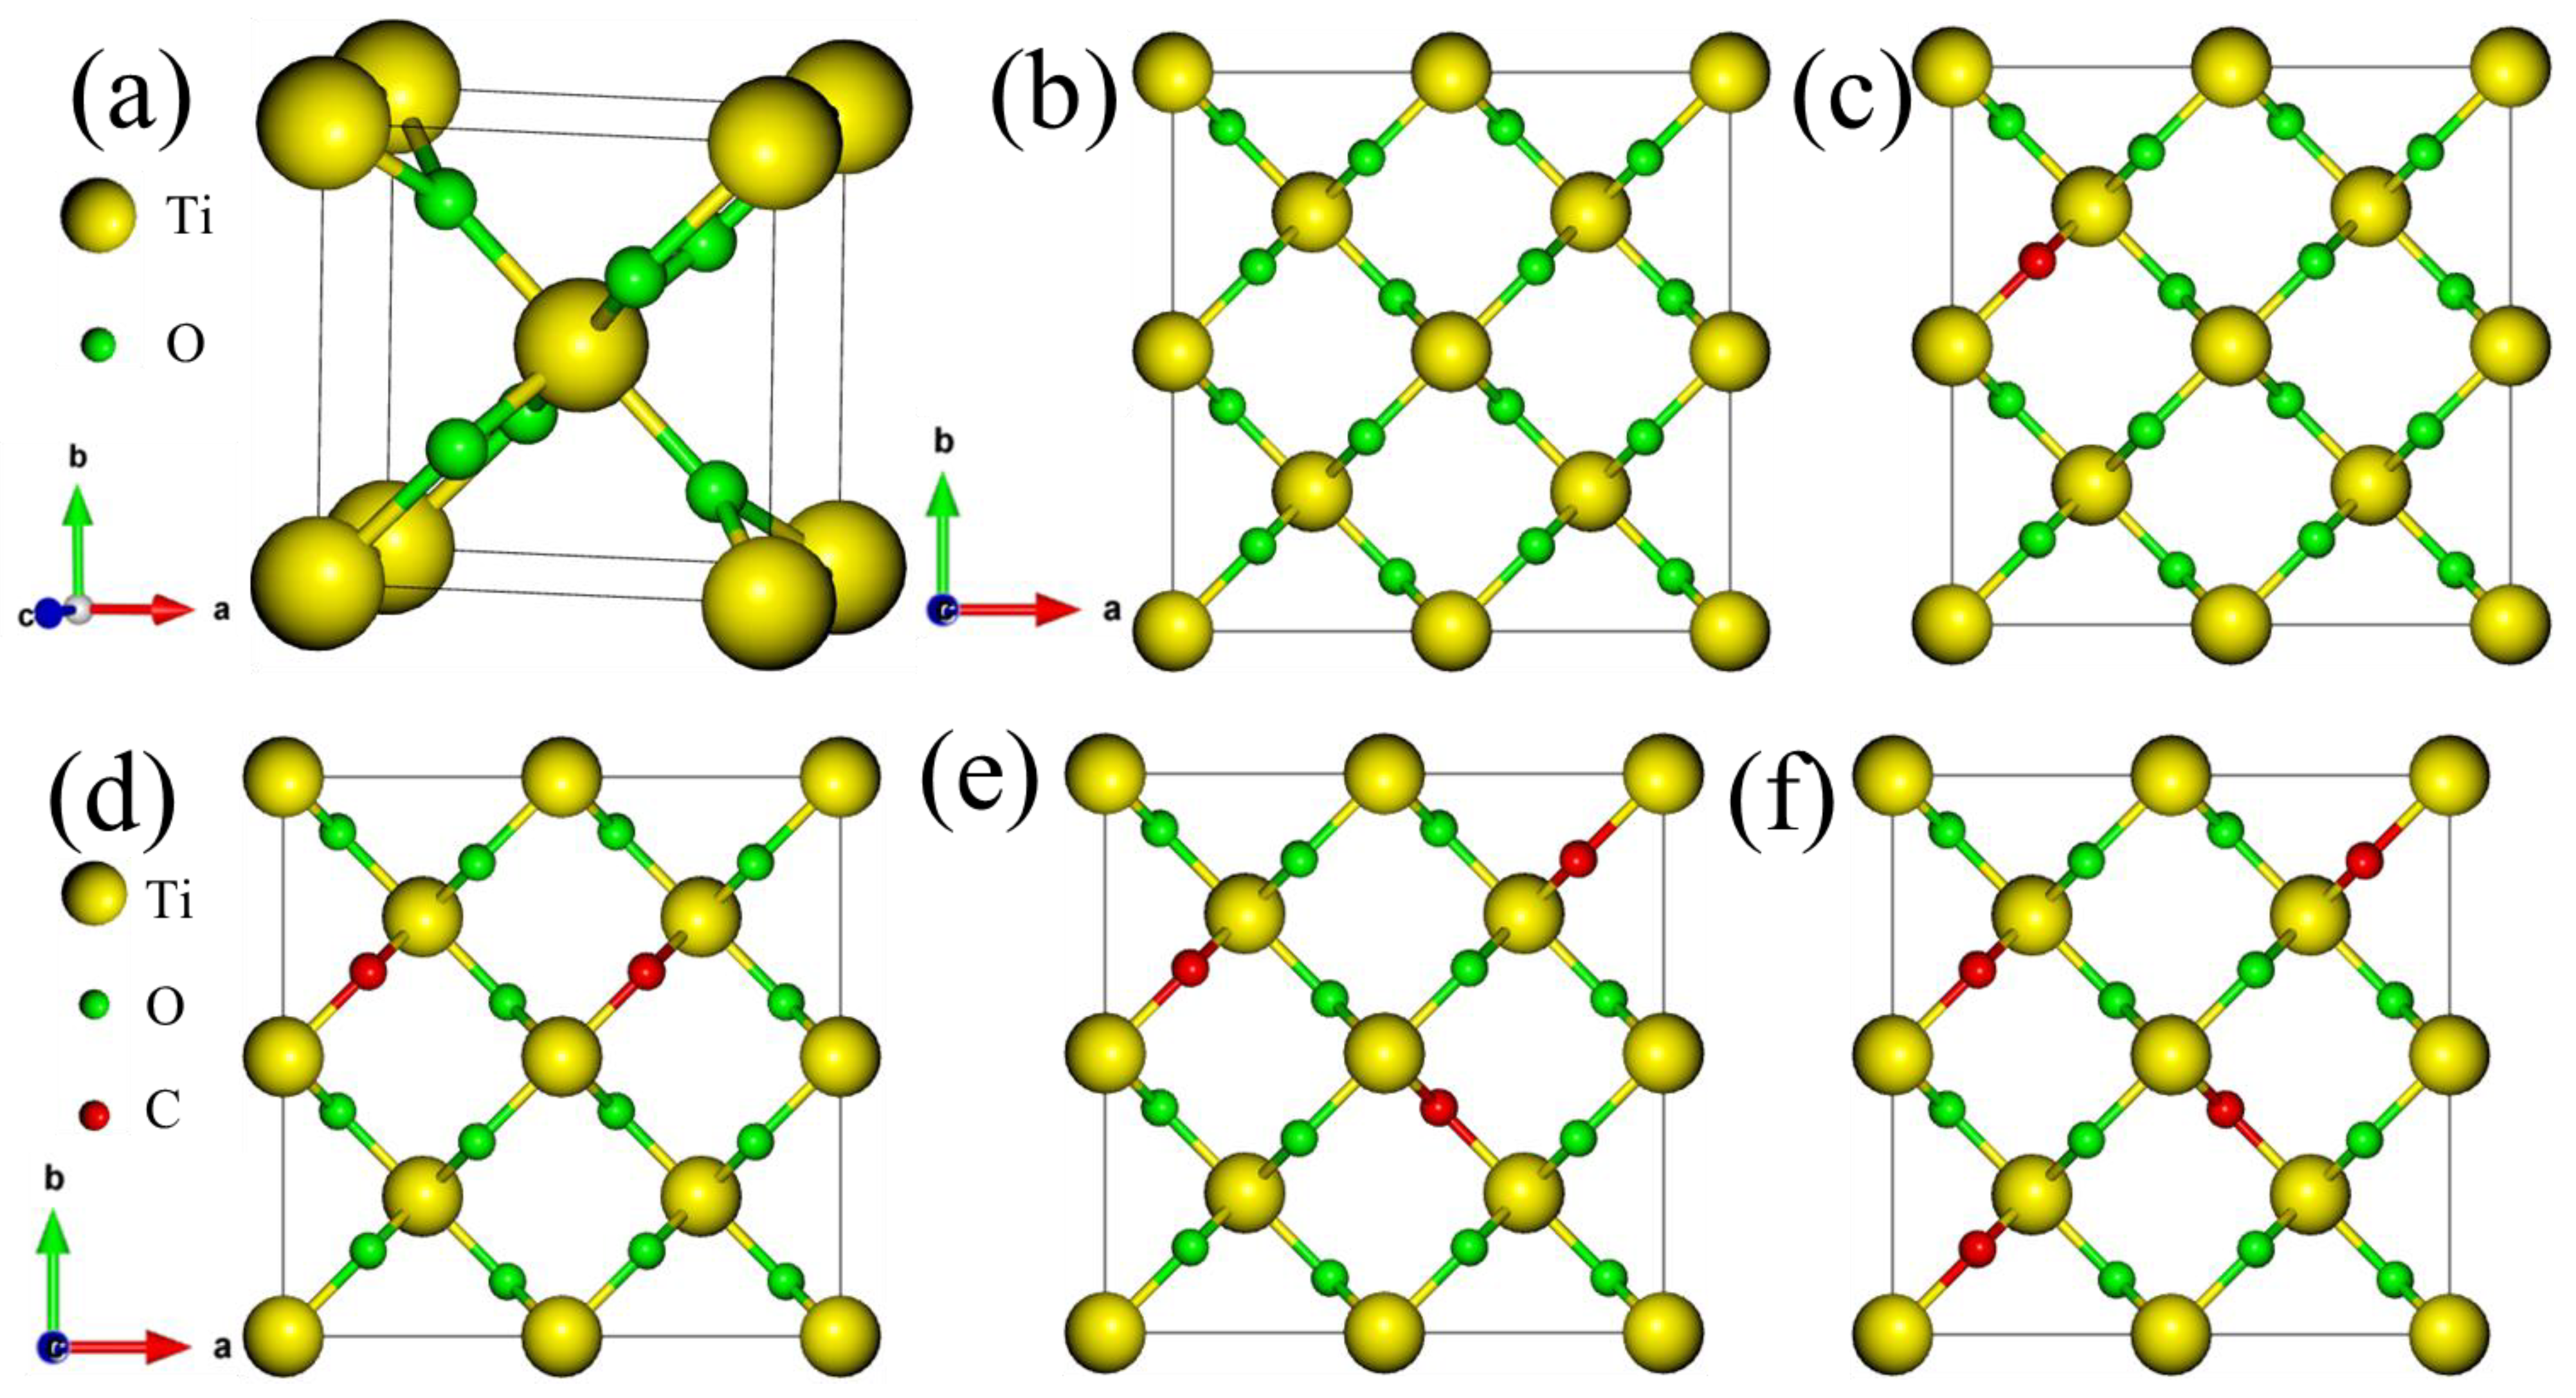
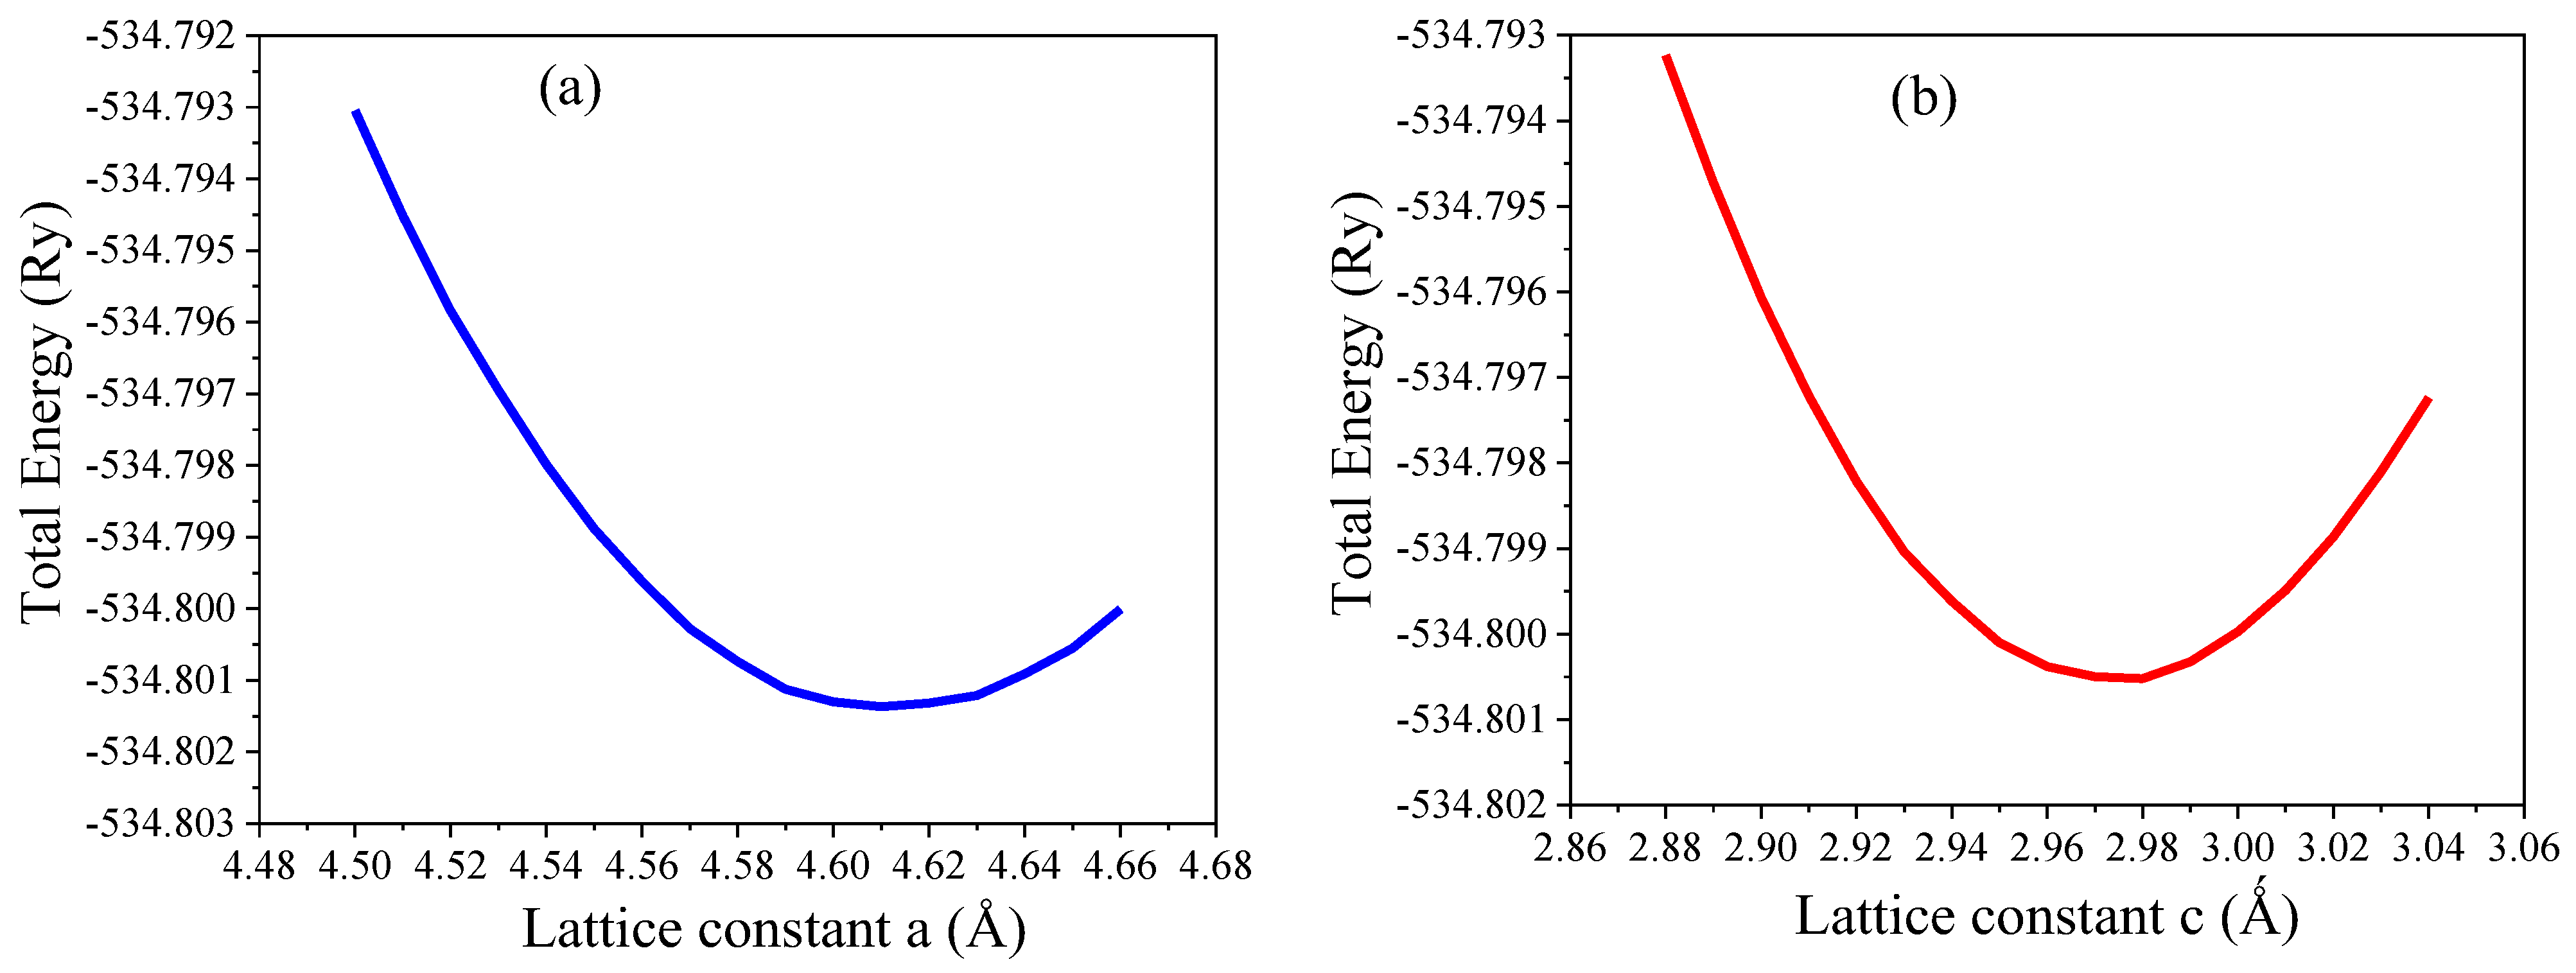
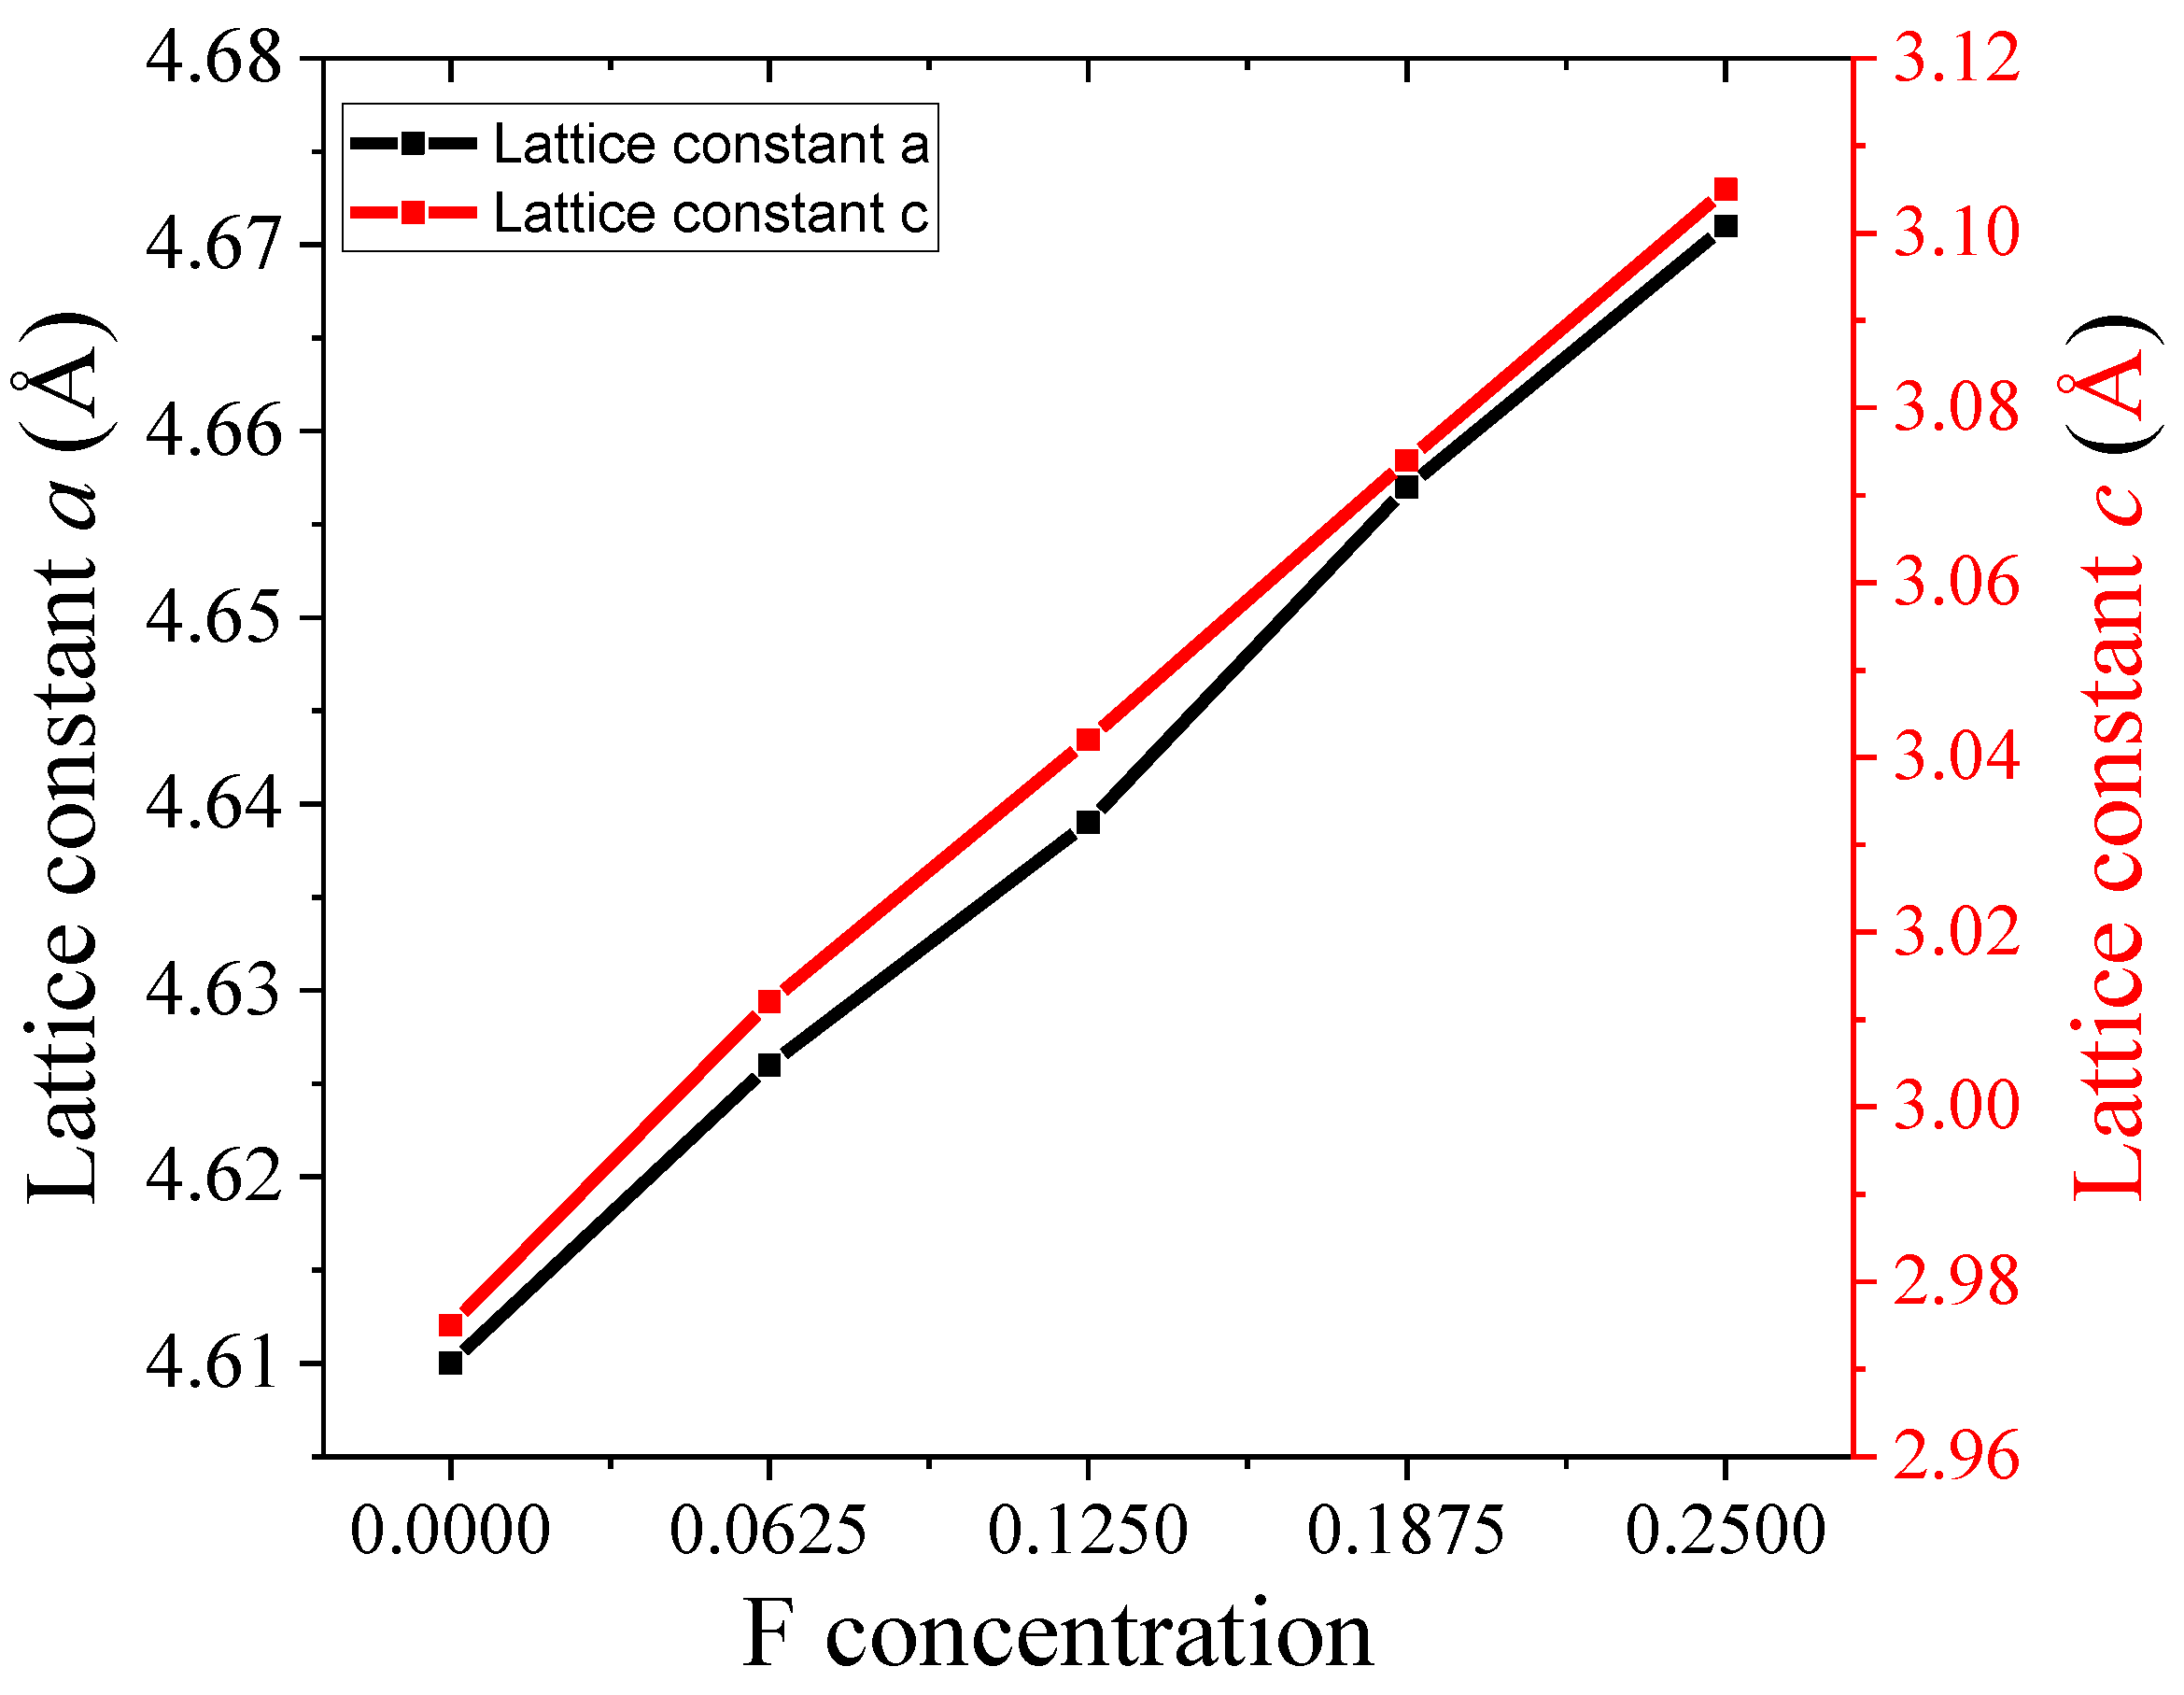
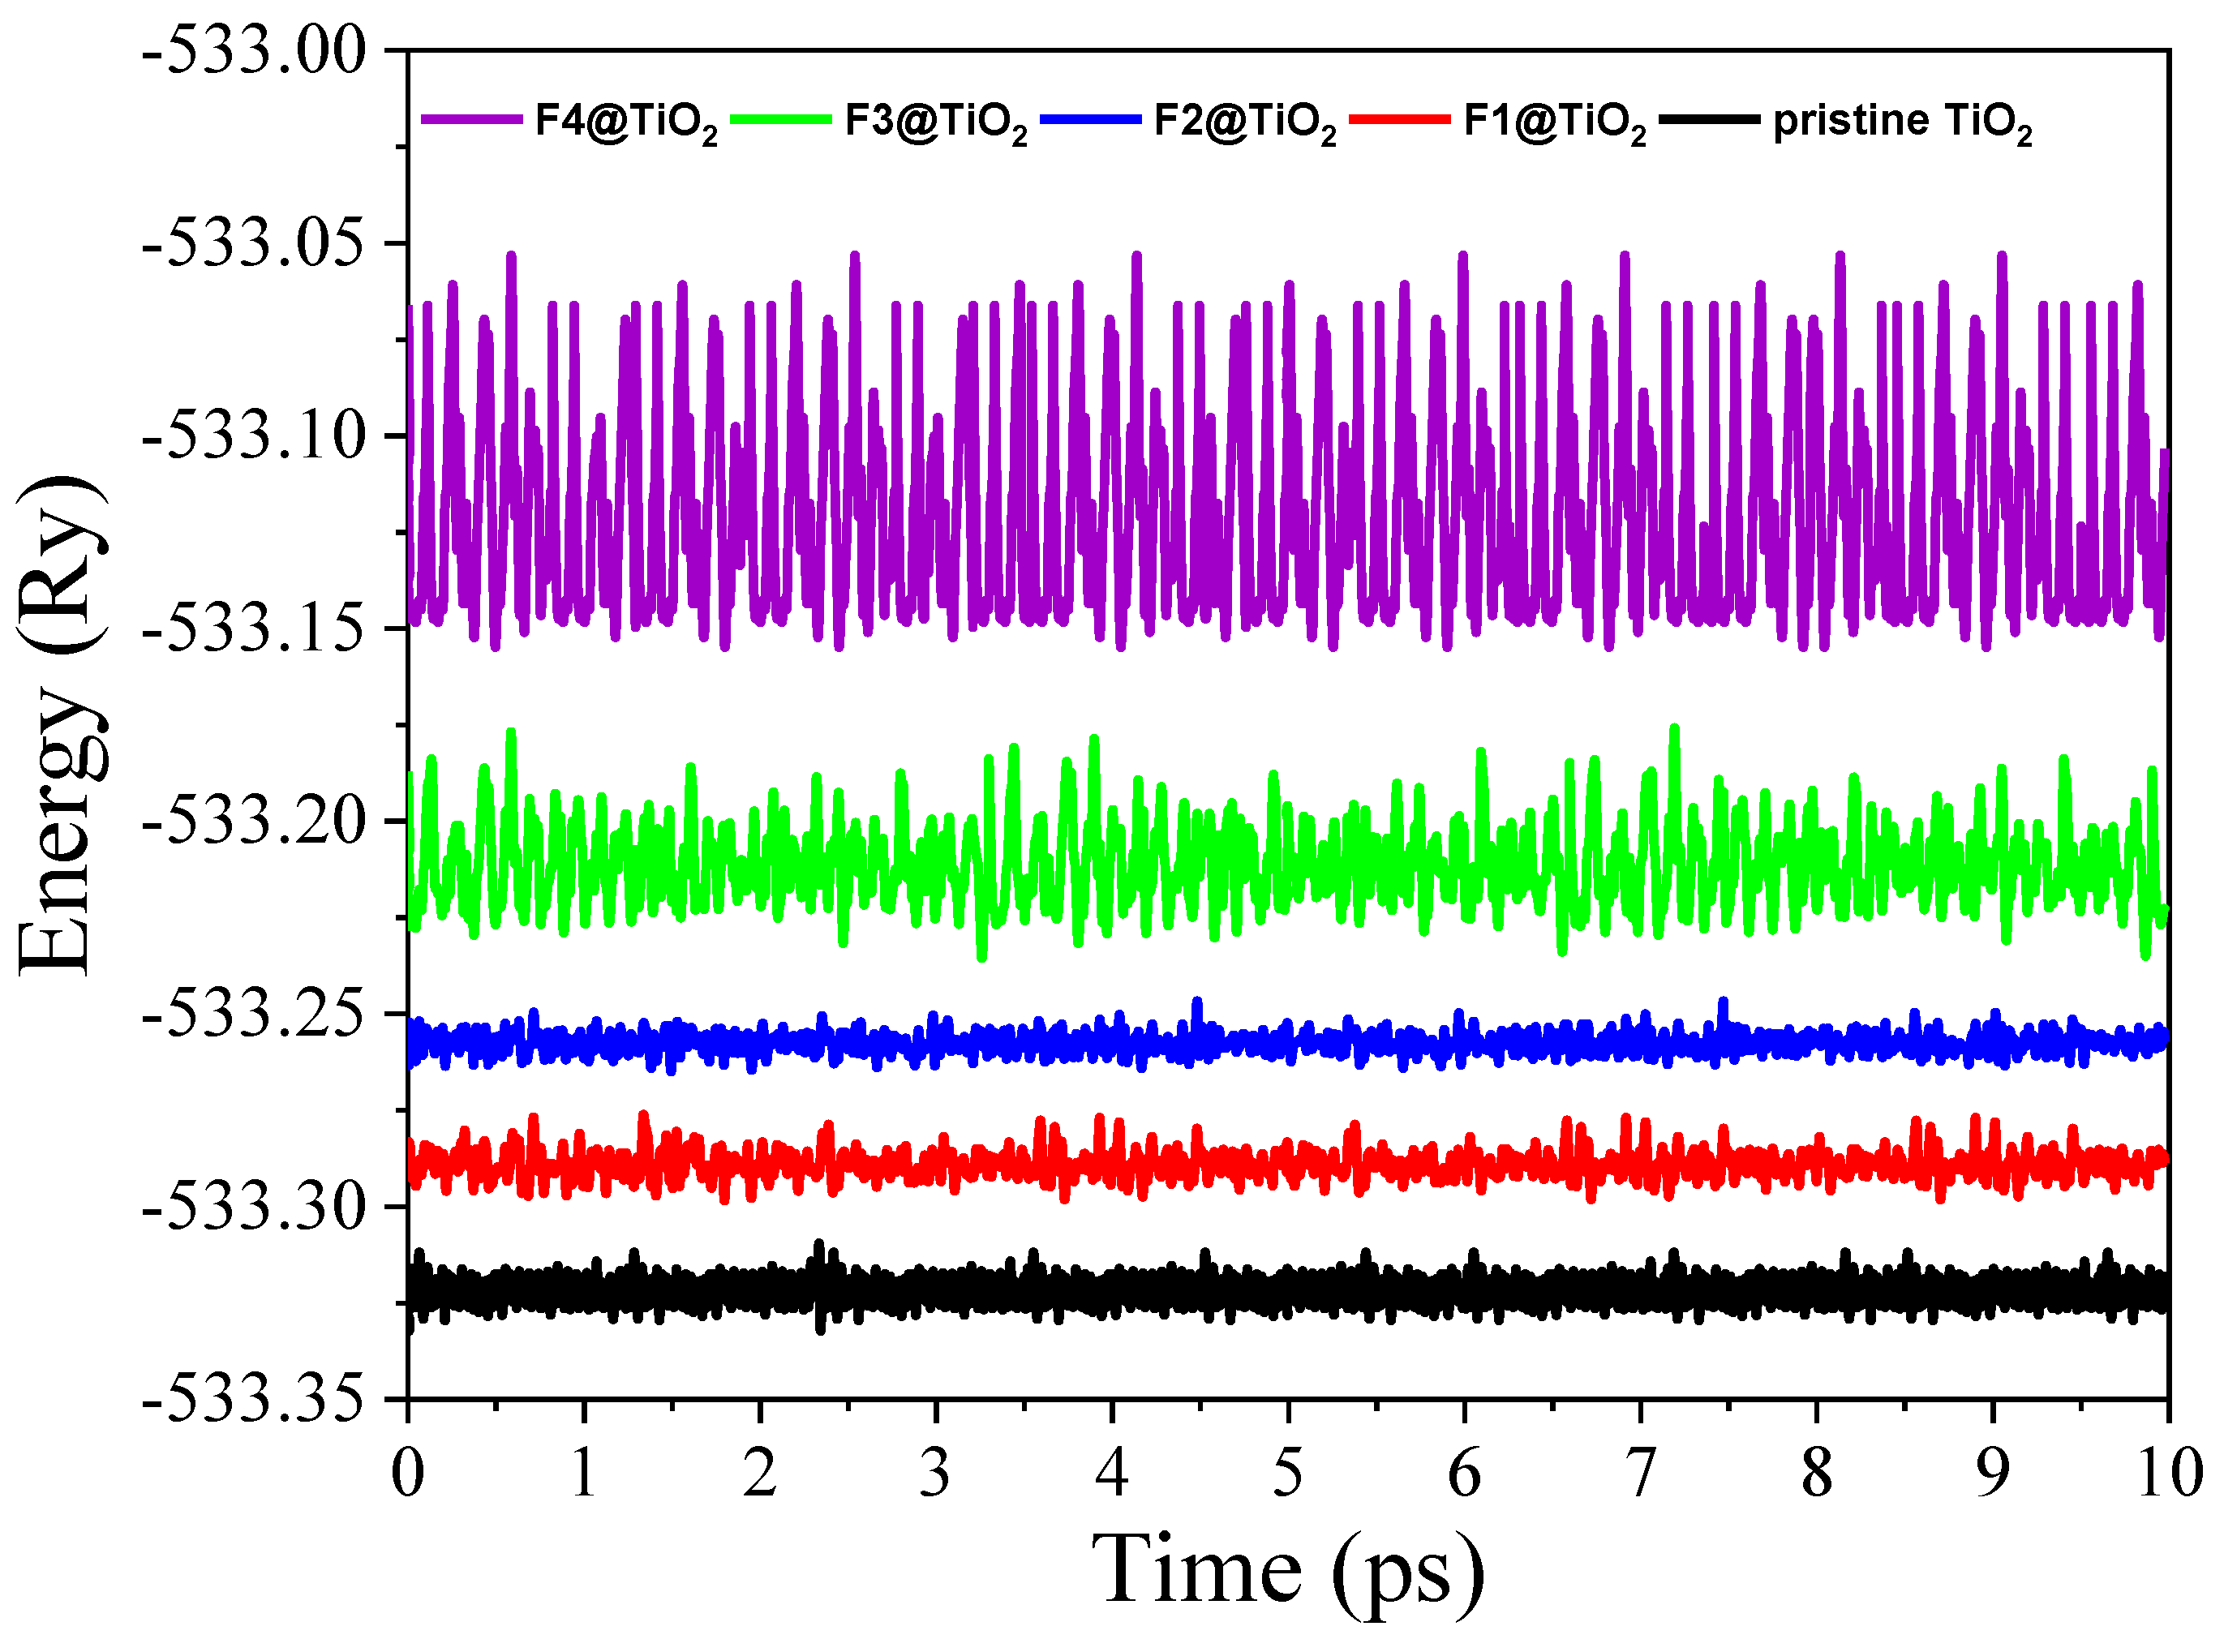
3.1. Structural Analysis
3.2. Formation Energy
- is the formation energy of the F-doped TiO2;
- and are the total energies of the F-doped TiO2 and pure TiO2, respectively;
- and are the chemical potentials of F and O, respectively;
- is the number of oxygen atoms substituted by F.
- The chemical potentials follow the relationship
3.3. Electronic Properties
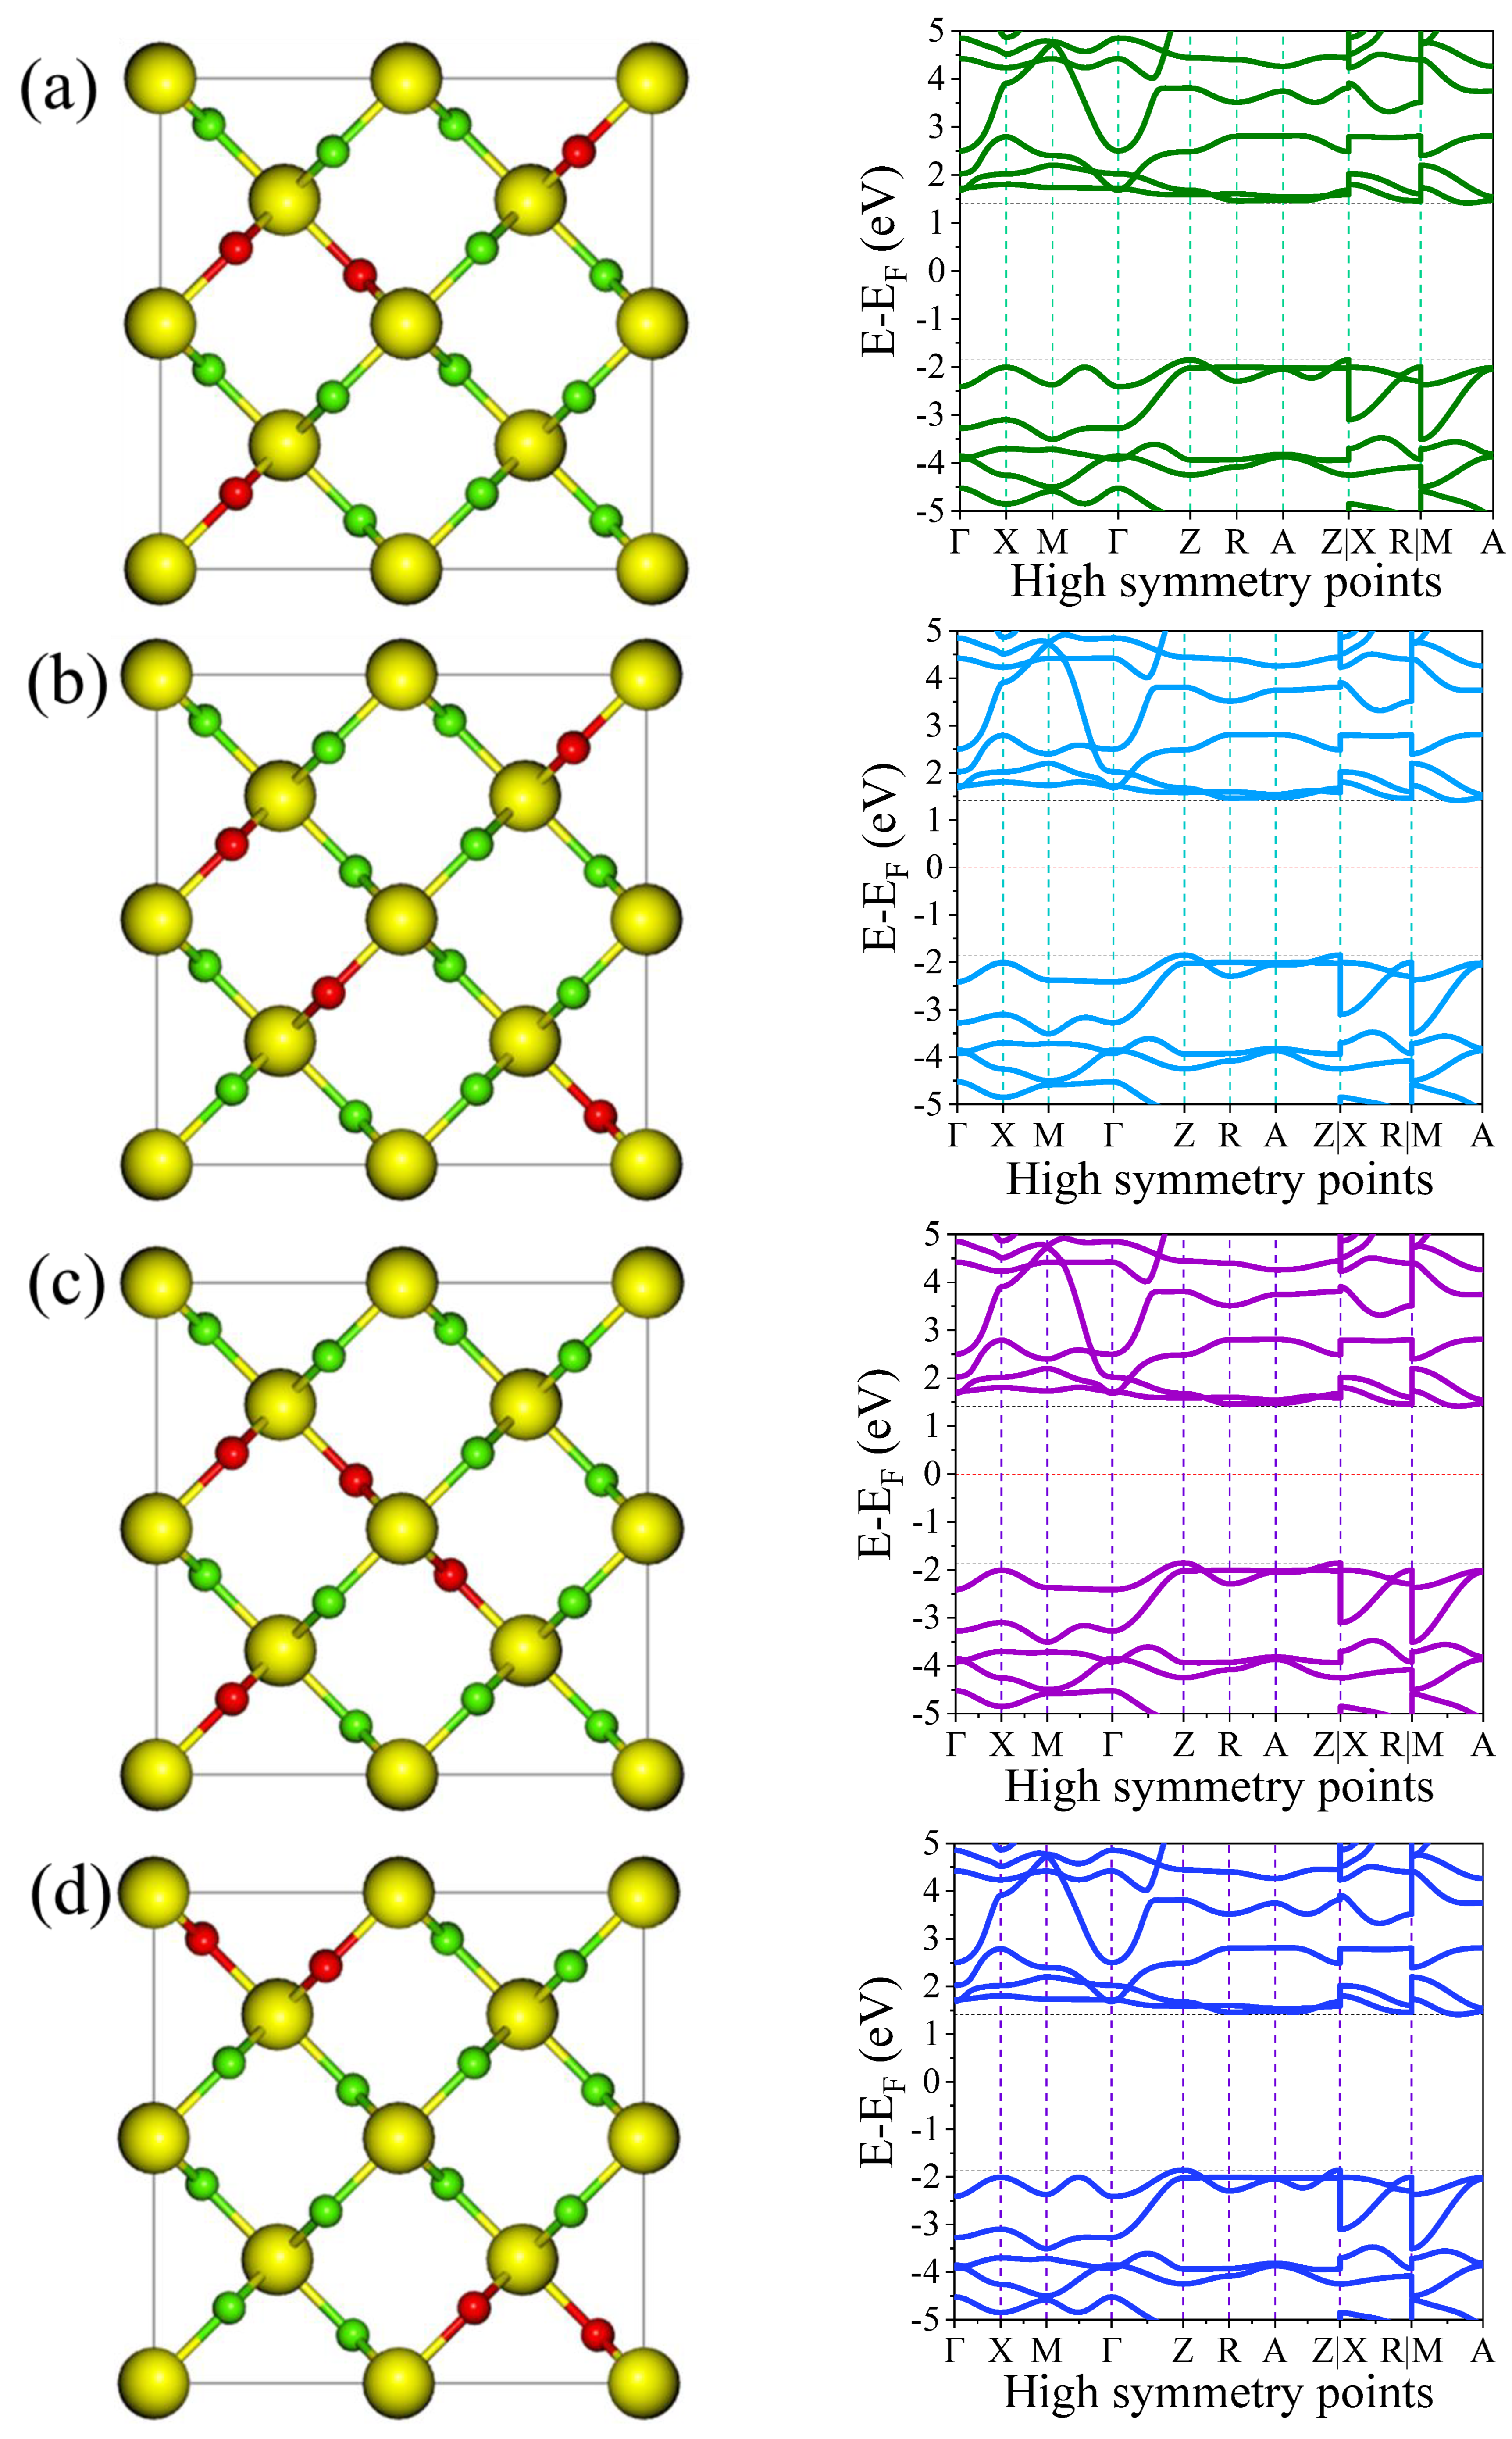
3.3.1. Electronic Band Structure

| Materials | VBM (eV) | CBM (eV) | Bandgap (eV) | Other DFT +U Bandgap (eV) | Experimental Bandgap (eV) |
|---|---|---|---|---|---|
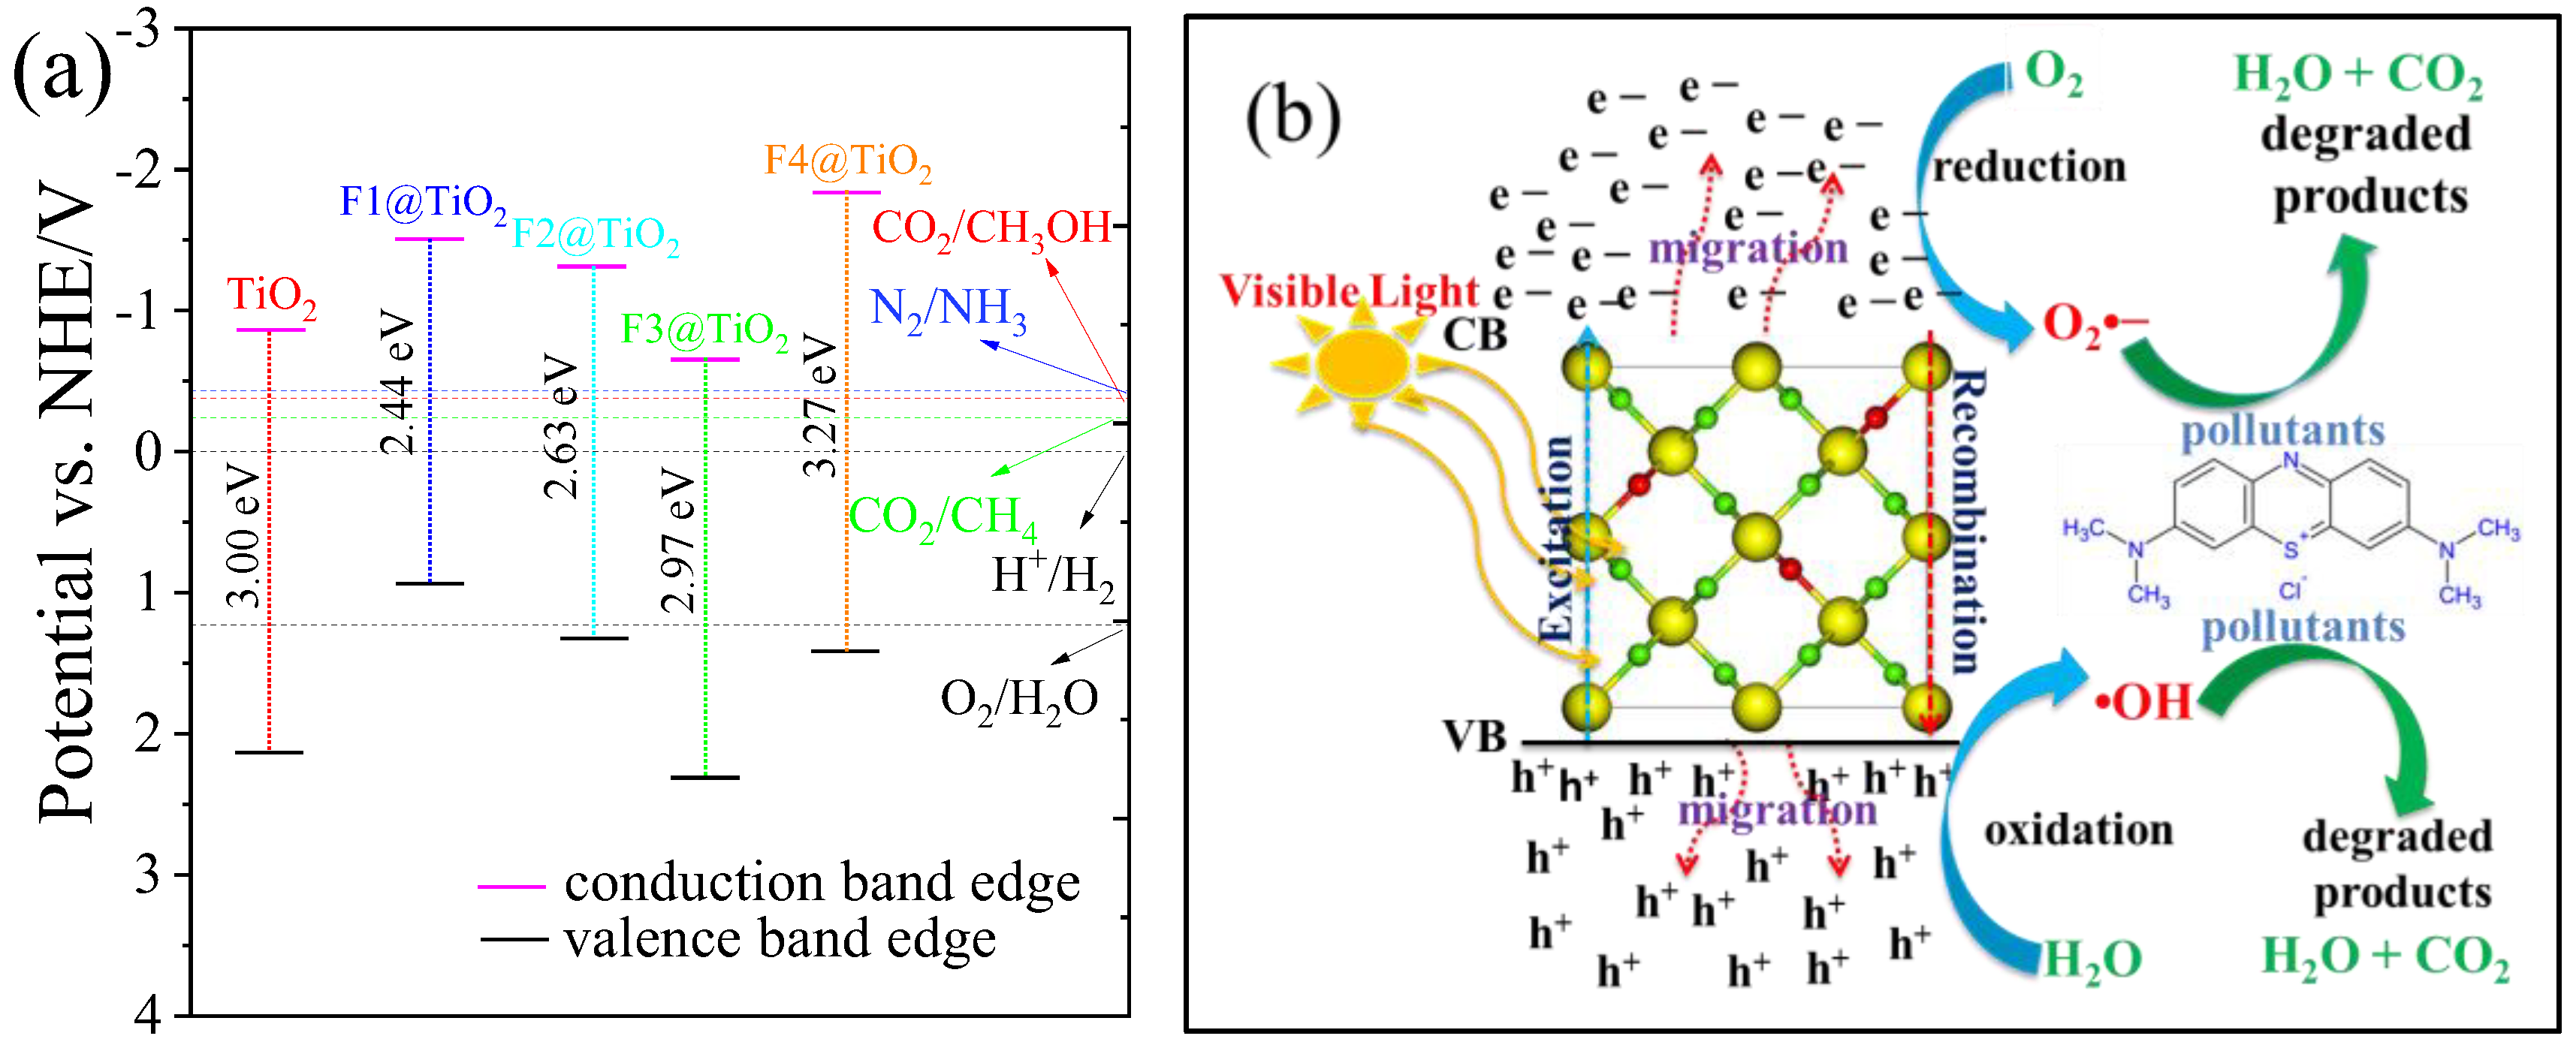
| Pure TiO2 | −0.8650 | 2.1365 | 3.00 | 3.03 a | 3.00 b |
| F1@TiO2 | −1.5060 | 0.9297 | 2.44 | --- | --- |
| F2@TiO2 | −1.3128 | 1.3147 | 2.63 | --- | --- |
| F3@TiO2 | −0.6551 | 2.3135 | 2.97 | --- | --- |
| F4@TiO2 | −1.8525 | 1.4130 | 3.27 | --- | --- |
| Dopant Arrangement | VBM (eV) | CBM (eV) | Bandgap (eV) | Formation Energy (eV) |
|---|---|---|---|---|
| a | –1.8525 | 1.4130 | 3.2655 | −3.68 |
| b | –1.8522 | 1.4120 | 3.2642 | −3.57 |
| c | –1.8521 | 1.4127 | 3.2648 | −3.52 |
| d | –1.8521 | 1.4124 | 3.2645 | −3.73 |
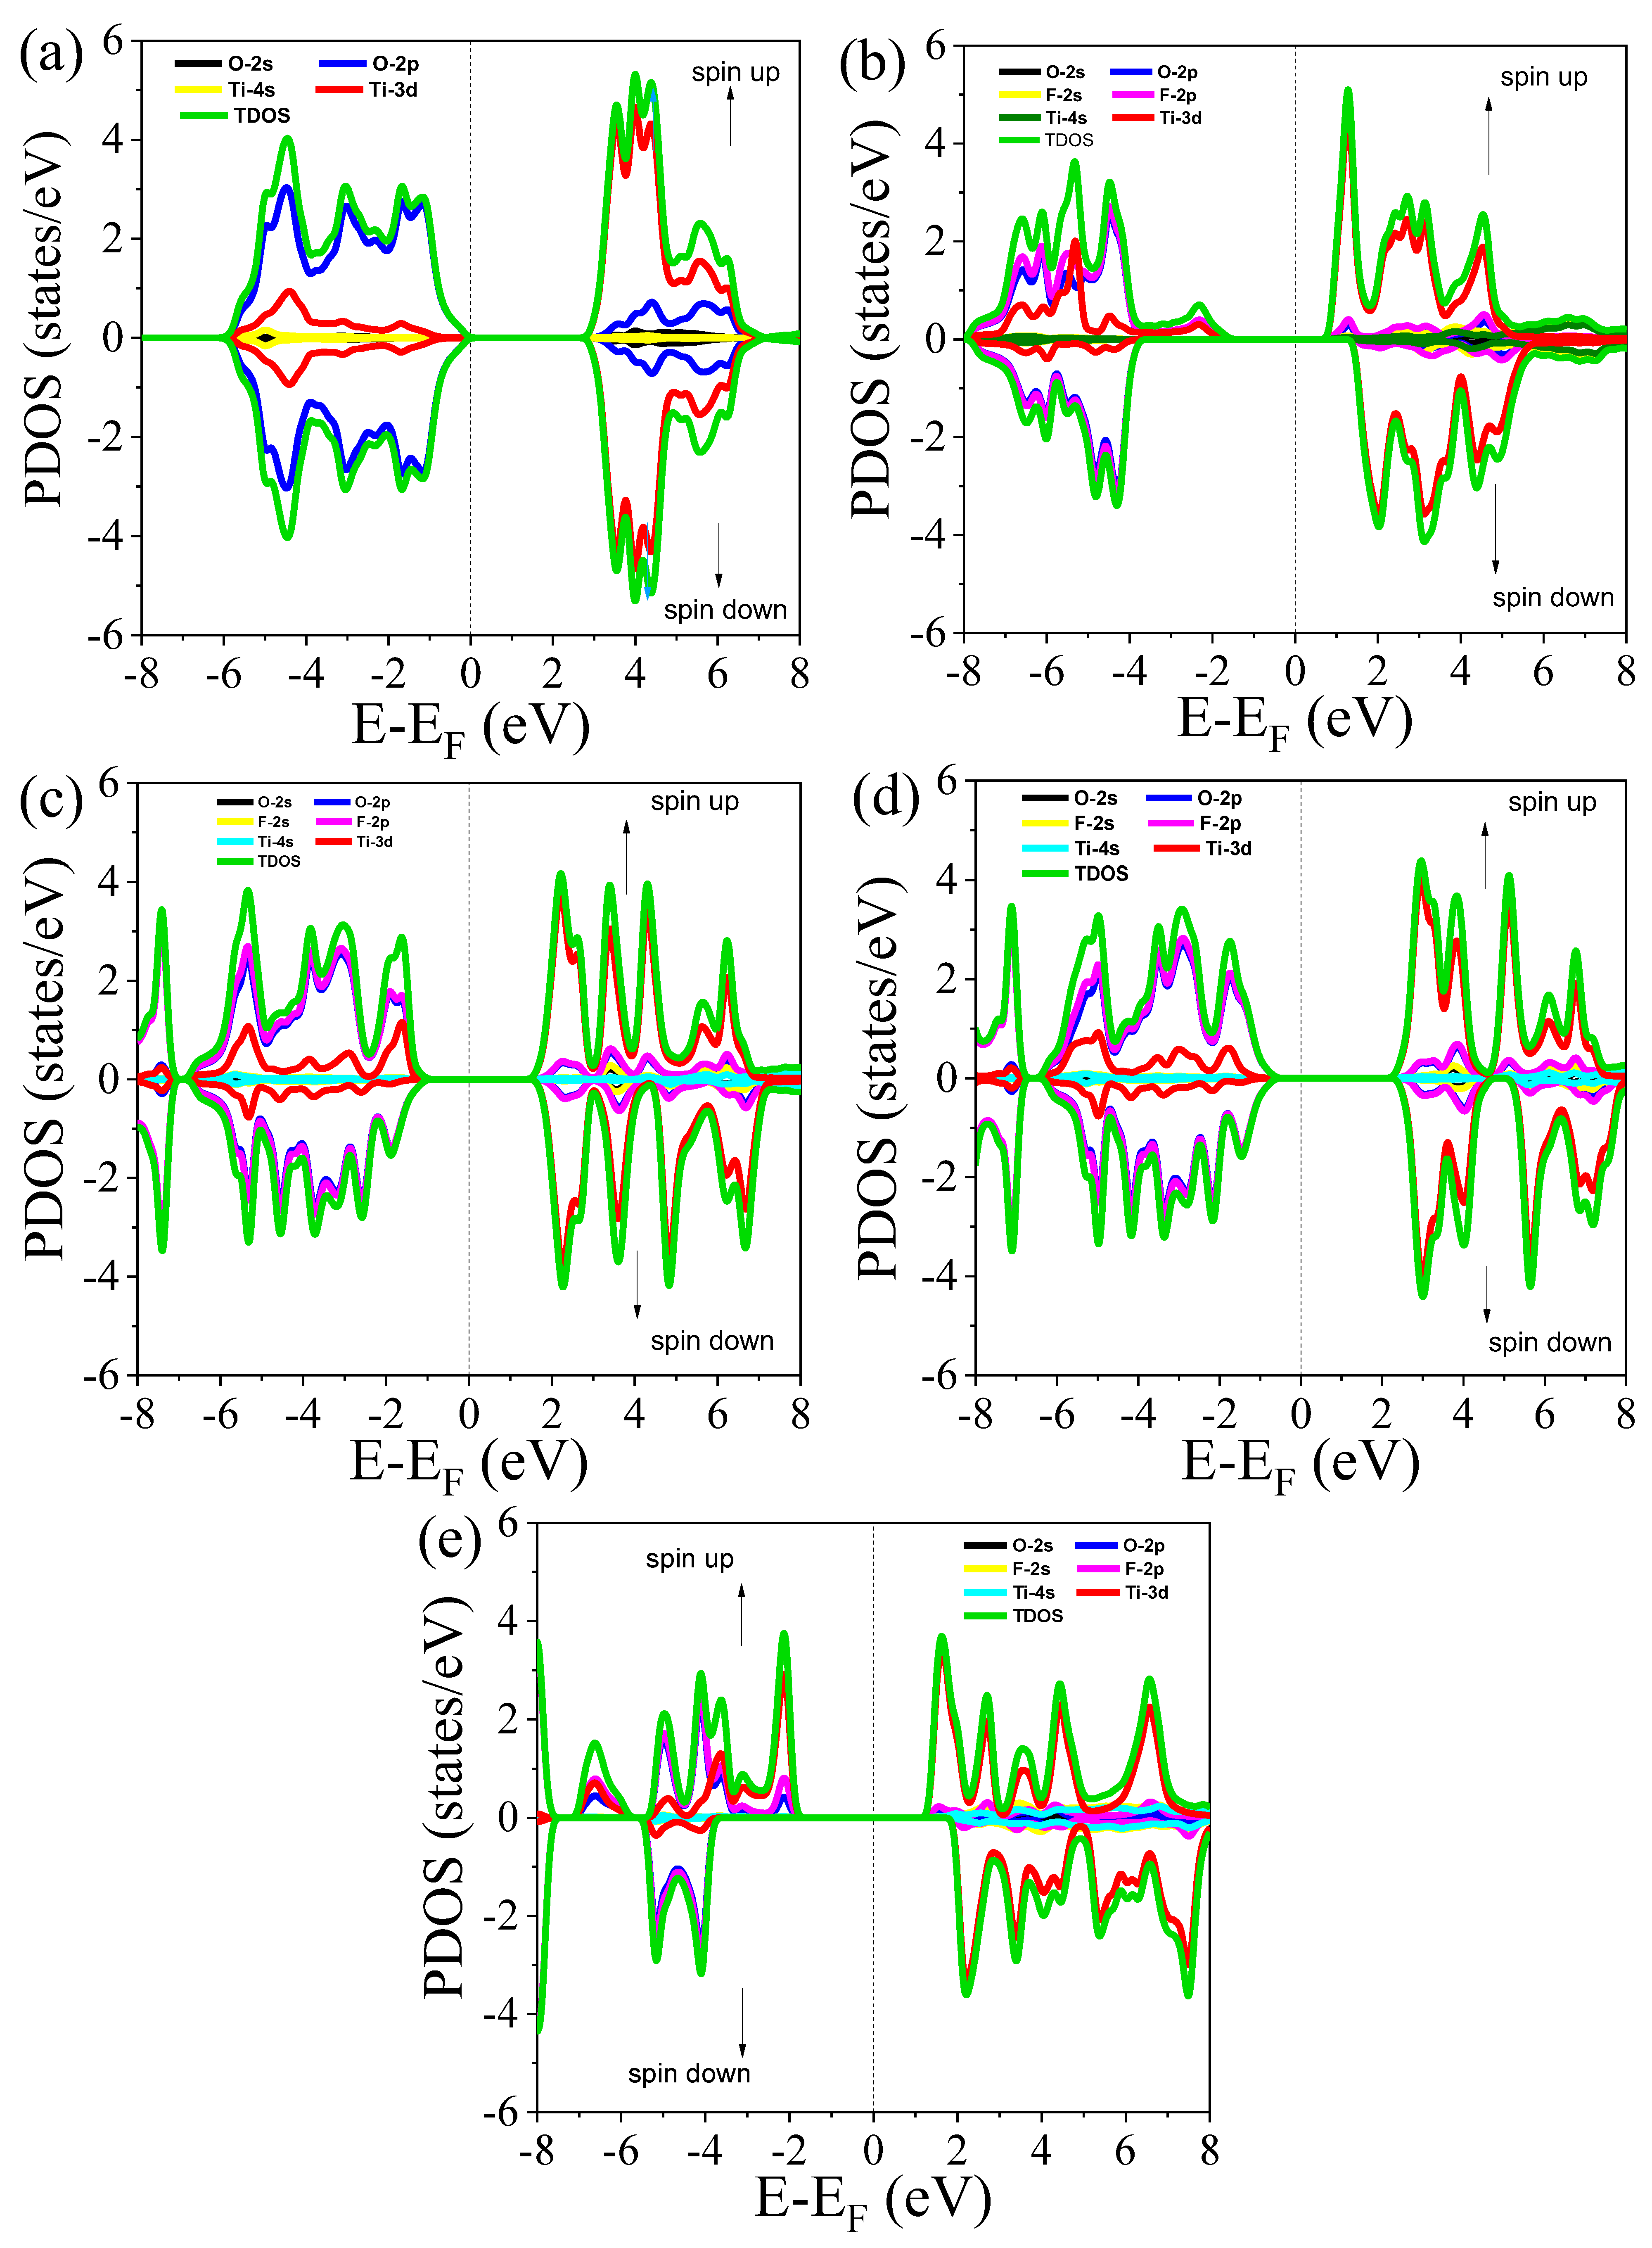
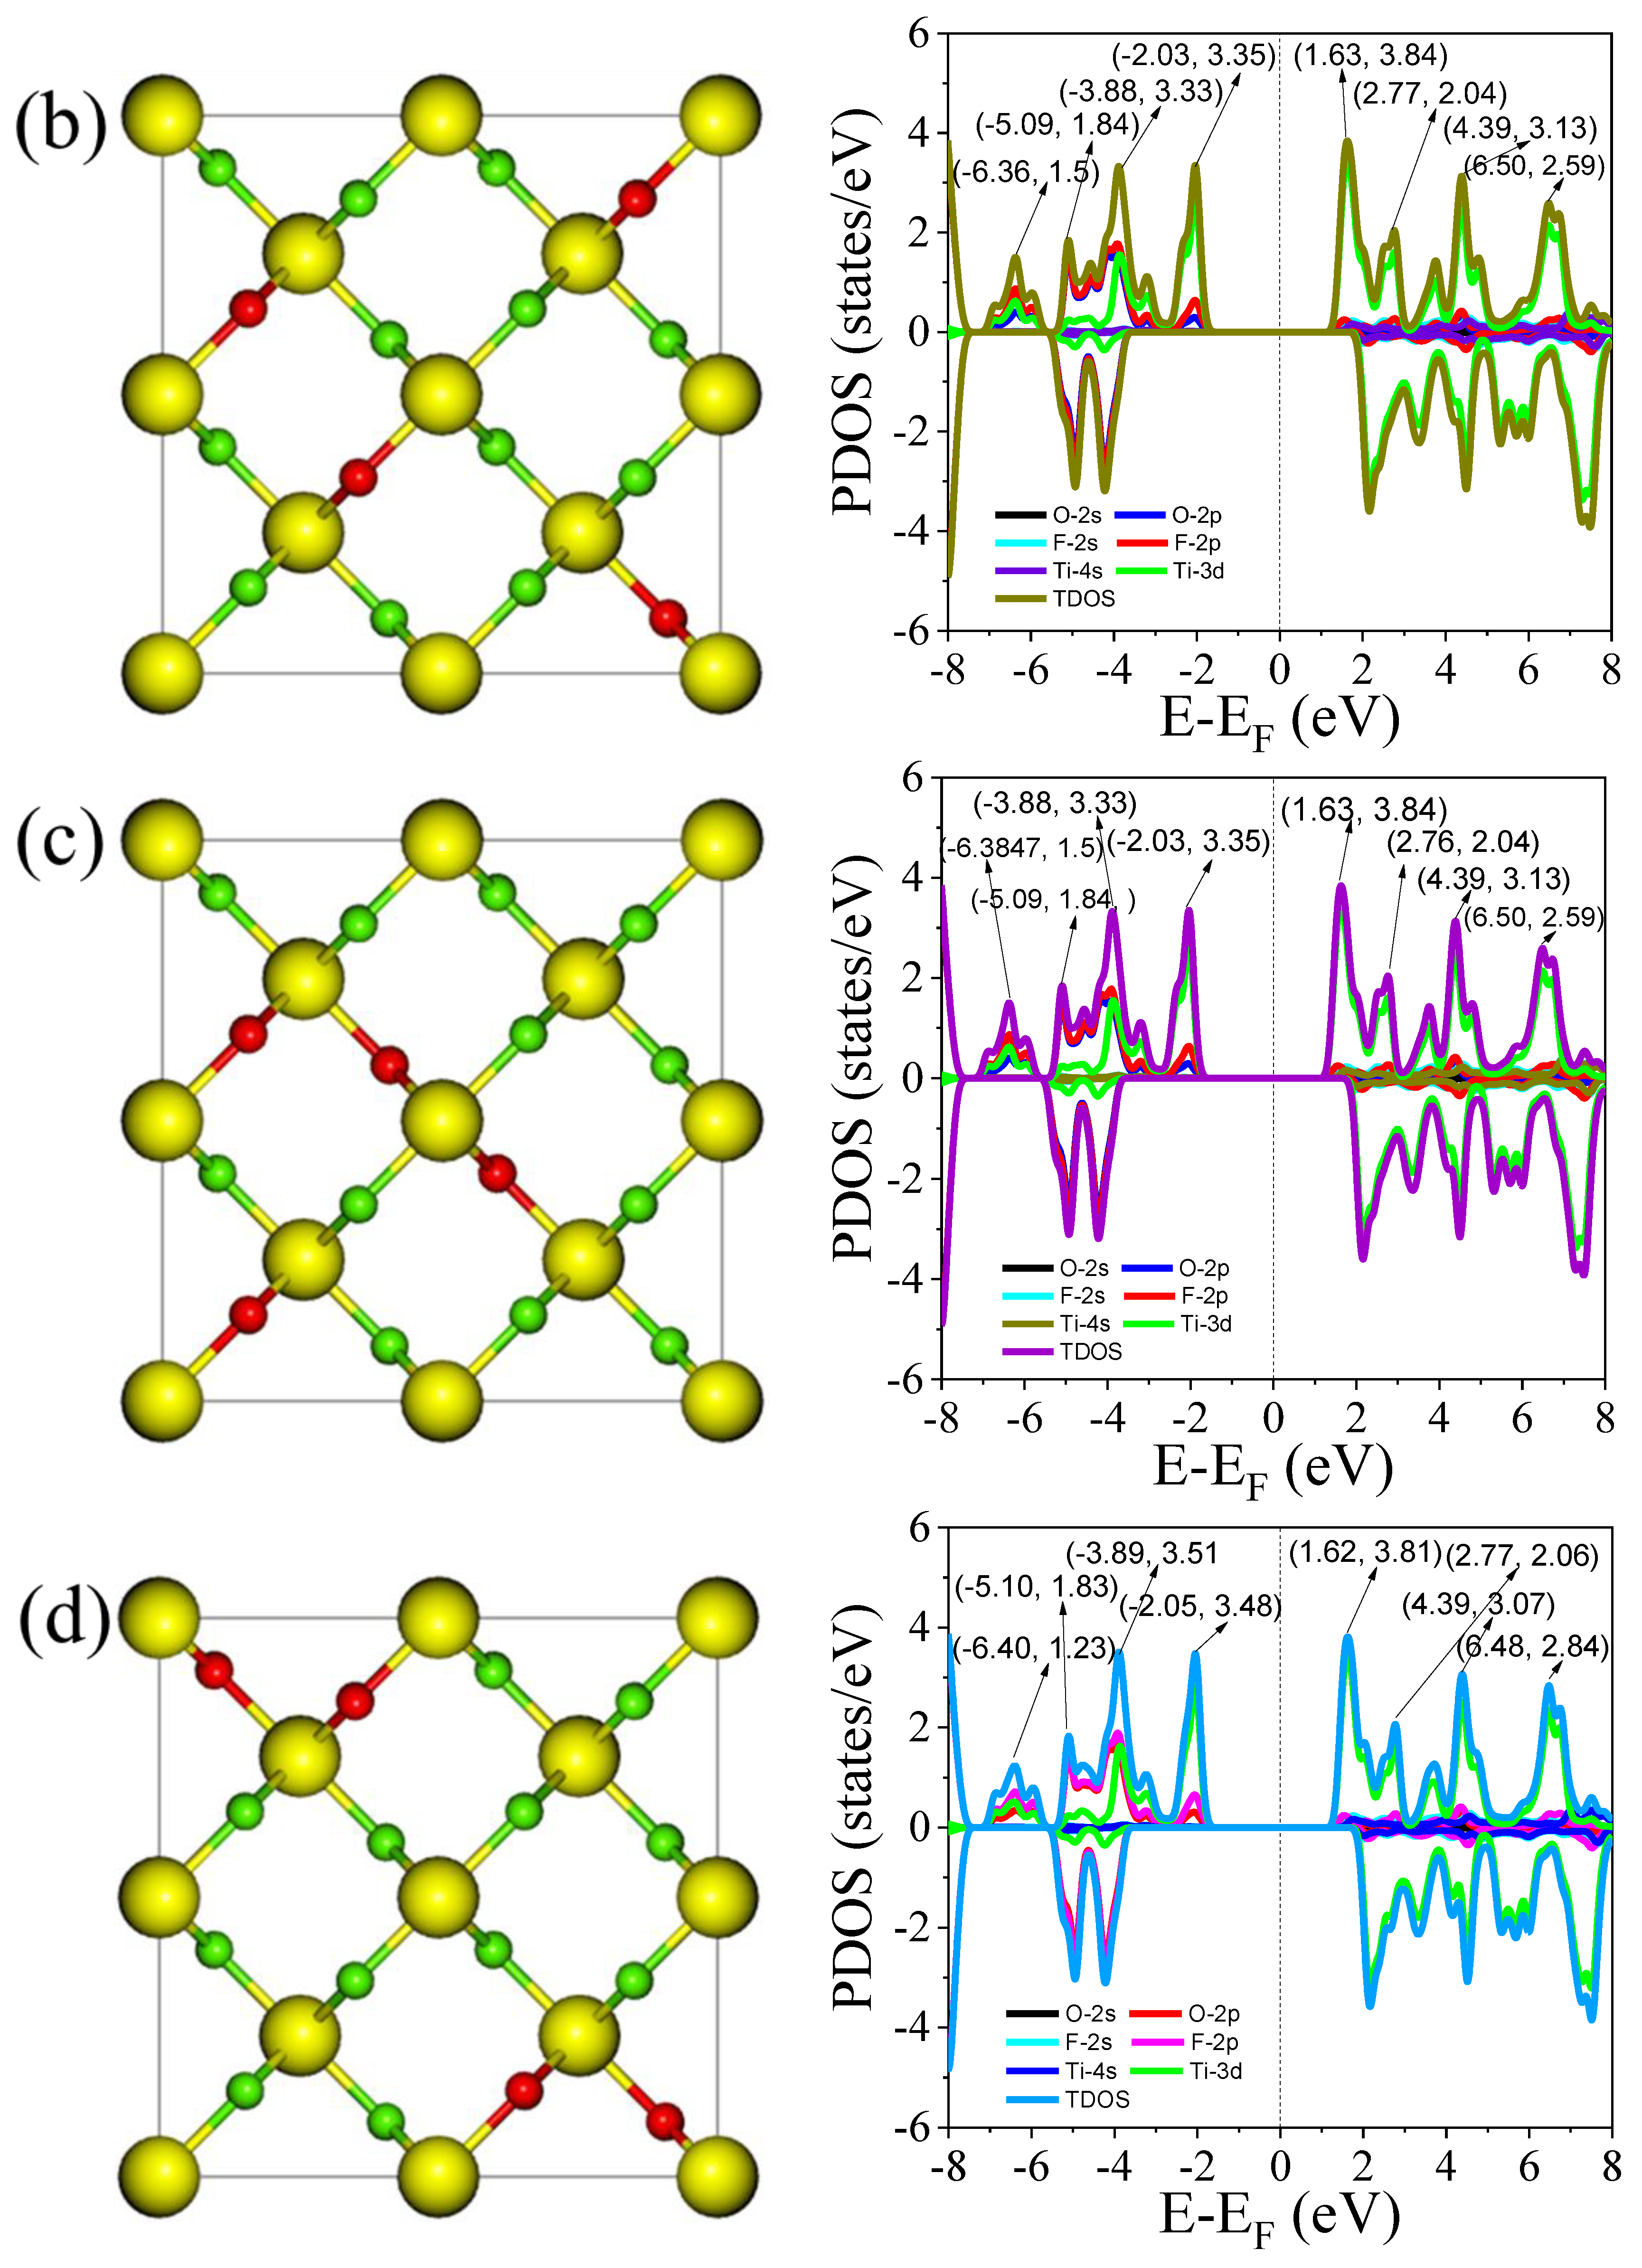
3.3.2. Total and Partial Density of States
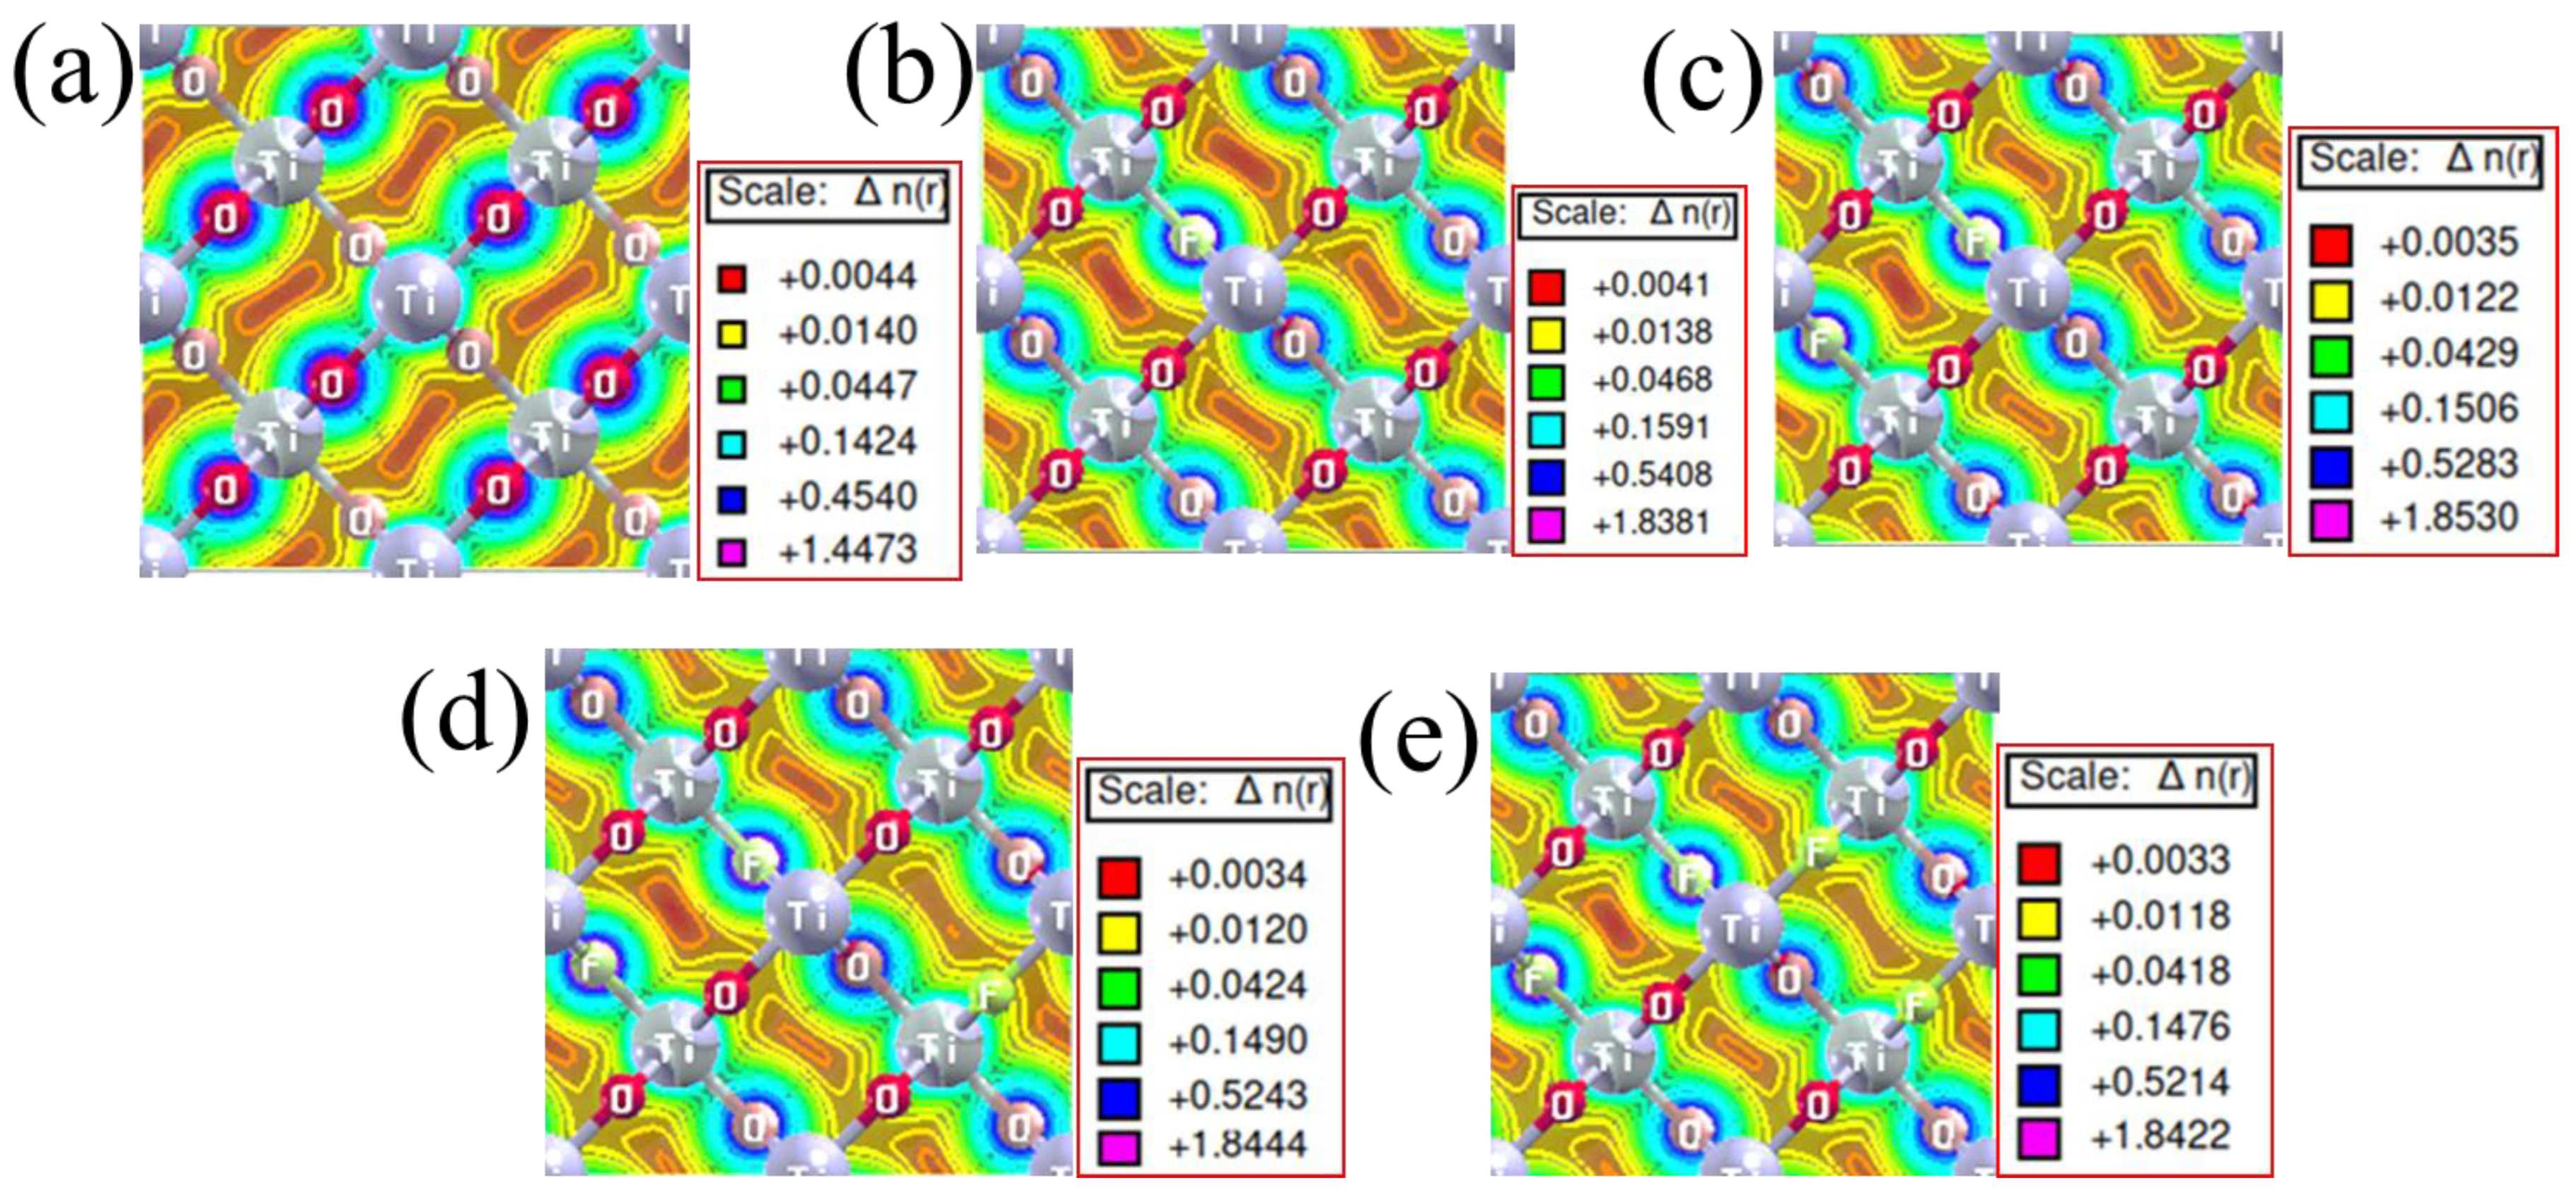
3.4. Charge Density
3.5. Optical Properties
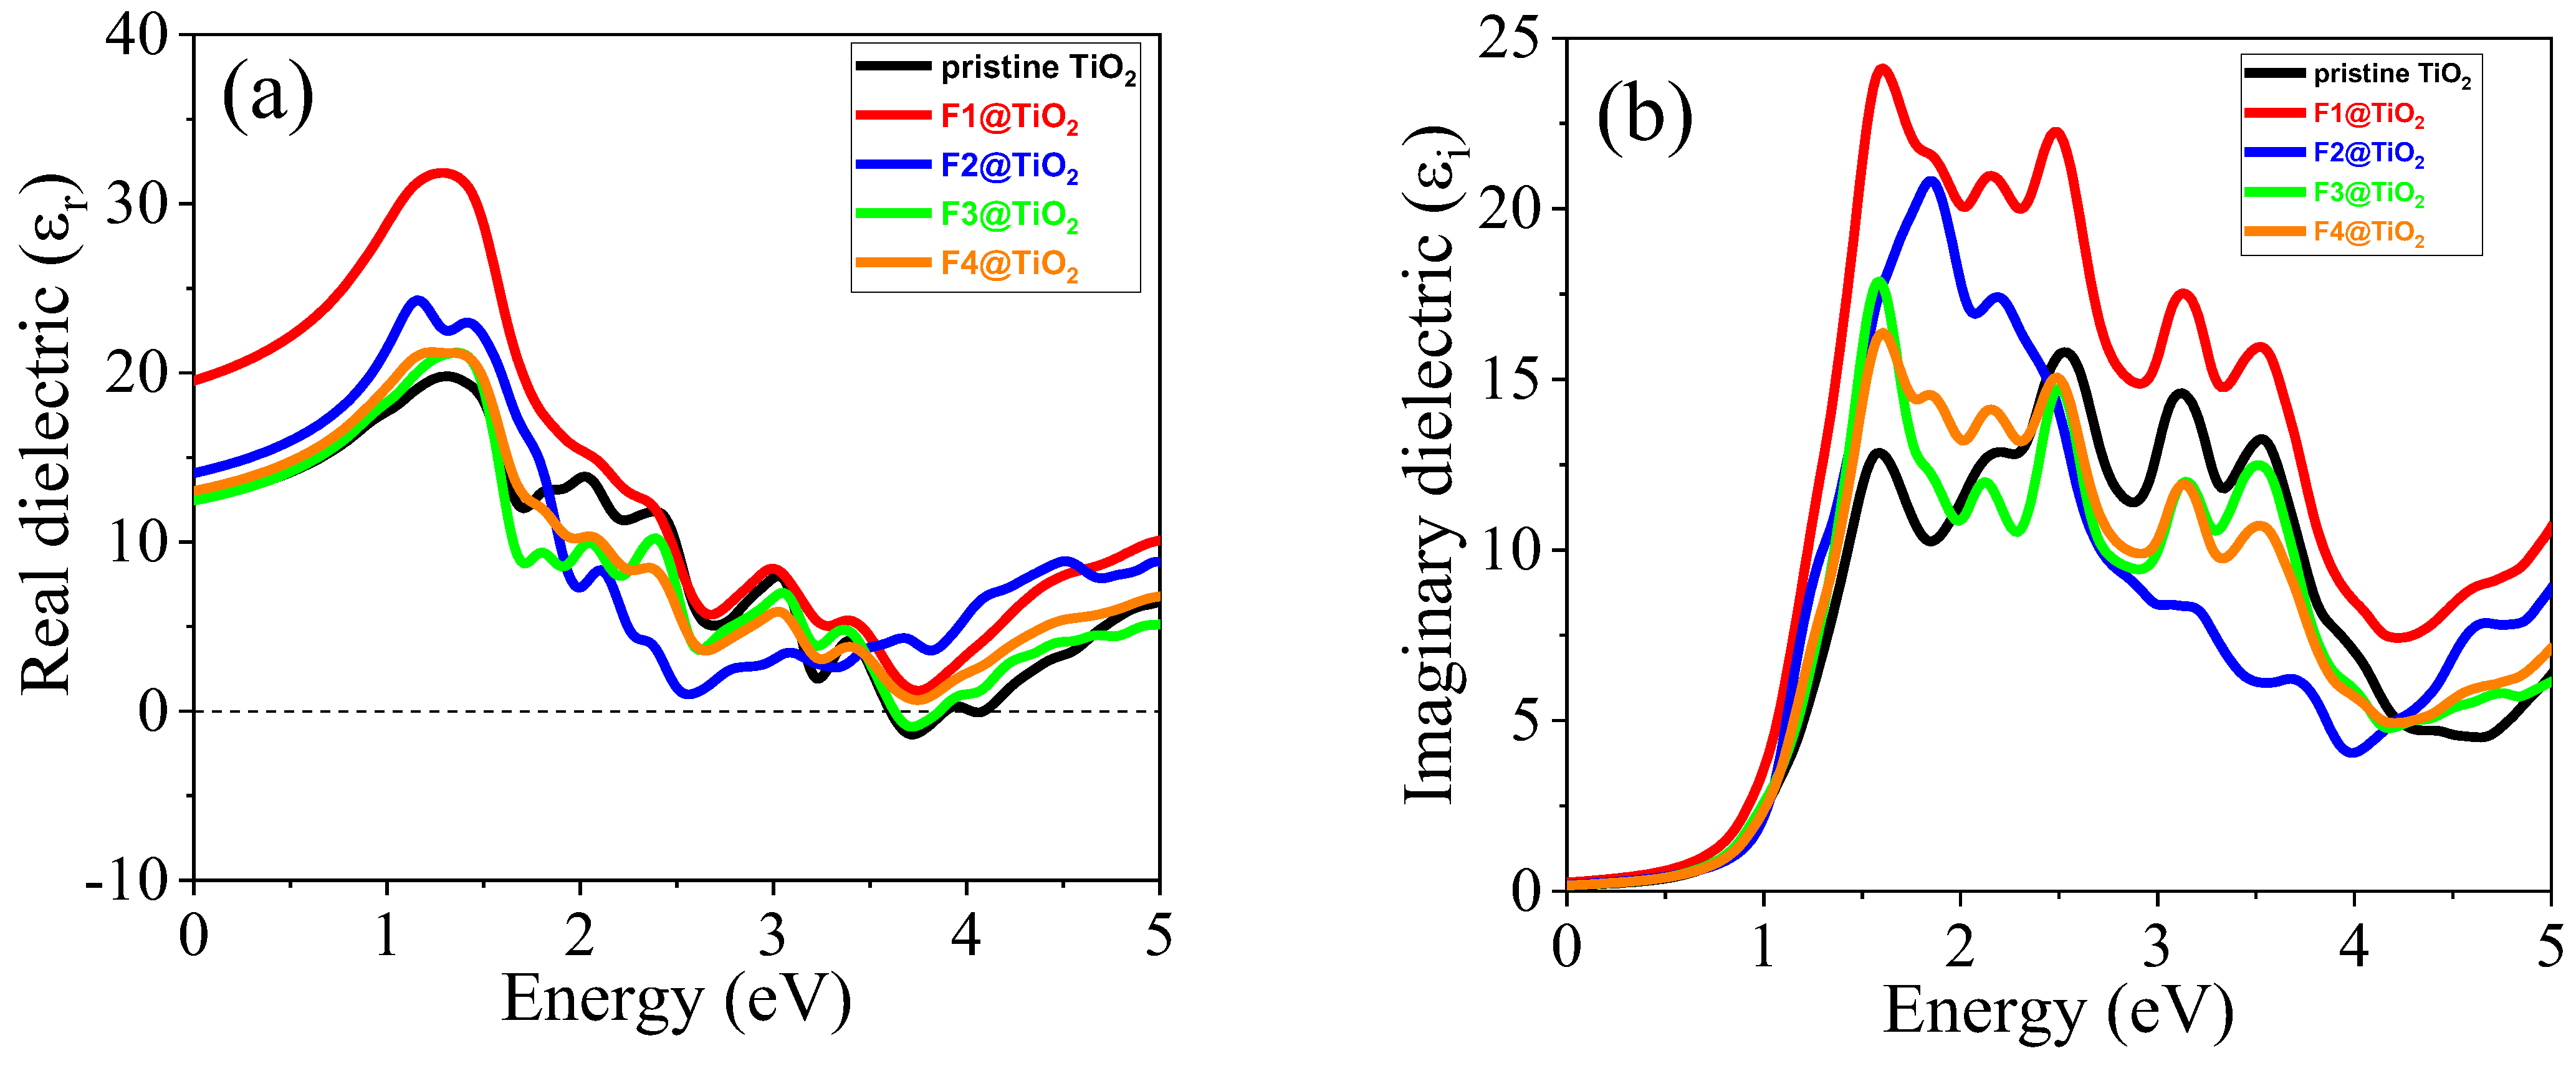
3.5.1. Dielectric Functions
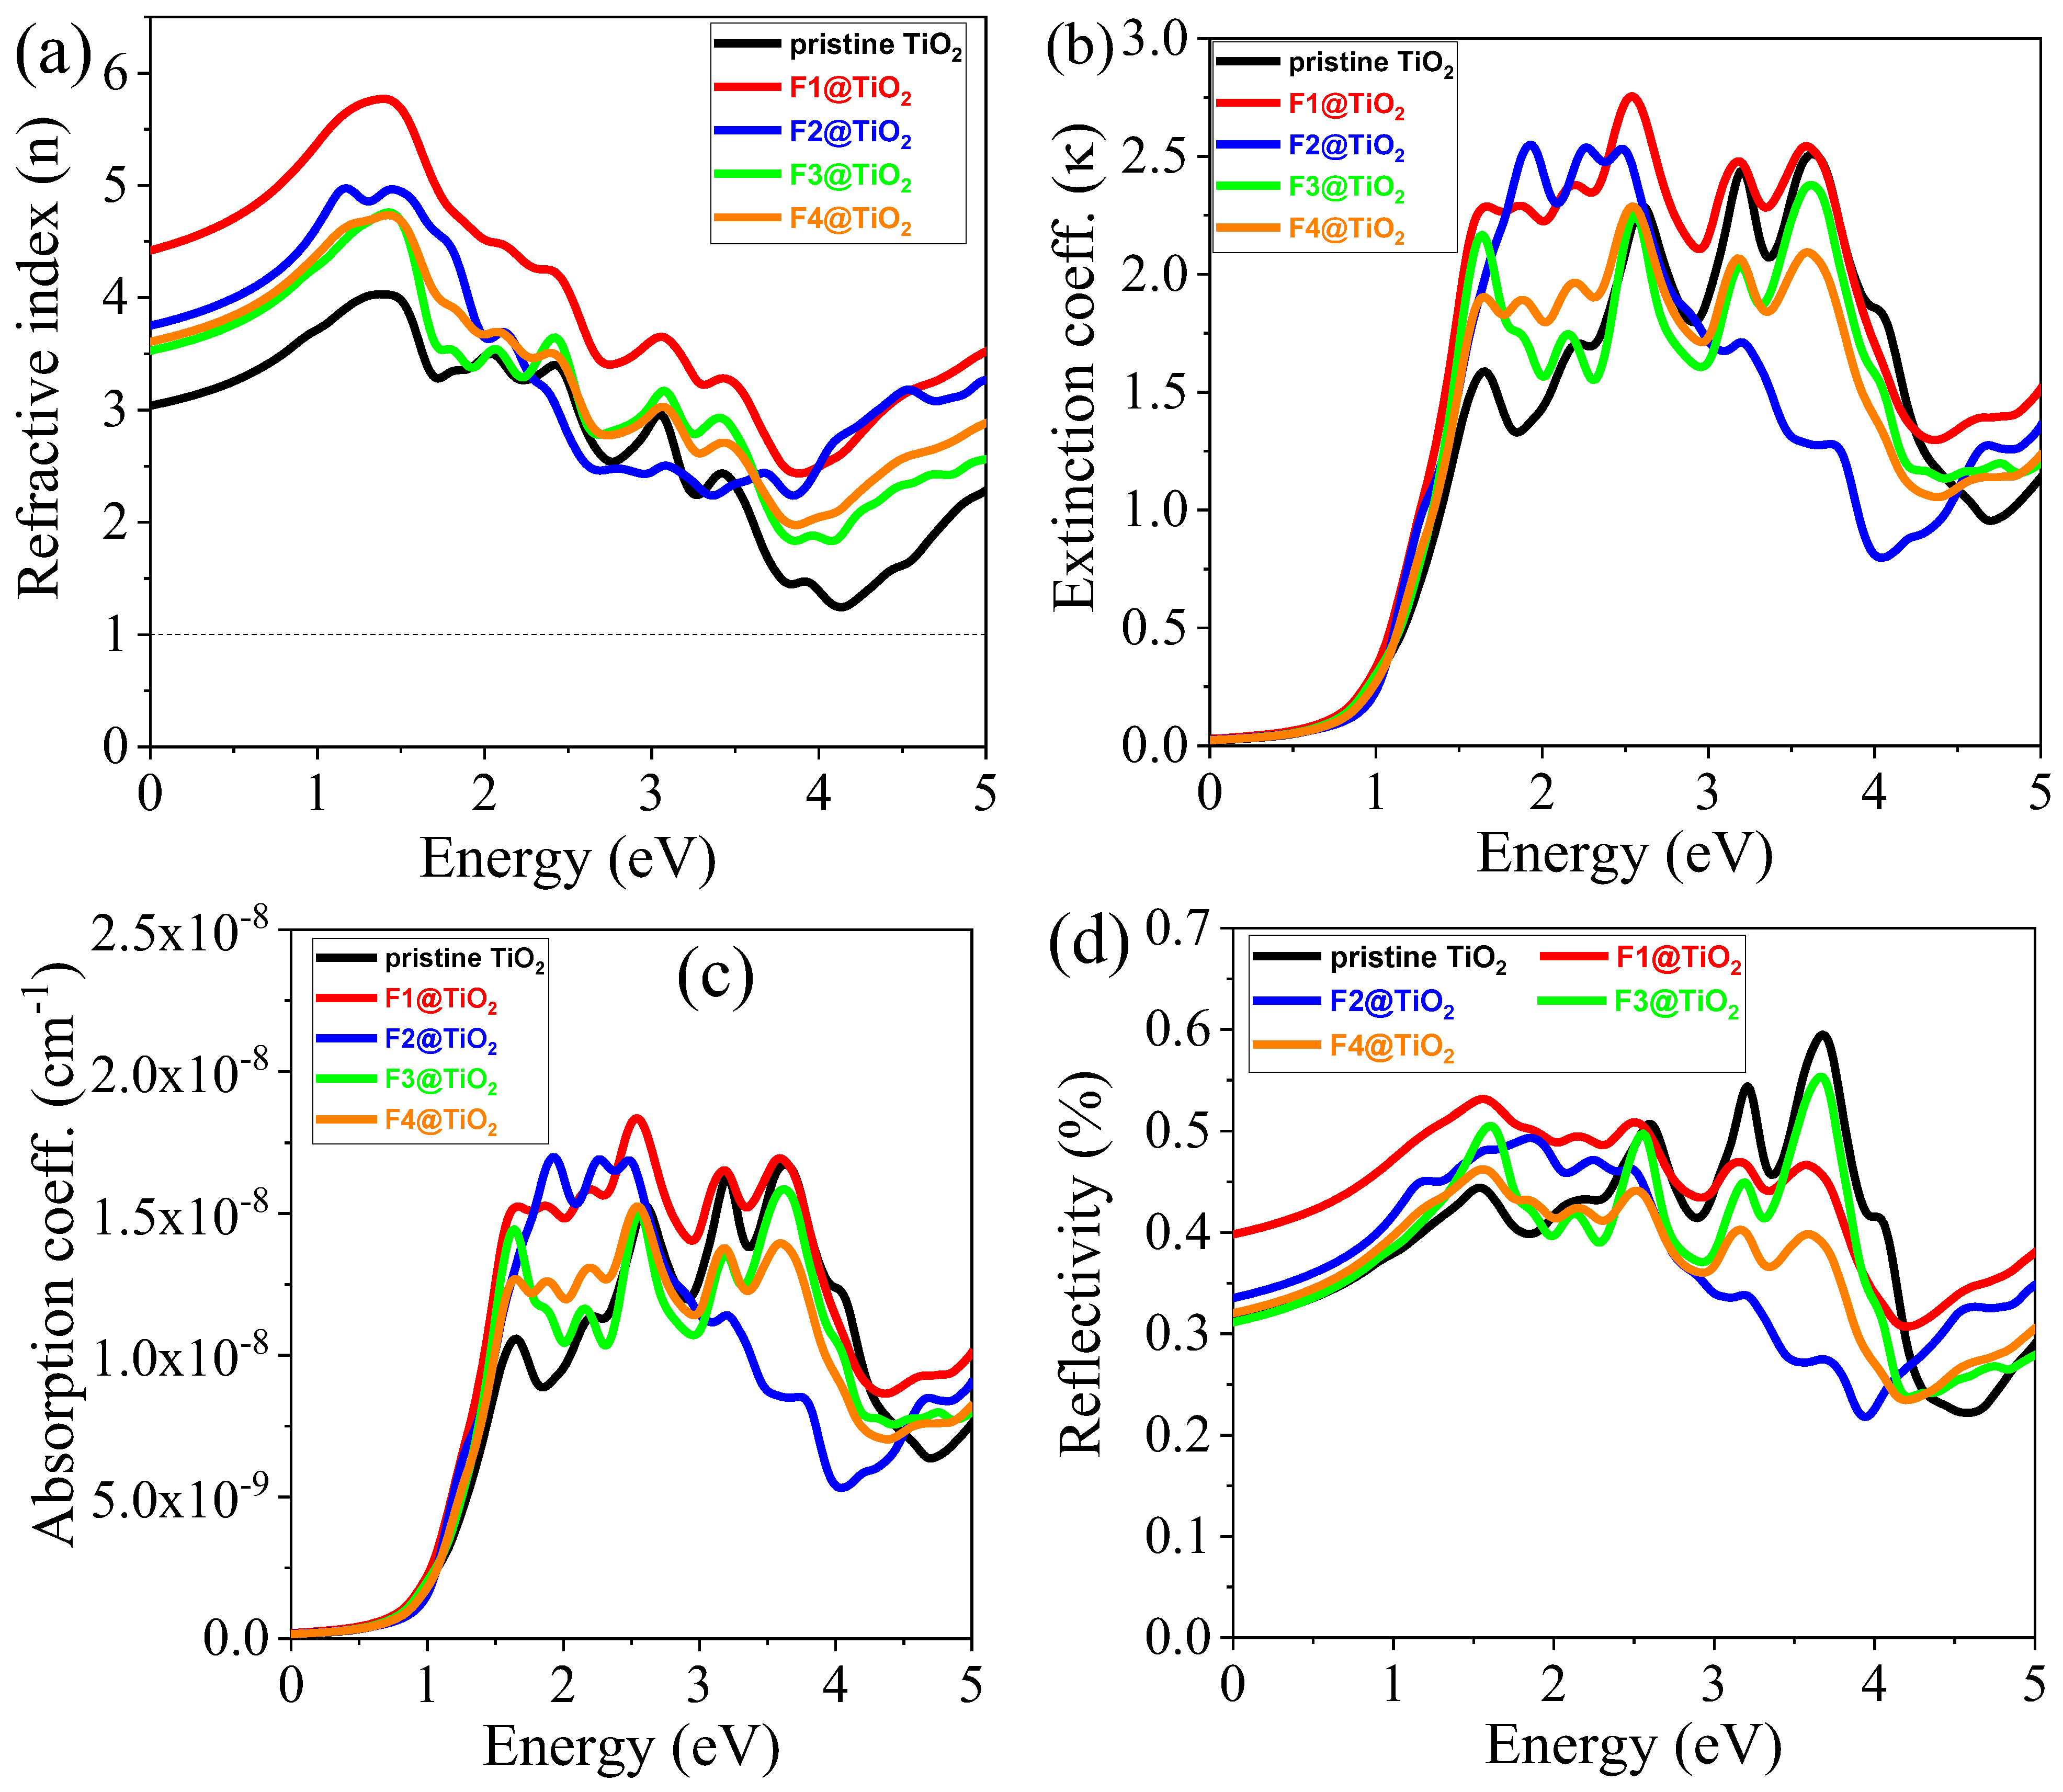
3.5.2. Refractive Index (n)
3.5.3. Extinction Coefficient ()
3.5.4. Absorption Coefficient (α)
3.5.5. Reflectivity (R)
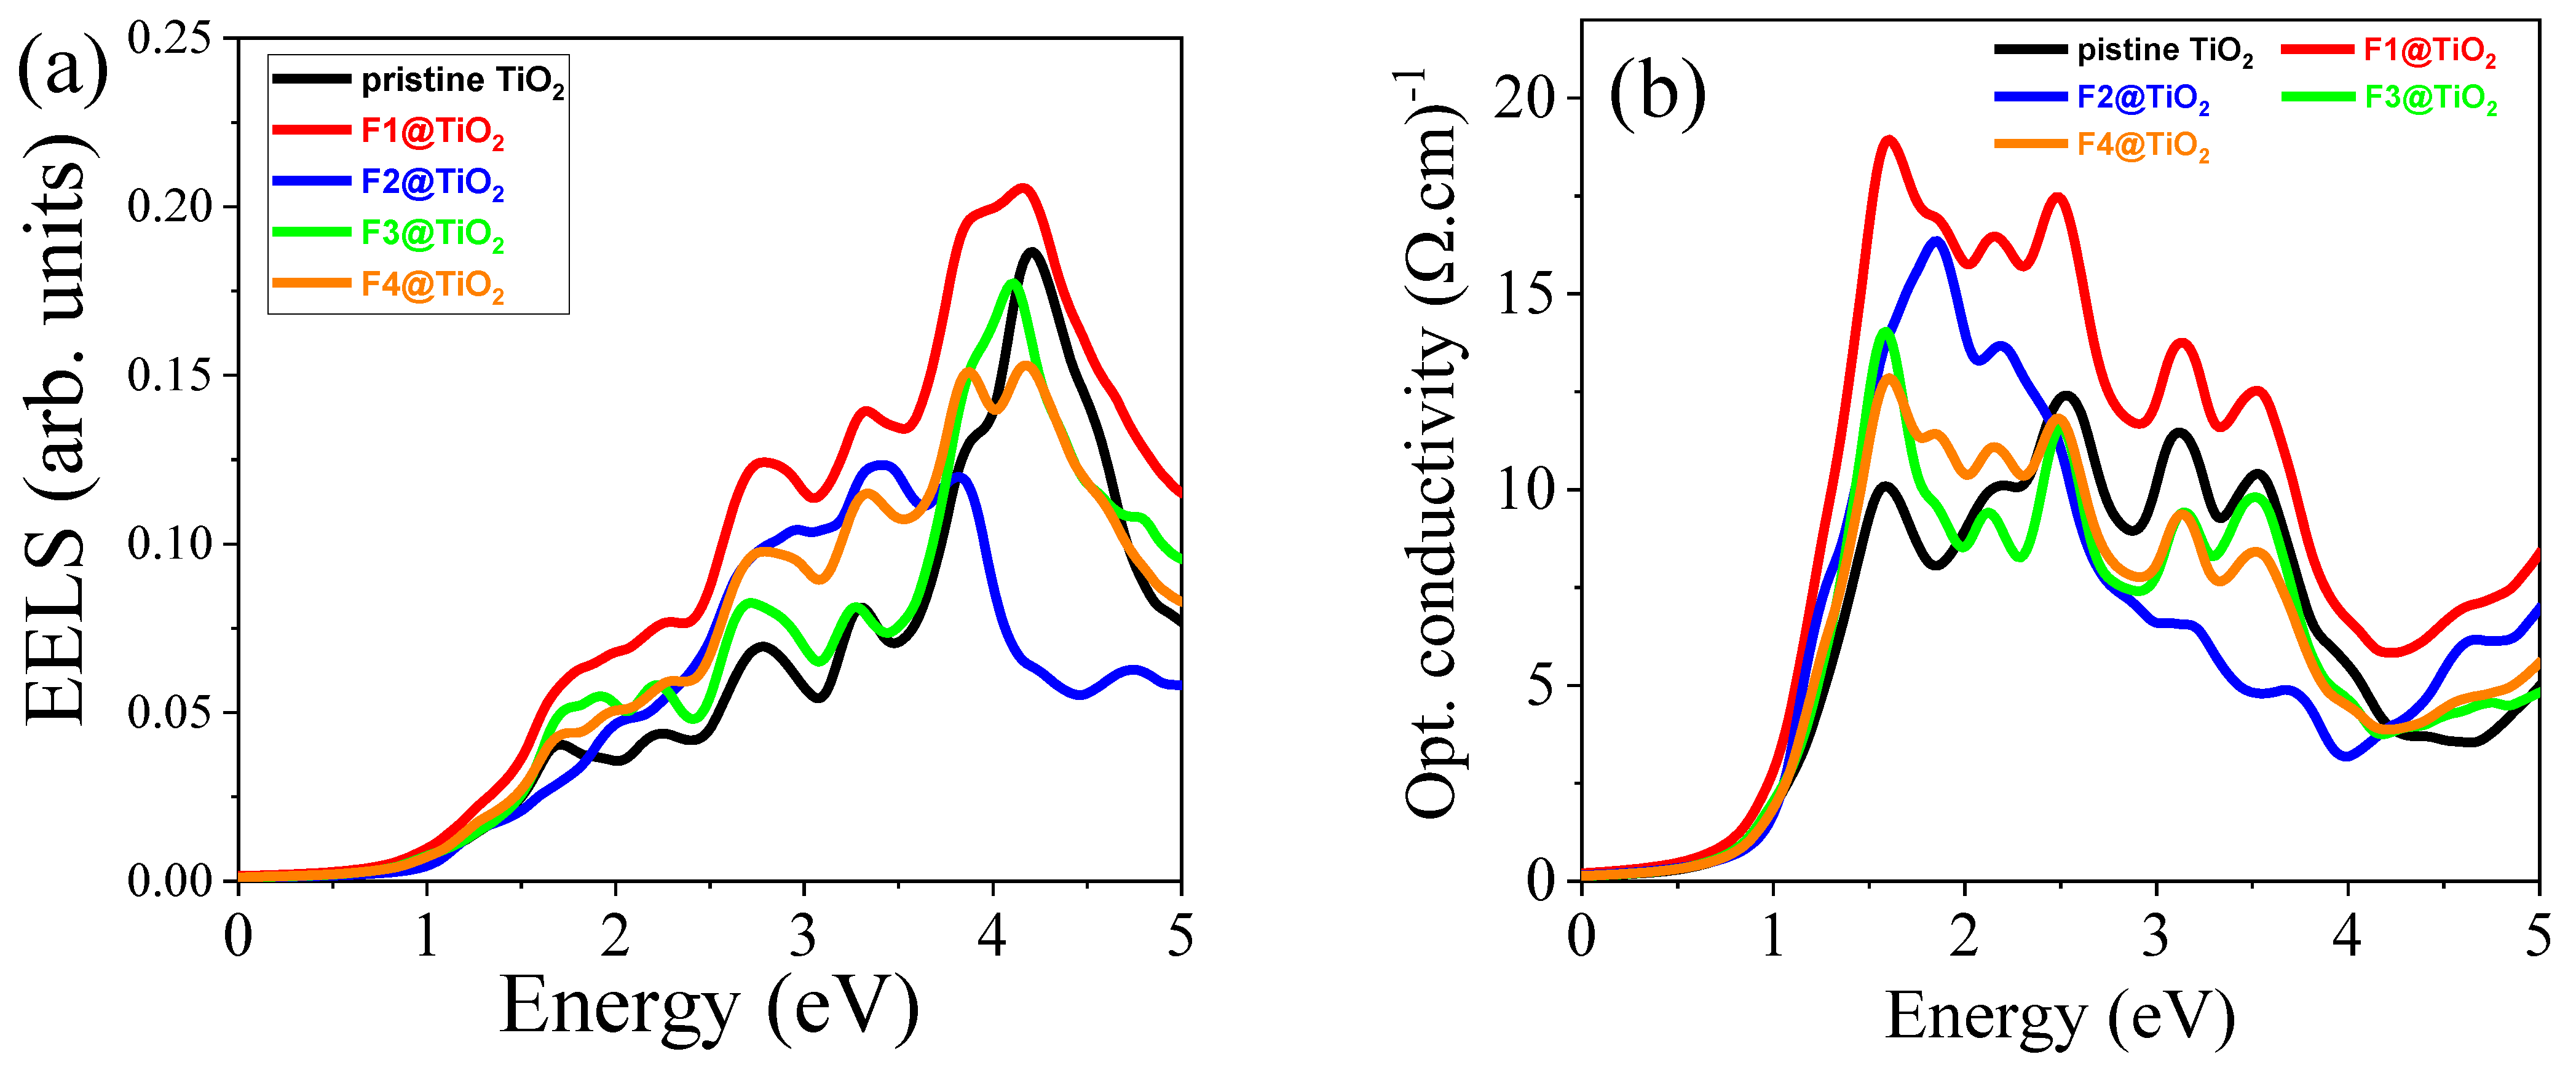
3.5.6. Electron Energy Loss Spectrum (EELS)
3.5.7. Optical Conductivity (σ)
3.6. Photocatalytic Activity
Mechanism of Photocatalytic Wastewater Treatment
3.7. Experimental Recommendation
4. Conclusions
Author Contributions
Funding
Data Availability Statement
Acknowledgments
Conflicts of Interest
References
- Bellotti, V.; Daldossi, C.; Perilli, D.; D’Arienzo, M.; Stredansky, M.; Di Valentin, C.; Simonutti, R. Mechanism of sustainable photocatalysis based on doped-titanium dioxide nanoparticles for UV to visible light induced PET-RAFT photo-polymerization. J. Catal. 2023, 428, 115074. [Google Scholar] [CrossRef]
- Petrone, A.; Perrella, F.; Coppola, F.; Crisci, L.; Donati, G.; Cimino, P.; Rega, N. Ultrafast photo-induced processes in complex environments: The role of accuracy in excited-state energy potentials and initial conditions. Chem. Phys. Rev. 2022, 3, 021307. [Google Scholar] [CrossRef]
- Perrella, F.; Petrone, A.; Rega, N. Understanding Charge Dynamics in Dense Electronic Manifolds in Complex Environments. J. Chem. Theory Comput. 2023, 19, 626–639. [Google Scholar] [CrossRef] [PubMed]
- Coppola, F.; Cimino, P.; Petrone, A.; Rega, N. Evidence of Excited-State Vibrational Mode Governing the Photorelaxation of a Charge-Transfer Complex. J. Phys. Chem. A 2024, 128, 1620–1633. [Google Scholar] [CrossRef]
- Carp, O.; Huisman, C.L.; Reller, A. Photoinduced reactivity of titanium dioxide. Prog. Solid State Chem. 2004, 32, 33–177. [Google Scholar] [CrossRef]
- Gonçalves, M.C.; Pereira, J.C.; Matos, J.C.; Vasconcelos, H.C. Photonic Band Gap and Bactericide Performance of Amorphous Sol-Gel Titania: An Alternative to Crystalline TiO2. Molecules 2018, 23, 1677. [Google Scholar] [CrossRef]
- Berardo, E.; Hu, H.S.; Van Dam, H.J.J.; Shevlin, S.A.; Woodley, S.M.; Kowalski, K.; Zwijnenburg, M.A. Describing excited state relaxation and localization in TiO2 nanoparticles using TD-DFT. J. Chem. Theory Comput. 2014, 10, 5538–5548. [Google Scholar] [CrossRef]
- Batalović, K.; Bundaleski, N.; Radaković, J.; Abazović, N.; Mitrić, M.; Silva, R.A.; Savić, M.; Belošević-Čavor, J.; Rakočević, Z.; Rangel, C.M. Modification of N-doped TiO2 photocatalysts using noble metals (Pt, Pd)—A combined XPS and DFT study. Phys. Chem. Chem. Phys. 2017, 19, 7062–7071. [Google Scholar] [CrossRef]
- Di Liberto, G.; Tosoni, S.; Pacchioni, G. Nitrogen doping in coexposed (001)-(101) anatase TiO2 surfaces: A DFT study. Phys. Chem. Chem. Phys. 2019, 21, 21497–21505. [Google Scholar] [CrossRef]
- Grätzel, M. Dye-sensitized solar cells. J. Photochem. Photobiol. C Photochem. Rev. 2003, 4, 145–153. [Google Scholar] [CrossRef]
- Hagfeldt, A.; Boschloo, G.; Sun, L.; Kloo, L.; Pettersson, H. Dye-sensitized solar cells. Chem. Rev. 2010, 110, 6595–6663. [Google Scholar] [CrossRef] [PubMed]
- Nazeeruddin, M.K.; Baranoff, E.; Grätzel, M. Dye-sensitized solar cells: A brief overview. Sol. Energy 2011, 85, 1172–1178. [Google Scholar] [CrossRef]
- Etafa Tasisa, Y.; Kumar Sarma, T.; Krishnaraj, R.; Sarma, S. Band gap engineering of titanium dioxide (TiO2) nanoparticles prepared via green route and its visible light driven for environmental remediation. Results Chem. 2024, 11, 101850. [Google Scholar] [CrossRef]
- Subalakshmi, K.; Senthilselvan, J. Effect of fluorine-doped TiO2 photoanode on electron transport, recombination dynamics and improved DSSC efficiency. Sol. Energy 2018, 171, 914–928. [Google Scholar] [CrossRef]
- Diao, W.; Xu, J.; Rao, X.; Zhang, Y. Facile Synthesis of Fluorine Doped Rutile TiO2 Nanorod Arrays for Photocatalytic Removal of Formaldehyde. Catal. Letters 2022, 152, 1029–1039. [Google Scholar] [CrossRef]
- Tosoni, S.; Lamiel-Garcia, O.; Fernandez Hevia, D.; Doña, J.M.; Illas, F. Electronic structure of f-doped bulk rutile, anatase, and brookite polymorphs of TiO2. J. Phys. Chem. C 2012, 116, 12738–12746. [Google Scholar] [CrossRef]
- Miyoshi, A.; Kuwabara, A.; Maeda, K. Effects of Nitrogen/Fluorine Codoping on Photocatalytic Rutile TiO2 Crystal Studied by First-Principles Calculations. Inorg. Chem. 2021, 60, 2381–2389. [Google Scholar] [CrossRef]
- Salehi-Abar, P.; Kazempour, A. Effect of N and F doping on the electronic properties of rutile TiO2 quantum dot solar cells: A first principle study. Chem. Phys. Lett. 2017, 673, 56–61. [Google Scholar] [CrossRef]
- Zhao, A.; Xiao, X.; Hu, Z.-T.; Zhu, W.; Yang, J.; Yang, E.-H. Multifunctional F-doped TiO2 PCM microcapsules for visible-light-driven photocatalysis and latent heat storage. Appl. Energy 2024, 359, 122674. [Google Scholar] [CrossRef]
- Lin, X.; Rong, F.; Fu, D.; Yuan, C. Enhanced photocatalytic activity of fluorine doped TiO2 by loaded with Ag for degradation of organic pollutants. Powder Technol. 2012, 219, 173–178. [Google Scholar] [CrossRef]
- Trapalis, C.; Todorova, N.; Giannakopoulou, T.; Romanos, G.; Vaimakis, T.; Yu, J. Preparation of fluorine-doped TiO2 photocatalysts with controlled crystalline structure. Int. J. Photoenergy 2008, 2008, 534038. [Google Scholar] [CrossRef]
- Díez, A.M.; Núñez, I.; Pazos, M.; Sanromán, M.Á.; Kolen’ko, Y.V. Fluoride-Doped TiO2 Photocatalyst with Enhanced Activity for Stable Pollutant Degradation. Catalysts 2022, 12, 1190. [Google Scholar] [CrossRef]
- Fittipaldi, M.; Gombac, V.; Gasparotto, A.; Deiana, C.; Adami, G.; Barreca, D.; Montini, T.; Martra, G.; Gatteschi, D.; Fornasiero, P. Synergistic role of B and F dopants in promoting the photocatalytic activity of rutile TiO2. ChemPhysChem 2011, 12, 2221–2224. [Google Scholar] [CrossRef] [PubMed]
- Gueorguiev, G.K.; Goyenola, C.; Schmidt, S.; Hultman, L. CFx: A first-principles study of structural patterns arising during synthetic growth. Chem. Phys. Lett. 2011, 516, 62–67. [Google Scholar] [CrossRef]
- Goyenola, C.; Lai, C.C.; Näslund, L.Å.; Lu, J.; Högberg, H.; Hultman, L.; Rosen, J.; Gueorguiev, G.K. Theoretical prediction and synthesis of CSxF<sub>y</sub thin films. J. Phys. Chem. C 2016, 120, 9527–9534. [Google Scholar] [CrossRef]
- Giannozzi, P.; Andreussi, O.; Brumme, T.; Bunau, O.; Buongiorno Nardelli, M.; Calandra, M.; Car, R.; Cavazzoni, C.; Ceresoli, D.; Cococcioni, M.; et al. Advanced capabilities for materials modelling with Quantum ESPRESSO. J. Phys. Condens. Matter 2017, 29, 465901. [Google Scholar] [CrossRef]
- Perdew, J.P.; Burke, K.; Ernzerhof, M. Generalized Gradient Approximation Made Simple. Phys. Rev. Lett. 1996, 77, 3865–3868. [Google Scholar] [CrossRef] [PubMed]
- Meagher, E.P.; Lager, G.A. Polyhedral thermal expansion in the TiO2 polymorphs; refinement of the crystal structures of rutile and brookite at high temperature. Can. Miner. 1979, 17, 77–85. [Google Scholar]
- Kokalj, A. XCrySDen-a new program for displaying crystalline structures and electron densities. J. Mol. Graph. Model. 1999, 17, 176–179. [Google Scholar] [CrossRef]
- Momma, K.; Izumi, F. VESTA 3 for three-dimensional visualization of crystal, volumetric and morphology data. J. Appl. Crystallogr. 2011, 44, 1272–1276. [Google Scholar] [CrossRef]
- Geldasa, F.T.; Kebede, M.A.; Hone, F.G.; Jira, E.T. Influence of non-metals doping on the structural, electronic, optical, and photocatalytic properties of rutile TiO2 based on density functional theory computations. Comput. Condens. Matter 2024, 41, e00970. [Google Scholar] [CrossRef]
- Geldasa, F.T.; Kebede, M.A.; Shura, M.W.; Hone, F.G. Different metal dopants effects on the structural, electronic, and optical properties of β-PbO: A density functional theory study. Eur. Phys. J. Plus 2023, 138, 165. [Google Scholar] [CrossRef]
- Gonzalez Szwacki, N.; Fabrykiewicz, P.; Sosnowska, I.; Fauth, F.; Suard, E.; Przeniosło, R. Orthorhombic Symmetry and Anisotropic Properties of Rutile TiO2. J. Phys. Chem. C 2023, 127, 19240–19249. [Google Scholar] [CrossRef]
- Zhang, J.; Zhou, P.; Liu, J.; Yu, J. New understanding of the difference of photocatalytic activity among anatase, rutile and brookite TiO2. Phys. Chem. Chem. Phys. 2014, 16, 20382–20386. [Google Scholar] [CrossRef]
- Natarajan, T.S.; Mozhiarasi, V.; Tayade, R.J. Nitrogen Doped Titanium Dioxide (N-TiO2): Synopsis of Synthesis Methodologies, Doping Mechanisms, Property Evaluation and Visible Light Photocatalytic Applications. Photochem 2021, 1, 371–410. [Google Scholar] [CrossRef]
- Long, R.; Dai, Y.; Huang, B. Structural and electronic properties of iodine-doped anatase and rutile TiO2. Comput. Mater. Sci. 2009, 45, 223–228. [Google Scholar] [CrossRef]
- Santos-Aguilar, P.; Bernal-Ramírez, J.; Vázquez-Garza, E.; Vélez-Escamilla, L.Y.; Lozano, O.; García-Rivas, G.D.; Contreras-Torres, F.F. Synthesis and Characterization of Rutile TiO2 Nanoparticles for the Toxicological Effect on the H9c2 Cell Line from Rats. ACS Omega 2023, 8, 19024–19036. [Google Scholar] [CrossRef]
- Chen, H.; Li, X.; Wan, R.; Kao-Walter, S.; Lei, Y. A DFT study of the electronic structures and optical properties of (Cr, C) co-doped rutile TiO2. Chem. Phys. 2018, 501, 60–67. [Google Scholar] [CrossRef]
- Ullah, H.; Noor-A-Alam, M.; Kim, H.J.; Shin, Y.H. Influences of vacancy and doping on electronic and magnetic properties of monolayer SnS. J. Appl. Phys. 2018, 124, 065102. [Google Scholar] [CrossRef]
- Bairy, R.; Patil, P.S.; Maidur, S.R.; Vijeth, H.; Murari, M.S.; Bhat, U.K. The role of cobalt doping in tuning the band gap, surface morphology and third-order optical nonlinearities of ZnO nanostructures for NLO device applications. RSC Adv. 2019, 9, 22302–22312. [Google Scholar] [CrossRef]
- El Hallani, G.; Khuili, M.; Fazouan, N.; Liba, A.; Abou El Makarim, H.; Atmani, E.H. Experimental and DFT investigations of Al-doped ZnO nanostructured thin films. Chem. Phys. Impact 2024, 8, 100648. [Google Scholar] [CrossRef]
- Geldasa, F.T.; Kebede, M.; Shura, M.W.; Andoshe, D.M.; Tegegne, N.; Gashaw Hone, F. Facile synthesis of different metals doped α-PbO nanoparticles for photocatalytic degradation of Methylene Blue dye. Phys. Scr 2023, 98, 065701. [Google Scholar] [CrossRef]
- Saha, M.; Ghosh, S.; Ashok, V.D.; De, S.K. Carrier concentration dependent optical and electrical properties of Ga doped ZnO hexagonal nanocrystals. Phys. Chem. Chem. Phys. 2015, 17, 16067–16079. [Google Scholar] [CrossRef] [PubMed]
- Yao, W.; Li, D.; Wei, S.; Liu, X.; Liu, X.; Wang, W. Density Functional Theory Study on the Enhancement Mechanism of the Photocatalytic Properties of the g-C3N4/BiOBr(001) Heterostructure. ACS Omega 2022, 7, 36479–36488. [Google Scholar] [CrossRef] [PubMed]
- Geldasa, F.T. The structural, electronic, and optical properties of metals doped litharge PbO: A density functional theory study. Eur. Phys. J. B 2024, 97, 78. [Google Scholar] [CrossRef]
- Chiodo, L.; García-Lastra, J.M.; Iacomino, A.; Ossicini, S.; Zhao, J.; Petek, H.; Rubio, A. Self-energy and excitonic effects in the electronic and optical properties of TiO2 crystalline phases. Phys. Rev. B-Condens. Matter Mater. Phys. 2010, 82, 045207. [Google Scholar] [CrossRef]
- Gurkan, Y.Y.; Kasapbasi, E.; Cinar, Z. Enhanced solar photocatalytic activity of TiO2 by selenium(IV) ion-doping: Characterization and DFT modeling of the surface. Chem. Eng. J. 2013, 214, 34–44. [Google Scholar] [CrossRef]
- Rana, M.Z.; Munshi, M.R.; Al Masud, M.; Zahan, M.S. Structural, electronic, optical and thermodynamic properties of AlAuO2 and AlAu094Fe006O2 compounds scrutinized by density functional theory (DFT). Heliyon 2023, 9, e21405. [Google Scholar] [CrossRef]
- Jouybar, S.; Naji, L.; Sarabadani Tafreshi, S.; de Leeuw, N.H. A Density Functional Theory Study of the Physico-Chemical Properties of Alkali Metal Titanate Perovskites for Solar Cell Applications. Molecules 2024, 29, 3355. [Google Scholar] [CrossRef]
- Soussi, A.; Ait Hssi, A.; Boujnah, M.; Boulkadat, L.; Abouabassi, K.; Asbayou, A.; Elfanaoui, A.; Markazi, R.; Ihlal, A.; Bouabid, K. Electronic and Optical Properties of TiO2 Thin Films: Combined Experimental and Theoretical Study. J. Electron. Mater. 2021, 50, 4497–4510. [Google Scholar] [CrossRef]
- Heiba, Z.K.; Mohamed, M.B.; Wahba, A.M. Structural, optical, mechanical, and electronic properties of Cr-doped alumina. J. Mater. Sci. Mater. Electron. 2020, 31, 14645–14657. [Google Scholar] [CrossRef]
- Samat, M.H.; Ali, A.M.M.; Taib, M.F.M.; Hassan, O.H.; Yahya, M.Z.A. Hubbard U calculations on optical properties of 3d transition metal oxide TiO2. Results Phys. 2016, 6, 891–896. [Google Scholar] [CrossRef]
- Rasul, S.M.; Saber, D.R.; Aziz, S.B. Role of Titanium replacement with Pd atom on band gap reduction in the anatase Titanium Dioxide: First-Principles calculation approach. Results Phys. 2022, 38, 105688. [Google Scholar] [CrossRef]
- Yasin Ahmed, T.; Aziz, S.B.; Dannoun, E.M.A. New photocatalytic materials based on alumina with reduced band gap: A DFT approach to study the band structure and optical properties. Heliyon 2024, 10, e27029. [Google Scholar] [CrossRef]
- Basera, P.; Saini, S.; Bhattacharya, S. Self-energy and excitonic effect in (un)doped TiO2 anatase: A comparative study of hybrid DFT, GW and BSE to explore optical properties. J. Mater. Chem. C 2019, 7, 14284–14293. [Google Scholar] [CrossRef]
- Nwanya, A.C.; Ugwuoke, P.E.; Ezekoye, B.A.; Osuji, R.U.; Ezema, F.I. Structural and Optical Properties of Chemical Bath Deposited Silver Oxide Thin Films: Role of Deposition Time. Adv. Mater. Sci. Eng. 2013, 2013, 2–8. [Google Scholar] [CrossRef]
- Geldasa, F.T.; Dejene, F.B. Effects of S Doping and Oxygen Vacancy on the Physical Properties of Rutile TiO2 for Photocatalysis Applications Based on Density Functional Theory Study. Materials 2025, 18, 1688. [Google Scholar] [CrossRef]
- Xie, W.; Li, R.; Xu, Q. Enhanced photocatalytic activity of Se-doped TiO2 under visible light irradiation. Sci. Rep. 2018, 8, 8752. [Google Scholar] [CrossRef]
- Tian, D.; Zeng, C.; Fu, Y.; Luo, H.; Xiang, C.; Li, K.; Zhu, X. A DFT study of the structural, electronic and optical properties of transition metal doped fluorite oxides: Ce0.75M0.25O2 (M=Fe, Co, Ni). Solid State Commun. 2016, 231–232, 68–79. [Google Scholar] [CrossRef]
- Lin, Y.; Shi, H.; Jiang, Z.; Wang, G.; Zhang, X.; Zhu, H.; Zhang, R.; Zhu, C. Enhanced optical absorption and photocatalytic H2 production activity of g-C3N4/TiO2 heterostructure by interfacial coupling: A DFT+U study. Int. J. Hydrogen Energy 2017, 42, 9903–9913. [Google Scholar] [CrossRef]
- Geldasa, F.T.; Kebede, M.A.; Shura, M.W.; Hone, F.G. Experimental and computational study of metal oxide nanoparticles for the photocatalytic degradation of organic pollutants: A review. RSC Adv. 2023, 13, 18404–18442. [Google Scholar] [CrossRef] [PubMed]
- Umadevi, M.; Parimaladevi, R.; Sangari, M. Synthesis, characterization and photocatalytic activity of fluorine doped TiO2 nanoflakes synthesized using solid state reaction method. Spectrochim. Acta-Part A Mol. Biomol. Spectrosc. 2014, 120, 365–369. [Google Scholar] [CrossRef] [PubMed]
- Negi, C.; Kandwal, P.; Rawat, J.; Sharma, M.; Sharma, H.; Dalapati, G.; Dwivedi, C. Carbon-doped titanium dioxide nanoparticles for visible light driven photocatalytic activity. Appl. Surf. Sci. 2021, 554, 149553. [Google Scholar] [CrossRef]
- Kuo, C.Y.; Hsiao, H.M. Preparation of iodine doped titanium dioxide to photodegrade aqueous bisphenol A under visible light. Process Saf. Environ. Prot. 2015, 95, 265–270. [Google Scholar] [CrossRef]
- Niu, P.; Wu, G.; Chen, P.; Zheng, H.; Cao, Q.; Jiang, H. Optimization of Boron Doped TiO2 as an Efficient Visible Light-Driven Photocatalyst for Organic Dye Degradation With High Reusability. Front. Chem. 2020, 8, 172. [Google Scholar] [CrossRef]
- Wang, W.K.; Chen, J.J.; Gao, M.; Huang, Y.X.; Zhang, X.; Yu, H.Q. Photocatalytic degradation of atrazine by boron-doped TiO2 with a tunable rutile/anatase ratio. Appl. Catal. B Environ. 2016, 195, 69–76. [Google Scholar] [CrossRef]
- Cheng, X.; Yu, X.; Xing, Z.; Yang, L. Synthesis and characterization of N-doped TiO2 and its enhanced visible-light photocatalytic activity. Arab. J. Chem. 2016, 9, S1706–S1711. [Google Scholar] [CrossRef]
- Mizukoshi, Y.; Ohtsu, N.; Semboshi, S.; Masahashi, N. Visible light responses of sulfur-doped rutile titanium dioxide photocatalysts fabricated by anodic oxidation. Appl. Catal. B Environ. 2009, 91, 152–156. [Google Scholar] [CrossRef]


| Materials | Pure TiO2 | F1@TiO2 | F2@TiO2 | F3@TiO2 | F4@TiO2 | |
|---|---|---|---|---|---|---|
| Lattice constants (Å) Present work | a = b | 4.610 | 4.626 | 4.639 | 4.657 | 4.671 |
| c | 2.975 | 3.012 | 3.042 | 3.074 | 3.105 | |
| Lattice constants (Å) Other DFT work | a = b | 4.637 a | -- | -- | -- | -- |
| c | 2.989 a | -- | -- | -- | -- | |
| Experiment | a = b | 4.600 b | -- | -- | -- | -- |
| c | 2.959 b | -- | -- | -- | -- | |
| Volume (Å)3 | 62.91 | 64.15 | 64.87 | 65.38 | 66.46 | |
| Compounds | Bond Length (Å) | Bond Angle (°) | Formation Energy (eV) |
|---|---|---|---|
| Pure TiO2 | Ti-O = 1.9518 | O-Ti-O = 90 | |
| F1@TiO2 | Ti-O = 1.9520 Ti-F = 1.9799 | O-Ti-O = 90 F-Ti-O = 89.91 | −2.73 |
| F2@TiO2 | Ti-O = 1.9522 Ti-F = 2.0026 | O-Ti-O = 90 F-Ti-O = 88.1 | −2.91 |
| F3@TiO2 | Ti-O = 1.9527 Ti-F = 2.0036 | O-Ti-O = 90 F-Ti-O = 85.91 | −3.35 |
| F4@TiO2 | Ti-O = 1.9530 Ti-F = 2.0062 | O-Ti-O = 90 F-Ti-O = 81.16 | −3.68 |
| Material | ||||||
|---|---|---|---|---|---|---|
| Pure TiO2 | 12.54 | 3.01 | 0.33 | 0.19 | 1.62 | 12.40 |
| F1@TiO2 | 19.55 | 4.42 | 0.39 | 0.21 | 1.84 | 18.95 |
| F2@TiO2 | 14.08 | 3.75 | 0.34 | 0.12 | 1.70 | 16.36 |
| F3@TiO2 | 12.46 | 3.52 | 0.31 | 0.18 | 1.53 | 14.04 |
| F4@TiO2 | 13.03 | 3.60 | 0.32 | 0.15 | 1.51 | 12.86 |
| Material | Experimental Method | Bandgap (eV) | Light Irradiated | Pollutants | Degradation Efficiency | Ref. |
|---|---|---|---|---|---|---|
| F-doped TiO2 | Sol–gel | 3.19 | Visible light | Methylene blue | K = 0.00542 | [20] |
| Ag/F-TiO2 | Sol–gel | 2.35 | Visible light | Methylene blue | K = 0.0189 | [20] |
| Pure TiO2 | Sol–gel | 3.07 | UV-vis | Acetone | Lower | [21] |
| F-doped TiO2 | Sol–gel | 3.03 | UV-vis | Acetone | Higher | [21] |
| Pure TiO2 | One-step synthesis | 3.0 | Visible light | Bisphenol A | Lower than doped | [22] |
| F-doped TiO2 | One-step synthesis | 1.5 | Visible light | Bisphenol A | 98% | [22] |
| Pure TiO2 | Solid state reaction | 3.09 | UV | Methyl orange | K = 0.0042 | [62] |
| F-doped TiO2 | Solid state reaction | 2.85 | UV | Methyl orange | K = 0.0433 | [62] |
| Pure TiO2 | Sol–gel | 2.96 | Visible light | Methylene blue | Lower | [63] |
| C-doped TiO2 | Sol–gel | 2.37 | Visible light | Methylene blue | K = 0.04513 | [63] |
| Pure TiO2 | Sol–gel | 3.01 | Visible light | Bisphenol A | K = 1.61 | [64] |
| I-doped TiO2 | Sol–gel | 3.04 | Visible light | Bisphenol A | K = 5.11 | [64] |
| B-doped TiO2 | Co-precipitation | 2.85 | Visible light | Rhodamine B | Enhanced | [65] |
| B-doped TiO2 | One-step calcination | UV-visible | Atrazine | 95% | [66] | |
| Pure TiO2 | Decomposition | 3.1 | Visible light | Rhodamine B | 15% | [67] |
| N-doped TiO2 | Decomposition | 2.85 | Visible light | Rhodamine B | 90.3% | [67] |
| S-doped TiO2 | Anodic oxidation | Visible light | Methylene blue | Enhanced | [68] |
Disclaimer/Publisher’s Note: The statements, opinions and data contained in all publications are solely those of the individual author(s) and contributor(s) and not of MDPI and/or the editor(s). MDPI and/or the editor(s) disclaim responsibility for any injury to people or property resulting from any ideas, methods, instructions or products referred to in the content. |
© 2025 by the authors. Licensee MDPI, Basel, Switzerland. This article is an open access article distributed under the terms and conditions of the Creative Commons Attribution (CC BY) license (https://creativecommons.org/licenses/by/4.0/).
Share and Cite
Geldasa, F.T.; Dejene, F.B. Influence of Fluorine Doping on Rutile TiO2 Nanostructures for Visible-Light-Driven Photocatalysis: A DFT + U Study. Nanomaterials 2025, 15, 694. https://doi.org/10.3390/nano15090694
Geldasa FT, Dejene FB. Influence of Fluorine Doping on Rutile TiO2 Nanostructures for Visible-Light-Driven Photocatalysis: A DFT + U Study. Nanomaterials. 2025; 15(9):694. https://doi.org/10.3390/nano15090694
Chicago/Turabian StyleGeldasa, Fikadu Takele, and Francis Birhanu Dejene. 2025. "Influence of Fluorine Doping on Rutile TiO2 Nanostructures for Visible-Light-Driven Photocatalysis: A DFT + U Study" Nanomaterials 15, no. 9: 694. https://doi.org/10.3390/nano15090694
APA StyleGeldasa, F. T., & Dejene, F. B. (2025). Influence of Fluorine Doping on Rutile TiO2 Nanostructures for Visible-Light-Driven Photocatalysis: A DFT + U Study. Nanomaterials, 15(9), 694. https://doi.org/10.3390/nano15090694