

Analysis of Fluorescent Carbon Nanodots Synthesized from Spices Through Thermal Processes Treatment


 ,
,  , , and
Abstract

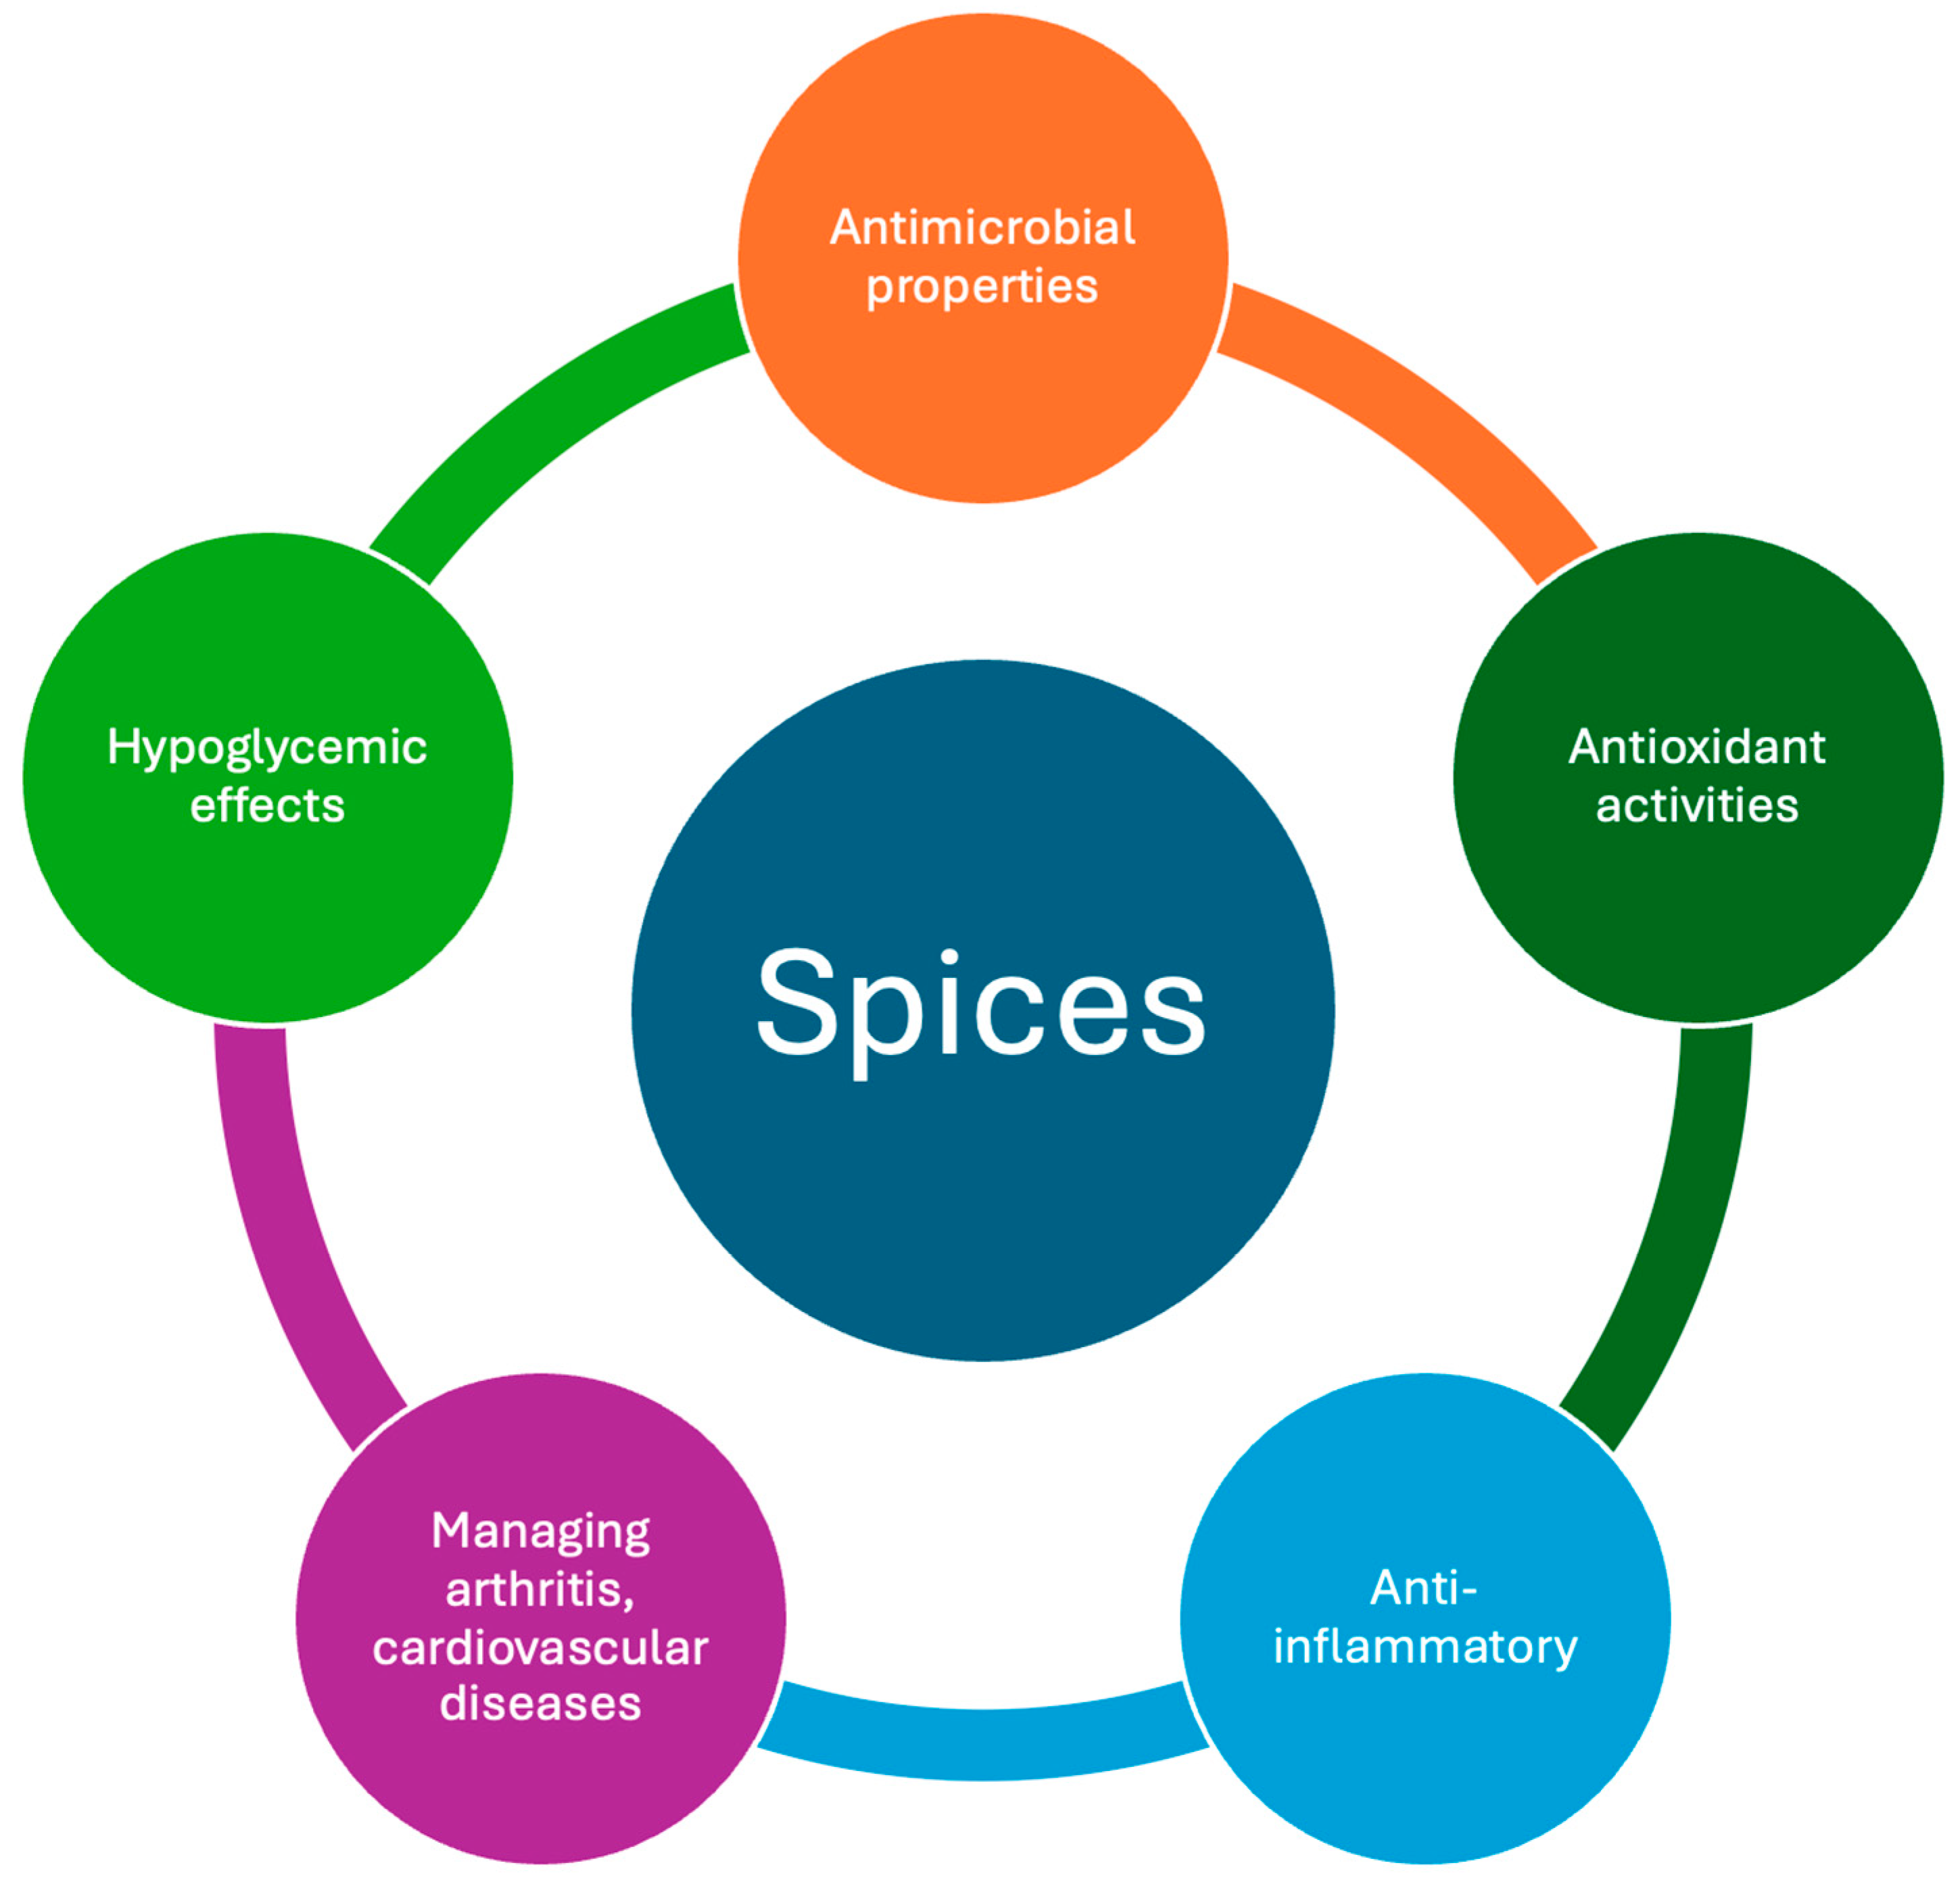
1. Introduction
2. Materials and Methods
2.1. Materials
- Icing sugar (70 µm)–AGRANA Zucker GmbH (Wien, Austria);
- Ground black pepper–Alpaka Kft. (Szeged, Hungary);
- Ground turmeric–Alpaka Kft. (Szeged, Hungary);
- Ground chili pepper–Alpaka Kft. (Szeged, Hungary);
- Ground ginger–Alpaka Kft. (Szeged, Hungary);
- Ground clove–Alpaka Kft. (Szeged, Hungary);
- Cysteine powder–Vital Trend Kft. (Budapest, Hungary);
- Dried baker’s yeast (König Units Kft., Balmazújváros, Hungary).
- Sodium-acetate-Spektrum 3D Kft. (Debrecen, Hungary);
- FeCl3•6H2O-VWR Chemicals BDH Kft. (Debrecen, Hungary);
- 2,4,6-tripyridyl-s-triazine–Sigma-Aldrich Kft. (Budapest, Hungary);
- Ascorbic acid-Molar Chemicals Kft. (Halásztelek, Hungary).
2.2. Methods
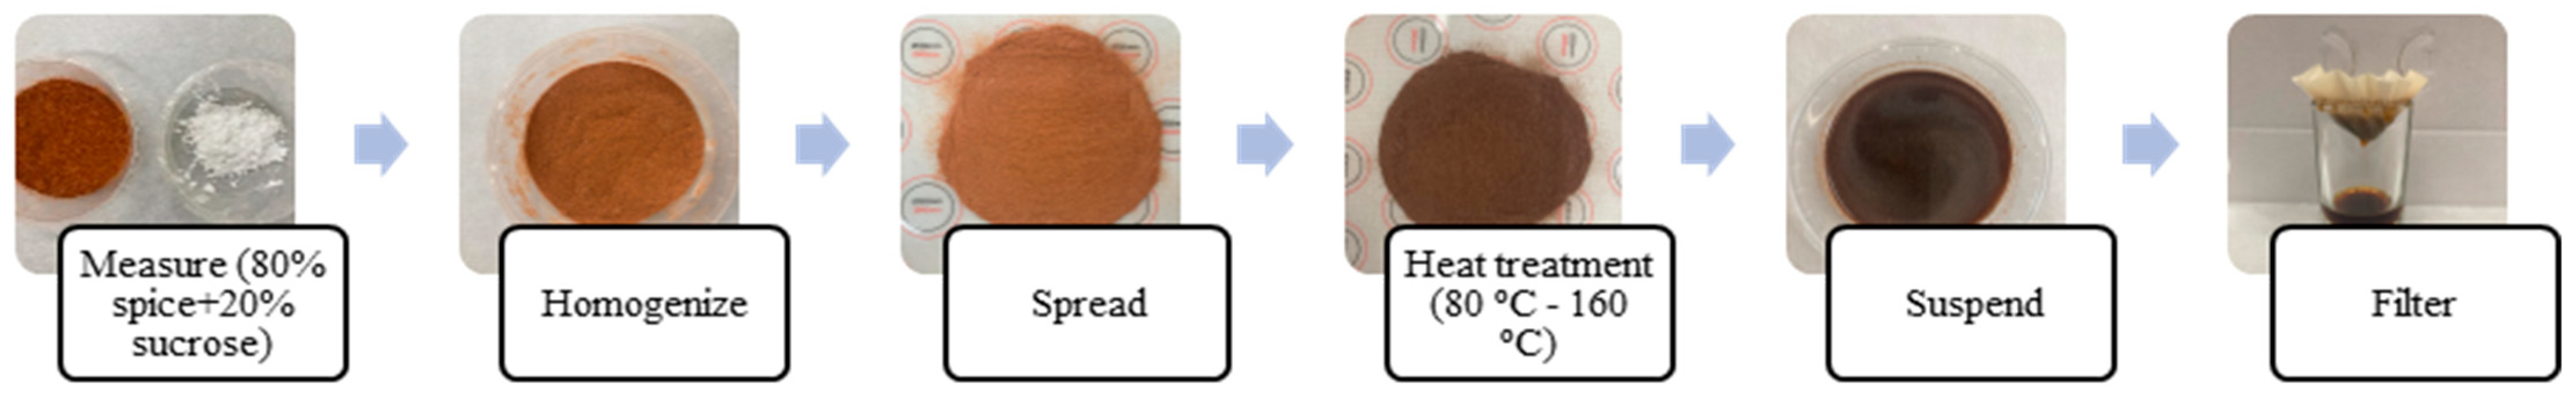
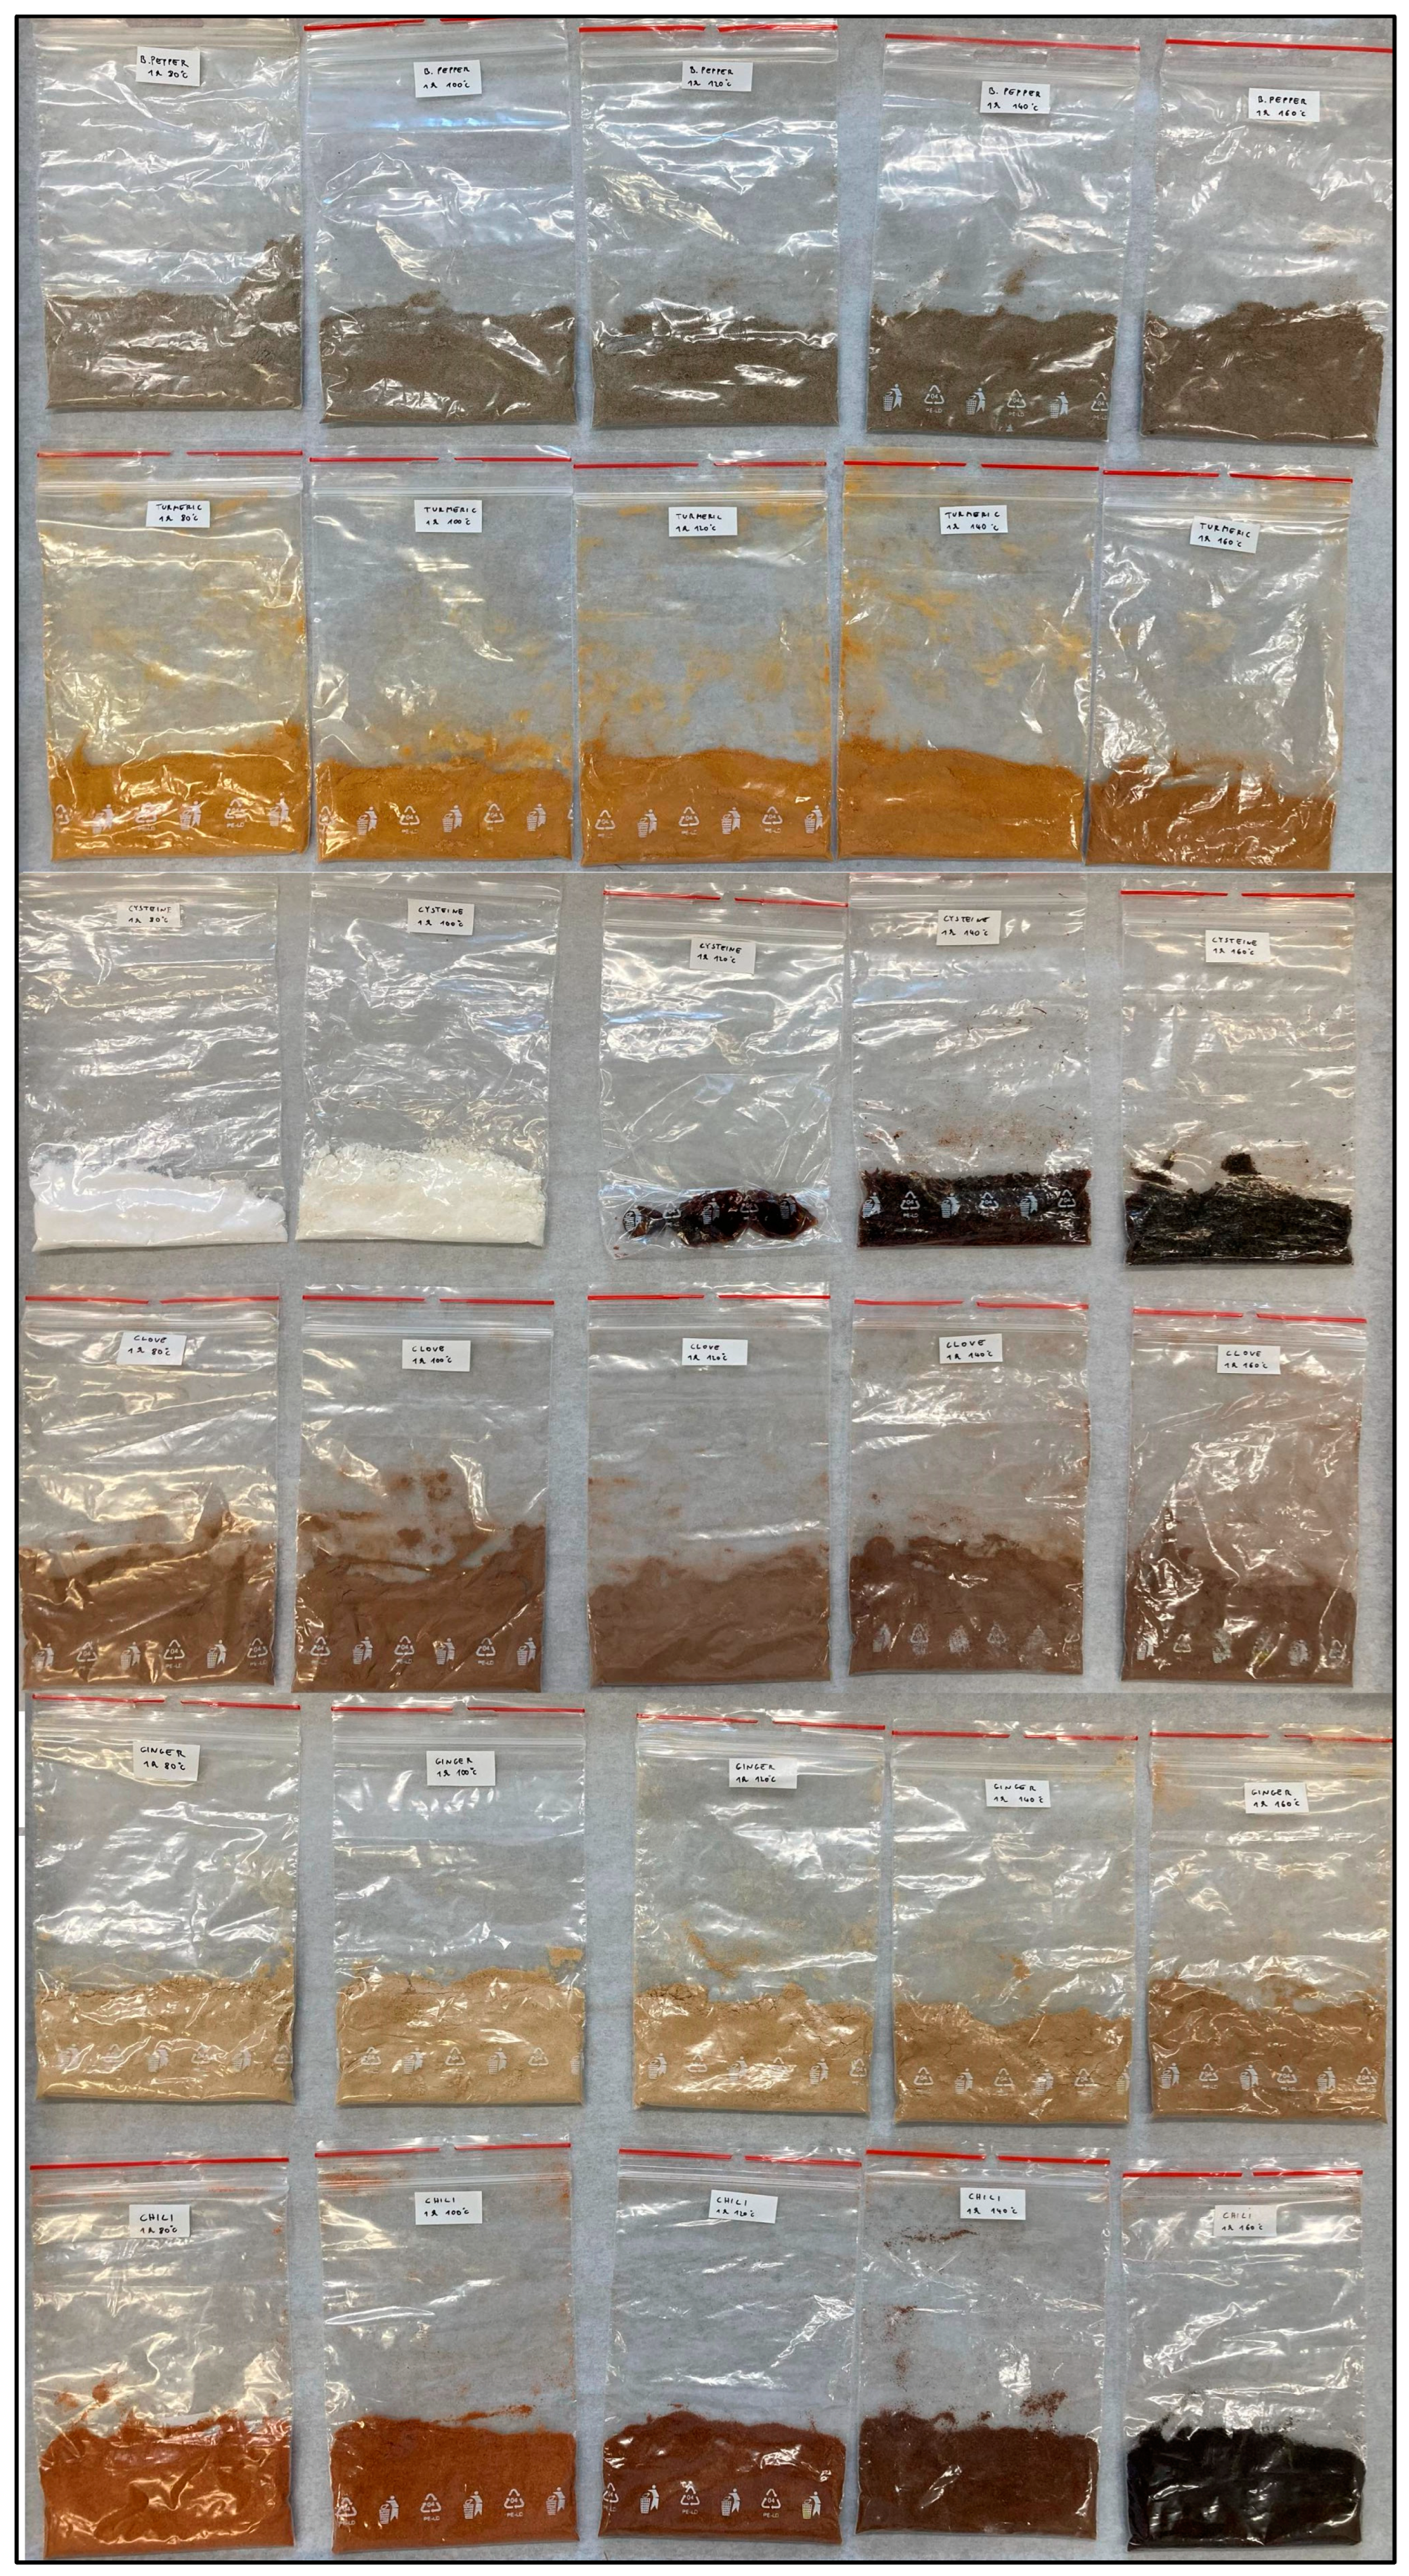
2.2.1. Spice Sample Preparation
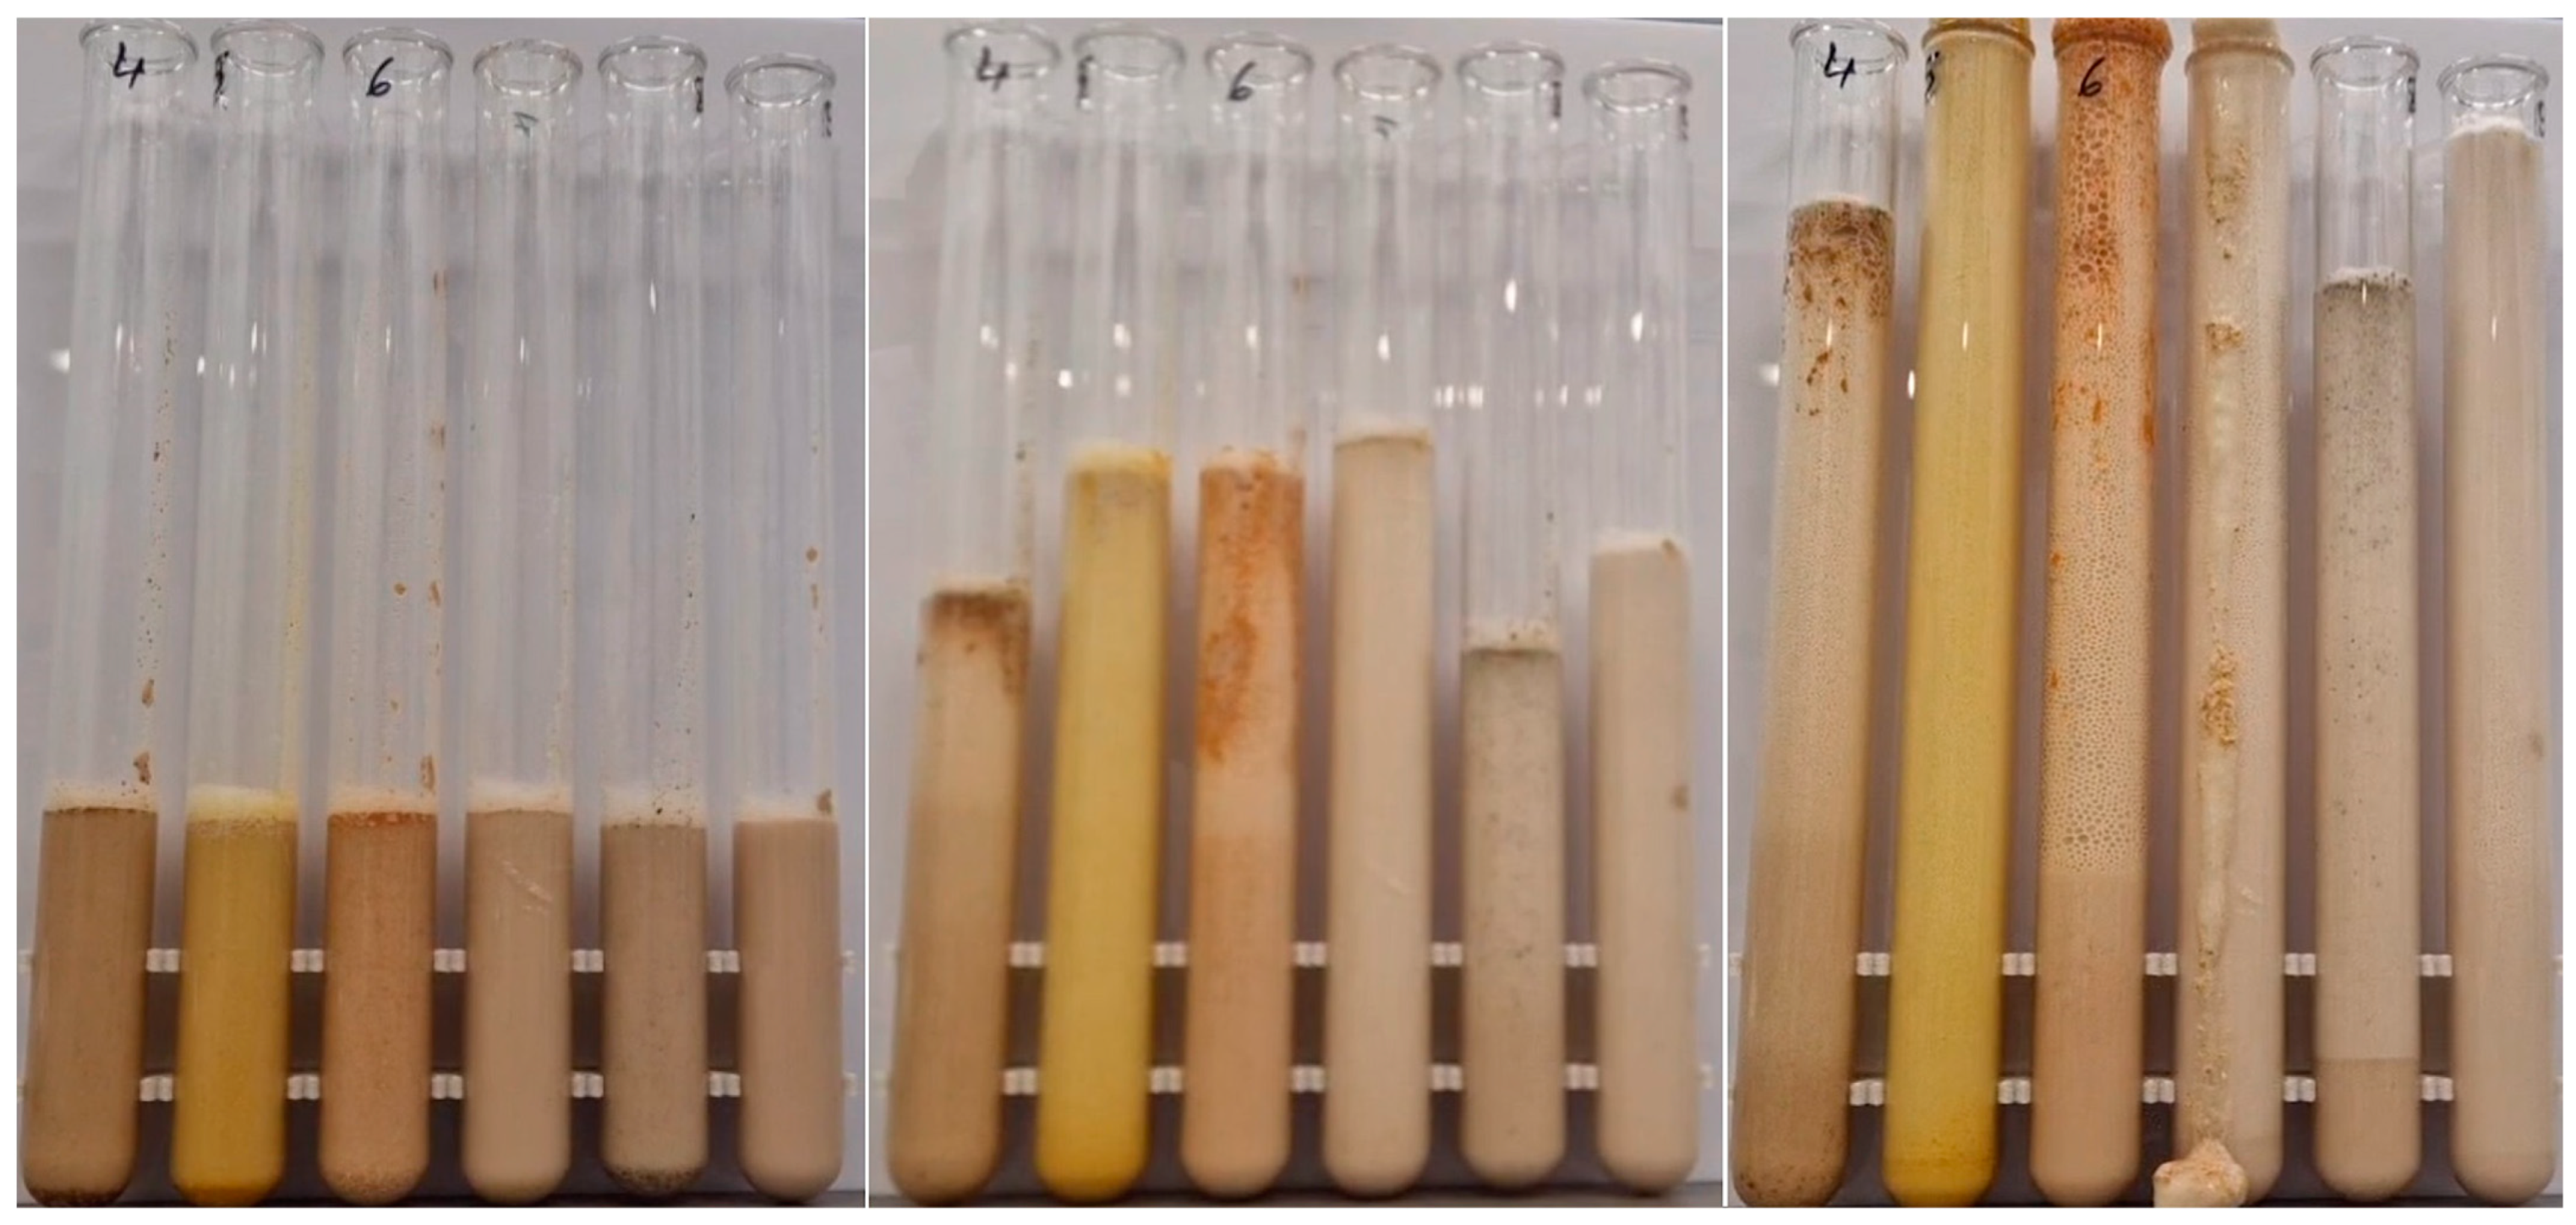
2.2.2. Yeast Tests
2.2.3. FRAP Tests
2.2.4. Spectrofluorometer Tests
2.2.5. HPLC Tests
3. Results
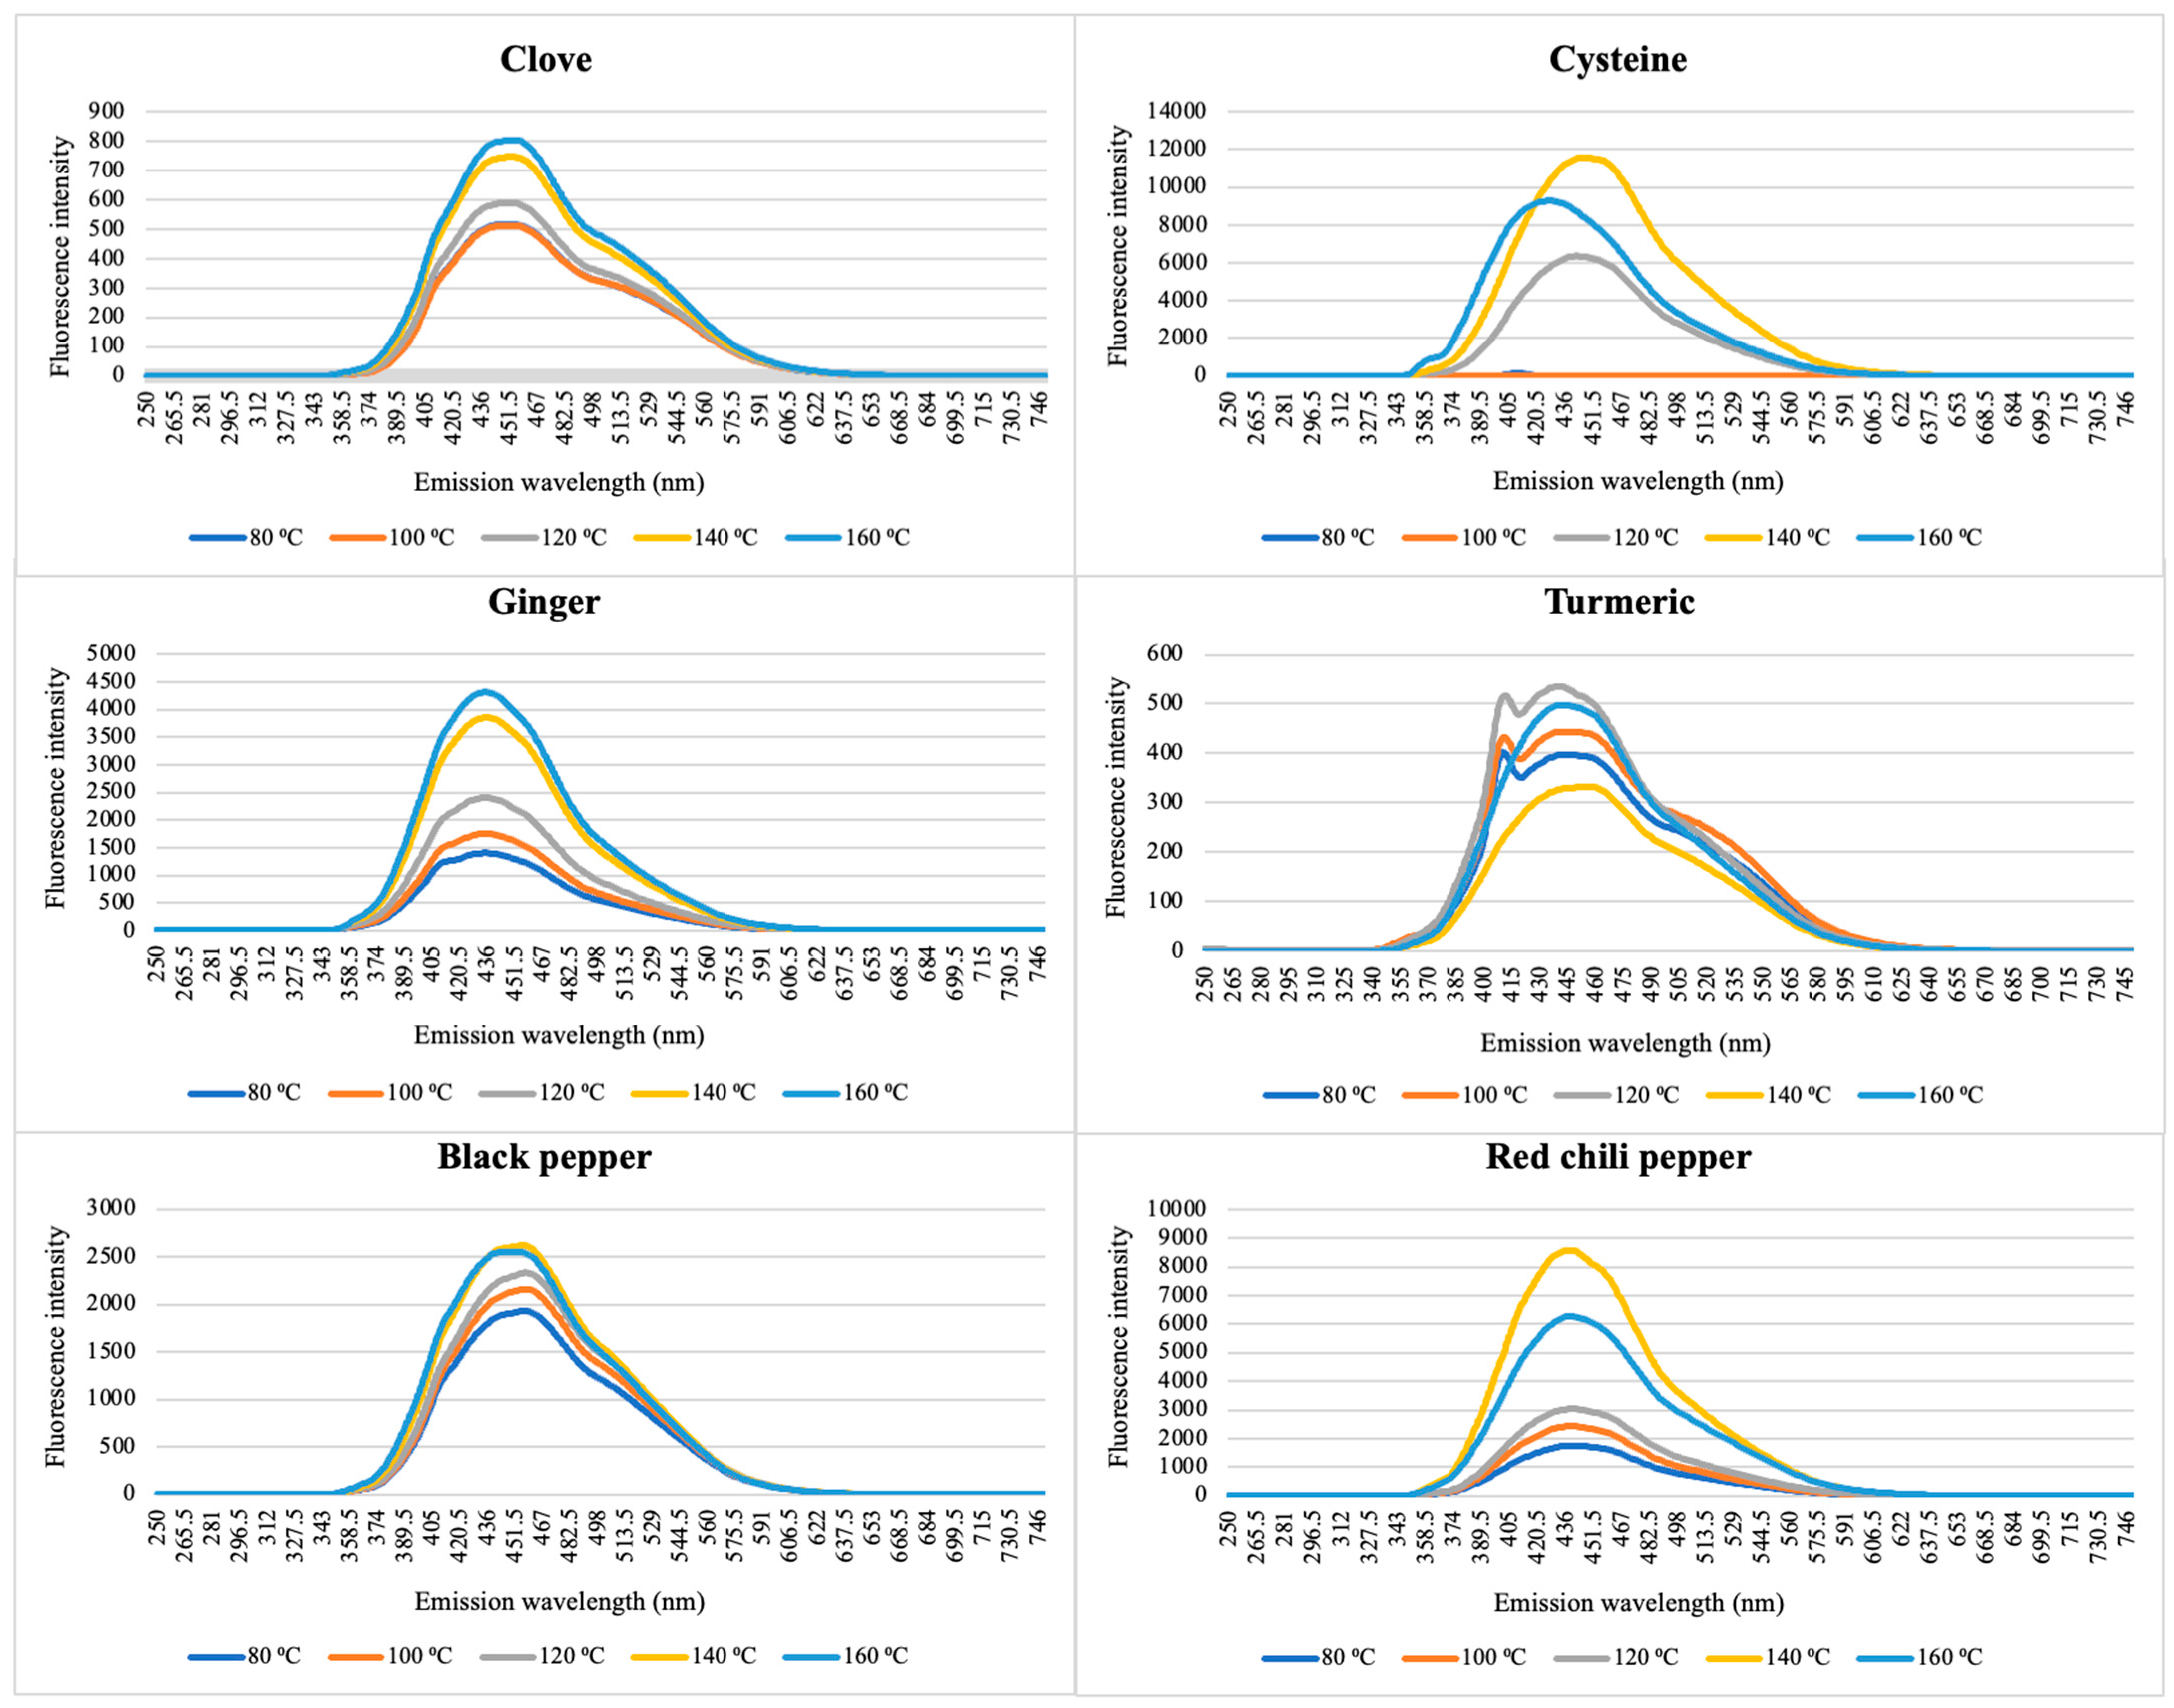
3.1. Characterization of CNDs in Spices
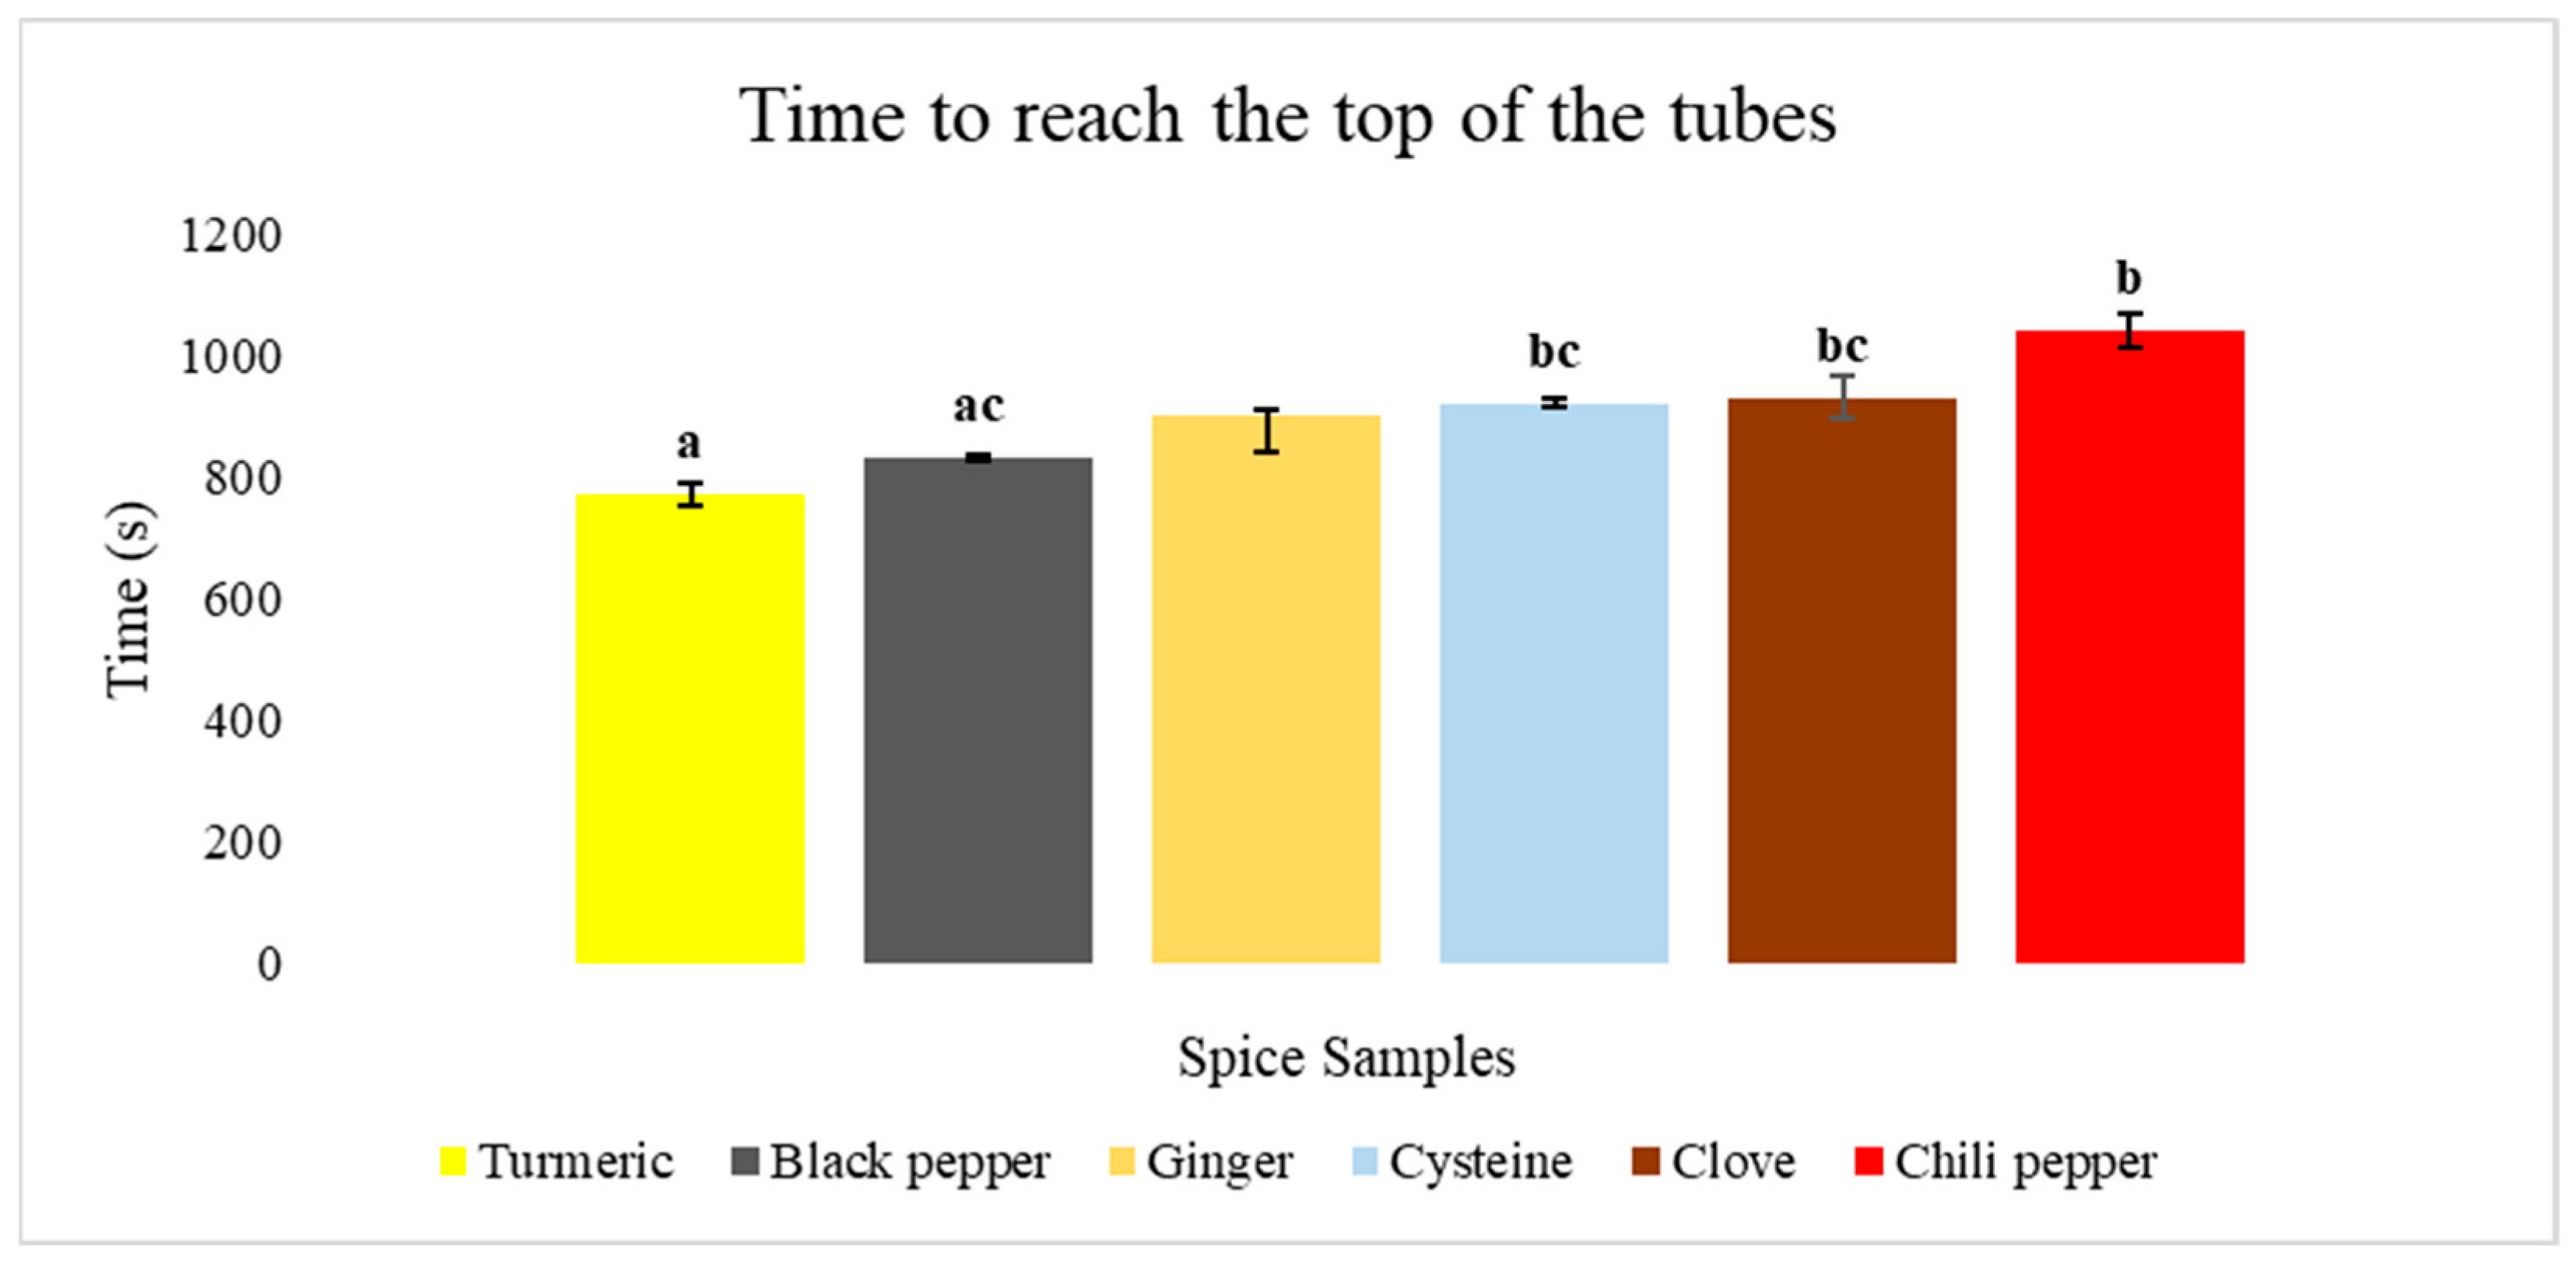
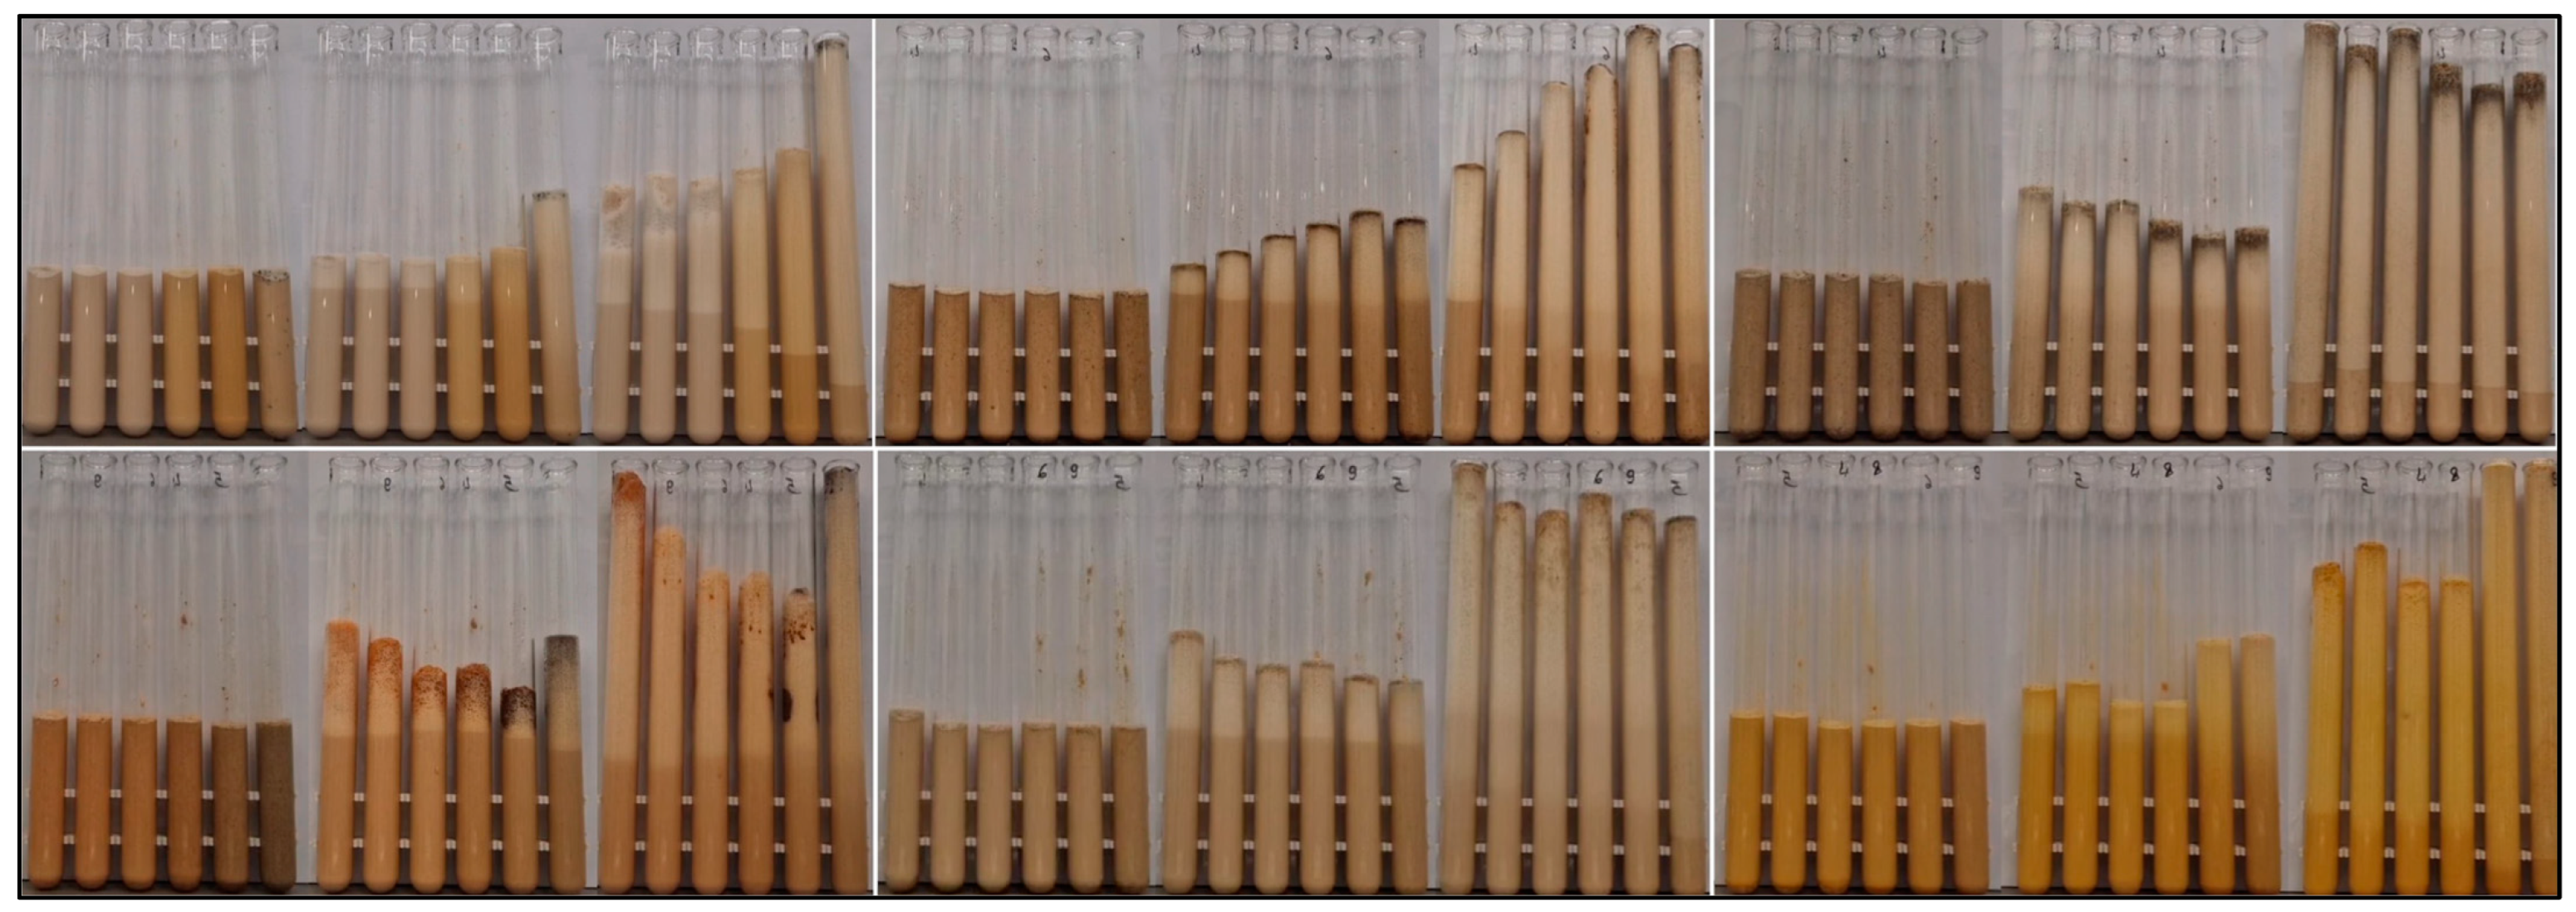
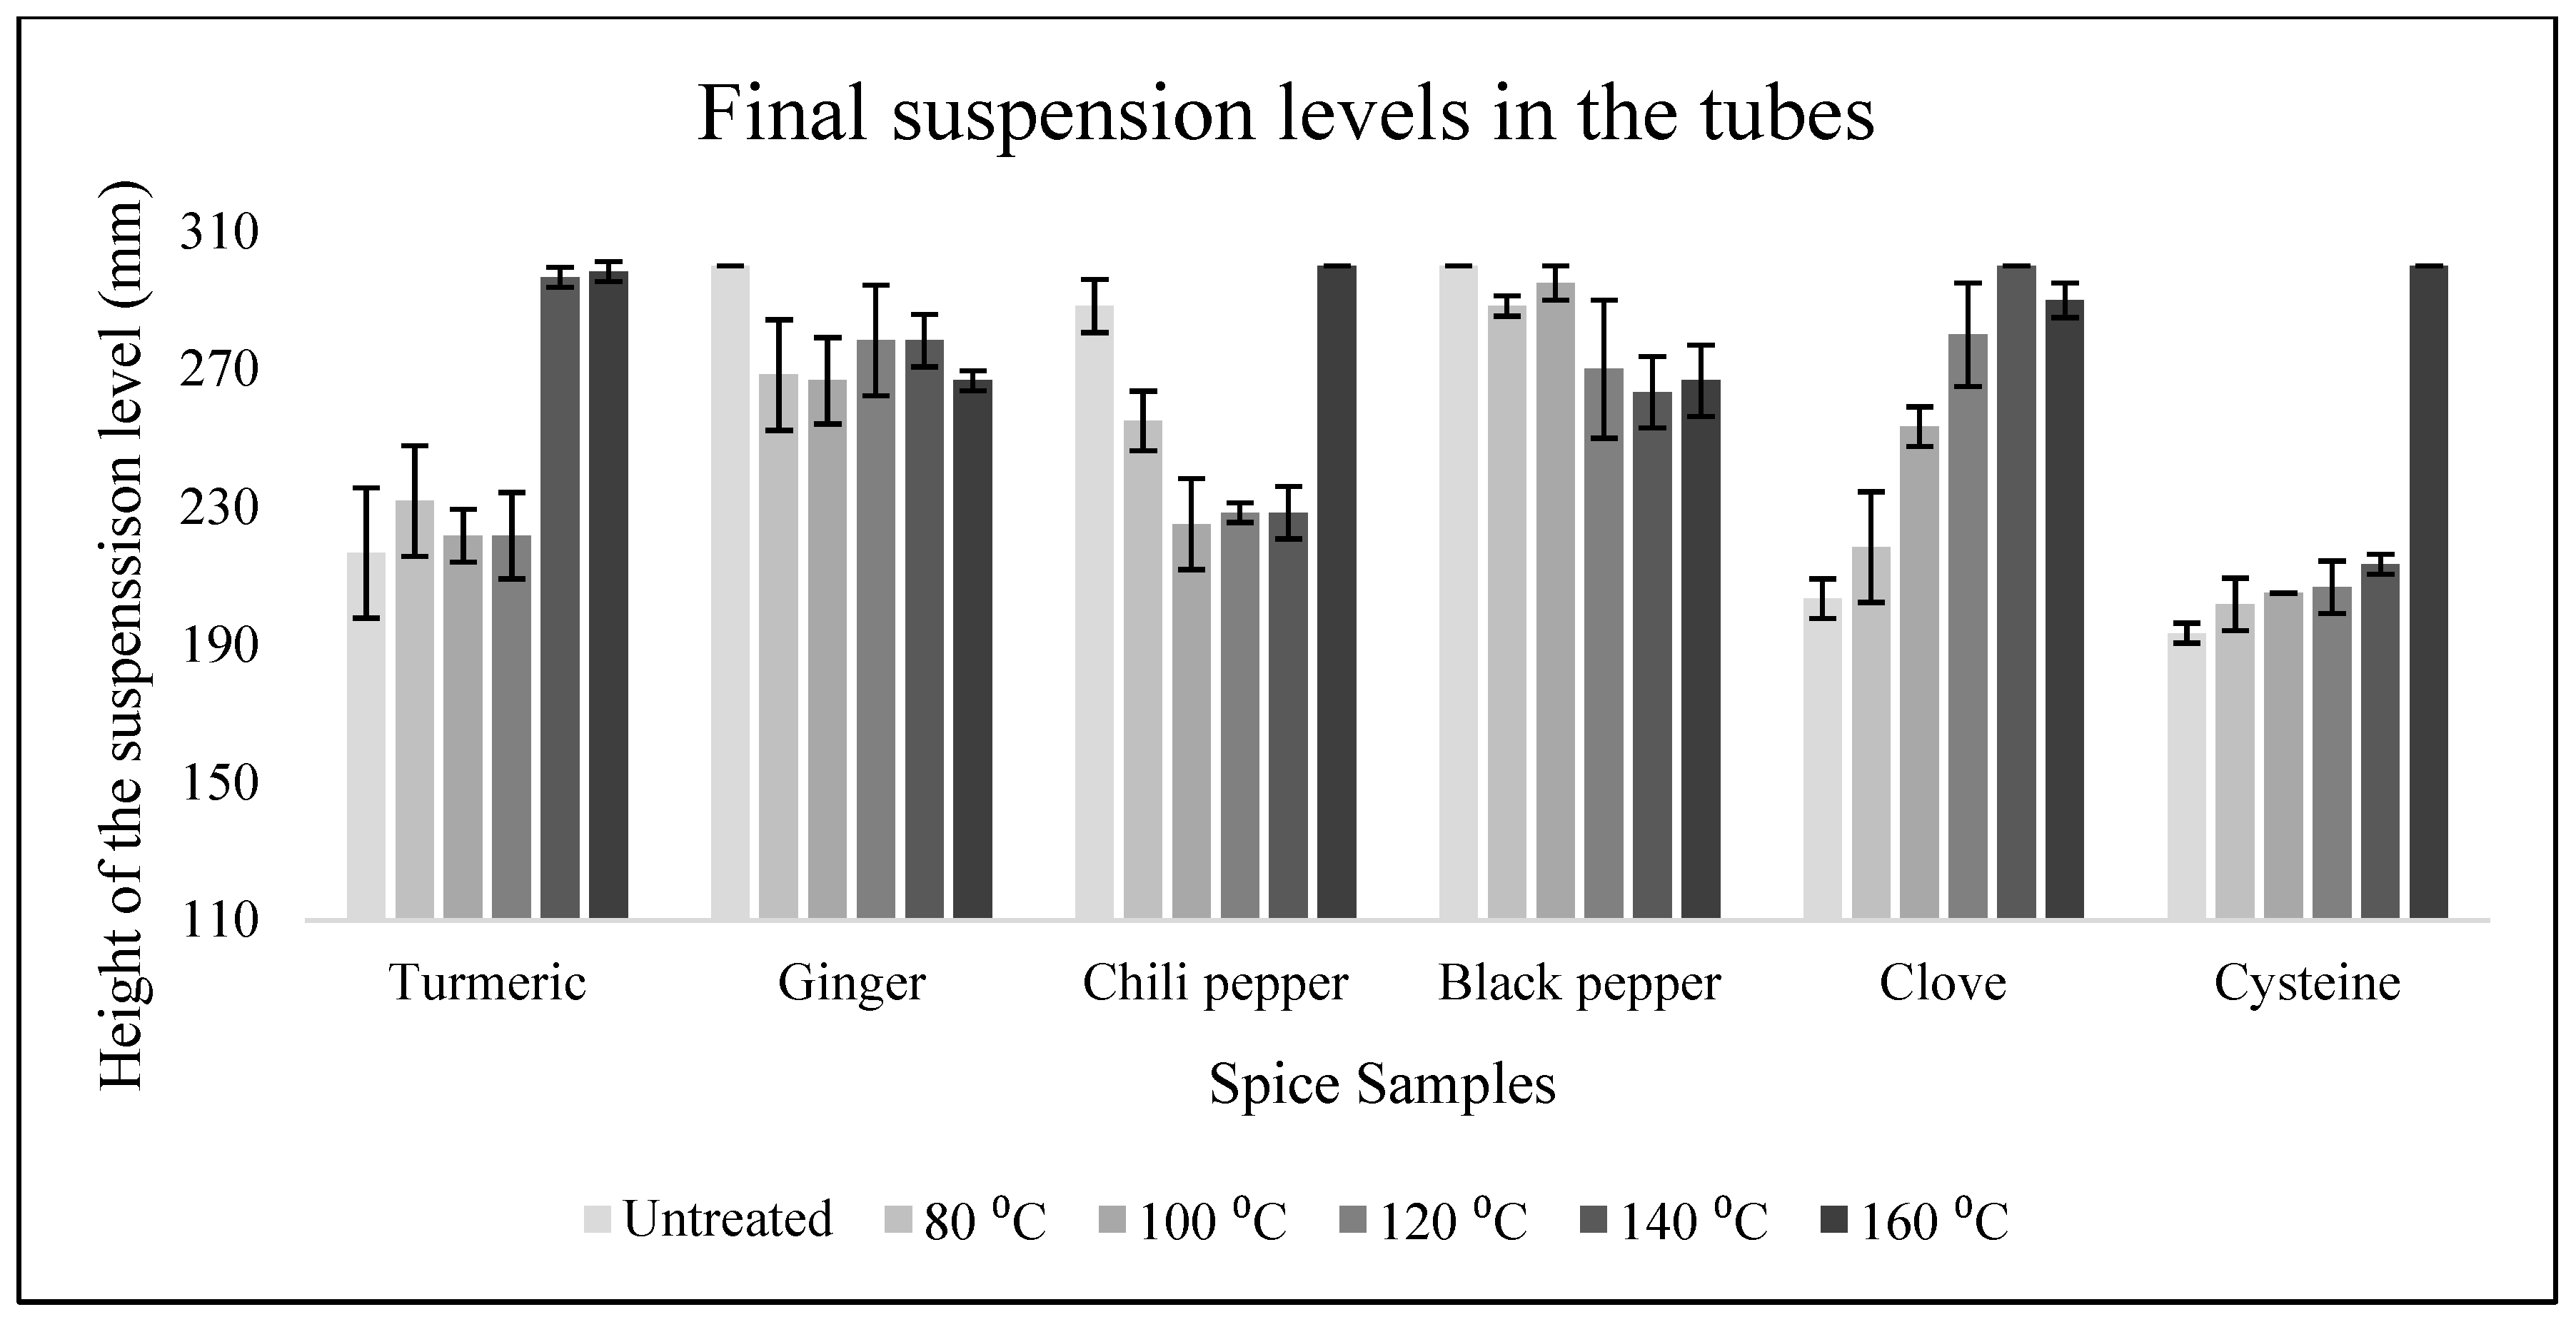
3.2. Yeast Tests
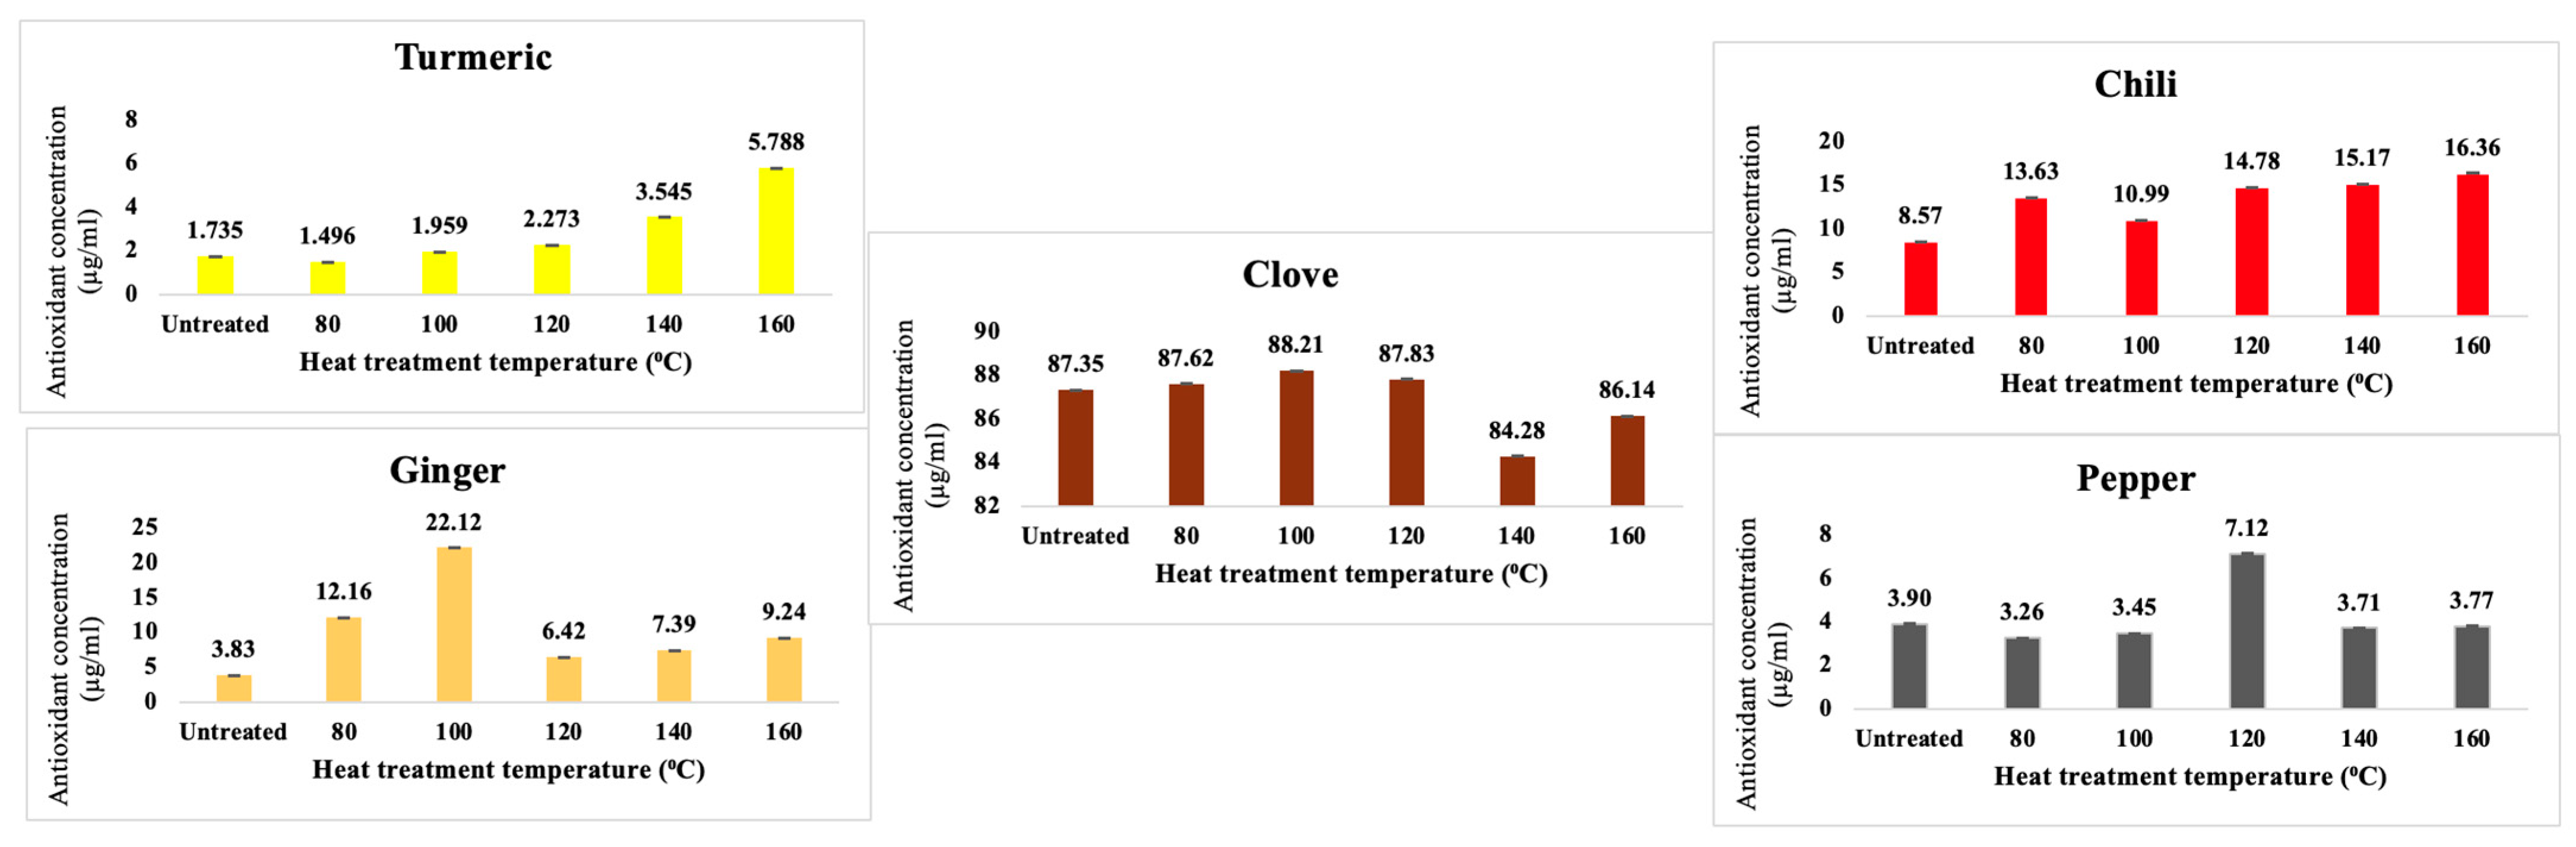
3.3. FRAP Tests
3.4. CNDs Content
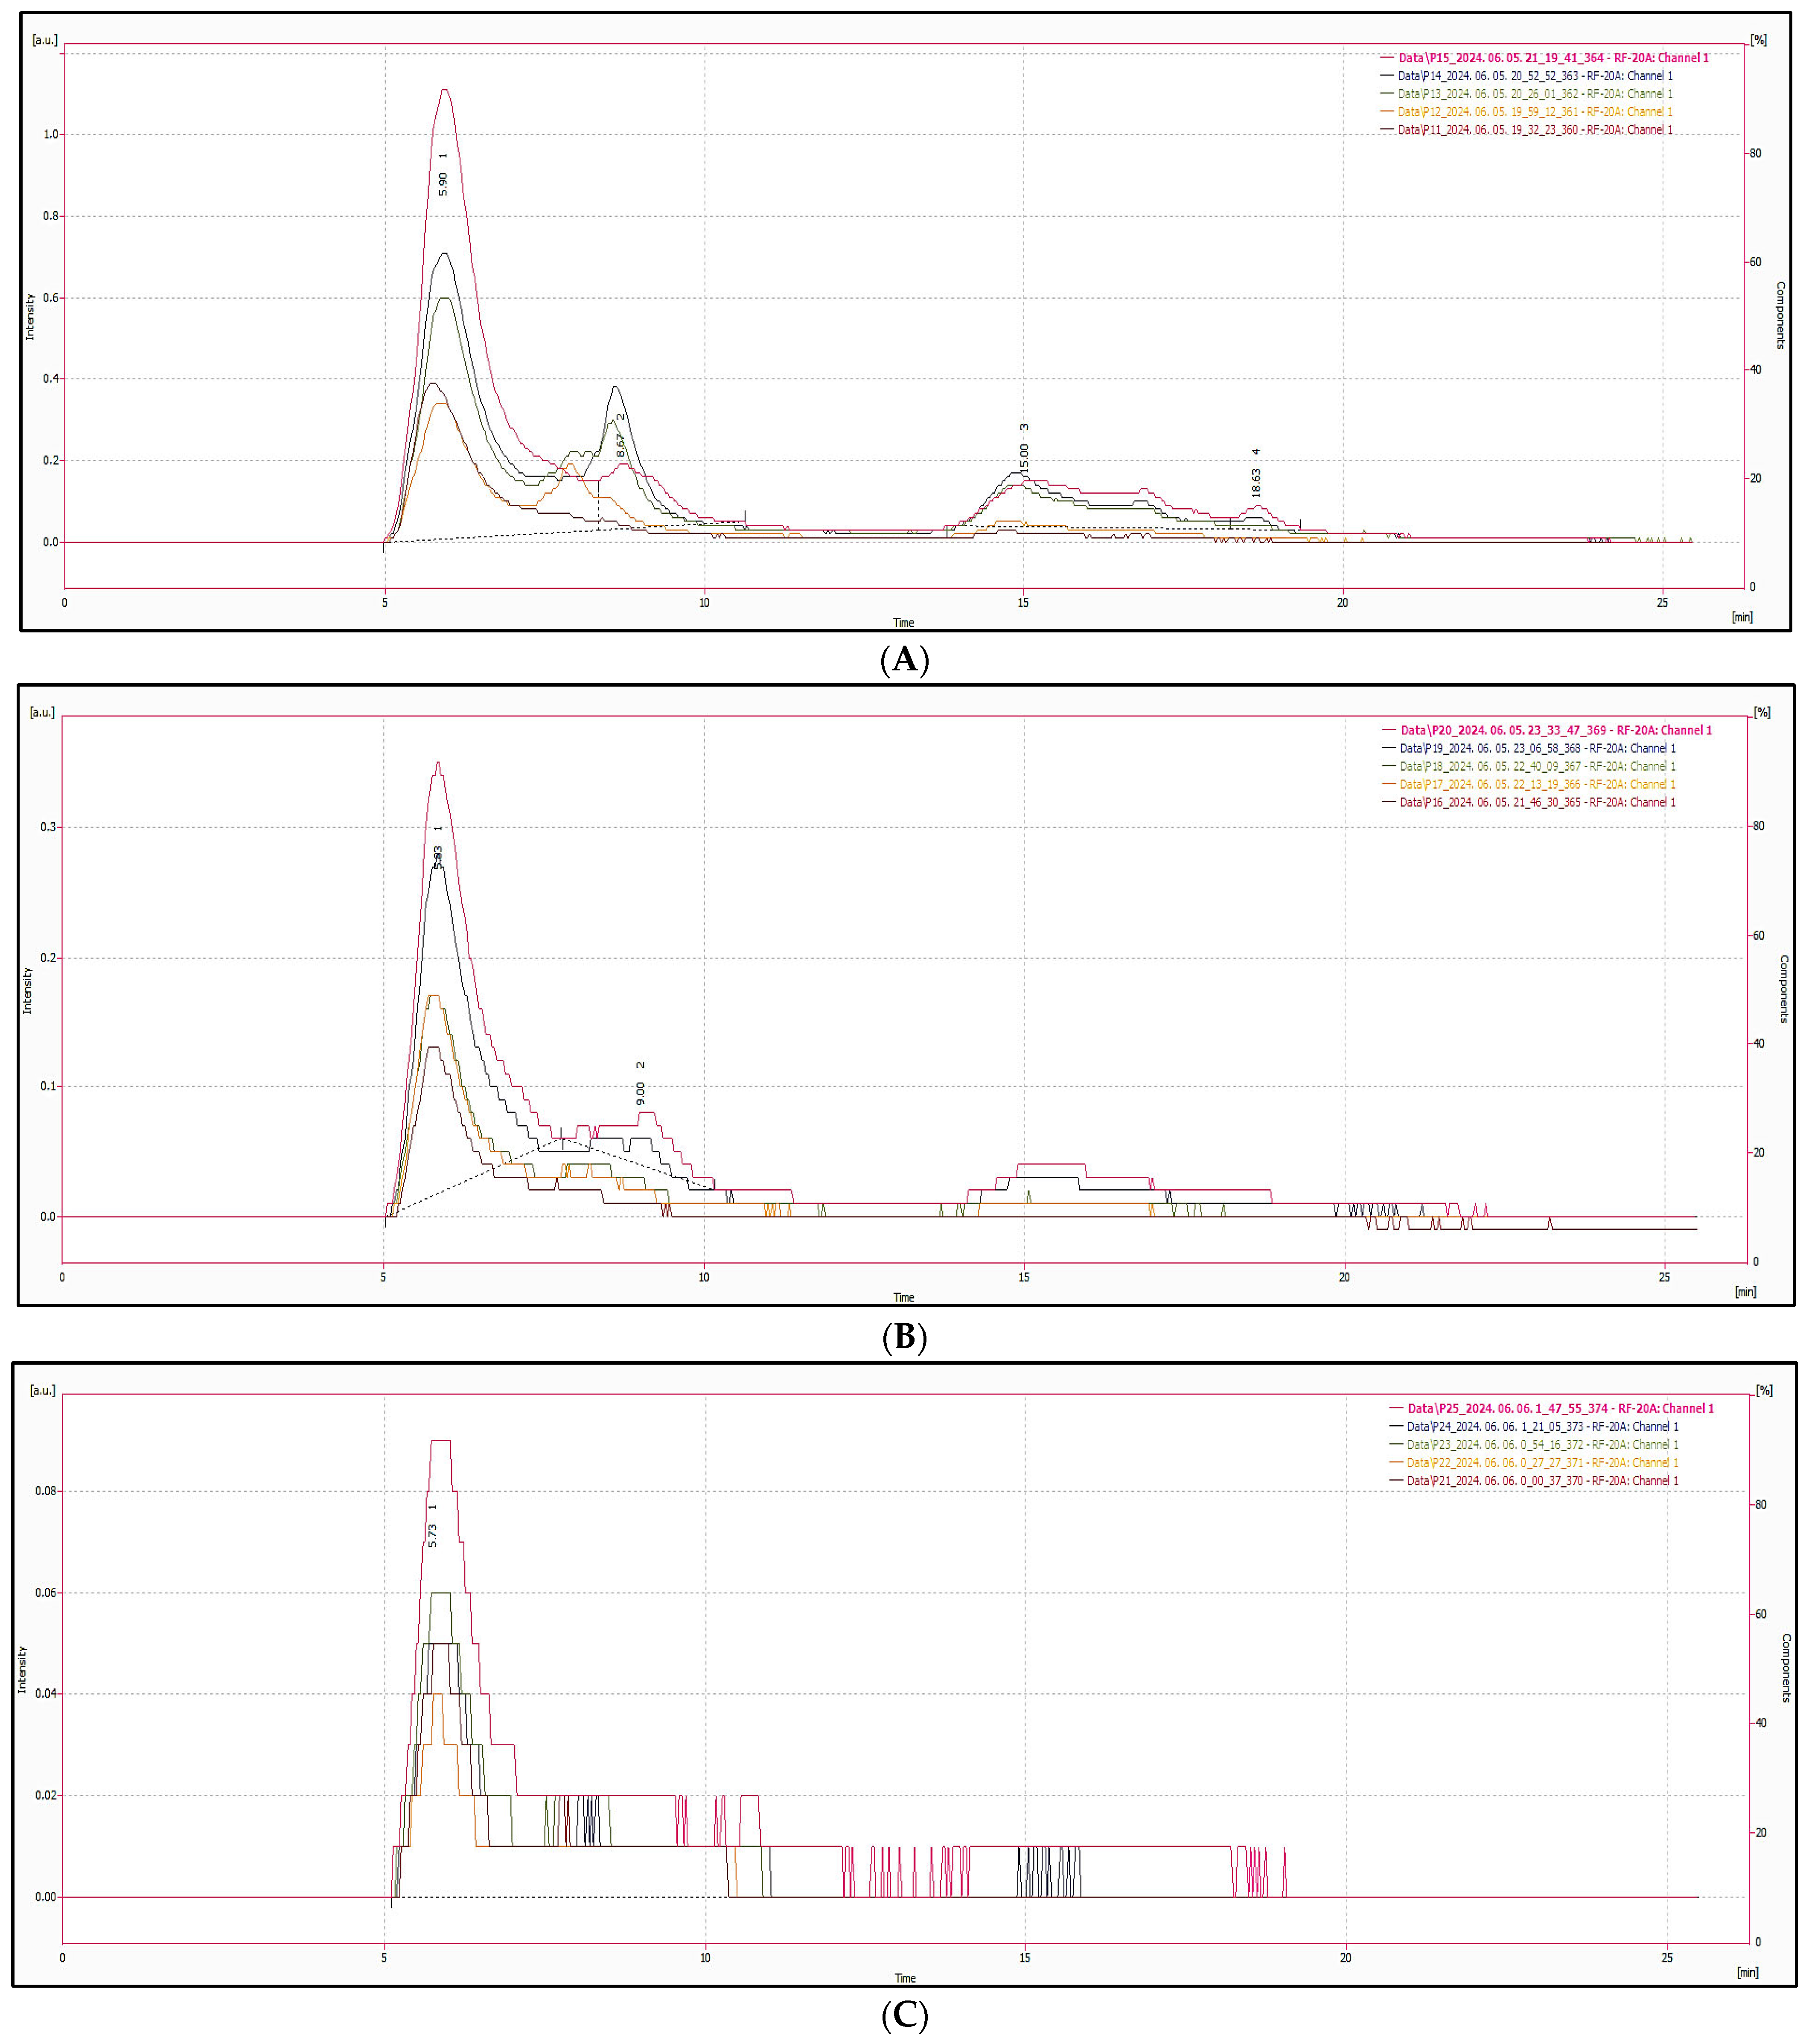
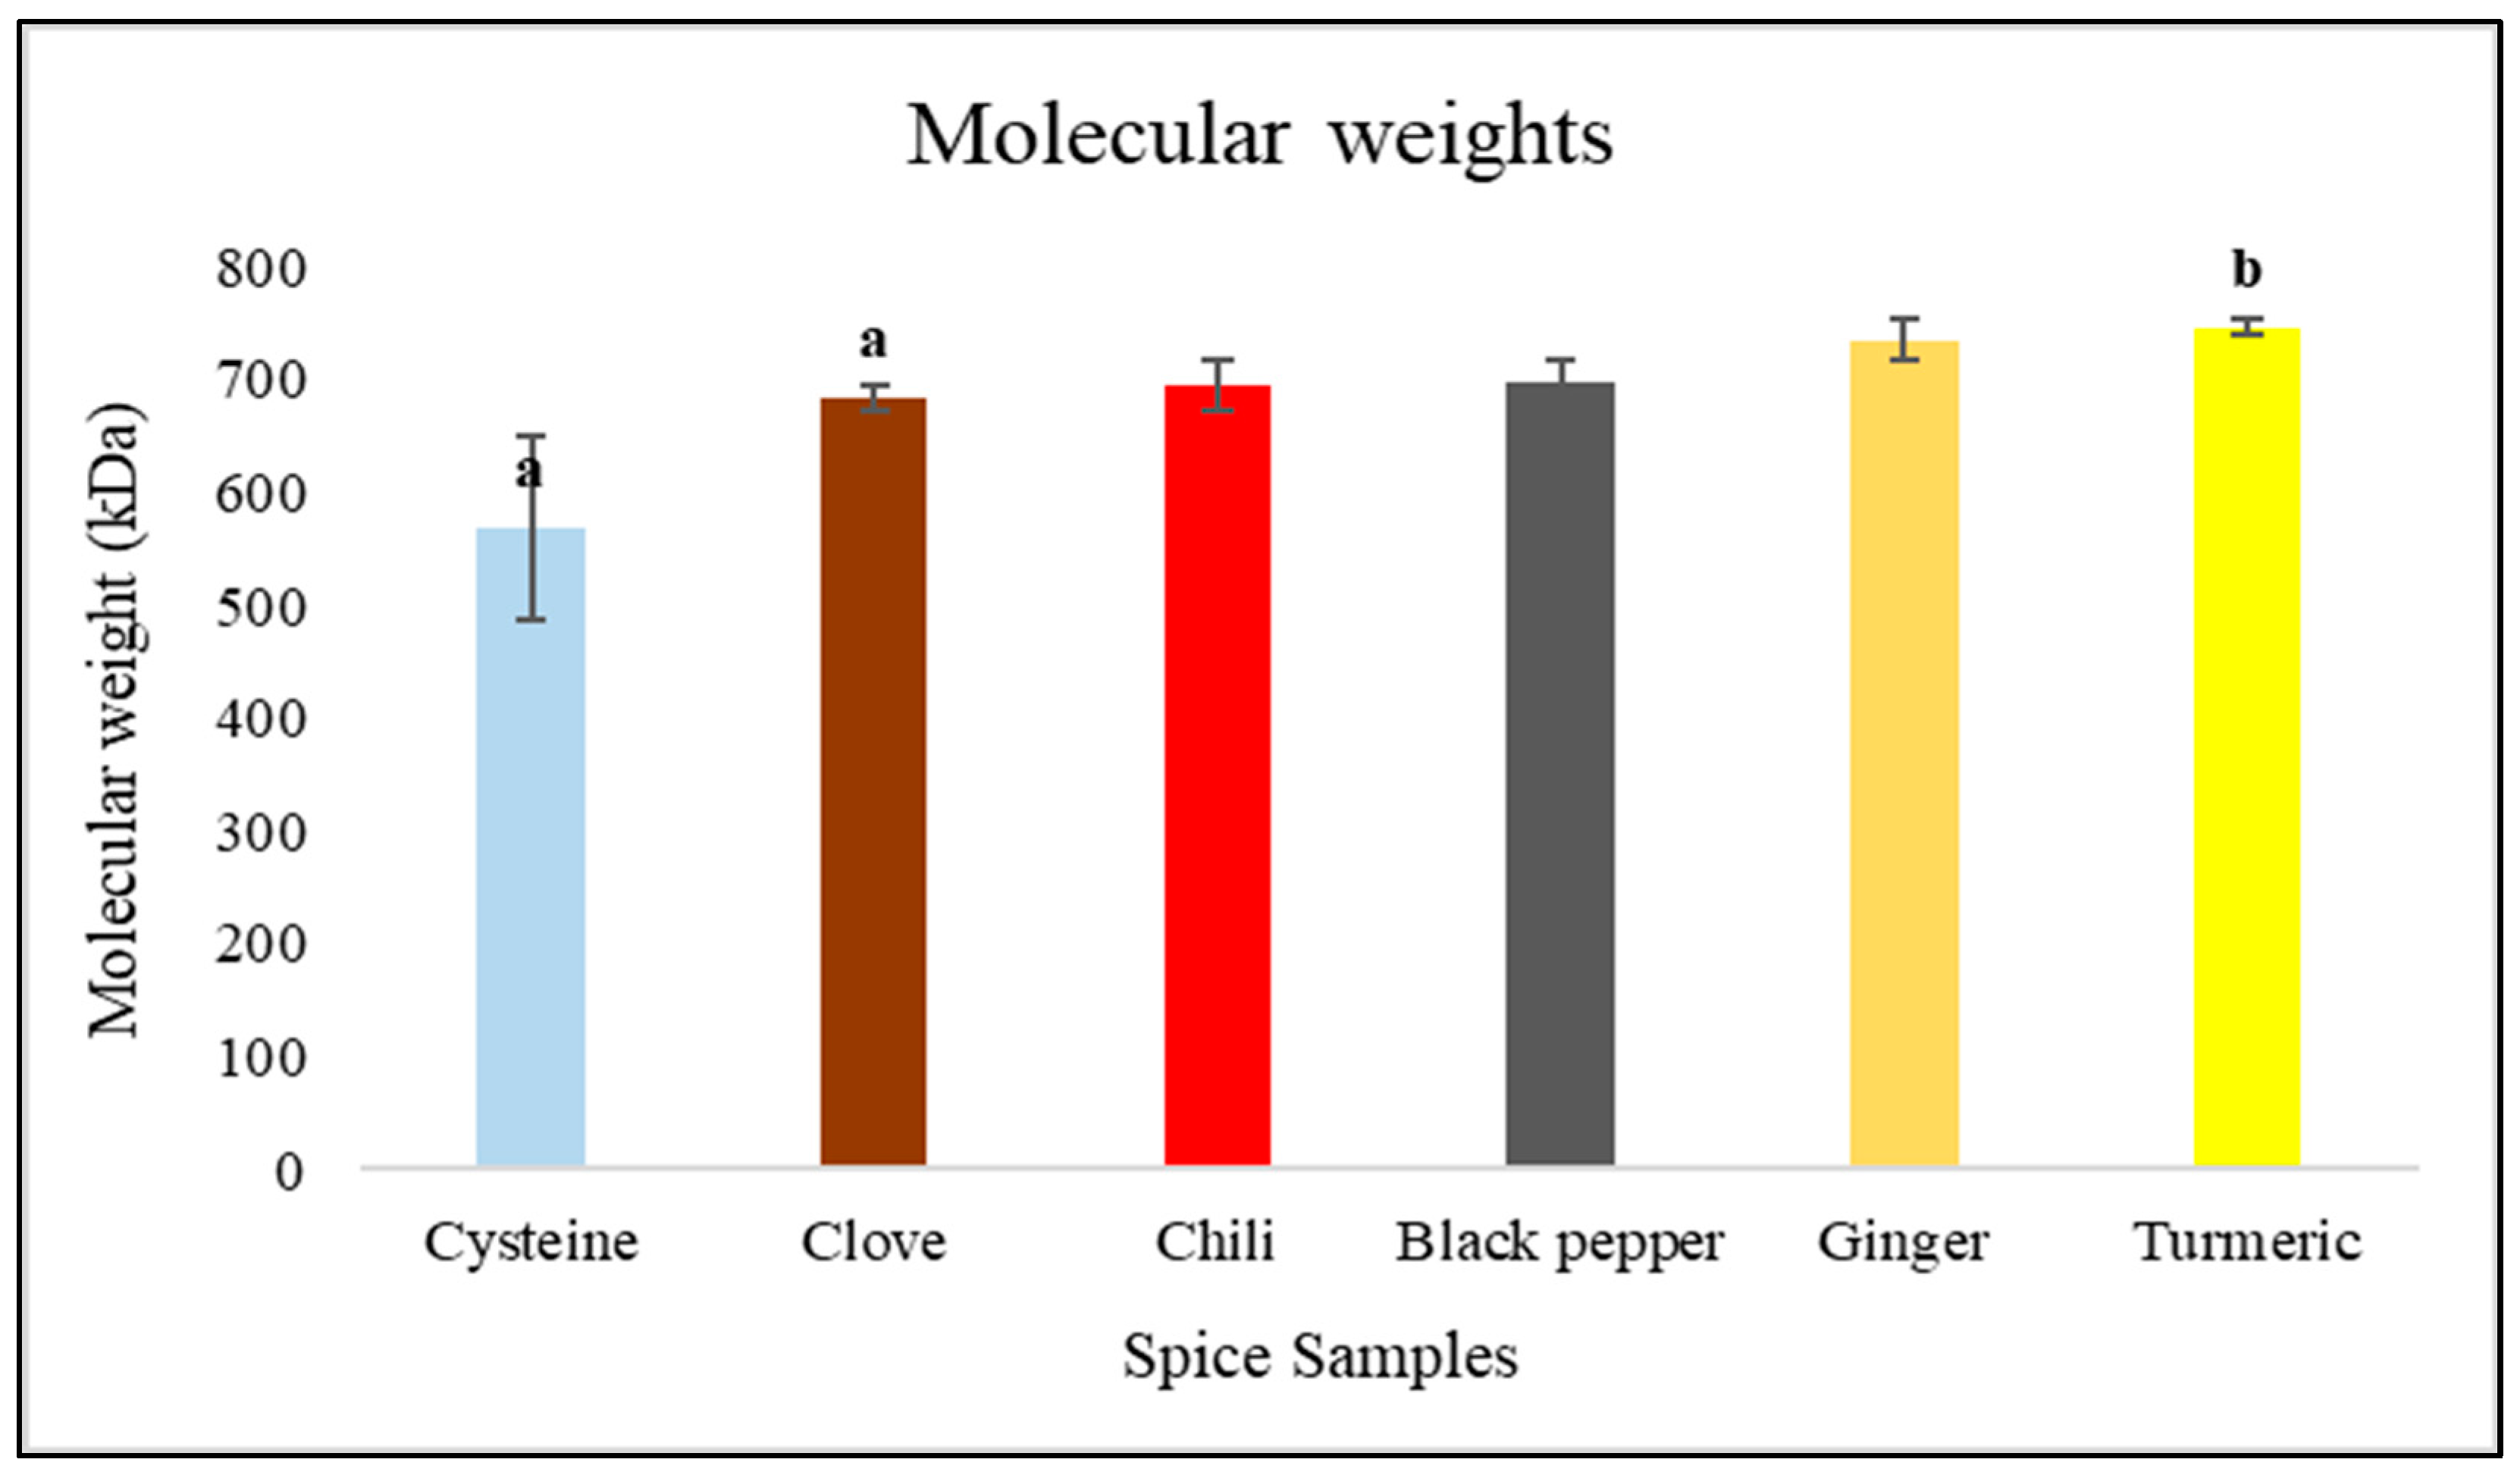
3.5. CND Molar Mass and Size
4. Discussion
5. Conclusions
Author Contributions
Funding
Data Availability Statement
Conflicts of Interest
References
- Yashin, A.; Yashin, Y.; Xia, X.; Nemzer, B. Antioxidant Activity of Spices and Their Impact on Human Health: A Review. Antioxidants 2017, 6, 70. [Google Scholar] [CrossRef] [PubMed]
- Prasad, S.; Gupta, S.C.; Tyagi, A.K.; Aggarwal, B.B. Curcumin, a Component of Golden Spice: From Bedside to Bench and Back. Biotechnol. Adv. 2014, 32, 1053–1064. [Google Scholar] [CrossRef] [PubMed]
- Diniz do Nascimento, L.; de Moraes, A.A.B.; da Costa, K.S.; Pereira Galúcio, J.M.; Taube, P.S.; Costa, C.M.L.; Neves Cruz, J.; de Aguiar Andrade, E.H.; Faria, L.J.G. de Bioactive Natural Compounds and Antioxidant Activity of Essential Oils from Spice Plants: New Findings and Potential Applications. Biomolecules 2020, 10, 988. [Google Scholar] [CrossRef] [PubMed]
- Burt, S. Essential Oils: Their Antibacterial Properties and Potential Applications in Foods—A Review. Int. J. Food Microbiol. 2004, 94, 223–253. [Google Scholar] [CrossRef]
- Dev, M.; Ghosh, M.; Bhattacharyya, D. kumar Physico-Chemical, Antimicrobial, and Organoleptic Properties of Roasted Aromatic Spice (Clove Bud) in Baked Product. Appl. Biochem. Biotechnol. 2021, 193, 1813–1835. [Google Scholar] [CrossRef]
- Jia, C.-H.; Shin, J.-A.; Kim, Y.-M.; Lee, K.-T. Effect of Processing on Composition Changes of Selected Spices. PLOS ONE 2017, 12, e0176037. [Google Scholar] [CrossRef]
- Nguyen, D.; El-Ramady, H.; Prokisch, J. Food Safety Aspects of Carbon Dots: A Review. Environ. Chem. Lett. 2024, 23, 337–360. [Google Scholar] [CrossRef]
- Semsey, D.; Nguyen, D.; Törős, G.; Muthu, A.; Labidi, S.; El-Ramady, H.; Béni, Á.; Rai, M.; József, P. Analysis of Fluorescent Carbon Nanodot Formation during Pretzel Production. Nanomaterials 2024, 14, 1142. [Google Scholar] [CrossRef]
- Nguyen, D.; Muthu, A.; El-Ramady, H.; Béni, Á.; Prokisch, J. Detection and Formation of Fluorescent Carbon Nanodots in Coffee Brews and Its Relationship with Other Compositions. J. Food Compos. Anal. 2024, 132, 106347. [Google Scholar] [CrossRef]
- Li, D.; Xie, Y.; Na, X.; Li, Y.; Dai, C.; Li, Y.; Tan, M. Insights into Melanoidin Conversion into Fluorescent Nanoparticles in the Maillard Reaction. Food Funct. 2019, 10, 4414–4422. [Google Scholar] [CrossRef]
- Wang, H.; Su, W.; Tan, M. Endogenous Fluorescence Carbon Dots Derived from Food Items. Innovation 2020, 1, 100009. [Google Scholar] [CrossRef] [PubMed]
- Li, D.; Na, X.; Wang, H.; Xie, Y.; Cong, S.; Song, Y.; Xu, X.; Zhu, B.-W.; Tan, M. Fluorescent Carbon Dots Derived from Maillard Reaction Products: Their Properties, Biodistribution, Cytotoxicity, and Antioxidant Activity. J. Agric. Food Chem. 2018, 66, 1569–1575. [Google Scholar] [CrossRef] [PubMed]
- Xiao, L.; Sun, H. Novel Properties and Applications of Carbon Nanodots. Nanoscale Horiz. 2018, 3, 565–597. [Google Scholar] [CrossRef] [PubMed]
- Ahmed, A.; Shahadat, M.; ul Islam, S.; Adnan, R.; Mohamad Ibrahim, M.N.; Ullah, Q. Synthesis, Characterization, and Properties of Green Carbon Nanodots|Request PDF. ResearchGate 2024. [Google Scholar] [CrossRef]
- Multicolor Biomass Based Carbon Nanodots for Bacterial Imaging|Semantic Scholar. Available online: https://www.semanticscholar.org/paper/Multicolor-biomass-based-carbon-nanodots-for-Zhao-Wang/29eeef667c1cea5dad10bcc4237ce22fc7208035 (accessed on 7 January 2025).
- Nguyen, D.; Muthu, A.; El-Ramady, H.; Daróczi, L.; Nagy, L.; Kéki, S.; Béni, Á.; Csarnovics, I.; Prokisch, J. Optimization of Extraction Conditions to Synthesize Green Carbon Nanodots Using the Maillard Reaction. Mater. Adv. 2024; 5, 3499–3505. [Google Scholar] [CrossRef]
- Wu, Z.; Ren, Y.; Liang, Y.; Huang, L.; Yang, Y.; Zafar, A.; Hasan, M.; Yang, F.; Shu, X. Synthesis, Characterization, Immune Regulation, and Antioxidative Assessment of Yeast-Derived Selenium Nanoparticles in Cyclophosphamide-Induced Rats. ACS Omega 2021, 6, 24585–24594. [Google Scholar] [CrossRef]
- Salem, S.S. Bio-Fabrication of Selenium Nanoparticles Using Baker’s Yeast Extract and Its Antimicrobial Efficacy on Food Borne Pathogens. Appl. Biochem. Biotechnol. 2022, 194, 1898–1910. [Google Scholar] [CrossRef]
- Li, Y.; Zhang, P.; Li, M.; Shakoor, N.; Adeel, M.; Zhou, P.; Guo, M.; Jiang, Y.; Zhao, W.; Lou, B.; et al. Application and Mechanisms of Metal-Based Nanoparticles in the Control of Bacterial and Fungal Crop Diseases. Pest. Manag. Sci. 2023, 79, 21–36. [Google Scholar] [CrossRef]
- Vásquez Castro, E.; Memari, G.; Ata, Ö.; Mattanovich, D. Carbon Efficient Production of Chemicals with Yeasts. Yeast 2023, 40, 583–593. [Google Scholar] [CrossRef]
- Elsamahy, T.; Sun, J.; Elsilk, S.E.; Ali, S.S. Biodegradation of Low-Density Polyethylene Plastic Waste by a Constructed Tri-Culture Yeast Consortium from Wood-Feeding Termite: Degradation Mechanism and Pathway. J. Hazard. Mater. 2023, 448, 130944. [Google Scholar] [CrossRef]
- Guadalupe-Daqui, M.; Goodrich-Schneider, R.M.; Sarnoski, P.J.; Carriglio, J.C.; Sims, C.A.; Pearson, B.J.; MacIntosh, A.J. The Effect of CO2 Concentration on Yeast Fermentation: Rates, Metabolic Products, and Yeast Stress Indicators. J. Ind. Microbiol. Biotechnol. 2023, 50, kuad001. [Google Scholar] [CrossRef]
- Benzie, I.F.F.; Strain, J.J. The Ferric Reducing Ability of Plasma (FRAP) as a Measure of “Antioxidant Power”: The FRAP Assay. Anal. Biochem. 1996, 239, 70–76. [Google Scholar] [CrossRef] [PubMed]
- Shafigulina, A.D.; Revina, A.A.; Platonova, N.P.; Borovikova, S.A.; Buryak, A.K. The Use of Size-Exclusion Chromatography for Determining the Sizes of Metal Nanoparticles Synthesized in Reverse Micelles. Colloid. J. 2019, 81, 292–297. [Google Scholar] [CrossRef]
- Goheen, S.C. The Influence of pH and Acetonitrile on the High Performance Size Exclusion Profile of Proteins. J. Liq. Chromatogr. 1988, 11, 1221–1228. Available online: https://www.tandfonline.com/doi/abs/10.1080/01483918808067168 (accessed on 9 February 2025). [CrossRef]
- Liu, W.; Li, C.; Ren, Y.; Sun, X.; Pan, W.; Li, Y.; Wang, J.; Wang, W. Carbon Dots: Surface Engineering and Applications. J. Mater. Chem. B 2016, 4, 5772–5788. [Google Scholar] [CrossRef]


Disclaimer/Publisher’s Note: The statements, opinions and data contained in all publications are solely those of the individual author(s) and contributor(s) and not of MDPI and/or the editor(s). MDPI and/or the editor(s) disclaim responsibility for any injury to people or property resulting from any ideas, methods, instructions or products referred to in the content. |
© 2025 by the authors. Licensee MDPI, Basel, Switzerland. This article is an open access article distributed under the terms and conditions of the Creative Commons Attribution (CC BY) license (https://creativecommons.org/licenses/by/4.0/).
Share and Cite
Semsey, D.; Nguyen, D.H.H.; Törős, G.; Papp, V.; Pénzes, J.; Vida, T.; Béni, Á.; Rai, M.; Prokisch, J. Analysis of Fluorescent Carbon Nanodots Synthesized from Spices Through Thermal Processes Treatment. Nanomaterials 2025, 15, 625. https://doi.org/10.3390/nano15080625
Semsey D, Nguyen DHH, Törős G, Papp V, Pénzes J, Vida T, Béni Á, Rai M, Prokisch J. Analysis of Fluorescent Carbon Nanodots Synthesized from Spices Through Thermal Processes Treatment. Nanomaterials. 2025; 15(8):625. https://doi.org/10.3390/nano15080625
Chicago/Turabian StyleSemsey, David, Duyen H. H. Nguyen, Gréta Törős, Vivien Papp, János Pénzes, Tamás Vida, Áron Béni, Mahendra Rai, and József Prokisch. 2025. "Analysis of Fluorescent Carbon Nanodots Synthesized from Spices Through Thermal Processes Treatment" Nanomaterials 15, no. 8: 625. https://doi.org/10.3390/nano15080625
APA StyleSemsey, D., Nguyen, D. H. H., Törős, G., Papp, V., Pénzes, J., Vida, T., Béni, Á., Rai, M., & Prokisch, J. (2025). Analysis of Fluorescent Carbon Nanodots Synthesized from Spices Through Thermal Processes Treatment. Nanomaterials, 15(8), 625. https://doi.org/10.3390/nano15080625