
Green Synthesis of Sodium Alginate/Casein Gel Beads and Applications

 ,
,  and
and 
Abstract
1. Introduction

2. Materials and Methods
2.1. Experimental Reagents
2.2. Preparation of SA/CA Samples
2.3. Morphological Analysis by Scanning Electron Microscopy (SEM)
2.4. TGA Analysis
2.5. Adsorption-Desorption Cycle Test
2.6. Maillard Reaction Verification and Definition of Protein and Alginate Content in Materials
2.7. Adsorption Performance Study
2.7.1. MB Standard Curve
2.7.2. MB Adsorption Test
2.8. Theoretical Background and Data Analysis
2.9. Infrared Analysis by Fourier Transform Infrared Spectroscopy (FT-IR)
3. Results
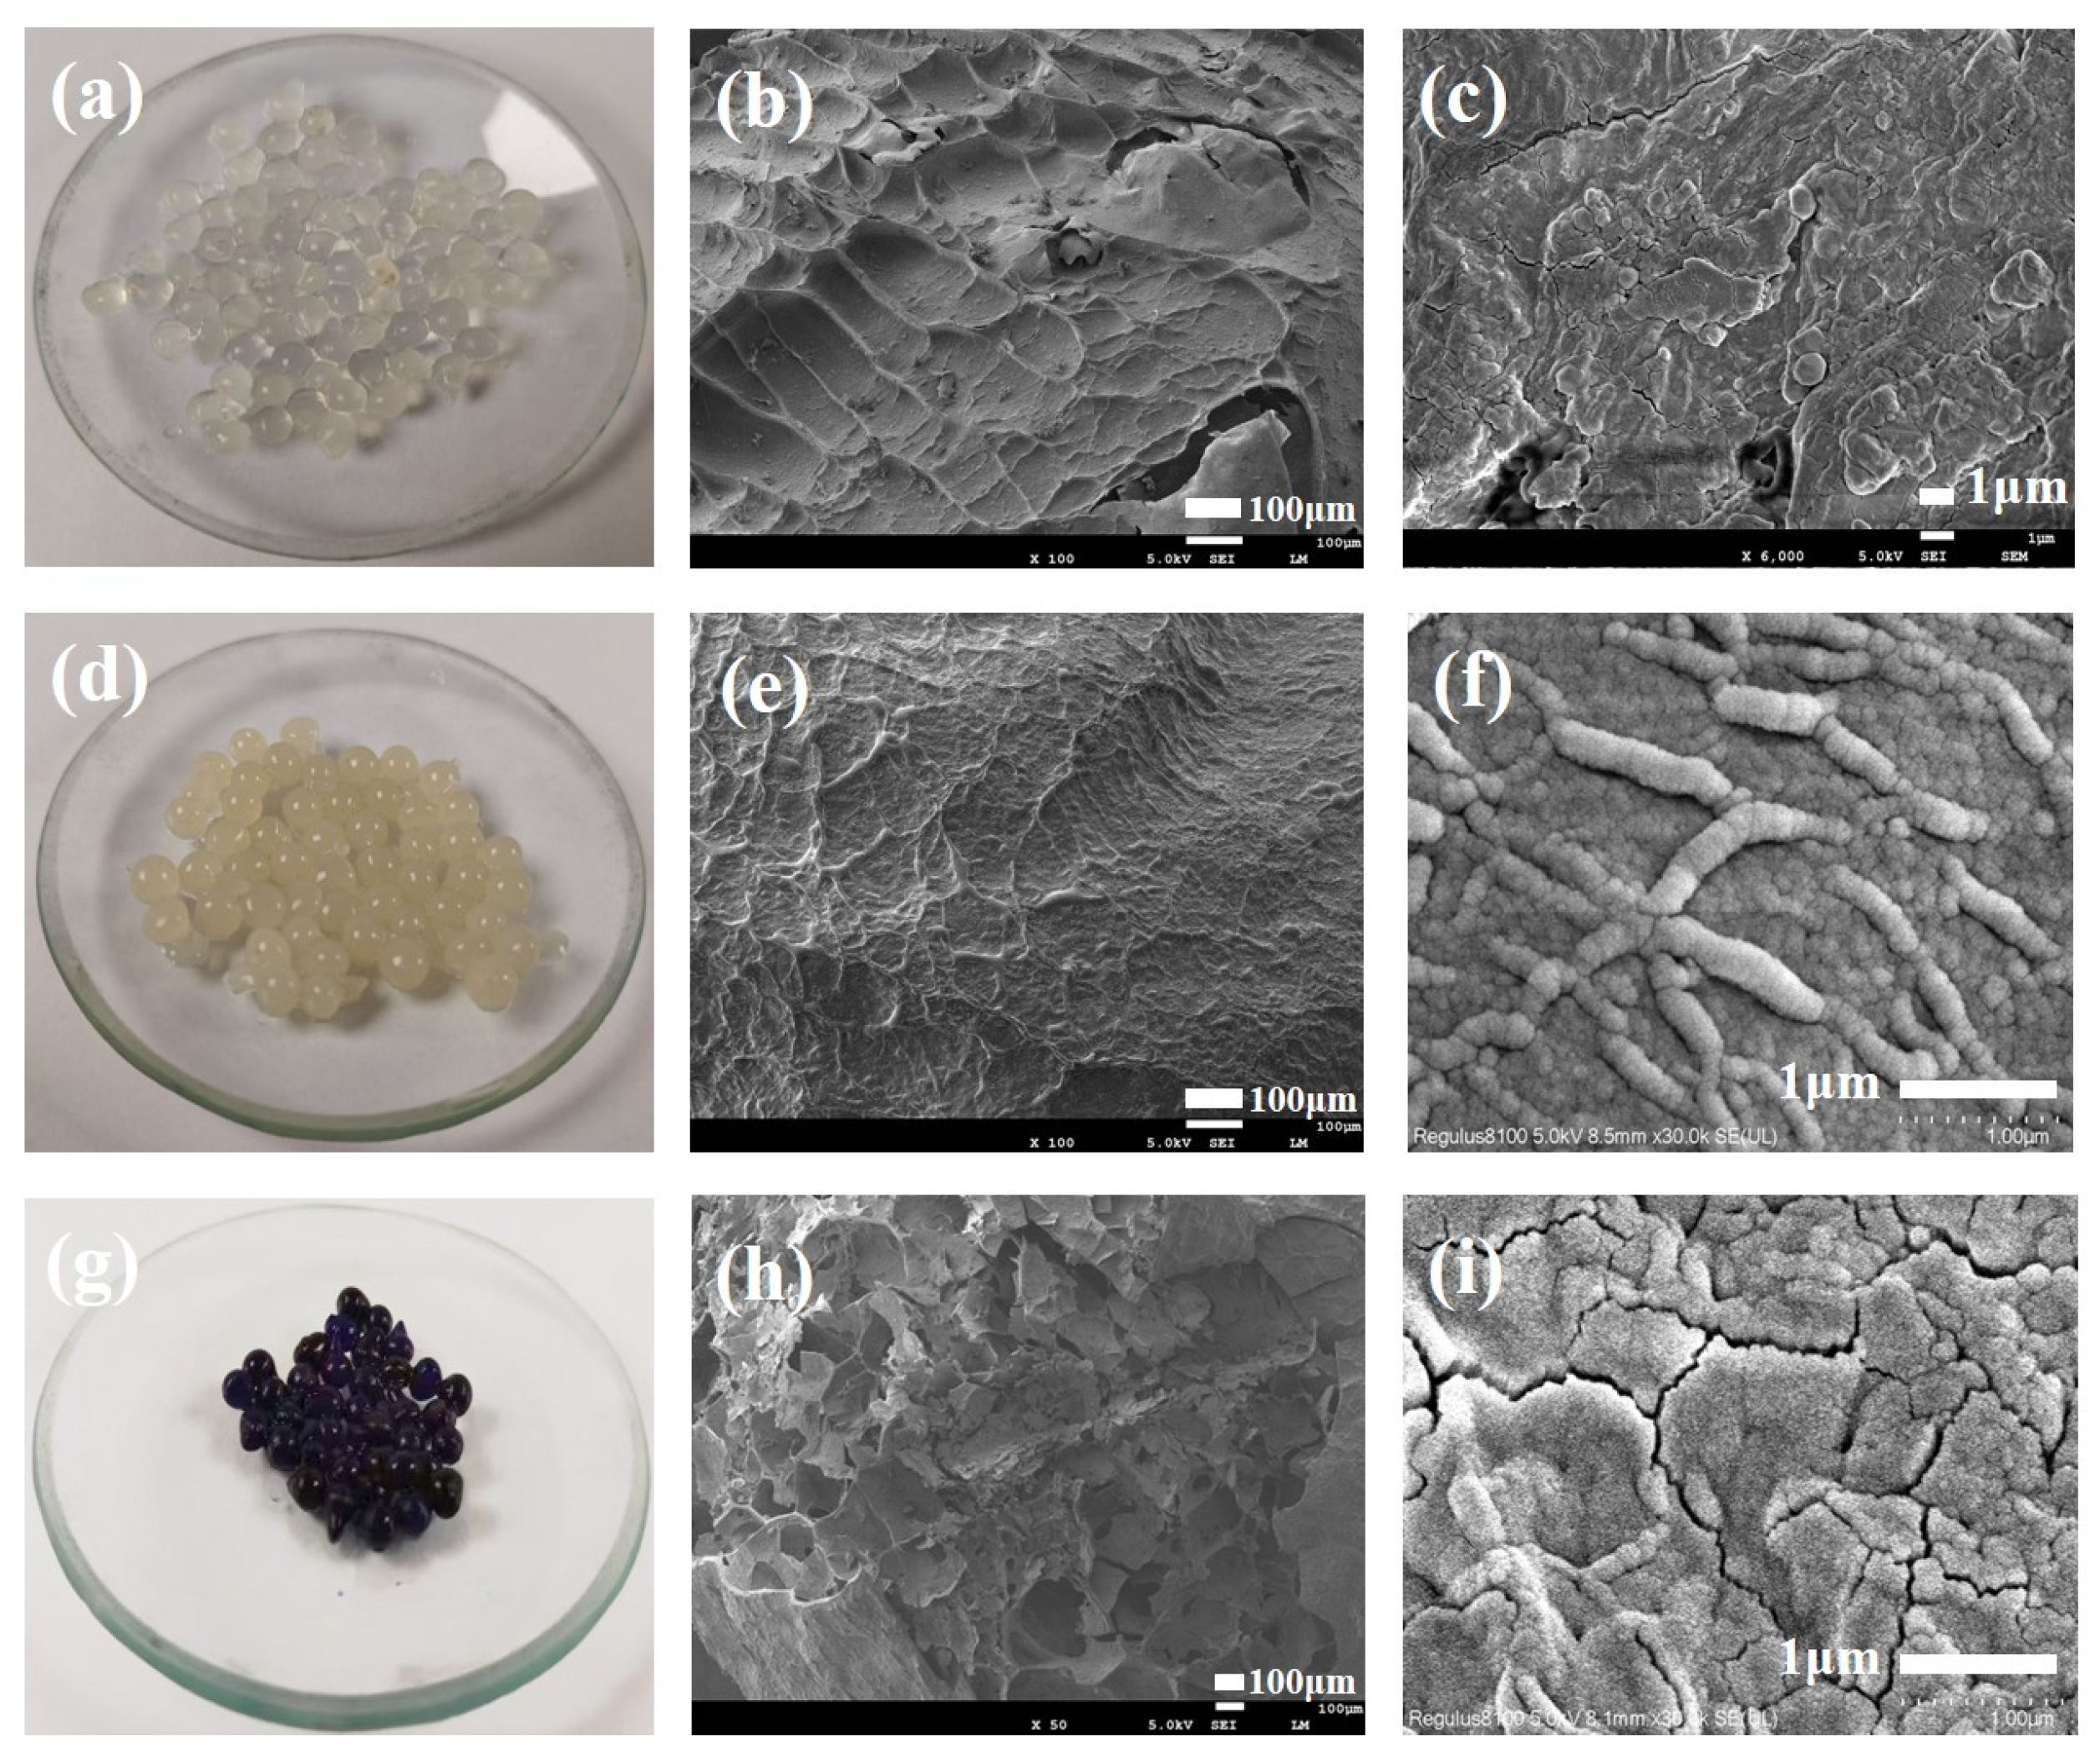
3.1. SEM Analysis
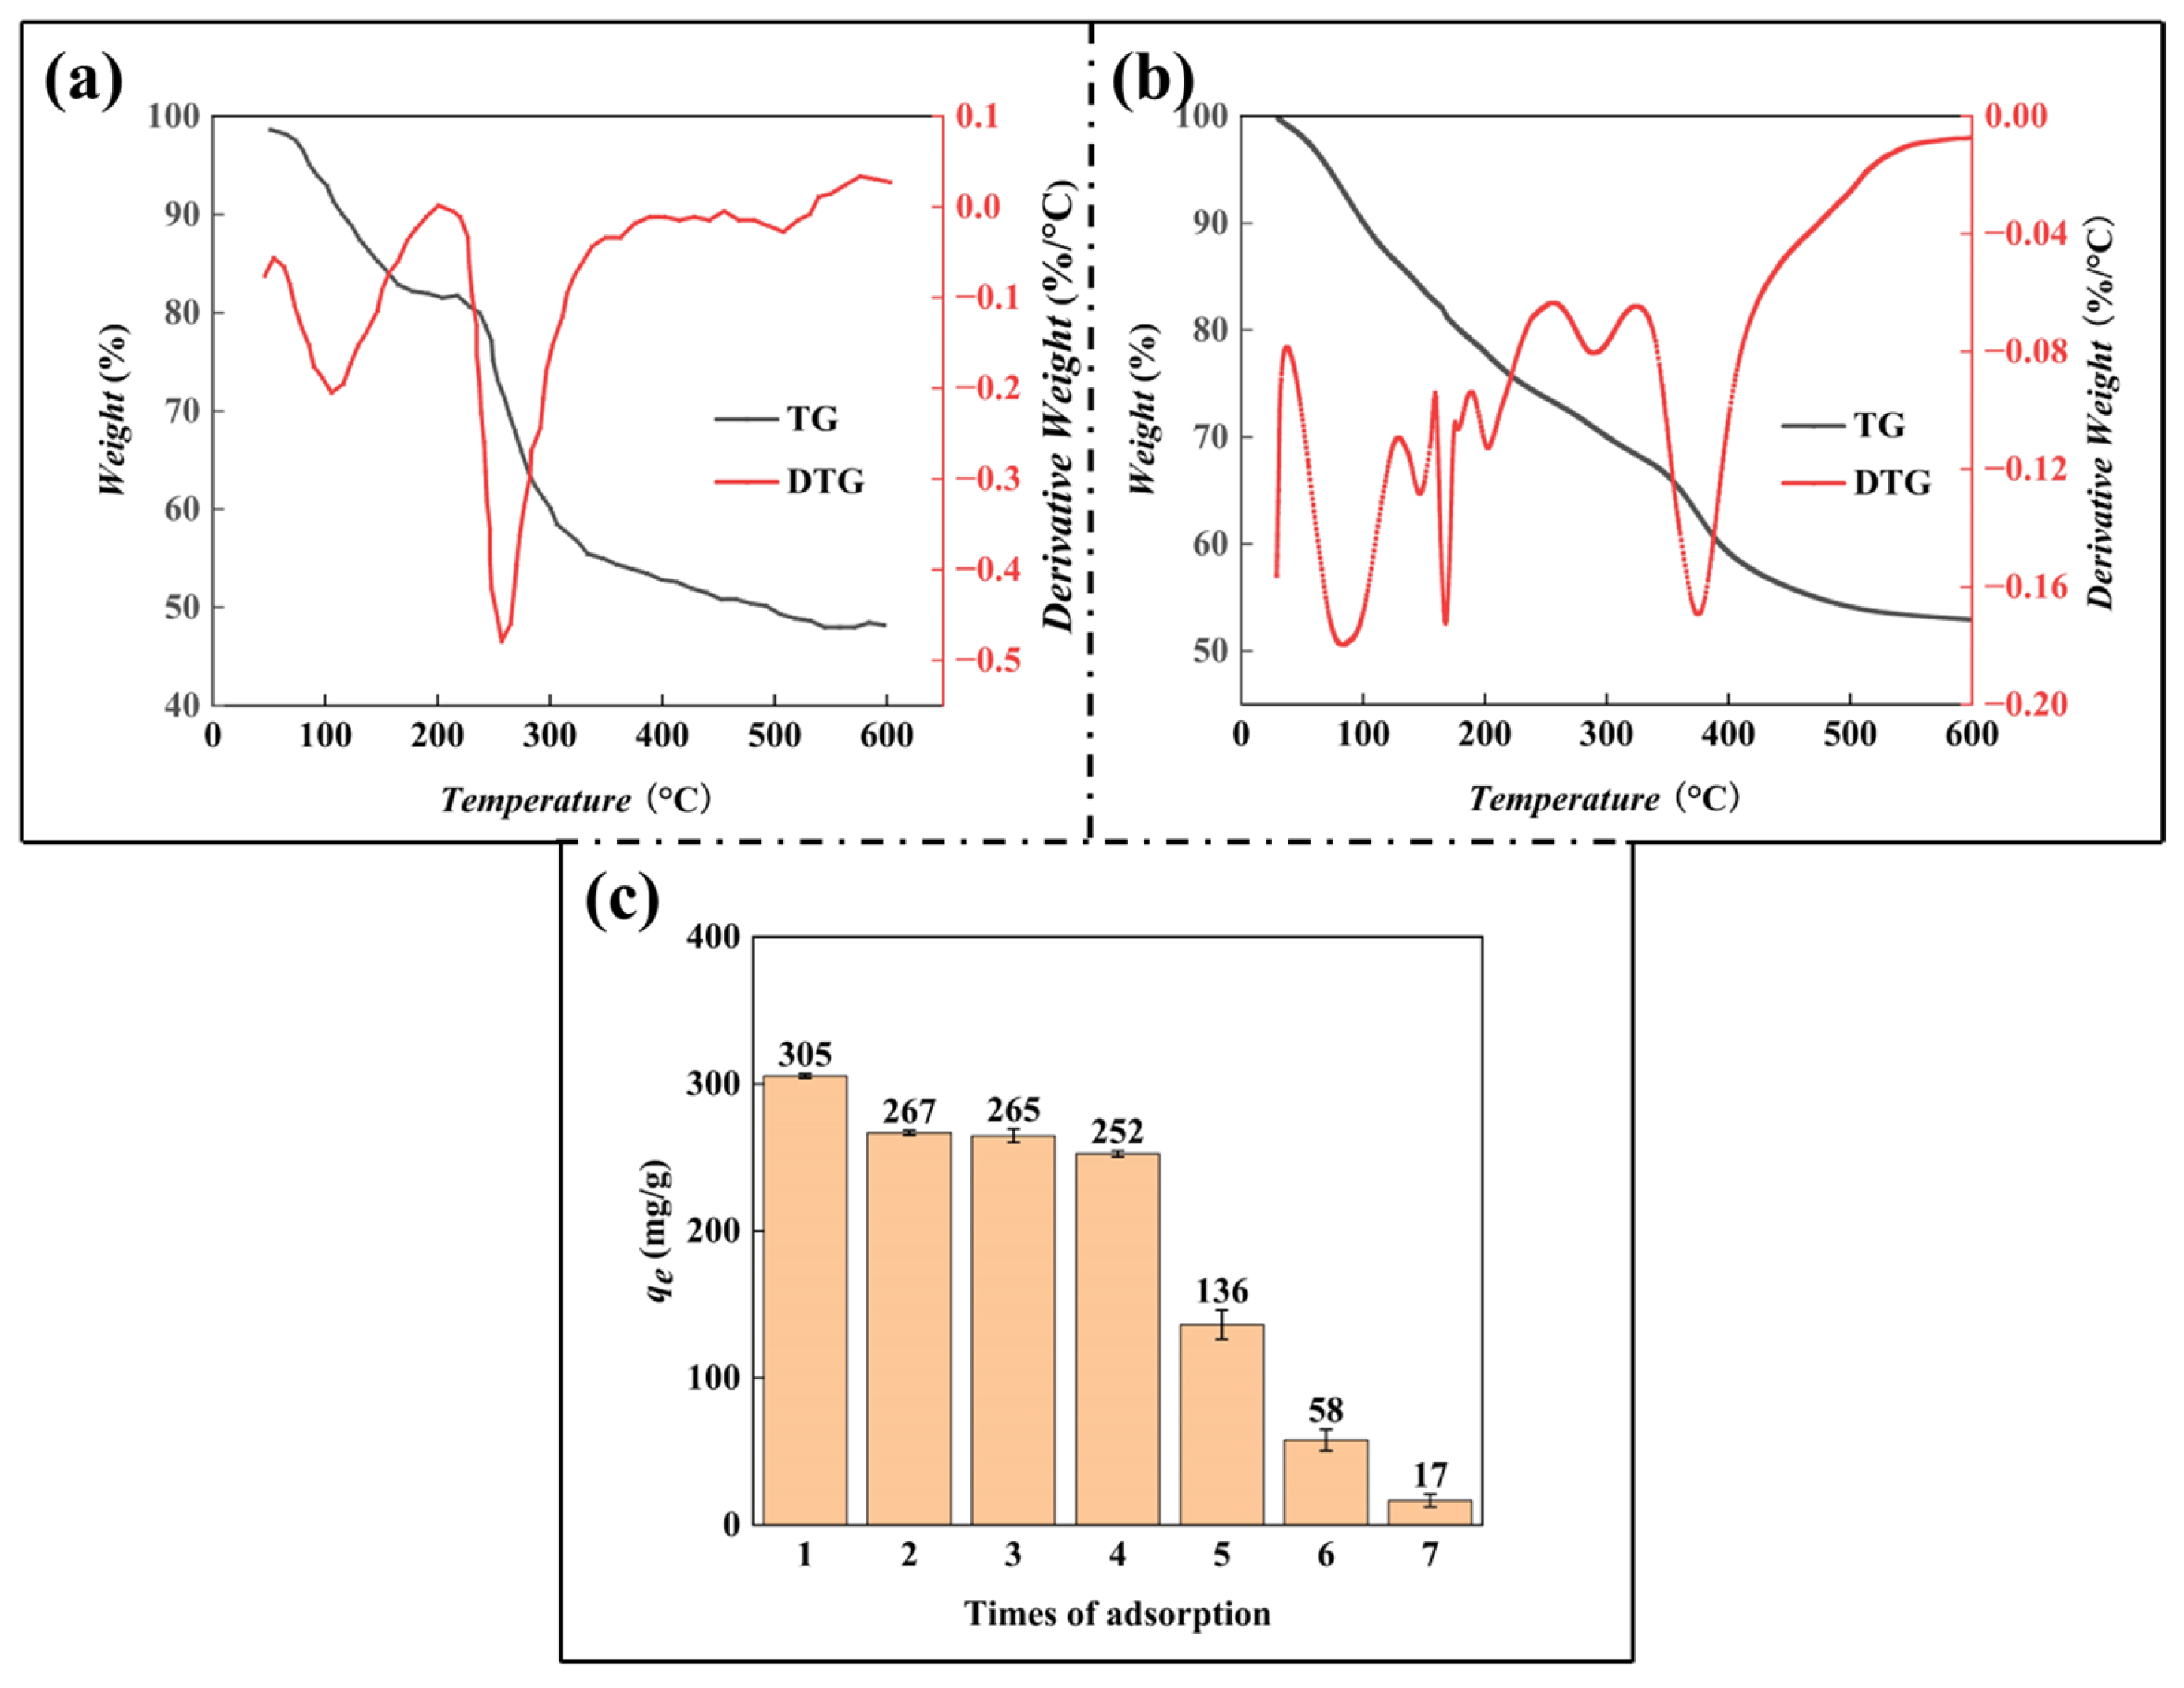
3.2. TGA Analysis
3.3. Adsorption-Desorption Cycle Test
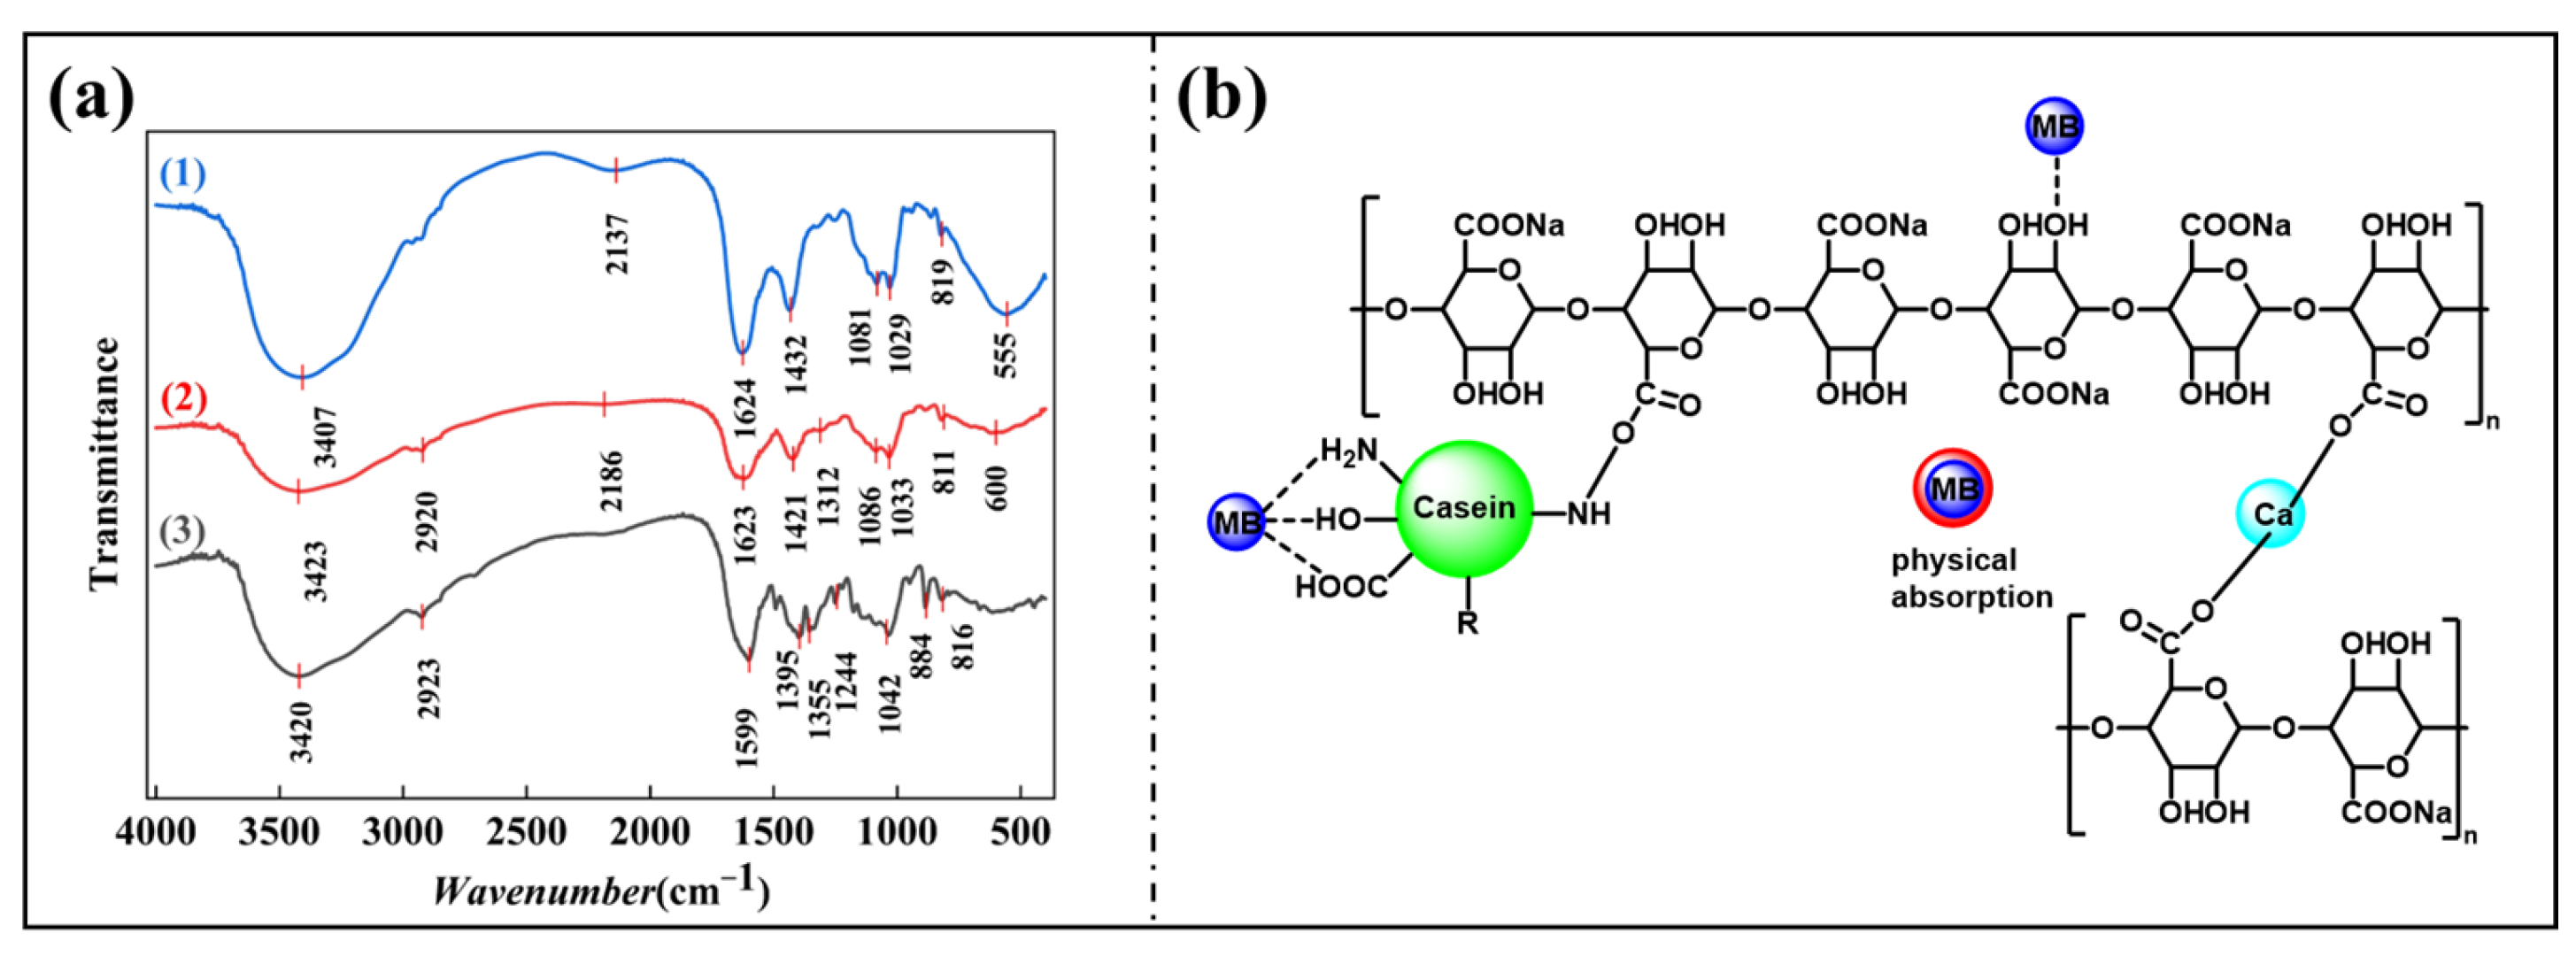
3.4. Maillard Reaction Verification
3.5. Effect of Different Samples on the Adsorption Effect and the Effect of the Initial pH of the Solution on the Adsorption Effect
3.6. Adsorption Kinetics Studies
3.7. Adsorption Isotherm Studies and Adsorption Thermodynamics Study
3.8. Mechanism Analysis
3.9. Comparison, Advantages, and Limitations
- (1)
- High adsorption capacity (908 mg/g at 300 K), surpassing many reported biomass-based adsorbents (Table 6);
- (2)
- Utilization of green chemistry principles, avoiding toxic cross-linking agents;
- (3)
- Excellent biodegradability and renewability due to the natural origins of SA and CA.
- (1)
- The adsorption performance was only evaluated for MB; generalization to other dyes requires further validation;
- (2)
- The long-term stability and reusability of the gel beads in practical wastewater treatment scenarios were not thoroughly investigated;
- (3)
- The scalability of the synthesis process for industrial applications remains to be explored.

| Absorbent Materials | qe(mg/g) | Adsorption Reaction Condition | References |
|---|---|---|---|
| Magadiite-chitosan composite beads | 45 | 303 K, c0 = 100 mg/L, 40 mL | [51] |
| Alg-g-AO | 24 | 303 K, c0 = 50 mg/L, 25 mL | [52] |
| Carboxymethyl cellulose/k-carrageenan/montmorillonite beads | 12 | 303 K, c0 = 100 mg/L, 50 mL | [53] |
| CGC/SA | 387 | 298 K, c0 = 400 mg/L | [54] |
| m-ALG/PESA gel beads | 400 | 293 K, c0 = 500 mg/L, 25 mL | [55] |
| PVA/SA/Fe3O4@KHA gel beads | 782 | 293 K, c0 = 1000 mg/L, 50 mL | [56] |
| SA/CA gel beads | 300 K, 50 mL, c0 = 50 mg/L, qe = 52 mg/g c0 = 500 mg/L, qe = 474 mg/g c0 = 1000 mg/L, qe = 862 mg/g | This work | |
4. Conclusions
Author Contributions
Funding
Data Availability Statement
Conflicts of Interest
Abbreviations
| SA | Sodium alginate |
| CA | Casein |
| SA/CA | Sodium alginate-Casein compound gel material |
| OPA | o-Phthalaldehyde |
| SDS | Sodium dodecyl sulfate |
| MB | Methylene blue |
| SEM | Scanning electron microscope |
| FT-IR | Fourier transform infrared spectrometer |
| UV-light | Ultraviolet light |
References
- Sakkas, V.A.; Islam, M.A.; Stalikas, C.; Albanis, T.A. Photocatalytic degradation using design of experiments: A review and example of the Congo red degradation. J. Hazard. Mater. 2010, 175, 33–44. [Google Scholar] [CrossRef] [PubMed]
- Kokabian, B.; Bonakdarpour, B.; Fazel, S. The effect of salt on the performance and characteristics of a combined anaerobic-aerobic biological process for the treatment of synthetic wastewaters containing Reactive Black 5. Chem. Eng. J. 2013, 221, 363–372. [Google Scholar] [CrossRef]
- Lau, Y.-Y.; Wong, Y.-S.; Teng, T.-T.; Morad, N.; Rafatullah, M.; Ong, S.-A. Coagulation-flocculation of azo dye Acid Orange 7 with green refined laterite soil. Chem. Eng. J. 2014, 246, 383–390. [Google Scholar] [CrossRef]
- Luo, P.; Zhao, Y.; Zhang, B.; Liu, J.; Yang, Y.; Liu, J. Study on the adsorption of Neutral Red from aqueous solution onto halloysite nanotubes. Water Res. 2010, 44, 1489–1497. [Google Scholar] [CrossRef]
- Mohan, D.; Pittman, C.U., Jr. Arsenic removal from water/wastewater using adsorbents—A critical review. J. Hazard. Mater. 2007, 142, 1–53. [Google Scholar] [CrossRef]
- Crini, G. Non-conventional low-cost adsorbents for dye removal: A review. Bioresour. Technol. 2006, 97, 1061–1085. [Google Scholar] [CrossRef]
- Belhouchat, N.; Zaghouane-Boudiaf, H.; Viseras, C. Removal of anionic and cationic dyes from aqueous solution with activated organo-bentonite/sodium alginate encapsulated beads. Appl. Clay Sci. 2017, 135, 9–15. [Google Scholar] [CrossRef]
- Latha, M.S.; Jayakrishnan, A.; Rathinam, K.; Mohanty, M. Casein as a carrier matrix for 5-fluorouracil: Drug release from microspheres, drug-protein conjugates and in-vivo degradation of microspheres in rat muscle. J. Pharm. Pharmacol. 1994, 46, 858–862. [Google Scholar] [CrossRef]
- Qiu, J.; Zheng, Q.; Fang, L.; Wang, Y.; Min, M.; Shen, C.; Tong, Z.; Xiong, C. Preparation and characterization of casein-carrageenan conjugates and self-assembled microcapsules for encapsulation of red pigment from paprika. Carbohydr. Polym. 2018, 196, 322–331. [Google Scholar] [CrossRef]
- McSweeney, P.L.; Fox, P.F. Advanced Dairy Chemistry: Volume 1A: Proteins: Basic Aspects; Springer Science & Business Media: Berlin/Heidelberg, Germany, 2013. [Google Scholar]
- Ghimire, K.N.; Inoue, K.; Ohto, K.; Hayashida, T. Adsorption study of metal ions onto crosslinked seaweed Laminaria japonica. Bioresour. Technol. 2008, 99, 32–37. [Google Scholar] [CrossRef]
- Fan, L.; Yang, G.; Li, M.; Xu, J.; Zhou, D.; Li, R.; Wang, S. Radio frequency heating assisted Maillard reaction of whey protein—Gum Arabic: Improving structural and unlocking functional properties. Int. J. Biol. Macromol. 2025, 293, 139341. [Google Scholar] [CrossRef] [PubMed]
- Ke, C.; Li, L. Influence mechanism of polysaccharides induced Maillard reaction on plant proteins structure and functional properties: A review. Carbohydr. Polym. 2023, 302, 120430. [Google Scholar] [CrossRef] [PubMed]
- Li, Z.; Xi, J.; Chen, H.; Chen, W.; Chen, W.; Zhong, Q.; Zhang, M. Effect of glycosylation with apple pectin, citrus pectin, mango pectin and sugar beet pectin on the physicochemical, interfacial and emulsifying properties of coconut protein isolate. Food Res. Int. 2022, 156, 111363. [Google Scholar] [CrossRef] [PubMed]
- Chen, W.; Lv, R.; Wang, W.; Ma, X.; Muhammad, A.I.; Guo, M.; Ye, X.; Liu, D. Time effect on structural and functional properties of whey protein isolate-gum acacia conjugates prepared via Maillard reaction. J. Sci. Food Agric. 2019, 99, 4801–4807. [Google Scholar] [CrossRef]
- de Oliveira, F.C.; Coimbra, J.S.d.R.; de Oliveira, E.B.; Zuñiga, A.D.G.; Rojas, E.E.G. Food Protein-polysaccharide Conjugates Obtained via the Maillard Reaction: A Review. Crit. Rev. Food Sci. Nutr. 2016, 56, 1108–1125. [Google Scholar] [CrossRef]
- Chen, K.; Zhao, J.; Shi, X.; Abdul, Q.; Jiang, Z. Characterization and Antioxidant Activity of Products Derived from Xylose-Bovine Casein Hydrolysate Maillard Reaction: Impact of Reaction Time. Foods 2019, 8, 242. [Google Scholar] [CrossRef]
- Wen, C.; Zhang, J.; Qin, W.; Gu, J.; Zhang, H.; Duan, Y.; Ma, H. Structure and functional properties of soy protein isolate-lentinan conjugates obtained in Maillard reaction by slit divergent ultrasonic assisted wet heating and the stability of oil-in-water emulsions. Food Chem. 2020, 331, 127374. [Google Scholar] [CrossRef]
- Kato, H.; Fujimaki, M. Formation of N-Substituted Pyrrole-2-Aldehydes in the Browning Reaction Between D-Xylose and Amino Compounds. J. Food Sci. 1968, 33, 445–449. [Google Scholar] [CrossRef]
- Li, T.; Fan, J.; Sun, T. Effective removal of methylene blue dye from water with nanocomposite ceramsites in a fixed-bed column. Environ. Technol. 2021, 42, 3807–3819. [Google Scholar] [CrossRef]
- Ma, C.; Sun, C.; Wu, Y. Preparation of Copper Doped Nanometer Titanium Dioxide and Its Antibacterial Properties. Packag. Eng. 2016, 37, 32–37. [Google Scholar]
- Ul Alamin, N.; Khan, A.S.; Nasrullah, A.; Iqbal, J.; Ullah, Z.; Din, I.U.; Muhammad, N.; Khan, S.Z. Activated carbon-alginate beads impregnated with surfactant as sustainable adsorbent for efficient removal of methylene blue. Int. J. Biol. Macromol. 2021, 176, 233–243. [Google Scholar] [CrossRef] [PubMed]
- Xu, L.; Liu, Y.; Wang, J.; Tang, Y.; Zhang, Z. Selective adsorption of Pb2+ and Cu2+ on amino-modified attapulgite: Kinetic, thermal dynamic and DFT studies. J. Hazard. Mater. 2021, 404, 124140. [Google Scholar] [CrossRef]
- Filipovic, K.; Petrovic, M.; Najdanovic, S.; Velinov, N.; Hurt, A.; Bojic, A.; Kostic, M. Highly efficient nano sorbent as a superior material for the purification of wastewater contaminated with anthraquinone dye RB19. J. Water Process Eng. 2024, 67, 106118. [Google Scholar] [CrossRef]
- Weber Walter, J.; Morris, J.C. Kinetics of Adsorption on Carbon from Solution. J. Sanit. Eng. Div. 1963, 89, 31–59. [Google Scholar] [CrossRef]
- Lagergren, S. Zur Theorie der sogenannten Adsorption gelöster Stoffe. Z. Chem. Ind. Kolloide 1907, 2, 15. [Google Scholar] [CrossRef]
- Yeddou, N.; Bensmaili, A. Kinetic models for the sorption of dye from aqueous solution by clay-wood sawdust mixture. Desalination 2005, 185, 499–508. [Google Scholar] [CrossRef]
- Langmuir, I. The adsorption of gases on plane surfaces of glass, mica and platinum. J. Am. Chem. Soc. 1918, 40, 1361–1403. [Google Scholar] [CrossRef]
- Freundlich, H. Über die Adsorption in Lösungen. Z. Für Phys. Chem. 1907, 57U, 385–470. [Google Scholar] [CrossRef]
- Sips, R. On the Structure of a Catalyst Surface. J. Chem. Phys. 1948, 16, 490–495. [Google Scholar] [CrossRef]
- Hota, A.; Patro, S.G.K.; Panda, S.K.; Khan, M.A.; Abul Hasan, M.; Islam, S.; Alsubih, M.; Khan, N.A.; Zahmatkesh, S. Removing fluoride ions from wastewater by Fe3O4 nanoparticles: Modified Rhodophytes (red algae) as biochar. J. Water Process Eng. 2024, 58, 104776. [Google Scholar] [CrossRef]
- Mekawy, Z.A.; Moussa, S.I.; Dakroury, G.A. Efficacious conditions for sorption of 85Sr (II) and 152+154Eu (III) onto natural composite beads. J. Water Process Eng. 2024, 64, 105622. [Google Scholar] [CrossRef]
- Najdanović, S.M.; Kostić, M.M.; Petrović, M.M.; Velinov, N.D.; Radović Vučić, M.D.; Mitrović, J.Z.; Bojić, A.L. Effect of Electrochemical Synthesis Parameters on the Morphology, Crystal and Chemical Structure, and Sorption Efficiency of Basic Bismuth Nitrates. Molecules 2025, 30, 1020. [Google Scholar] [CrossRef] [PubMed]
- Luo, T.; Hao, Y.; Wang, C.; Jiang, W.; Ji, X.; Yang, G.; Chen, J.; Janaswamy, S.; Lyu, G. Lignin Nanoparticles and Alginate Gel Beads: Preparation, Characterization and Removal of Methylene Blue. Nanomaterials 2022, 12, 176. [Google Scholar] [CrossRef] [PubMed]
- Hu, Z.-H.; Omer, A.M.; Ouyang, X.-k.; Yu, D. Fabrication of carboxylated cellulose nanocrystal/sodium alginate hydrogel beads for adsorption of Pb(II) from aqueous solution. Int. J. Biol. Macromol. 2018, 108, 149–157. [Google Scholar] [CrossRef]
- Wang, W.; Zhao, Y.; Bai, H.; Zhang, T.; Ibarra-Galvan, V.; Song, S. Methylene blue removal from water using the hydrogel beads of poly(vinyl alcohol)-sodium alginate-chitosan-montmorillonite. Carbohydr. Polym. 2018, 198, 518–528. [Google Scholar] [CrossRef]
- Yadav, S.; Asthana, A.; Singh, A.K.; Chakraborty, R.; Vidya, S.S.; Singh, A.; Carabineiro, S.A.C. Methionine-Functionalized Graphene Oxide/Sodium Alginate Bio-Polymer Nanocomposite Hydrogel Beads: Synthesis, Isotherm and Kinetic Studies for an Adsorptive Removal of Fluoroquinolone Antibiotics. Nanomaterials 2021, 11, 568. [Google Scholar] [CrossRef]
- Lou, S.; Liu, B.; Qin, Y.; Zeng, Y.; Zhang, W.; Zhang, L. Enhanced removal of As(III) and As(V) from water by a novel zirconium-chitosan modified spherical sodium alginate composite. Int. J. Biol. Macromol. 2021, 176, 304–314. [Google Scholar] [CrossRef]
- Sun, W.-W.; Yu, S.-J.; Zeng, X.-A.; Yang, X.-Q.; Jia, X. Properties of whey protein isolate-dextran conjugate prepared using pulsed electric field. Food Res. Int. 2011, 44, 1052–1058. [Google Scholar] [CrossRef]
- Grant, G.T.; Morris, E.R.; Rees, D.A.; Smith, P.J.C.; Thom, D. Biological interactions between polysaccharides and divalent cations: The egg-box model. FEBS Lett. 1973, 32, 195–198. [Google Scholar] [CrossRef]
- Hassan, A.F.; Abdel-Mohsen, A.M.; Fouda, M.M.G. Comparative study of calcium alginate, activated carbon, and their composite beads on methylene blue adsorption. Carbohydr. Polym. 2014, 102, 192–198. [Google Scholar] [CrossRef]
- Subedi, N.; Lähde, A.; Abu-Danso, E.; Iqbal, J.; Bhatnagar, A. A comparative study of magnetic chitosan (Chi@Fe3O4) and graphene oxide modified magnetic chitosan (Chi@Fe3O4GO) nanocomposites for efficient removal of Cr(VI) from water. Int. J. Biol. Macromol. 2019, 137, 948–959. [Google Scholar] [CrossRef] [PubMed]
- Velinov, N.; Radović Vučić, M.; Petrović, M.; Najdanović, S.; Kostić, M.; Mitrović, J.; Bojić, A. The influence of various solvents’ polarity in the synthesis of wood biowaste sorbent: Evaluation of dye sorption. Biomass Convers. Biorefinery 2023, 13, 8139–8150. [Google Scholar] [CrossRef]
- Kheirabadi, R.N.; Tabrizi, S.N.; Sangpour, P. Synthesis of Sodium Alginate-Derived Carbon Aerogel for Adsorptive Removal of Methylene Blue. Iran. J. Chem. Chem. Eng. Int. Engl. Ed. 2020, 39, 157–168. [Google Scholar] [CrossRef]
- Xu, C.; Shi, S.; Dong, Q.; Zhu, S.; Wang, Y.; Zhou, H.; Wang, X.; Zhu, L.; Zhang, G.; Xu, D. Citric-acid-assisted sol-gel synthesis of mesoporous silicon-magnesium oxide ceramic fibers and their adsorption characteristics. Ceram. Int. 2020, 46, 10105–10114. [Google Scholar] [CrossRef]
- O’Riordan, N.; Kane, M.; Joshi, L.; Hickey, R.M. Structural and functional characteristics of bovine milk protein glycosylation. Glycobiology 2014, 24, 220–236. [Google Scholar] [CrossRef]
- Wu, Y.; Qi, H.; Shi, C.; Ma, R.; Liu, S.; Huang, Z. Preparation and adsorption behaviors of sodium alginate-based adsorbent-immobilized β-cyclodextrin and graphene oxide. RSC Adv. 2017, 7, 31549–31557. [Google Scholar] [CrossRef]
- Velinov, N.; Najdanovic, S.; Vucic, M.R.; Mitrovic, J.; Kostic, M.; Bojic, D.; Bojic, A. Biosorption of loperamide by lignocellulosic-Al2O3 hybrid: Optimization, kinetics, isothermal and thermodynamic studies. Cellul. Chem. Technol. 2019, 53, 175–189. [Google Scholar] [CrossRef]
- Zhang, L.; Li, Q.; Bai, X.; Li, X.; Zhang, G.; Zou, J.; Fei, P.; Lai, W. Double network self-healing hydrogels based on carboxyethyl chitosan/oxidized sodium alginate/Ca2+: Preparation, characterization and application in dye absorption. Int. J. Biol. Macromol. 2024, 264, 130564. [Google Scholar] [CrossRef]
- Zhang, Z.; Xu, L.; Liu, Y.; Feng, R.; Zou, T.; Zhang, Y.; Kang, Y.; Zhou, P. Efficient removal of methylene blue using the mesoporous activated carbon obtained from mangosteen peel wastes: Kinetic, equilibrium, and thermodynamic studies. Microporous Mesoporous Mater. 2021, 315, 110904. [Google Scholar] [CrossRef]
- Mokhtar, A.; Abdelkrim, S.; Djelad, A.; Sardi, A.; Boukoussa, B.; Sassi, M.; Bengueddach, A. Adsorption behavior of cationic and anionic dyes on magadiite-chitosan composite beads. Carbohydr. Polym. 2020, 229, 115399. [Google Scholar] [CrossRef]
- Shelar-Lohar, G.; Joshi, S. Amidoximated functionalized sodium alginate graft copolymer: An effective adsorbent for rapid removal of cationic dyes. Mater. Today Proc. 2020, 26, 3357–3362. [Google Scholar] [CrossRef]
- Liu, C.; Omer, A.M.; Ouyang, X.-k. Adsorptive removal of cationic methylene blue dye using carboxymethyl cellulose/k-carrageenan/activated montmorillonite composite beads: Isotherm and kinetic studies. Int. J. Biol. Macromol. 2018, 106, 823–833. [Google Scholar] [CrossRef] [PubMed]
- Kasbaji, M.; Mennani, M.; Grimi, N.; Oubenali, M.; Mbarki, M.; El Zakhem, H.; Moubarik, A. Adsorption of cationic and anionic dyes onto coffee grounds cellulose/sodium alginate double-network hydrogel beads: Isotherm analysis and recyclability performance. Int. J. Biol. Macromol. 2023, 239, 124288. [Google Scholar] [CrossRef] [PubMed]
- Metin, A.Ü.; Doğan, D.; Can, M. Novel magnetic gel beads based on ionically crosslinked sodium alginate and polyanetholesulfonic acid: Synthesis and application for adsorption of cationic dyes. Mater. Chem. Phys. 2020, 256, 123659. [Google Scholar] [CrossRef]
- Niu, Y.H.; Han, X.X.; Song, J.; Huang, L.X. Removal of methylene blue and lead(ii) via PVA/SA double-cross-linked network gel beads loaded with Fe3O4@KHA nanoparticles. New J. Chem. 2021, 45, 5605–5620. [Google Scholar] [CrossRef]


| Maillard Reaction Verification | 0.66 mg/mL CA + 1 mg/mL SA | 1 mg/mL CA + 1.5 mg/mL SA |
|---|---|---|
| DG% | 11.40% ± 0.24% | 13.90% ± 0.27% |
| Browning degree (A420) | 0.033 ± 1.43 × 10⁻⁴ | 0.020 ± 2.11 × 10⁻⁴ |
| SA/CA Mass Ratios | Amount of SA Solids Added (g) | Amount of CA Solids Added (g) | qe(mg/g) |
|---|---|---|---|
| SA/CA@0.75 | 1.00 | 0.75 | 277.52 ± 0.96 |
| SA/CA@1 | 1.00 | 305.01 ± 0.22 | |
| SA/CA@1.25 | 1.25 | 275.57 ± 1.75 | |
| SA/CA@1.5 | 1.50 | 270.52 ± 7.98 | |
| SA/CA@1.75 | 1.75 | 258.63 ± 0.71 |
| Kinetic Models | Parameters | Values |
|---|---|---|
| Pseudo-first-order | k1 | 0.0022 ± 1.69 × 10⁻⁴ |
| qe, cal | 309.25 ± 9.86 | |
| r2(COD) | 0.98 | |
| MRD | 10.19 | |
| Pseudo-second-order | k2 | 4.98 × 10⁻⁶ ± 9.26 × 10⁻⁷ |
| qe | 396.15 ± 21.53 | |
| r2(COD) | 0.85 | |
| MRD | 11.93 | |
| Intra-particle diffusion | kid1 | 10.43 ± 0.90 |
| C1 | −32.13 ± 13.76 | |
| r2(COD) | 0.93 | |
| kid2 | 3.52 ± 1.60 | |
| C2 | 154.41 ± 63.75 | |
| r2(COD) | 0.84 |
| Isotherm Parameters | ||||||||
|---|---|---|---|---|---|---|---|---|
| qe,exp = 951 mg/g | r2(COD) | MRD | ||||||
| Langmuir | qm | 1268.52 ± 135.64 | KL | 0.0015 ± 3.80 × 10⁻⁴ | 0.95 | 15.47 | ||
| Freundlich | KF | 28.58 ± 1.02 | n | 2.21 ± 0.0031 | 0.97 | 25.86 | ||
| Temkin | b | 10.27 ± 0.0060 | Kt | 0.023 ± 4.40 × 10⁻⁴ | 0.97 | 17.45 | ||
| Sips | qm | 1270.46 ± 6.36 | βs | 0.0016 ± 2.23 × 10⁻⁵ | n | 0.85 ± 0.0060 | 0.99 | 18.48 |
| Thermodynamic Parameters | qe | lnKD | ΔG° (kJ/mol) | ΔS° (J/mol) | ΔH° (kJ/mol) | r2(COD) |
|---|---|---|---|---|---|---|
| 290 K | 1020.84 | 5.46 ± 0.081 | −13.17 ± 0.20 | −422.74 ± 5.31 | −135.63± 1.59 | 0.99 |
| 300 K | 951.14 | 3.48 ± 0.035 | −8.68 ± 0.086 | |||
| 310 K | 935.47 | 1.90 ± 0.11 | −4.90 ± 0.27 |
Disclaimer/Publisher’s Note: The statements, opinions and data contained in all publications are solely those of the individual author(s) and contributor(s) and not of MDPI and/or the editor(s). MDPI and/or the editor(s) disclaim responsibility for any injury to people or property resulting from any ideas, methods, instructions or products referred to in the content. |
© 2025 by the authors. Licensee MDPI, Basel, Switzerland. This article is an open access article distributed under the terms and conditions of the Creative Commons Attribution (CC BY) license (https://creativecommons.org/licenses/by/4.0/).
Share and Cite
Ge, R.; Wang, J.; Piao, J.; Pan, Z.; Zhang, Z.; Yang, Y.; Huang, J.; Liu, Z. Green Synthesis of Sodium Alginate/Casein Gel Beads and Applications. Nanomaterials 2025, 15, 456. https://doi.org/10.3390/nano15060456
Ge R, Wang J, Piao J, Pan Z, Zhang Z, Yang Y, Huang J, Liu Z. Green Synthesis of Sodium Alginate/Casein Gel Beads and Applications. Nanomaterials. 2025; 15(6):456. https://doi.org/10.3390/nano15060456
Chicago/Turabian StyleGe, Ruixing, Jiaji Wang, Junlong Piao, Zhenghua Pan, Zhehao Zhang, Yating Yang, Jin Huang, and Zhiguo Liu. 2025. "Green Synthesis of Sodium Alginate/Casein Gel Beads and Applications" Nanomaterials 15, no. 6: 456. https://doi.org/10.3390/nano15060456
APA StyleGe, R., Wang, J., Piao, J., Pan, Z., Zhang, Z., Yang, Y., Huang, J., & Liu, Z. (2025). Green Synthesis of Sodium Alginate/Casein Gel Beads and Applications. Nanomaterials, 15(6), 456. https://doi.org/10.3390/nano15060456