
Biosynthesis Scale-Up Process for Magnetic Iron-Oxide Nanoparticles Using Eucalyptus globulus Extract and Their Separation Properties in Lubricant–Water Emulsions

 ,
,  , , and
Abstract
1. Introduction
2. Materials and Methods
2.1. Eucalyptus Globulus Extract by Decoction Method
2.2. Eucalyptus Globulus Extract by Infusion Method
2.3. Biosynthesis of IONPs and Scale-Up Process
2.4. Characterization of IONPs
2.4.1. X-Ray Diffraction
2.4.2. Transmission Electron Microscopy
2.4.3. Thermogravimetric Measurements
2.4.4. Dynamic Light Scattering (DLS) and Zeta Potential
2.4.5. 57Fe Mössbauer Spectrometry
2.4.6. Vibrating Sample Magnetometry
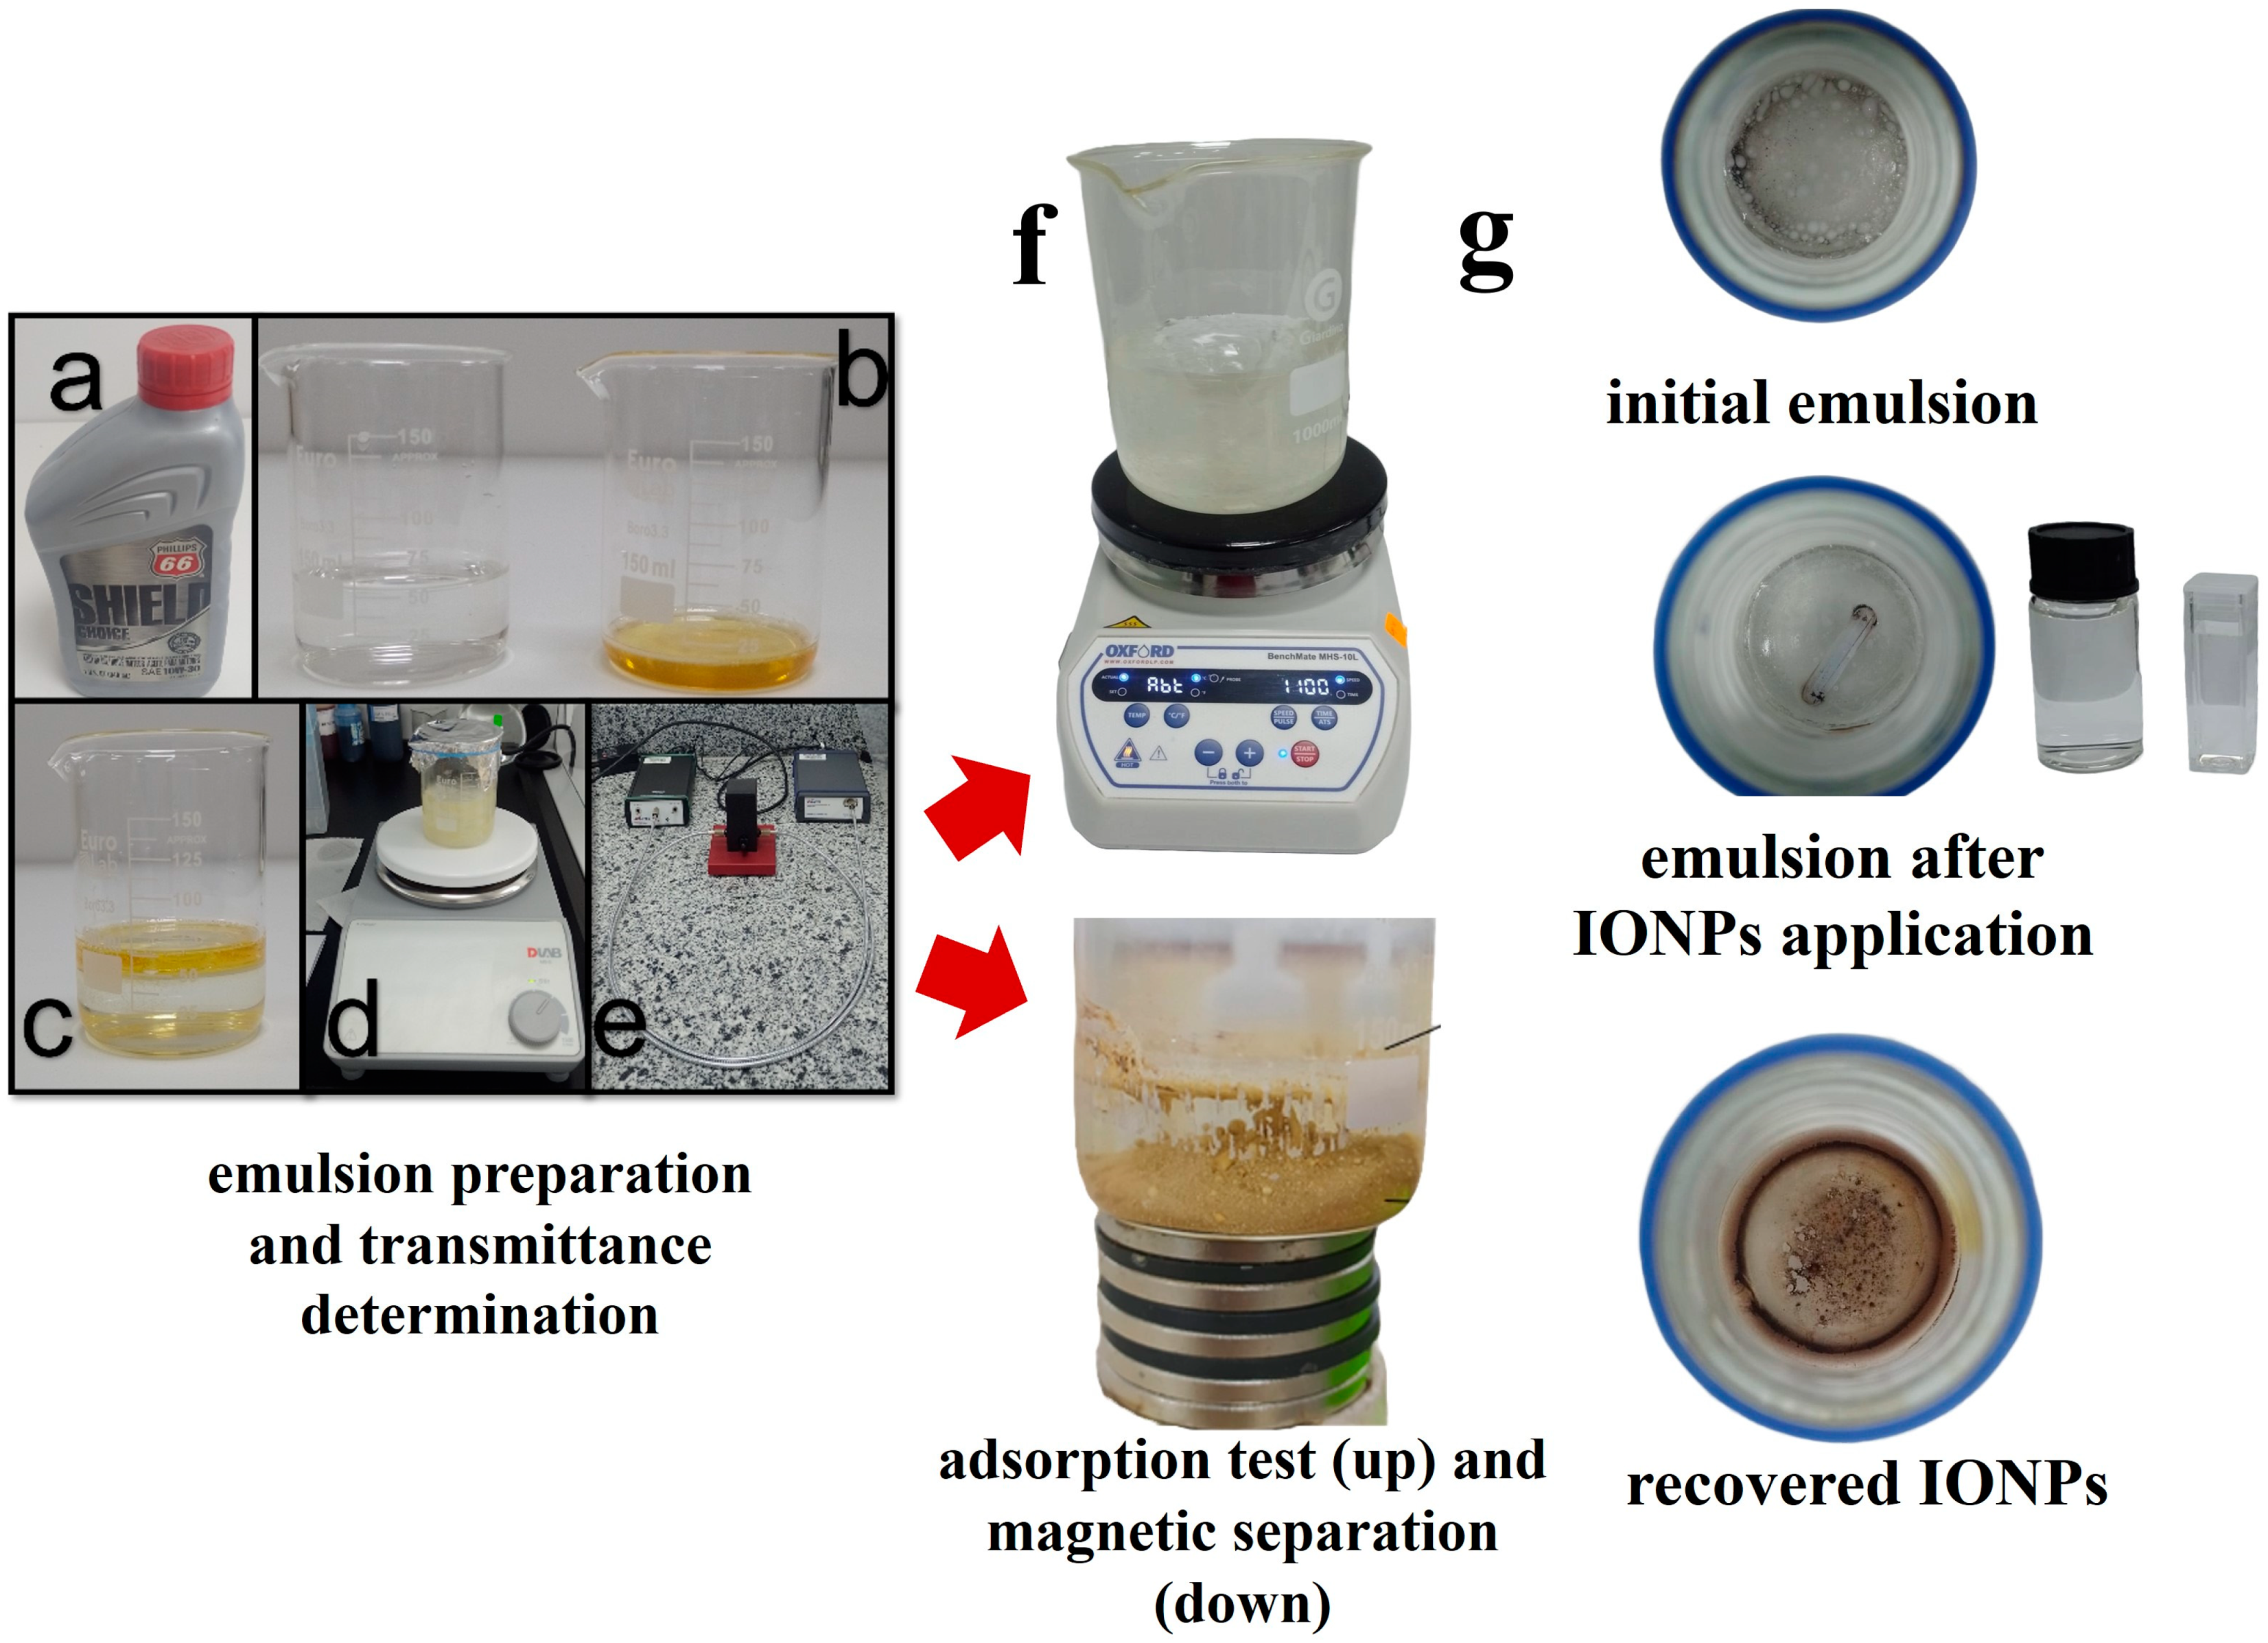
2.5. Preparation of the Oil–Water Emulsion and Removal Protocol
3. Results and Discussion
3.1. X-Ray Diffraction and Rietveld Analysis
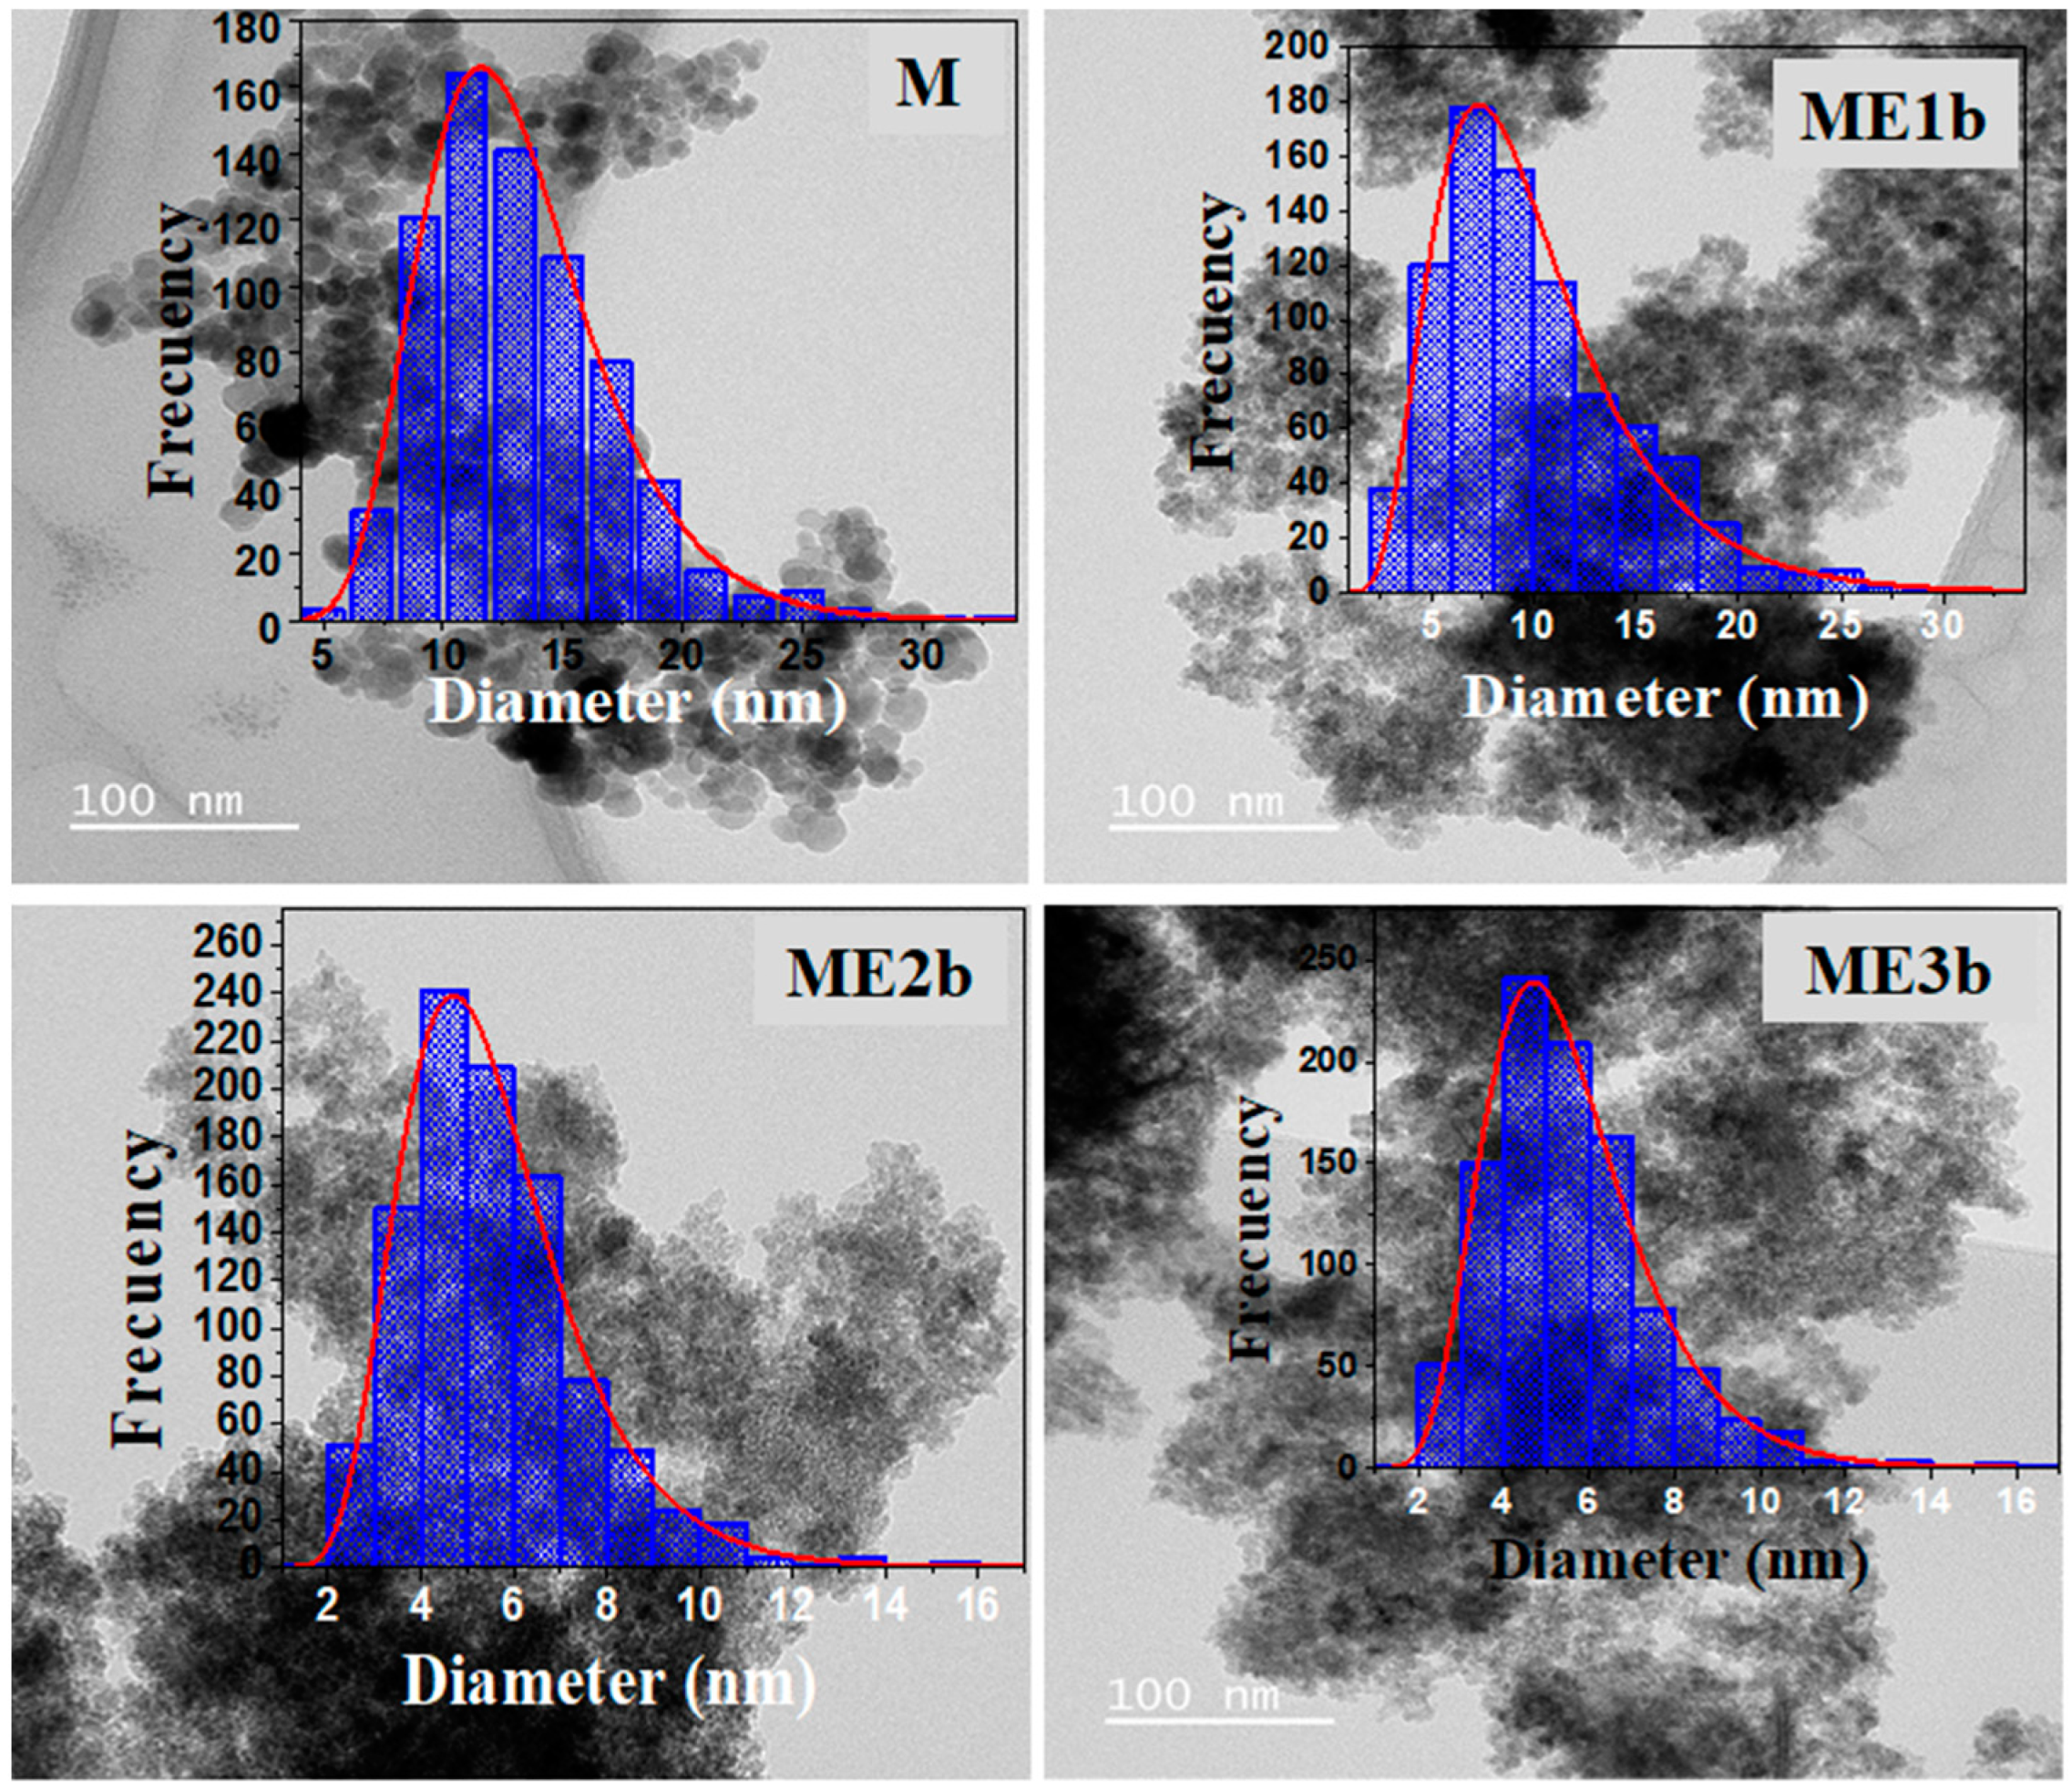
3.2. TEM Analysis
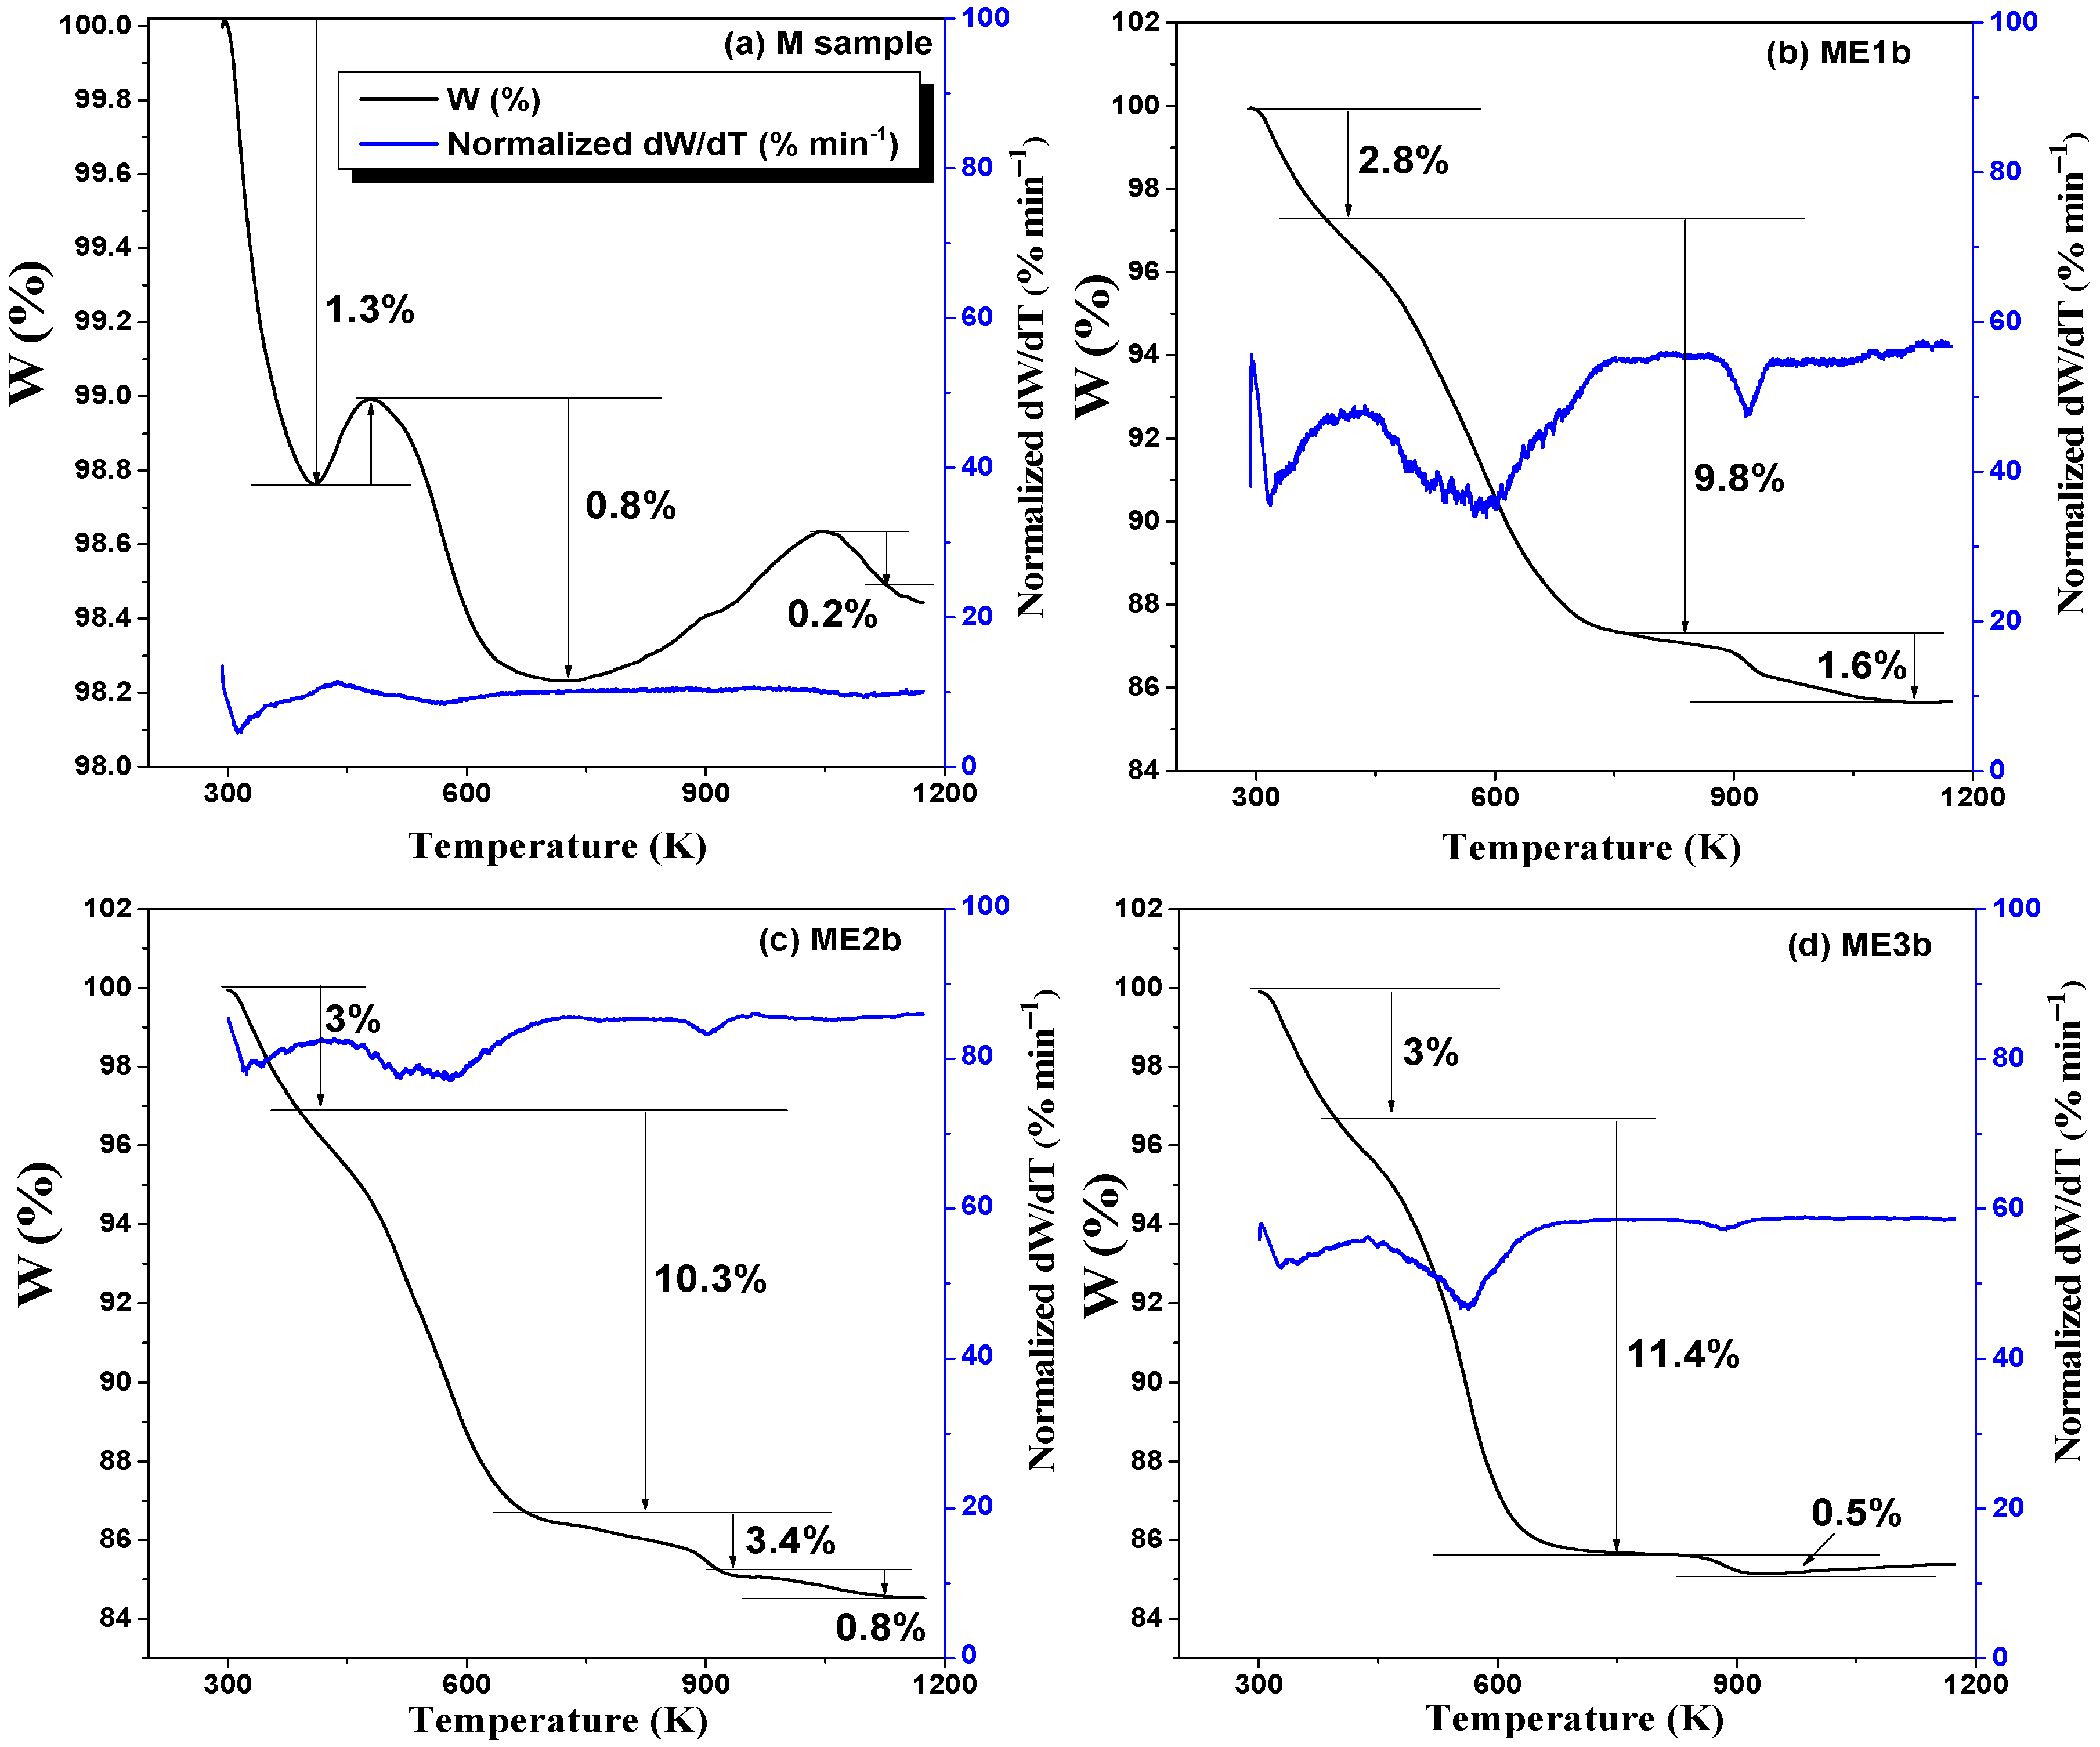
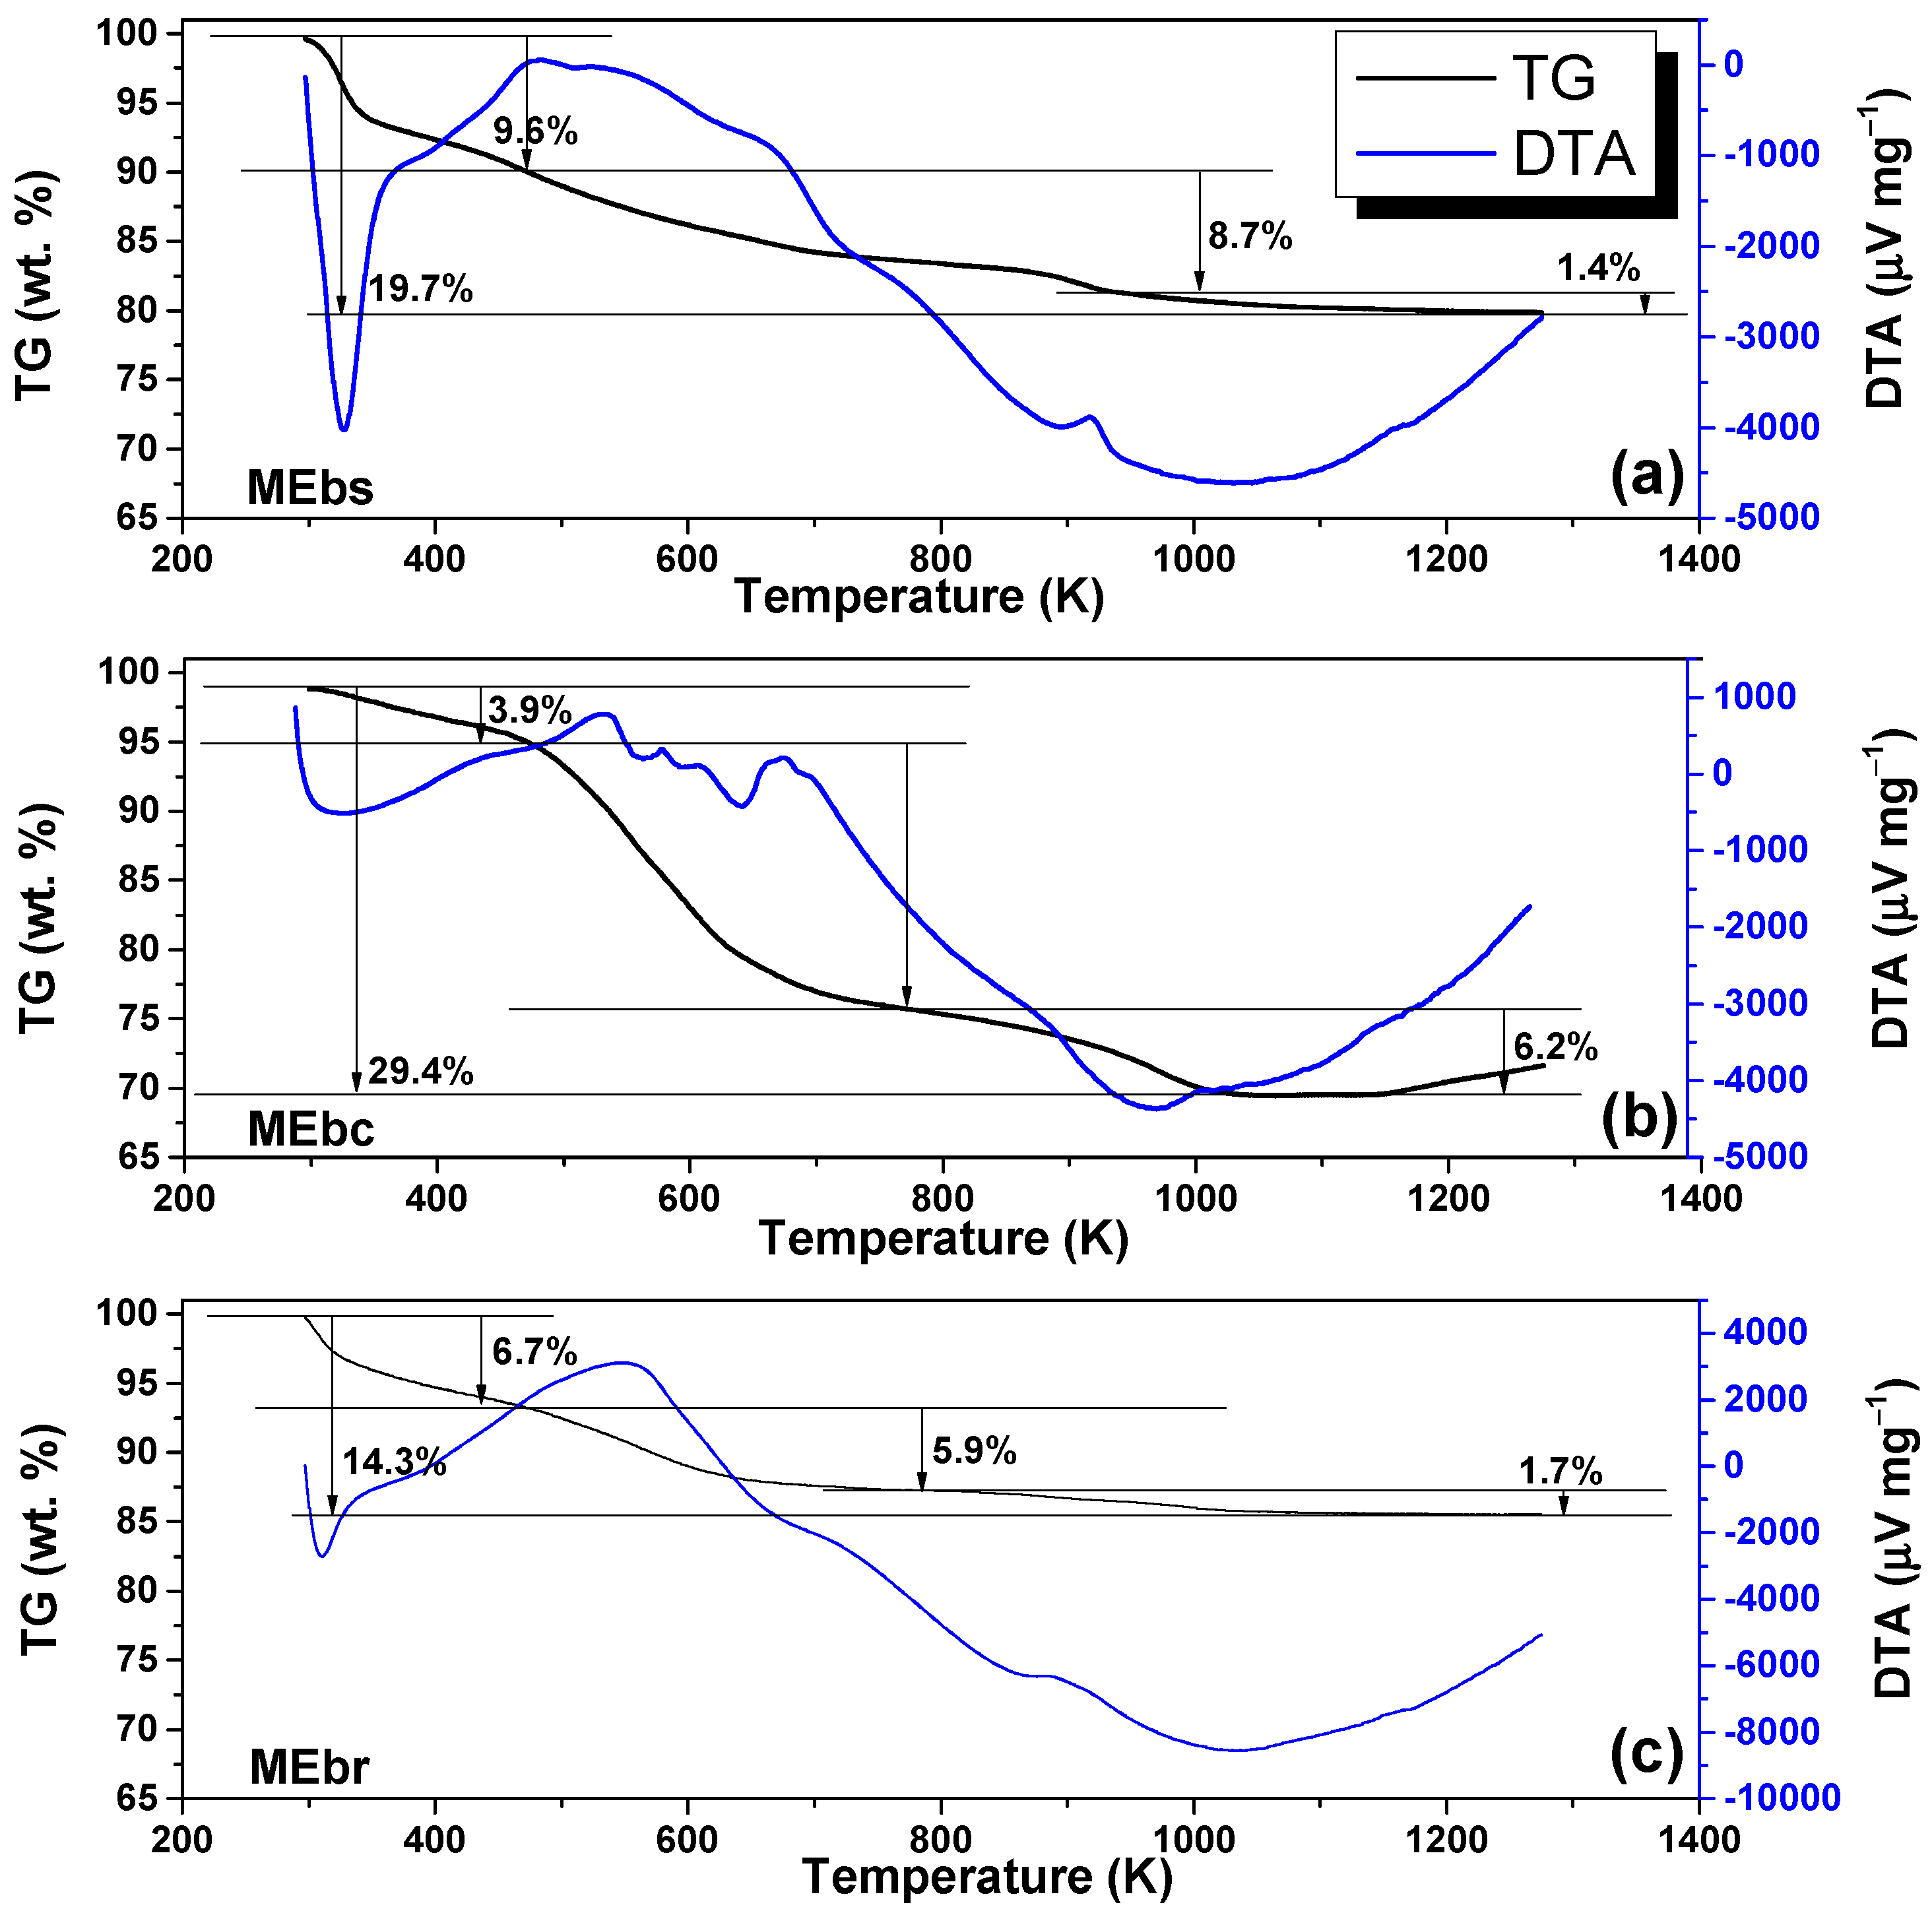
3.3. TGA Analysis
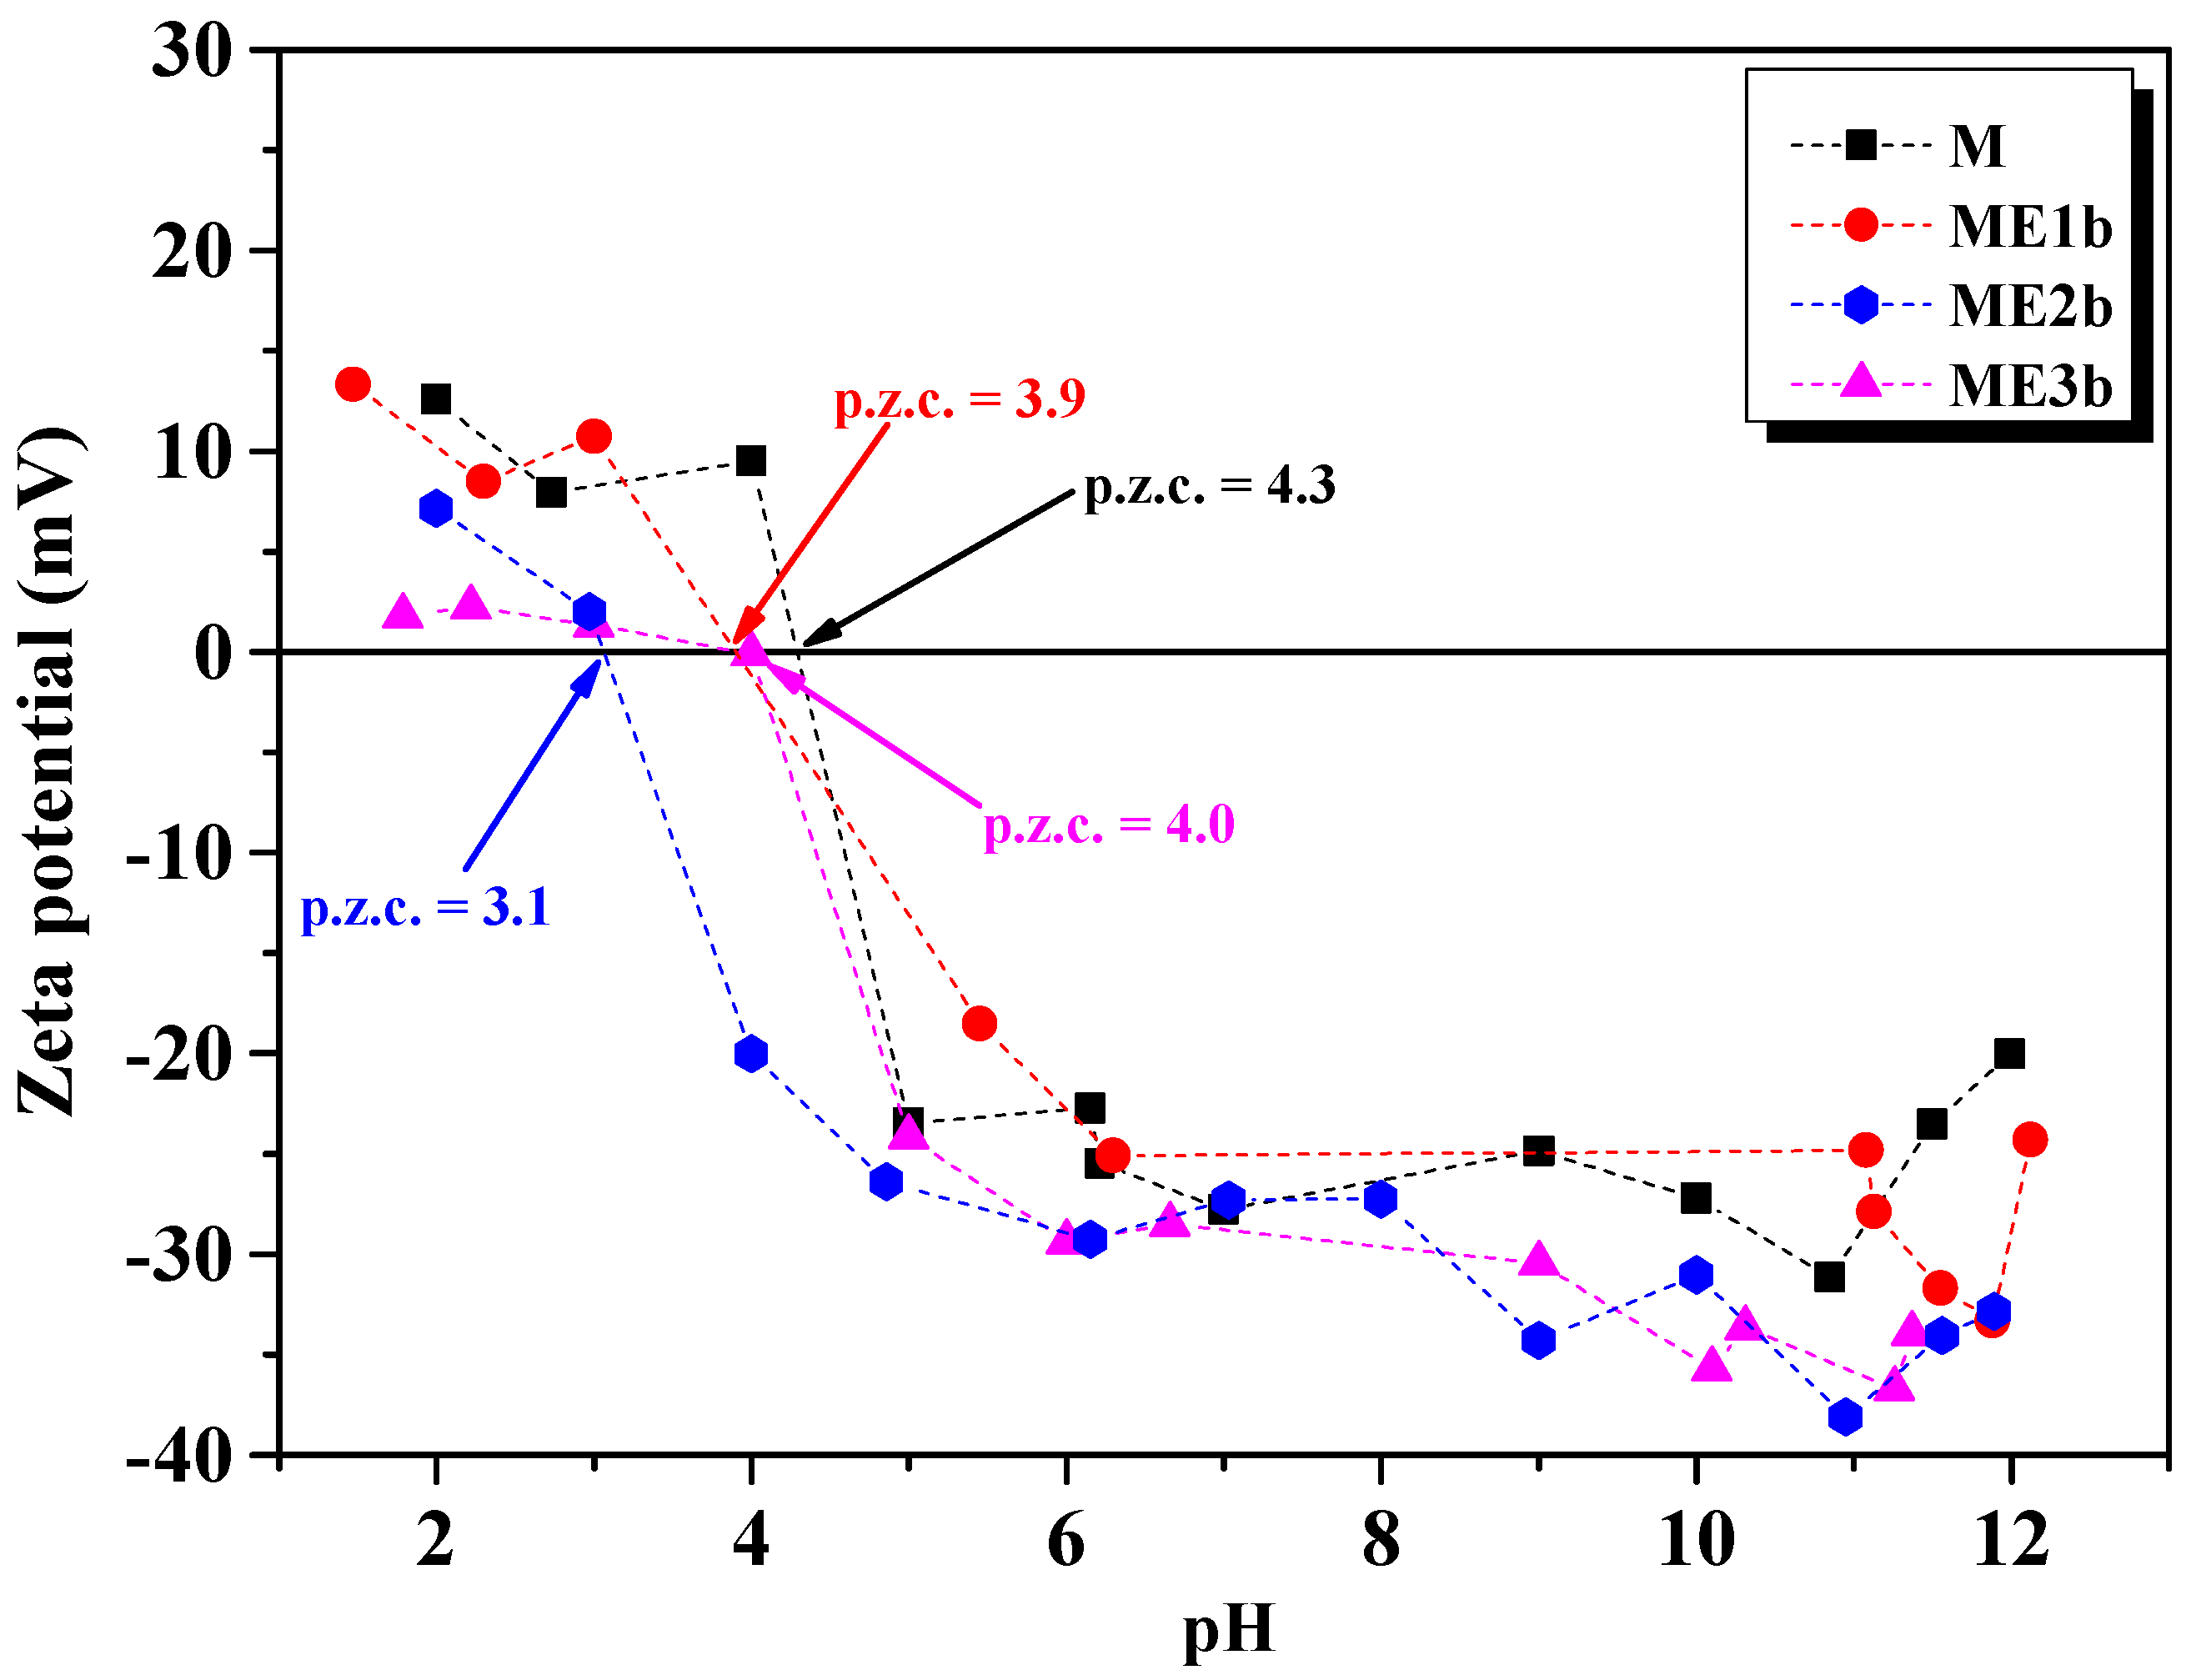
3.4. DLS and Zeta Potential Analysis
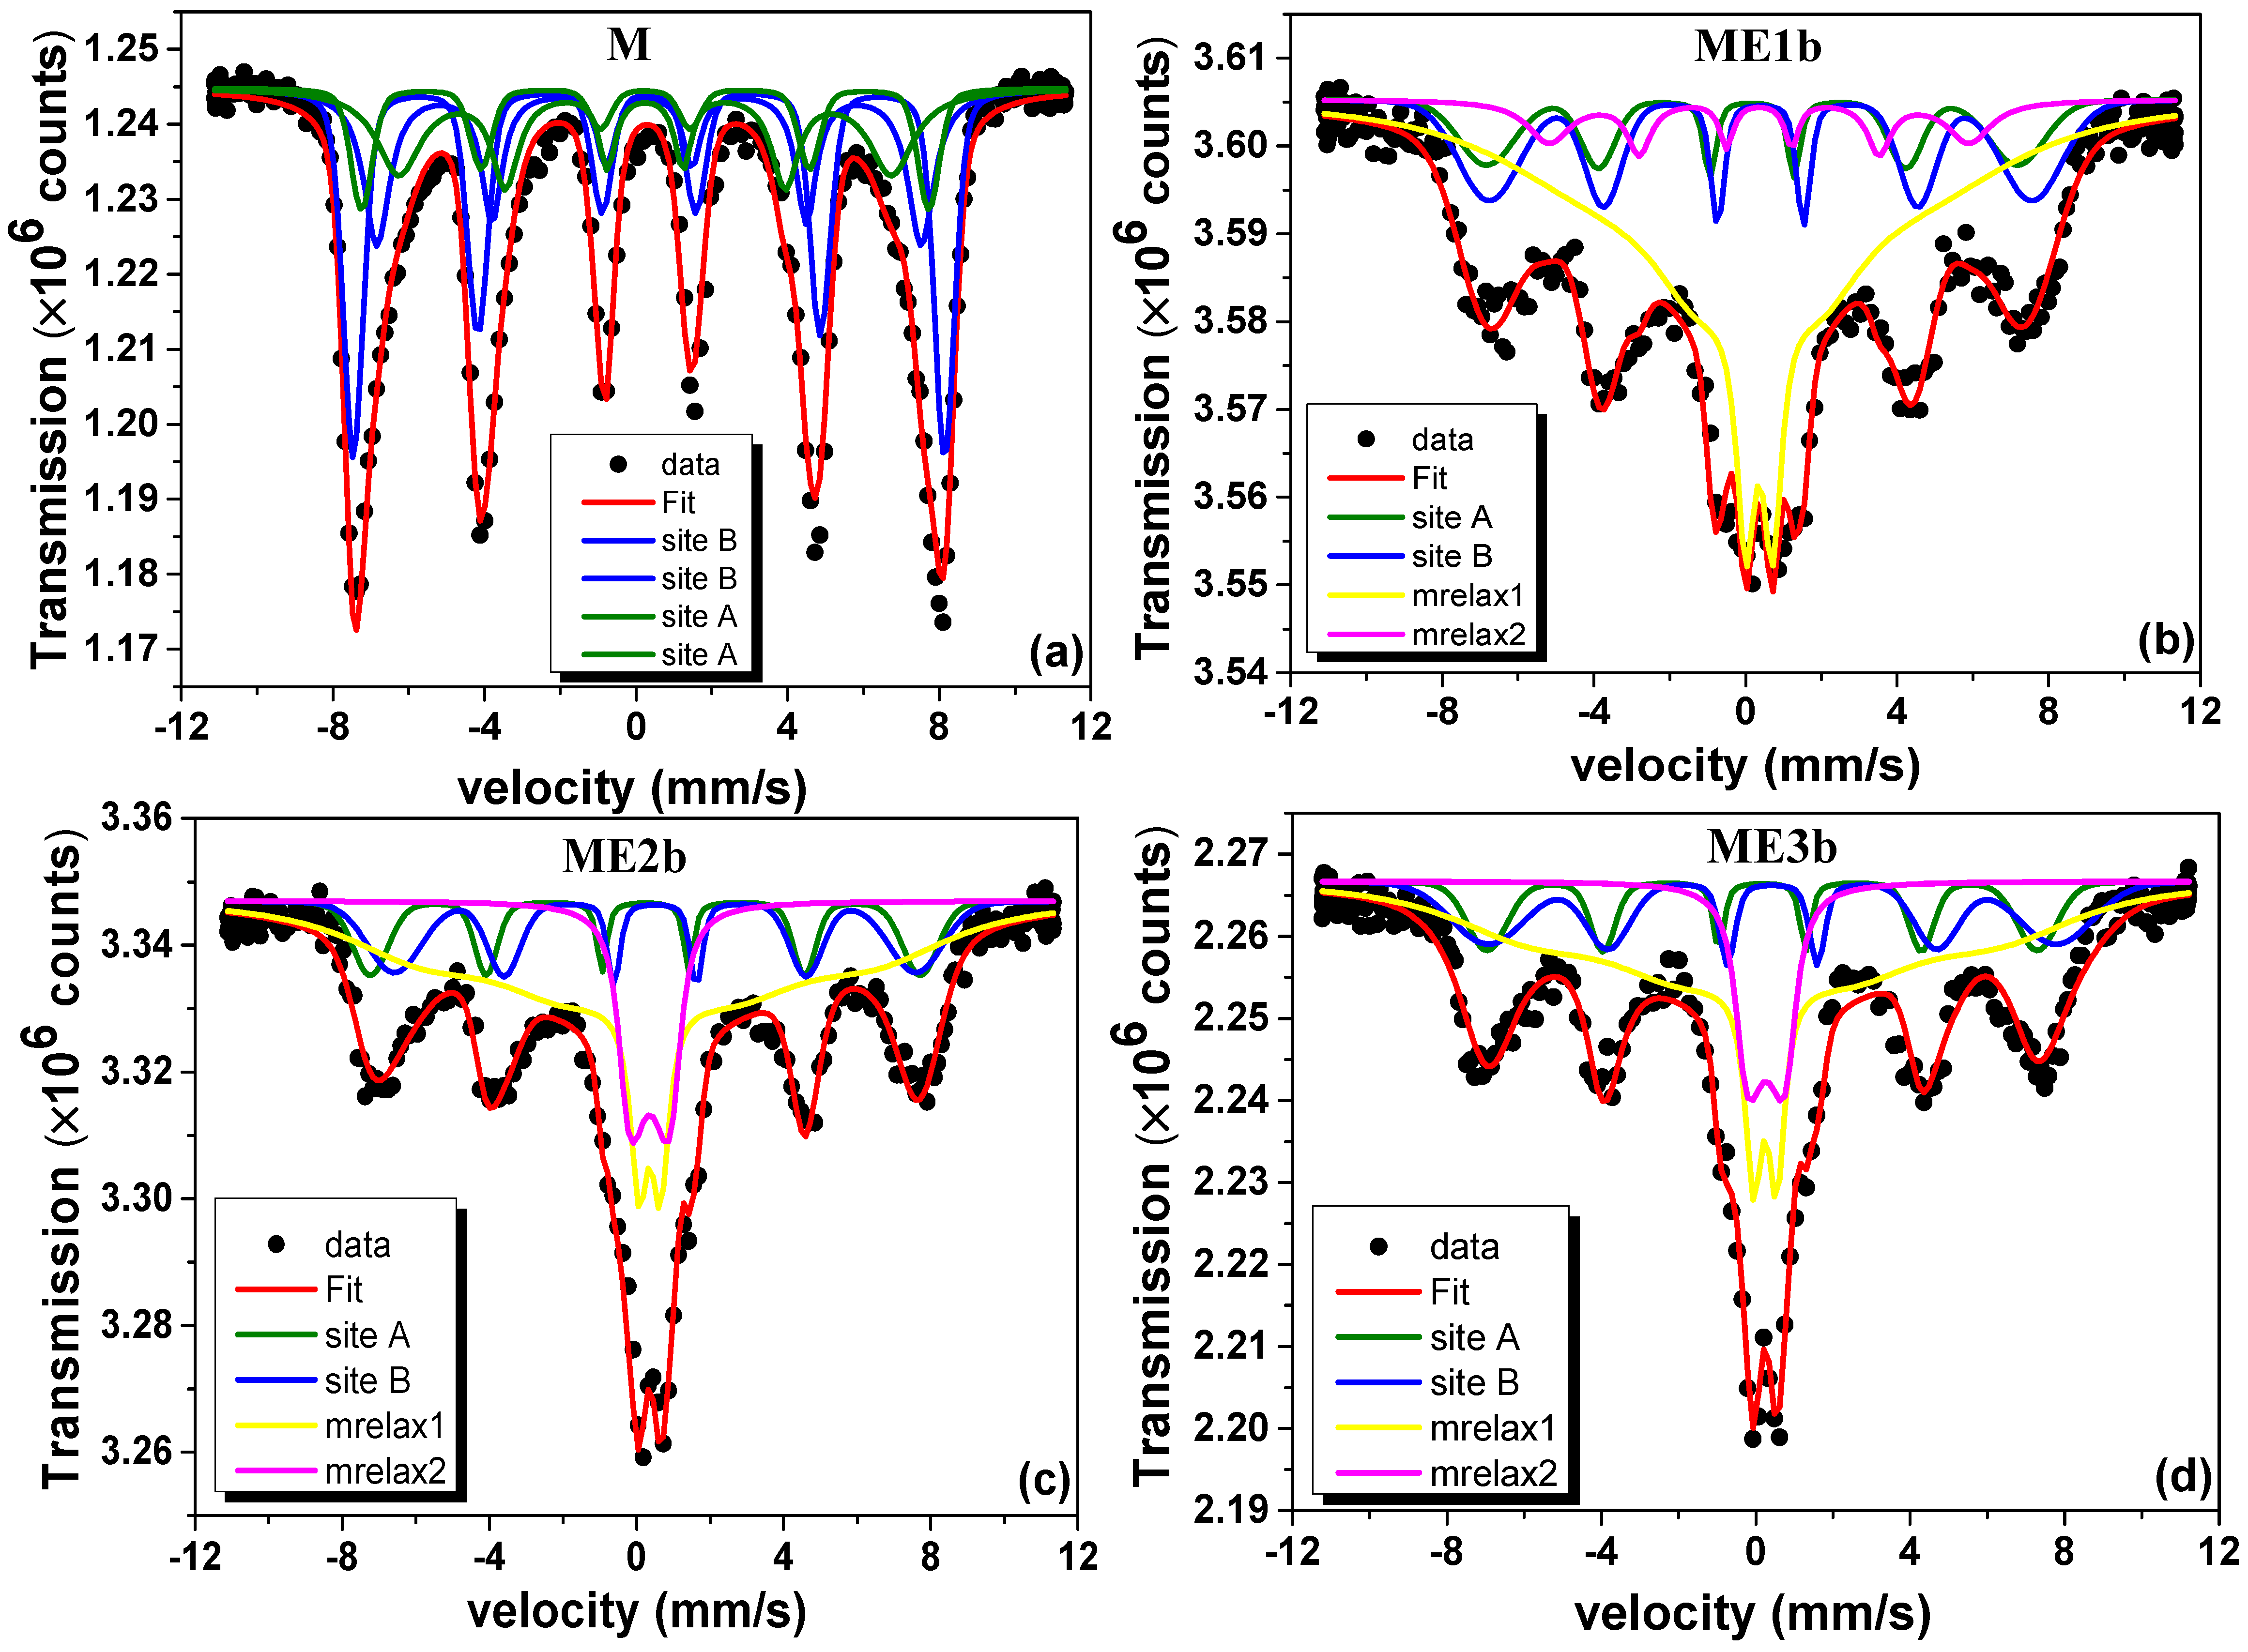
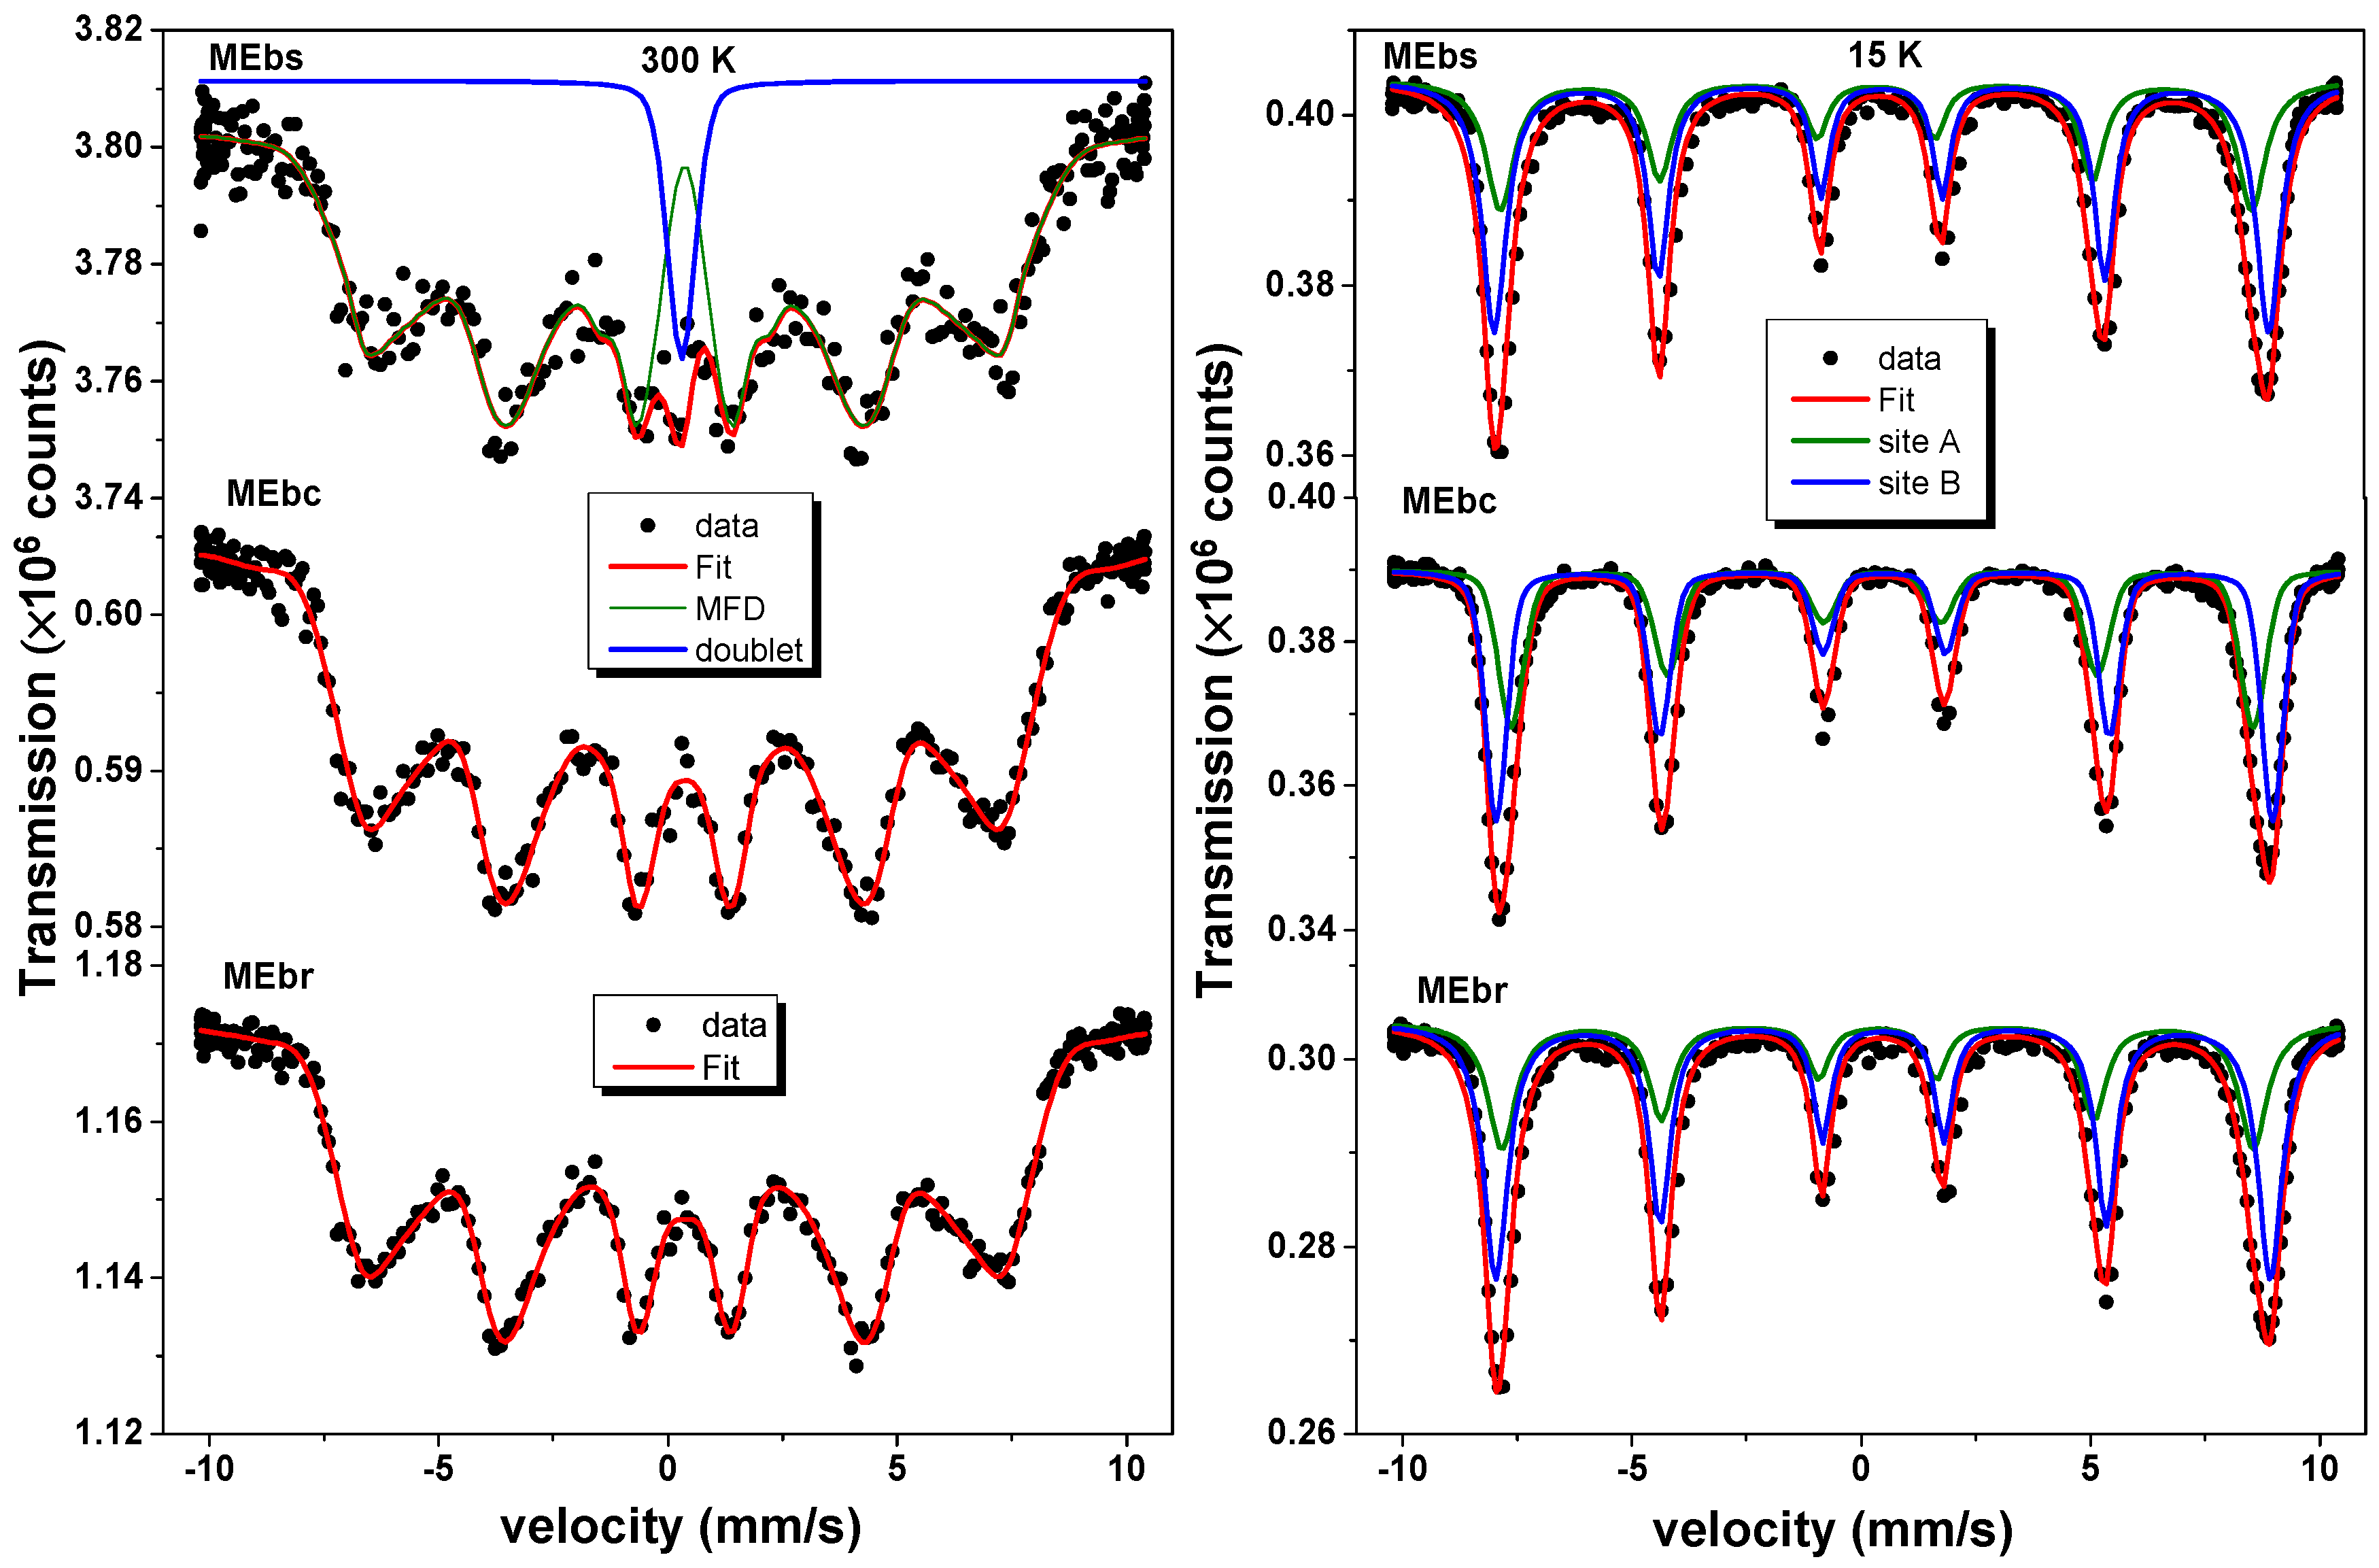
3.5. 57Fe Mössbauer Spectrometry Analysis
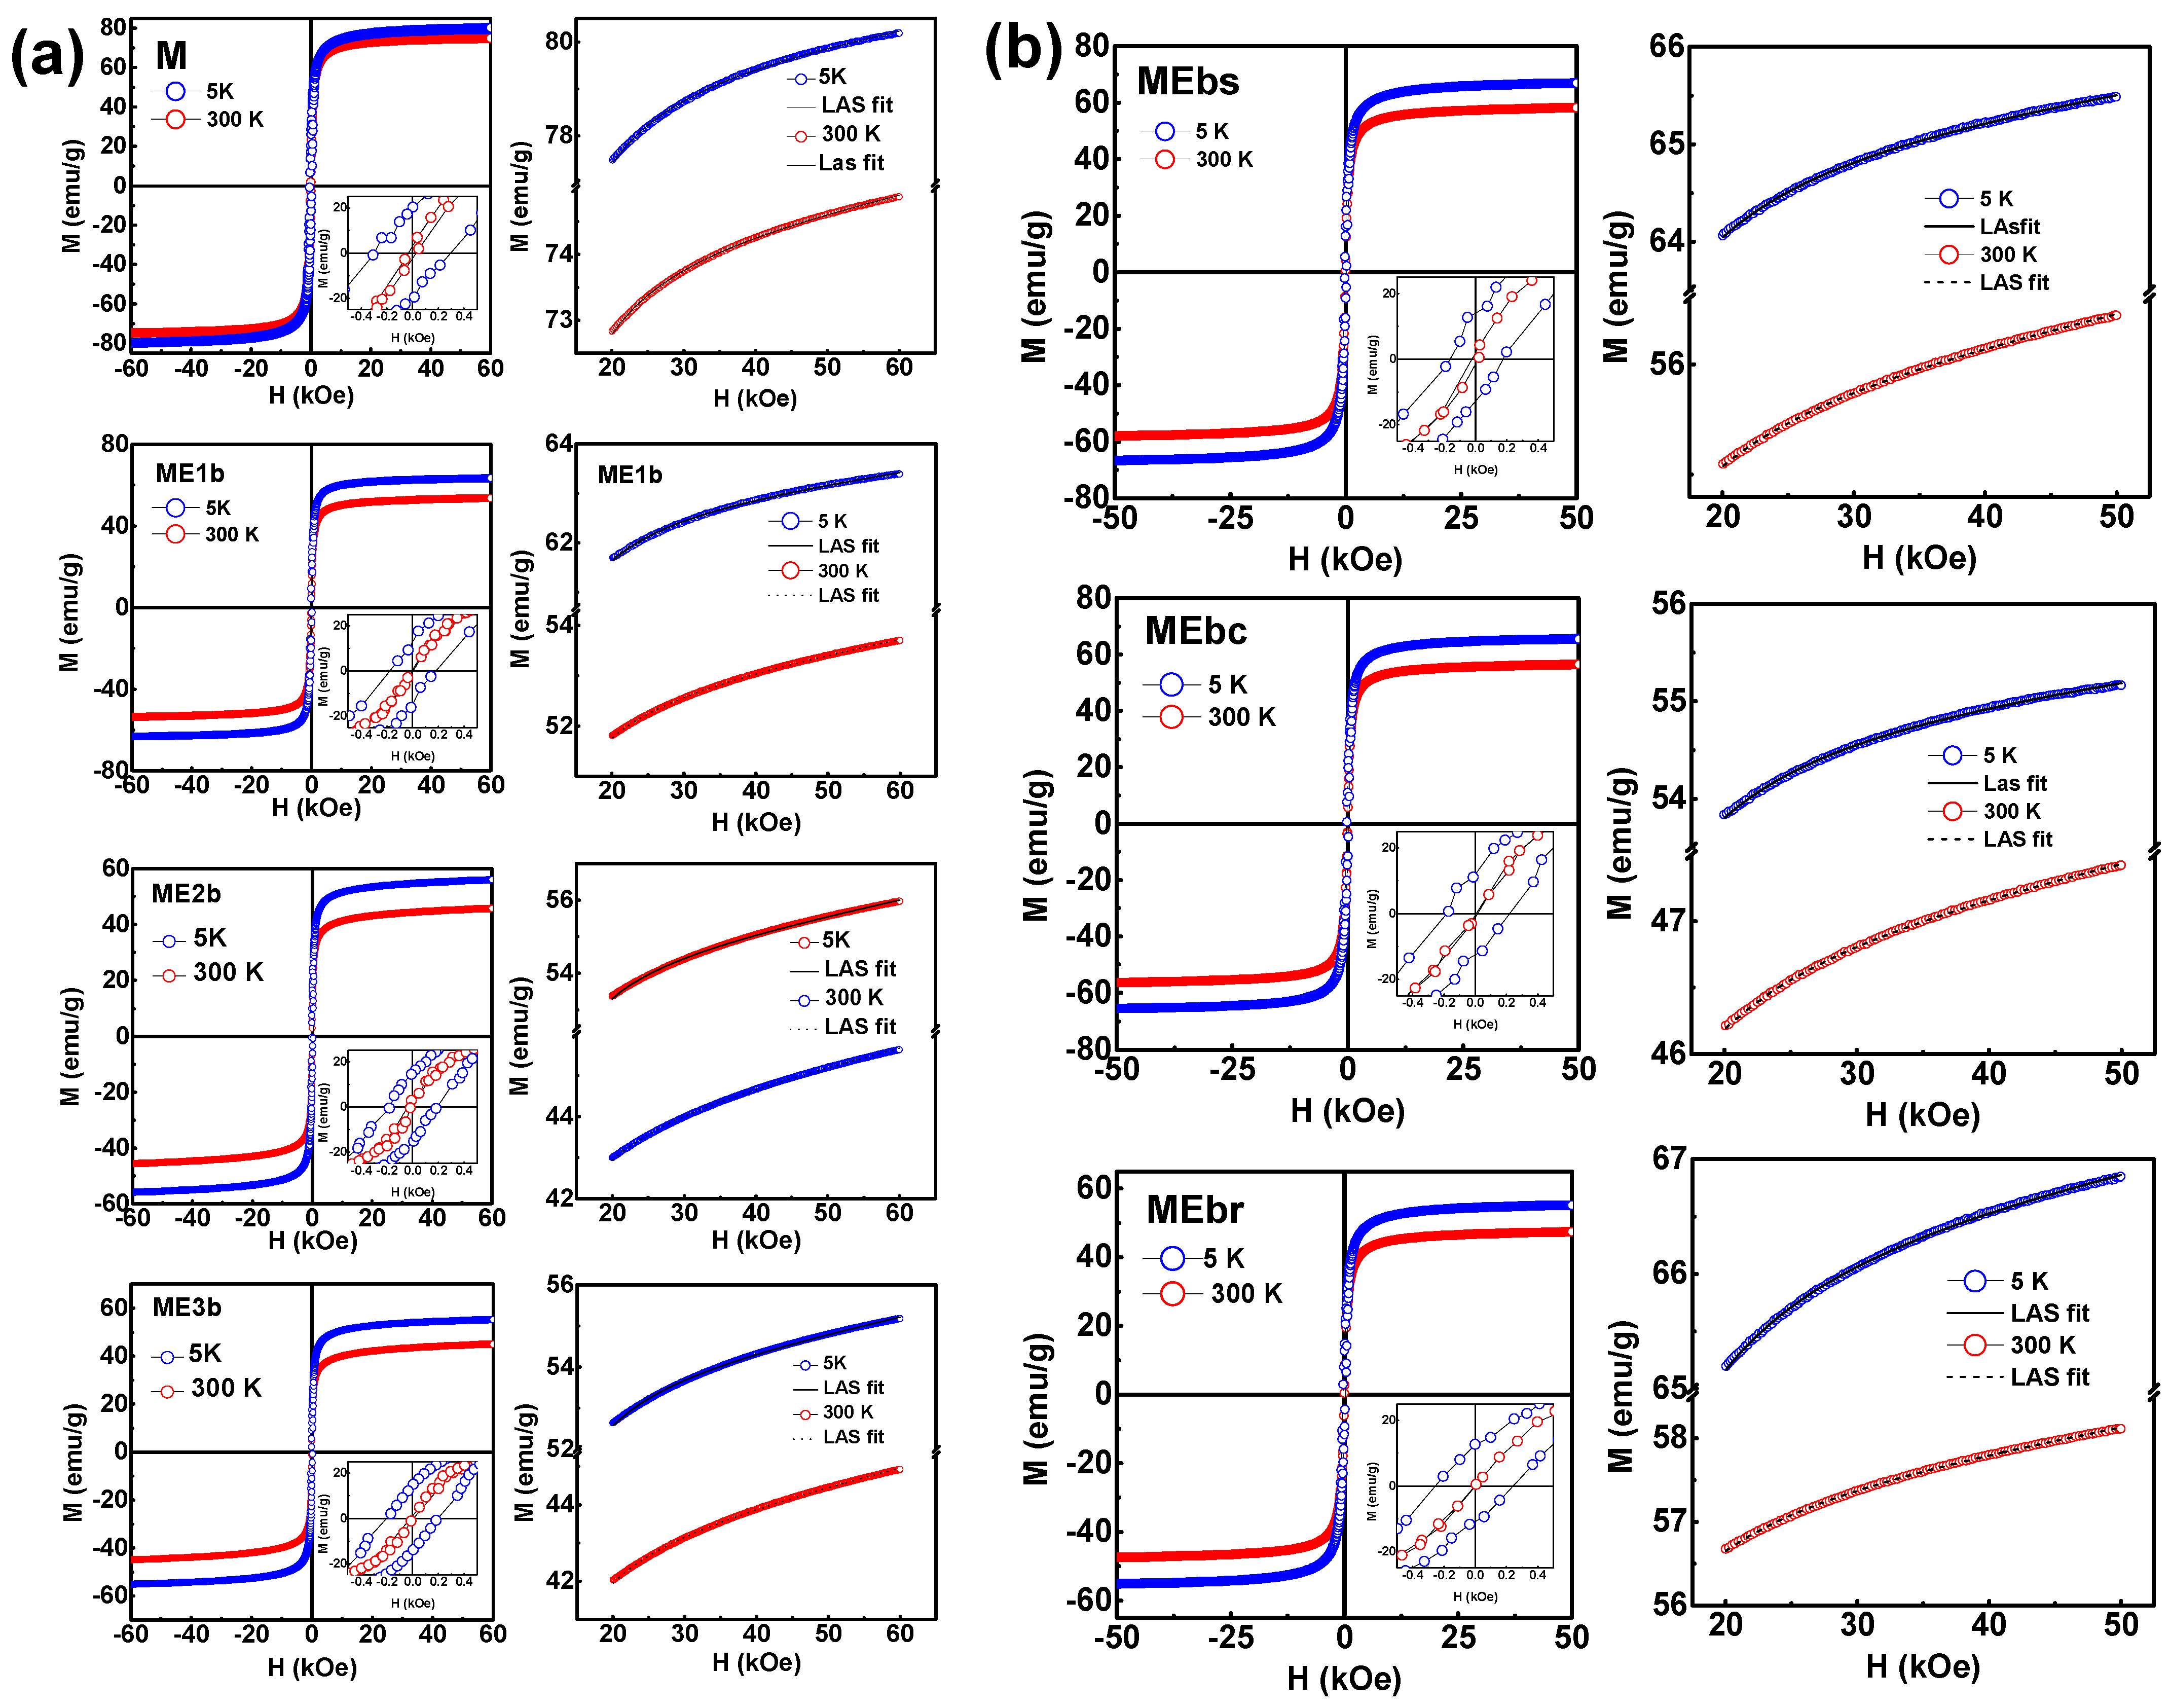
3.6. VSM Analysis
3.7. Adsorption Kinetic Analysis
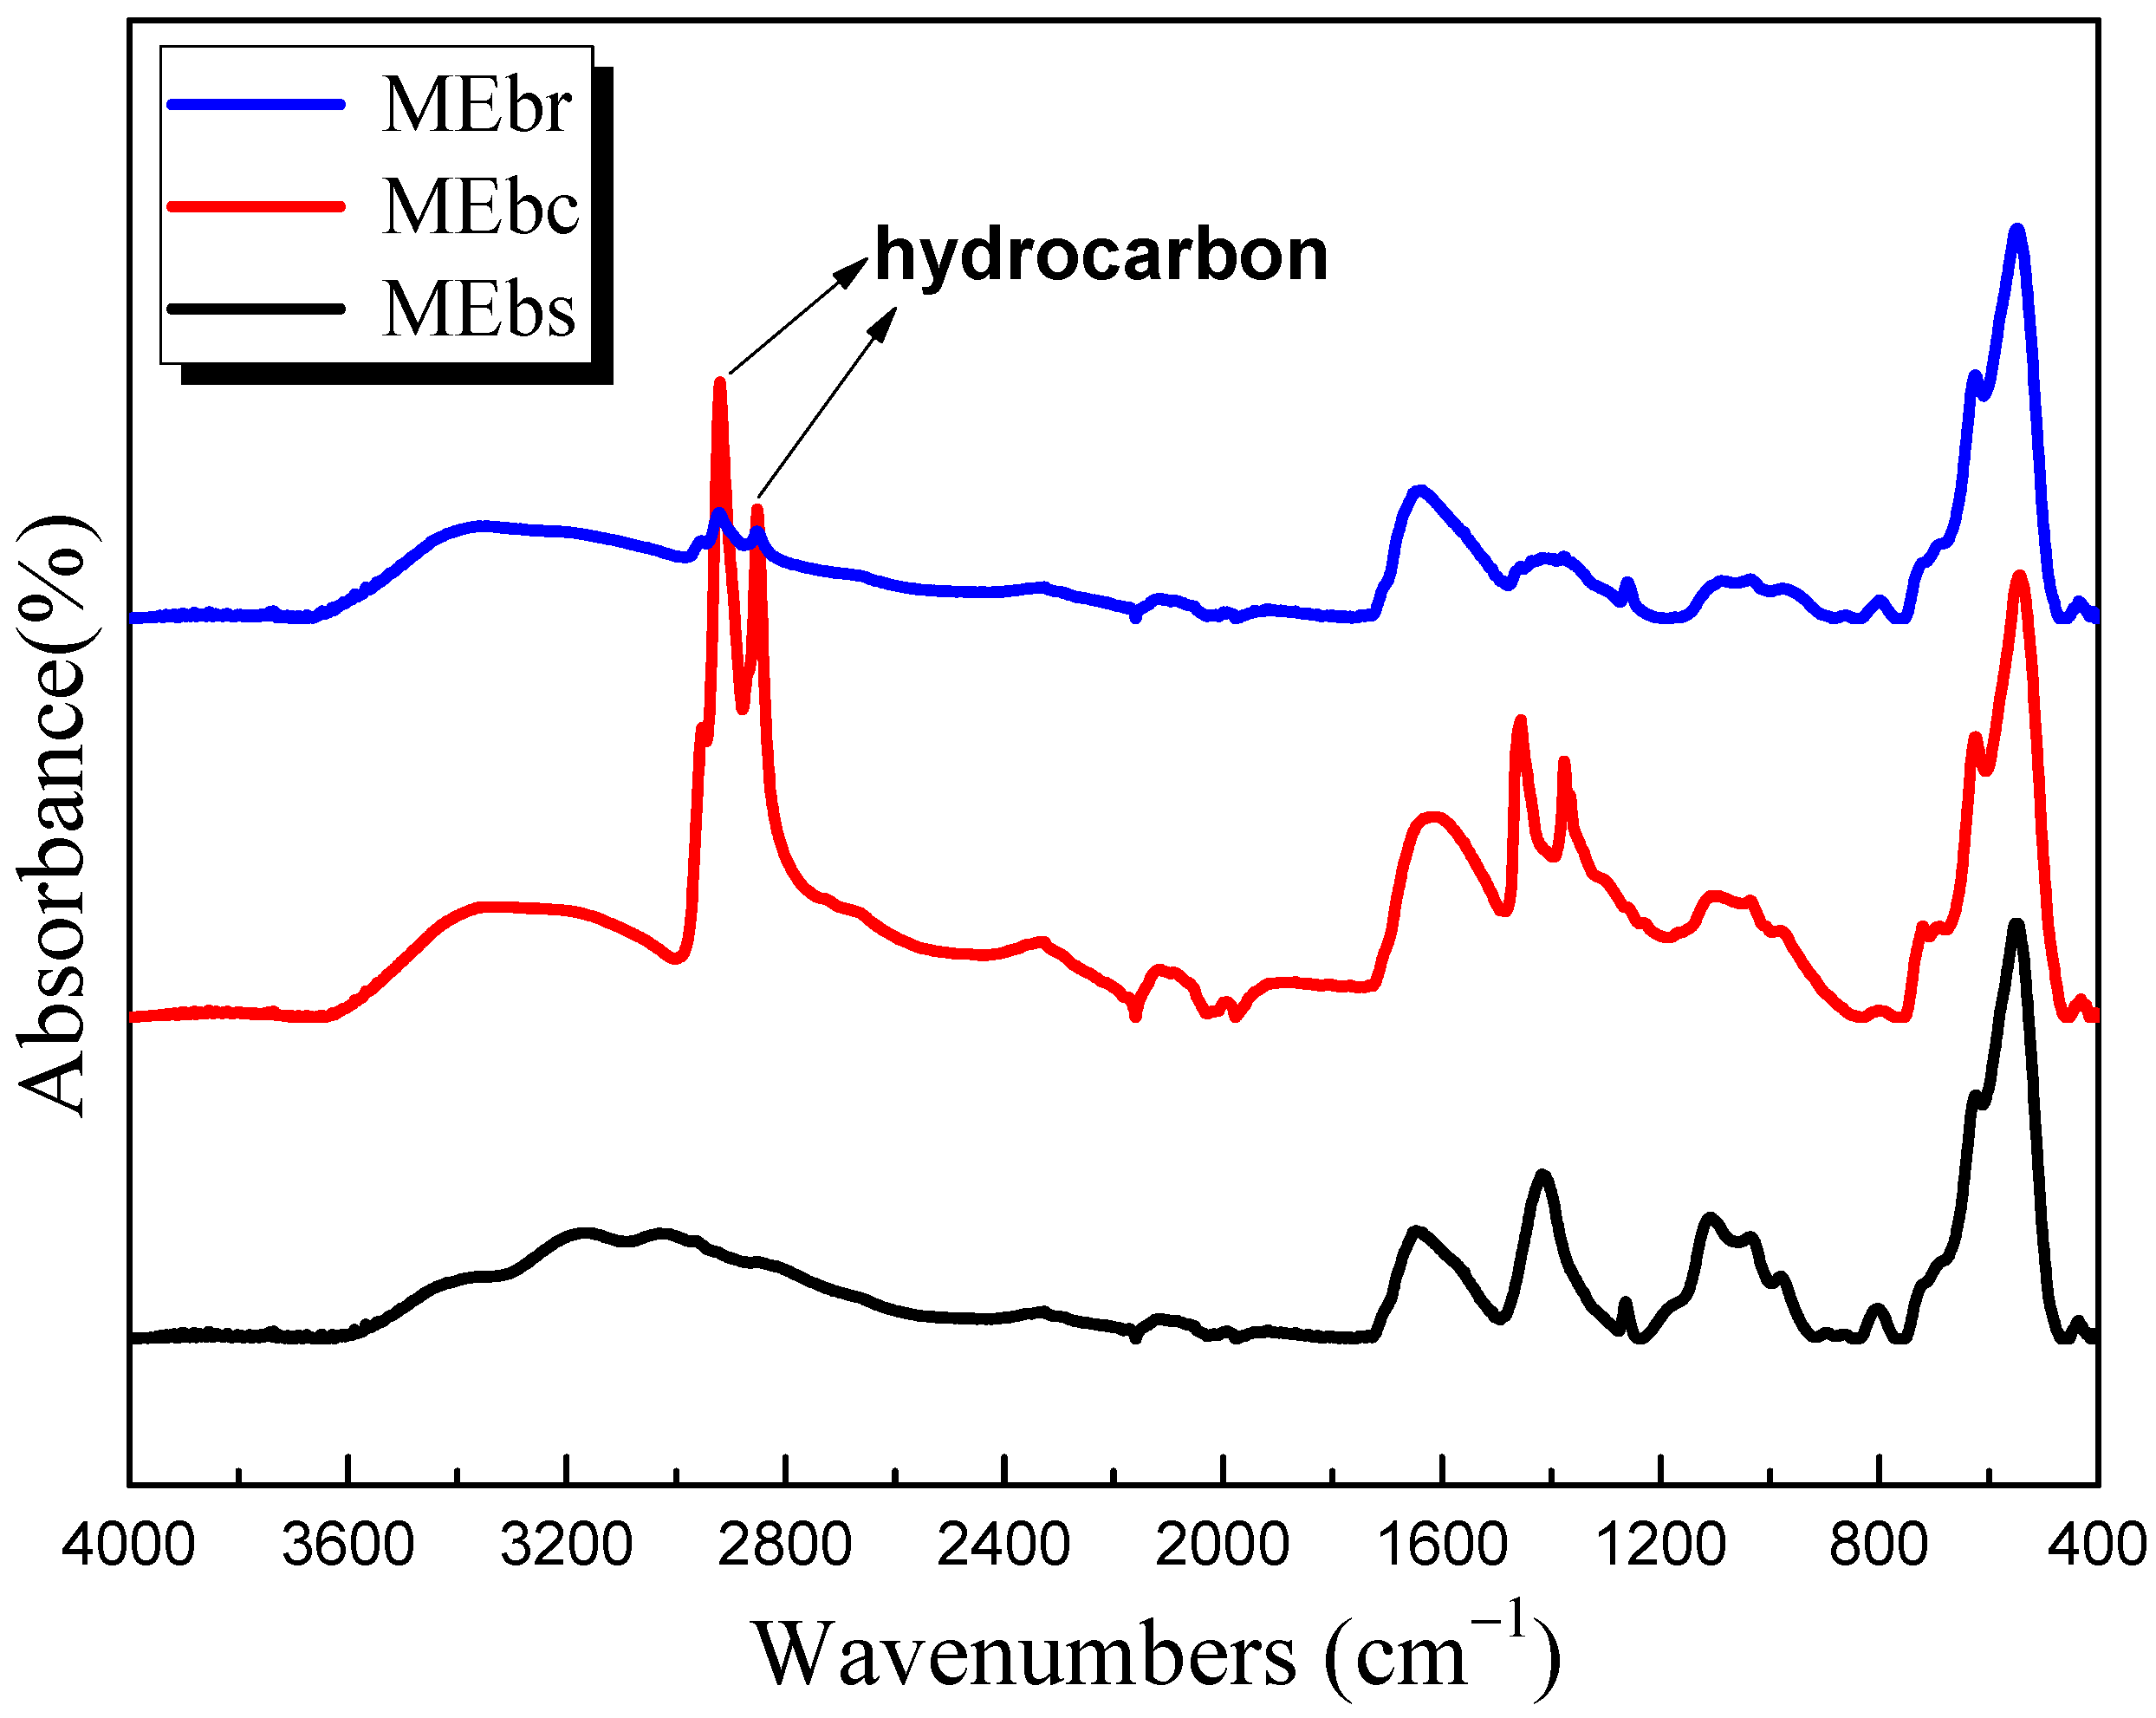
3.8. FTIR Analysis
4. Conclusions
Supplementary Materials
Author Contributions
Funding
Data Availability Statement
Acknowledgments
Conflicts of Interest
References
- Mehmood, A.; Khan, F.S.A.; Mubarak, N.M.; Mazari, S.A.; Jatoi, A.S.; Khalid, M.; Tan, Y.H.; Karri, R.R.; Walvekar, R.; Abdullah, E.C.; et al. Carbon and polymer-based magnetic nanocomposites for oil-spill remediation—A comprehensive review. Environ. Sci. Pollut. Res. 2021, 28, 54477–54496. [Google Scholar] [CrossRef] [PubMed]
- Cardona, D.; Debs, K.; Lemos, S.; Vitale, G.; Nassar, N.; Carrilho, E.; Semensatto, D.; Labuto, G. A comparison study of cleanup techniques for oil spill treatment using magnetic nanomaterials. J. Environ. Manag. 2019, 242, 362–371. [Google Scholar] [CrossRef] [PubMed]
- Zhu, Q.; Tao, F.; Pan, Q. Fast and selective removal of oils from water surface via highly hydrophobic core−shell Fe2O3@C nanoparticles under magnetic field. ACS Appl. Mater. Interfaces 2010, 2, 3141–3146. [Google Scholar] [CrossRef]
- Zhang, J.; Shao, Y.; Hsieh, C.T.; Chen, Y.F.; Su, T.C.; Hsu, J.P.; Juang, R.S. Synthesis of magnetic iron oxide nanoparticles onto fluorinated carbon fabrics for contaminant removal and oil-water separation. Sep. Purif. Technol. 2017, 174, 312–319. [Google Scholar] [CrossRef]
- Singh, B.; Kumar, S.; Kishore, B.; Narayanan, T.N. Magnetic scaffolds in oil spill applications. Environ. Sci. Water Res. Technol. 2020, 6, 436–463. [Google Scholar] [CrossRef]
- Rezaei, B.; Yari, P.; Sanders, S.M.; Wang, H.; Chugh, V.K.; Liang, S.; Wu, K. Magnetic nanoparticles: A review on synthesis, characterization, functionalization, and biomedical applications. Small 2024, 20, 2304848. [Google Scholar] [CrossRef]
- Marcos-Carrillo, M.D.P.; Checca-Huaman, N.R.; Passamani, E.C.; Ramos-Guivar, J.A. Biosynthesis and Characterization of Iron Oxide Nanoparticles Using Chenopodium quinoa Extract. Nanomaterials 2024, 14, 1607. [Google Scholar] [CrossRef]
- Keshta, B.E.; Gemeay, A.H.; Sinha, D.K.; Elsharkawy, S.; Hassan, F.; Rai, N.; Arora, C. State of the art on the magnetic iron oxide Nanoparticles: Synthesis, Functionalization, and applications in wastewater treatment. Results Chem. 2024, 7, 101388. [Google Scholar] [CrossRef]
- Darmawan, M.Y.; Saputra, M.E.; Rumiyanti, L.; Istiqomah, N.I.; Adrianto, N.; Tumbelaka, R.M.; Ardiyanti, H.; Wibowo, N.A.; Asri, N.S.; Angel, J.; et al. Novel green synthesis approach of Fe3O4-MSN/Ag nanocomposite using Moringa oleifera extract for magnetic hyperthermia applications. Curr. Appl. Phys. 2024, 68, 242–256. [Google Scholar] [CrossRef]
- Jacinto, M.J.; Silva, V.C.; Valladão, D.M.S.; Souto, R.S. Biosynthesis of magnetic iron oxide nanoparticles: A review. Biotechnol. Lett. 2021, 43, 1–12. [Google Scholar] [CrossRef]
- Patiño-Ruiz, D.; Sánchez-Botero, L.; Tejeda-Benitez, L.; Hinestroza, J.; Herrera, A. Green synthesis of iron oxide nanoparticles using Cymbopogon citratus extract and sodium carbonate salt: Nanotoxicological considerations for potential environmental applications. Environ. Nanotechnol. Monit. Manag. 2020, 14, 100377. [Google Scholar] [CrossRef]
- Tian, Y.; Zhou, J.; He, C.; He, L.; Li, X.; Sui, H. The formation, stabilization and separation of oil–water emulsions: A review. Processes 2022, 10, 738. [Google Scholar] [CrossRef]
- Zhang, N.; Yang, X.; Wang, Y.; Qi, Y.; Zhang, Y.; Luo, J.; Cui, P.; Jiang, W. A review on oil/water emulsion separation membrane material. J. Environ. Chem. Eng. 2022, 10, 107257. [Google Scholar] [CrossRef]
- Cai, Y.; Shi, S.Q.; Fang, Z.; Li, J. Design, development, and outlook of superwettability membranes in oil/water emulsions separation. Adv. Mater. Interfaces 2021, 8, 2100799. [Google Scholar] [CrossRef]
- Putz, H.; Brandenburg, K. Match!—Phase Identification from Powder Diffraction; Crystal Impact: Bonn, Germany, 2024; Available online: https://www.crystalimpact.de/match (accessed on 10 November 2024).
- Klencsár, Z. MössWinn 4.0i. Revision. 2024. Available online: http://www.mosswinn.hu/ (accessed on 11 November 2024).
- Hu, Q.; Pang, S.; Wang, D. In-depth insights into mathematical characteristics, selection criteria and common mistakes of adsorption kinetic models: A critical review. Sep. Purif. Rev. 2022, 51, 281–299. [Google Scholar] [CrossRef]
- Balamurugan, M.; Saravanan, S.; Soga, T. Synthesis of Iron Oxide Nanoparticles by Using Eucalyptus Globulus Plant Extract. E-J. Surf. Sci. Nanotechnol. 2014, 12, 363–367. [Google Scholar] [CrossRef]
- Herrera-Becerra, R.; Zorrilla, C.; Rius, J.; Ascencio, J. Electron microscopy characterization of biosynthesized iron oxide nanoparticles. Appl. Phys. A 2008, 91, 241–246. [Google Scholar] [CrossRef]
- Kumar, B.; Smita, K.; Galeas, S.; Guerrero, V.H.; Debut, A.; Cumbal, L. One-Pot Biosynthesis of Maghemite (γ-Fe2O3) Nanoparticles in Aqueous Extract of Ficus carica Fruit and Their Application for Antioxidant and 4-Nitrophenol Reduction. Waste Biomass Valorization 2020, 12, 3575–3587. [Google Scholar] [CrossRef]
- Ichiyanagi, Y.; Kimishima, Y. Structural, magnetic and thermal characterizations of Fe2O3 nanoparticle systems. J. Therm. Anal. Calorim. 2002, 69, 919–923. [Google Scholar] [CrossRef]
- Kök, M.V.; Varfolomeev, M.A.; Nurgaliev, D.K. Crude oil characterization using TGA-DTA, TGA-FTIR and TGA-MS techniques. J. Pet. Sci. Eng. 2017, 154, 537–542. [Google Scholar] [CrossRef]
- Veloso, C.; Filippov, L.; Filippova, I.; Ouvrard, S.; Araujo, A. Adsorption of polymers onto iron oxides: Equilibrium isotherms. J. Mater. Res. Technol. 2020, 9, 779–788. [Google Scholar] [CrossRef]
- Yu, S.; Chow, G.M. Carboxyl group (–CO2H) functionalized ferrimagnetic iron oxide nanoparticles for potential bio-applications. J. Mater. Chem. 2004, 14, 2781–2786. [Google Scholar] [CrossRef]
- Silva, M.F.; Hechenleitner, A.A.W.; De Oliveira, D.M.F.; Agüeros, M.; Peñalva, R.; Irache, J.M.; Pineda, E.A.G. Optimization of maghemite-loaded PLGA nanospheres for biomedical applications. Eur. J. Pharm. Sci. 2013, 49, 343–351. [Google Scholar] [CrossRef]
- Blume, M.; Tjon, J. Mössbauer Spectra in a fluctuating environment. Phys. Rev. 1968, 165, 446–456. [Google Scholar] [CrossRef]
- Flores-Cano, D.A.; Checca-Huaman, N.R.; Castro-Merino, I.L.; Pinotti, C.N.; Passamani, E.C.; Litterst, F.J.; Ramos-Guivar, J.A. Progress toward Room-Temperature Synthesis and Functionalization of Iron-Oxide Nanoparticles. Int. J. Mol. Sci. 2022, 23, 8279. [Google Scholar] [CrossRef]
- Kuncser, A.C.; Vlaicu, I.D.; Pavel, O.D.; Zavoianu, R.; Badea, M.; Radu, D.; Culita, D.C.; Rostas, A.M.; Olar, R. Soft synthesis and characterization of goethite-based nanocomposites as promising cyclooctene oxidation catalysts. RSC Adv. 2021, 11, 27589–275602. [Google Scholar] [CrossRef] [PubMed]
- Ramos-Guivar, J.A.; López, E.O.; Greneche, J.M.; Litterst, F.J.; Passamani, E.C. Effect of EDTA organic coating on the spin canting behavior of maghemite nanoparticles for lead (II) adsorption. Appl. Surf. Sci. 2021, 538, 148021. [Google Scholar] [CrossRef]
- Ramos-Guivar, J.A.; Passamani, E.C.; Litterst, F.J. Superspinglass state in functionalized zeolite 5A-maghemite nanoparticles. AIP Adv. 2021, 11, 035223. [Google Scholar] [CrossRef]
- Ramos-Guivar, J.A.; Checca-Huaman, N.; Litterst, F.J.; Passamani, E.C. Surface Adsorption Mechanism between Lead (II,IV) and Nanomaghemite Studied on Polluted Water Samples Collected from the Peruvian Rivers Mantaro and Cumbaza. Nanomaterials 2023, 13, 1684. [Google Scholar] [CrossRef]
- Cornell, R.M.; Schwertmann, U. The Iron Oxides: Structure, Properties, Reactions, Occurrences and Uses; Wiley-VCH: Weinheim, Germany, 2003; pp. 141–158. [Google Scholar]
- Khurshid, H.; Lampen-Kelley, P.; Iglesias, Ò.; Alonso, J.; Phan, M.; Sun, C.; Saboungi, M.; Srikanth, H. Spin-glass-like freezing of inner and outer surface layers in hollow γ-Fe2O3 nanoparticles. Sci. Rep. 2015, 5, 15054. [Google Scholar] [CrossRef]
- Guivar, J.A.; Morales, M.; Litterst, F.J. Suppression of exchange bias effect in maghemite nanoparticles functionalized with H2Y. J. Magn. Magn. Mater. 2016, 420, 324–335. [Google Scholar] [CrossRef]
- Kolhatkar, A.G.; Jamison, A.C.; Litvinov, D.; Willson, R.C.; Lee, T.R. Tuning the magnetic properties of nanoparticles. Int. J. Mol. Sci. 2013, 14, 15977–16009. [Google Scholar] [CrossRef] [PubMed]
- Guivar, J.A.R.; Sadrollahi, E.; Menzel, D.; Fernandes, E.G.R.; López, E.O.; Torres, M.M.; Arsuaga, J.M.; Arencibia, A.; Litterst, F.J. Magnetic, structural and surface properties of functionalized maghemite nanoparticles for copper and lead adsorption. RSC Adv. 2017, 7, 28763–28779. [Google Scholar] [CrossRef]
- Guivar, J.A.R.; Sanches, E.A.; Bruns, F.; Sadrollahi, E.; Morales, M.; López, E.O.; Litterst, F.J. Vacancy ordered γ-Fe2O3 nanoparticles functionalized with nanohydroxyapatite: XRD, FTIR, TEM, XPS and Mössbauer studies. Appl. Surf. Sci. 2016, 389, 721–734. [Google Scholar] [CrossRef]
- Müller, R.; Dutz, S.; Neeb, A.; Cato, A.C.B.; Zeisberger, M. Magnetic heating effect of nanoparticles with different sizes and size distributions. J. Magn. Magn. Mater. 2013, 328, 80–85. [Google Scholar] [CrossRef]
- Chaudhari, H.N.; Dhruv, P.N.; Singh, C.; Meena, S.S.; Kavita, S.; Jotania, R.B. Effect of heating temperature on structural, magnetic, and dielectric properties of magnesium ferrites prepared in the presence of Solanum lycopersicum fruit extract. J. Mater. Sci. Mater. Electron. 2020, 31, 18445–18463. [Google Scholar] [CrossRef]
- Lima, E.C.; Sher, F.; Guleria, A.; Saeb, M.R.; Anastopoulos, I.; Tran, H.N.; Hosseini-Bandegharaei, A. Is one performing the treatment data of adsorption kinetics correctly? J. Environ. Chem. Eng. 2021, 9, 104813. [Google Scholar] [CrossRef]
- Patekari, M.D.; Pawar, K.K.; Salunkhe, G.B.; Kodam, P.M.; Padvi, M.N.; Waifalkar, P.; Sharma, K.K.; Patil, P.S. Synthesis of maghemite nanoparticles for highly sensitive and selective NO2 sensing. Mater. Sci. Eng. B 2021, 272, 115339. [Google Scholar] [CrossRef]
- Balaji, S.; Guda, R.; Mandal, B.K.; Kasula, M.; Ubba, E.; Khan, F.R.N. Green synthesis of nano-titania (TiO2 NPs) utilizing aqueous Eucalyptus globulus leaf extract: Applications in the synthesis of 4H-pyran derivatives. Res. Chem. Intermed. 2021, 47, 3919–3931. [Google Scholar] [CrossRef]
- Cann, P.M.; Spikes, H.A. In-contact IR spectroscopy of hydrocarbon lubricants. Tribol. Lett. 2005, 19, 289–297. [Google Scholar] [CrossRef]
- Luu, X.C.; Yu, J.; Striolo, A. Nanoparticles adsorbed at the water/oil interface: Coverage and composition effects on structure and diffusion. Langmuir 2013, 29, 7221–7228. [Google Scholar] [CrossRef] [PubMed]


| % w/v | Type of Extract | Sample | Eucalyptus Extract Volume (mL) | H2O | NH4OH (mL) | Reaction Time (min) |
|---|---|---|---|---|---|---|
| 0% | M1 | 0 | 100 mL | 20 | 30 min | |
| 2.5% | Decoction | ME1a | 100 | 0 | 15 | 30 |
| 5% | ME1b | 100 | 0 | 15 | 30 | |
| 7.5% | ME1c | 100 | 0 | 20 | 50–60 | |
| 10% | ME1d | 100 | 0 | 20 | <80 | |
| 2.5% | Infusion (Laboratory powder from natural leaves) | ME2a | 100 | 0 | 15 | 30 |
| 5% | ME2b | 100 | 0 | 15 | 40–60 | |
| 7.5% | ME2c | 100 | 0 | 20 | <60 | |
| 10% | ME2d | 100 | 0 | 20 | <80 | |
| 5% | Infusion (Commercial powder) | ME3b | 100 | 0 | 20 | 50–60 |
| 10% | ME3d | 100 | 0 | 20 | 2 * |
| x (Water) mL | Emulsion Concentration (mg L−1) | Total Emulsion Volume (mL) | Transmittance (%) |
|---|---|---|---|
| 0.0 | 42,000 | 50.0 | 0.6 |
| 5.6 | 37,800 | 55.6 | 25.4 |
| 12.5 | 30,857 | 68.1 | 35.7 |
| 21.4 | 23,468 | 89.5 | 26.6 |
| 33.3 | 17,099 | 122.8 | 36.8 |
| 50.0 | 12,152 | 172.8 | 52.3 |
| 75.0 | 8474 | 247.8 | 65.7 |
| 116.7 | 5762 | 364.5 | 77.5 |
| 200.0 | 3720 | 564.5 | 91.6 |
| 450.0 | 2070 | 1014.5 | 91.8 |
| Sample | Phase | Cagliotti Parameters | Lattice Parameters (Å) | Statistical Parameters (%) | Crystallite Size (nm) | ||
|---|---|---|---|---|---|---|---|
| U | V | W | |||||
| M | γ-Fe2O3 | 0.944 | −0.781 | 0.419 | a = 8.37 (1) b = 8.37 (1) c = 8.37 (1) α = β = γ = 90° | Rp = 32.5 Rwp = 16.2 Rexp = 12.7 χ2 = 1.63 | 22 |
| ME1a | γ-Fe2O3 | 1.043 | −0.763 | 0.620 | a = 8.37 (1) b = 8.37 (1) c = 8.37 (1) α = β = γ = 90° | Rp = 36.7 Rwp = 20.5 Rexp = 18.3 χ2 = 1.25 | 8 |
| ME1b | γ-Fe2O3 | 0.611 | −0.109 | 0.013 | a = 8.36 (1) b = 8.36 (1) c = 8.36 (1) α = β = γ = 90° | Rp = 33.3 Rwp = 18.4 Rexp = 16.4 χ2 = 1.26 | 9 |
| ME1c | γ-Fe2O3 | 0.952 | −0.788 | 0.238 | a = 8.36 (1) b = 8.36 (1) c = 8.36 (1) α = β = γ = 90° | Rp = 27.5 Rwp = 17.4 Rexp = 16.0 χ2 = 1.18 | 9 |
| ME1d | γ-Fe2O3 | 0.923 | −0.786 | 0.245 | a = 8.40 (1) b = 8.40 (1) c = 8.40 (1) α = β = γ = 90° | Rp = 36.1 Rwp = 35.1 Rexp = 33.7 χ2 = 1.08 | 9 |
| ME2a | γ-Fe2O3 | 0.990 | −0.625 | 0.131 | a = 8.37 (1) b = 8.37 (1) c = 8.37 (1) α = β = γ = 90° | Rp = 28.7 Rwp = 15.8 Rexp = 14.0 χ2 = 1.27 | 9 |
| ME2b | γ-Fe2O3 | 0.203 | −0.013 | 0.024 | a = 8.36 (1) b = 8.36 (1) c = 8.36 (1) α = β = γ = 90° | Rp = 41.0 Rwp = 22.9 Rexp = 17.0 χ2 = 1.79 | 9 |
| ME2c | γ-Fe2O3 | 0.613 | −0.307 | 0.441 | a = 8.40 (1) b = 8.40 (1) c = 8.40 (1) α = β = γ = 90° | Rp = 78 Rwp = 40.3 Rexp = 37.3 χ2 = 1.16 | 15 |
| ME2d | γ-Fe2O3 | 0.516 | −0.633 | 0.447 | a = 8.36 (1) b = 8.36 (1) c = 8.36 (1) α = β = γ = 90°° | Rp = 39.0 Rwp = 20.3 Rexp = 16.49 χ2 = 1.52 | 15 |
| ME3b | γ-Fe2O3 | 0.949 | −0.329 | 0.051 | a = 8.39 (1) b = 8.39 (1) c = 8.39 (1) α = β = γ = 90° | Rp = 42.3 Rwp = 23.5 Rexp = 19.6 χ2 = 1.44 | 9 |
| ME3d | γ-Fe2O3 | 1.54 | −0.597 | 0.149 | a = 8.41 (1) b = 8.41 (1) c = 8.41 (1) α = β = γ = 90° | Rp = 148 Rwp = 66.9 Rexp = 61.73 χ2 = 1.18 | 10 |
| Sample | Counted NPs | Mean Particle Size (nm) | σ (nm) | PDI |
|---|---|---|---|---|
| M | 800 | 13 | 0.3 | 0.02 |
| ME1b | 841 | 9 | 0.2 | 0.02 |
| ME2b | 996 | 5 | 0.1 | 0.02 |
| ME3b | 534 | 4 | 0.8 | 0.04 |
| MEbs | 850 | 9 | 2.7 | 0.31 |
| MEbc | 719 | 9 | 1.6 | 0.17 |
| MEbr | 946 | 9 | 1.9 | 0.21 |
| Sample | Hydrodynamic Diameter (nm) | Isoelectric Point (mV) |
|---|---|---|
| M | 228 | 4.3 |
| ME1b | 927 | 3.1 |
| ME2b | 666 | 3.1 |
| ME3b | 276 | 4.0 |
| Sample | Component | RAA (%) | δ vs. Fe 300 K (mm/s) | Bhf (T) | Γ (mm/s) |
|---|---|---|---|---|---|
| M | Site A | 37 | 0.36 | 49.9 | 0.8 |
| Site B | 63 | 0.48 | 52.8 | 0.7 | |
| ME1b | Site A | 37 | 0.36 | 49.1 | 0.7 |
| Site B | 63 | 0.48 | 52.4 | 0.6 | |
| ME2b | Site A | 37 | 0.36 | 49.1 | 0.7 |
| Site B | 63 | 0.48 | 52.4 | 0.6 | |
| ME3b | Site A | 37 | 0.36 | 49.1 | 0.7 |
| Site B | 63 | 0.48 | 52.4 | 0.6 | |
| error | ±3 | ±0.02 | ±0.5 | ±0.1 |
| Sample | Component | RAA (%) | δ vs. Fe 300 K (mm/s) | Bhf (T) | Γ (mm/s) |
|---|---|---|---|---|---|
| MEbs | Site A | 37 | 0.36 | 51.5 | 0.55 |
| Site B | 63 | 0.48 | 53.1 | 0.46 | |
| MEbc | Site A | 37 | 0.36 | 51.5 | 0.55 |
| Site B | 63 | 0.48 | 53.1 | 0.46 | |
| MEbr | Site A | 37 | 0.36 | 51.5 | 0.55 |
| Site B | 63 | 0.48 | 53.1 | 0.46 | |
| error | ±3 | ±0.02 | ±0.5 | ±0.03 |
| Sample | T (K) | Ms (emu g−1) | Mr (emu g−1) | χ ×10−5 (emu g−1 kOe) | Keff × 104 (Jm−3) | Mr/Ms |
|---|---|---|---|---|---|---|
| M | 300 | 73.7 | 3.2 | 2.3 | 3.8 | 0.04 |
| 5 | 78.8 | 20.2 | 2.8 | 4.8 | 0.26 | |
| ME1b | 300 | 52.1 | 0.7 | 2.8 | 2.7 | 0.01 |
| 5 | 62.1 | 12.7 | 2.1 | 3.2 | 0.20 | |
| ME2b | 300 | 43.3 | 3.4 | 4.3 | 0.9 | 0.08 |
| 5 | 53.5 | 14.9 | 4.2 | 3.0 | 0.28 | |
| ME3b | 300 | 53.0 | 1.1 | 3.8 | 3.1 | 0.02 |
| 5 | 42.3 | 14.6 | 4.7 | 0.9 | 0.35 | |
| MEbs | 300 | 55.3 | 0.0 | 2.5 | 2.5 | 0.00 |
| 5 | 64.6 | 11.7 | 2.0 | 3.2 | 0.18 | |
| MEbr | 300 | 57.0 | 0.1 | 2.6 | 2.7 | 0.01 |
| 5 | 66.0 | 14.4 | 2.3 | 3.5 | 0.22 | |
| MEbc | 300 | 46.5 | 0.0 | 2.1 | 2.3 | 0.00 |
| 5 | 54.5 | 12.7 | 1.7 | 2.9 | 0.23 |
| PFO Model | PSO Model | |
|---|---|---|
| qe (mg g−1) | 3.857(4) × 103 | 3.898(4) × 103 mg g−1 |
| k1 (min−1) | 1.94(1) | k2 = 0.0014(4) (g mg−1 min−1) |
| R2 | 0.975 | 0.979 |
| BIC | 165 | 167 |
| Elovich Model | IDM | |
| α | 105 (mg g−1 min−1) | kp = 18(7) × 10 mg g−1 min−1/2) |
| 0.0025(7) (g mg−1) | C = 2.6(4) × 103 (mg g−1) | |
| R2 | 0.838 | 0.290 |
| BIC | 249 | 166 |
Disclaimer/Publisher’s Note: The statements, opinions and data contained in all publications are solely those of the individual author(s) and contributor(s) and not of MDPI and/or the editor(s). MDPI and/or the editor(s) disclaim responsibility for any injury to people or property resulting from any ideas, methods, instructions or products referred to in the content. |
© 2025 by the authors. Licensee MDPI, Basel, Switzerland. This article is an open access article distributed under the terms and conditions of the Creative Commons Attribution (CC BY) license (https://creativecommons.org/licenses/by/4.0/).
Share and Cite
Alca-Ramos, Y.V.; Checca-Huaman, N.-R.; Rueda-Vellasmin, R.; Passamani, E.C.; Ramos-Guivar, J.A. Biosynthesis Scale-Up Process for Magnetic Iron-Oxide Nanoparticles Using Eucalyptus globulus Extract and Their Separation Properties in Lubricant–Water Emulsions. Nanomaterials 2025, 15, 382. https://doi.org/10.3390/nano15050382
Alca-Ramos YV, Checca-Huaman N-R, Rueda-Vellasmin R, Passamani EC, Ramos-Guivar JA. Biosynthesis Scale-Up Process for Magnetic Iron-Oxide Nanoparticles Using Eucalyptus globulus Extract and Their Separation Properties in Lubricant–Water Emulsions. Nanomaterials. 2025; 15(5):382. https://doi.org/10.3390/nano15050382
Chicago/Turabian StyleAlca-Ramos, Yacu Vicente, Noemi-Raquel Checca-Huaman, Renzo Rueda-Vellasmin, Edson Caetano Passamani, and Juan A. Ramos-Guivar. 2025. "Biosynthesis Scale-Up Process for Magnetic Iron-Oxide Nanoparticles Using Eucalyptus globulus Extract and Their Separation Properties in Lubricant–Water Emulsions" Nanomaterials 15, no. 5: 382. https://doi.org/10.3390/nano15050382
APA StyleAlca-Ramos, Y. V., Checca-Huaman, N.-R., Rueda-Vellasmin, R., Passamani, E. C., & Ramos-Guivar, J. A. (2025). Biosynthesis Scale-Up Process for Magnetic Iron-Oxide Nanoparticles Using Eucalyptus globulus Extract and Their Separation Properties in Lubricant–Water Emulsions. Nanomaterials, 15(5), 382. https://doi.org/10.3390/nano15050382