

Coarse-Grained Monte Carlo Simulations of Graphene-Enhanced Geopolymer Nanocomposite Nucleation


Abstract
1. Introduction
2. Simulation Model and Method
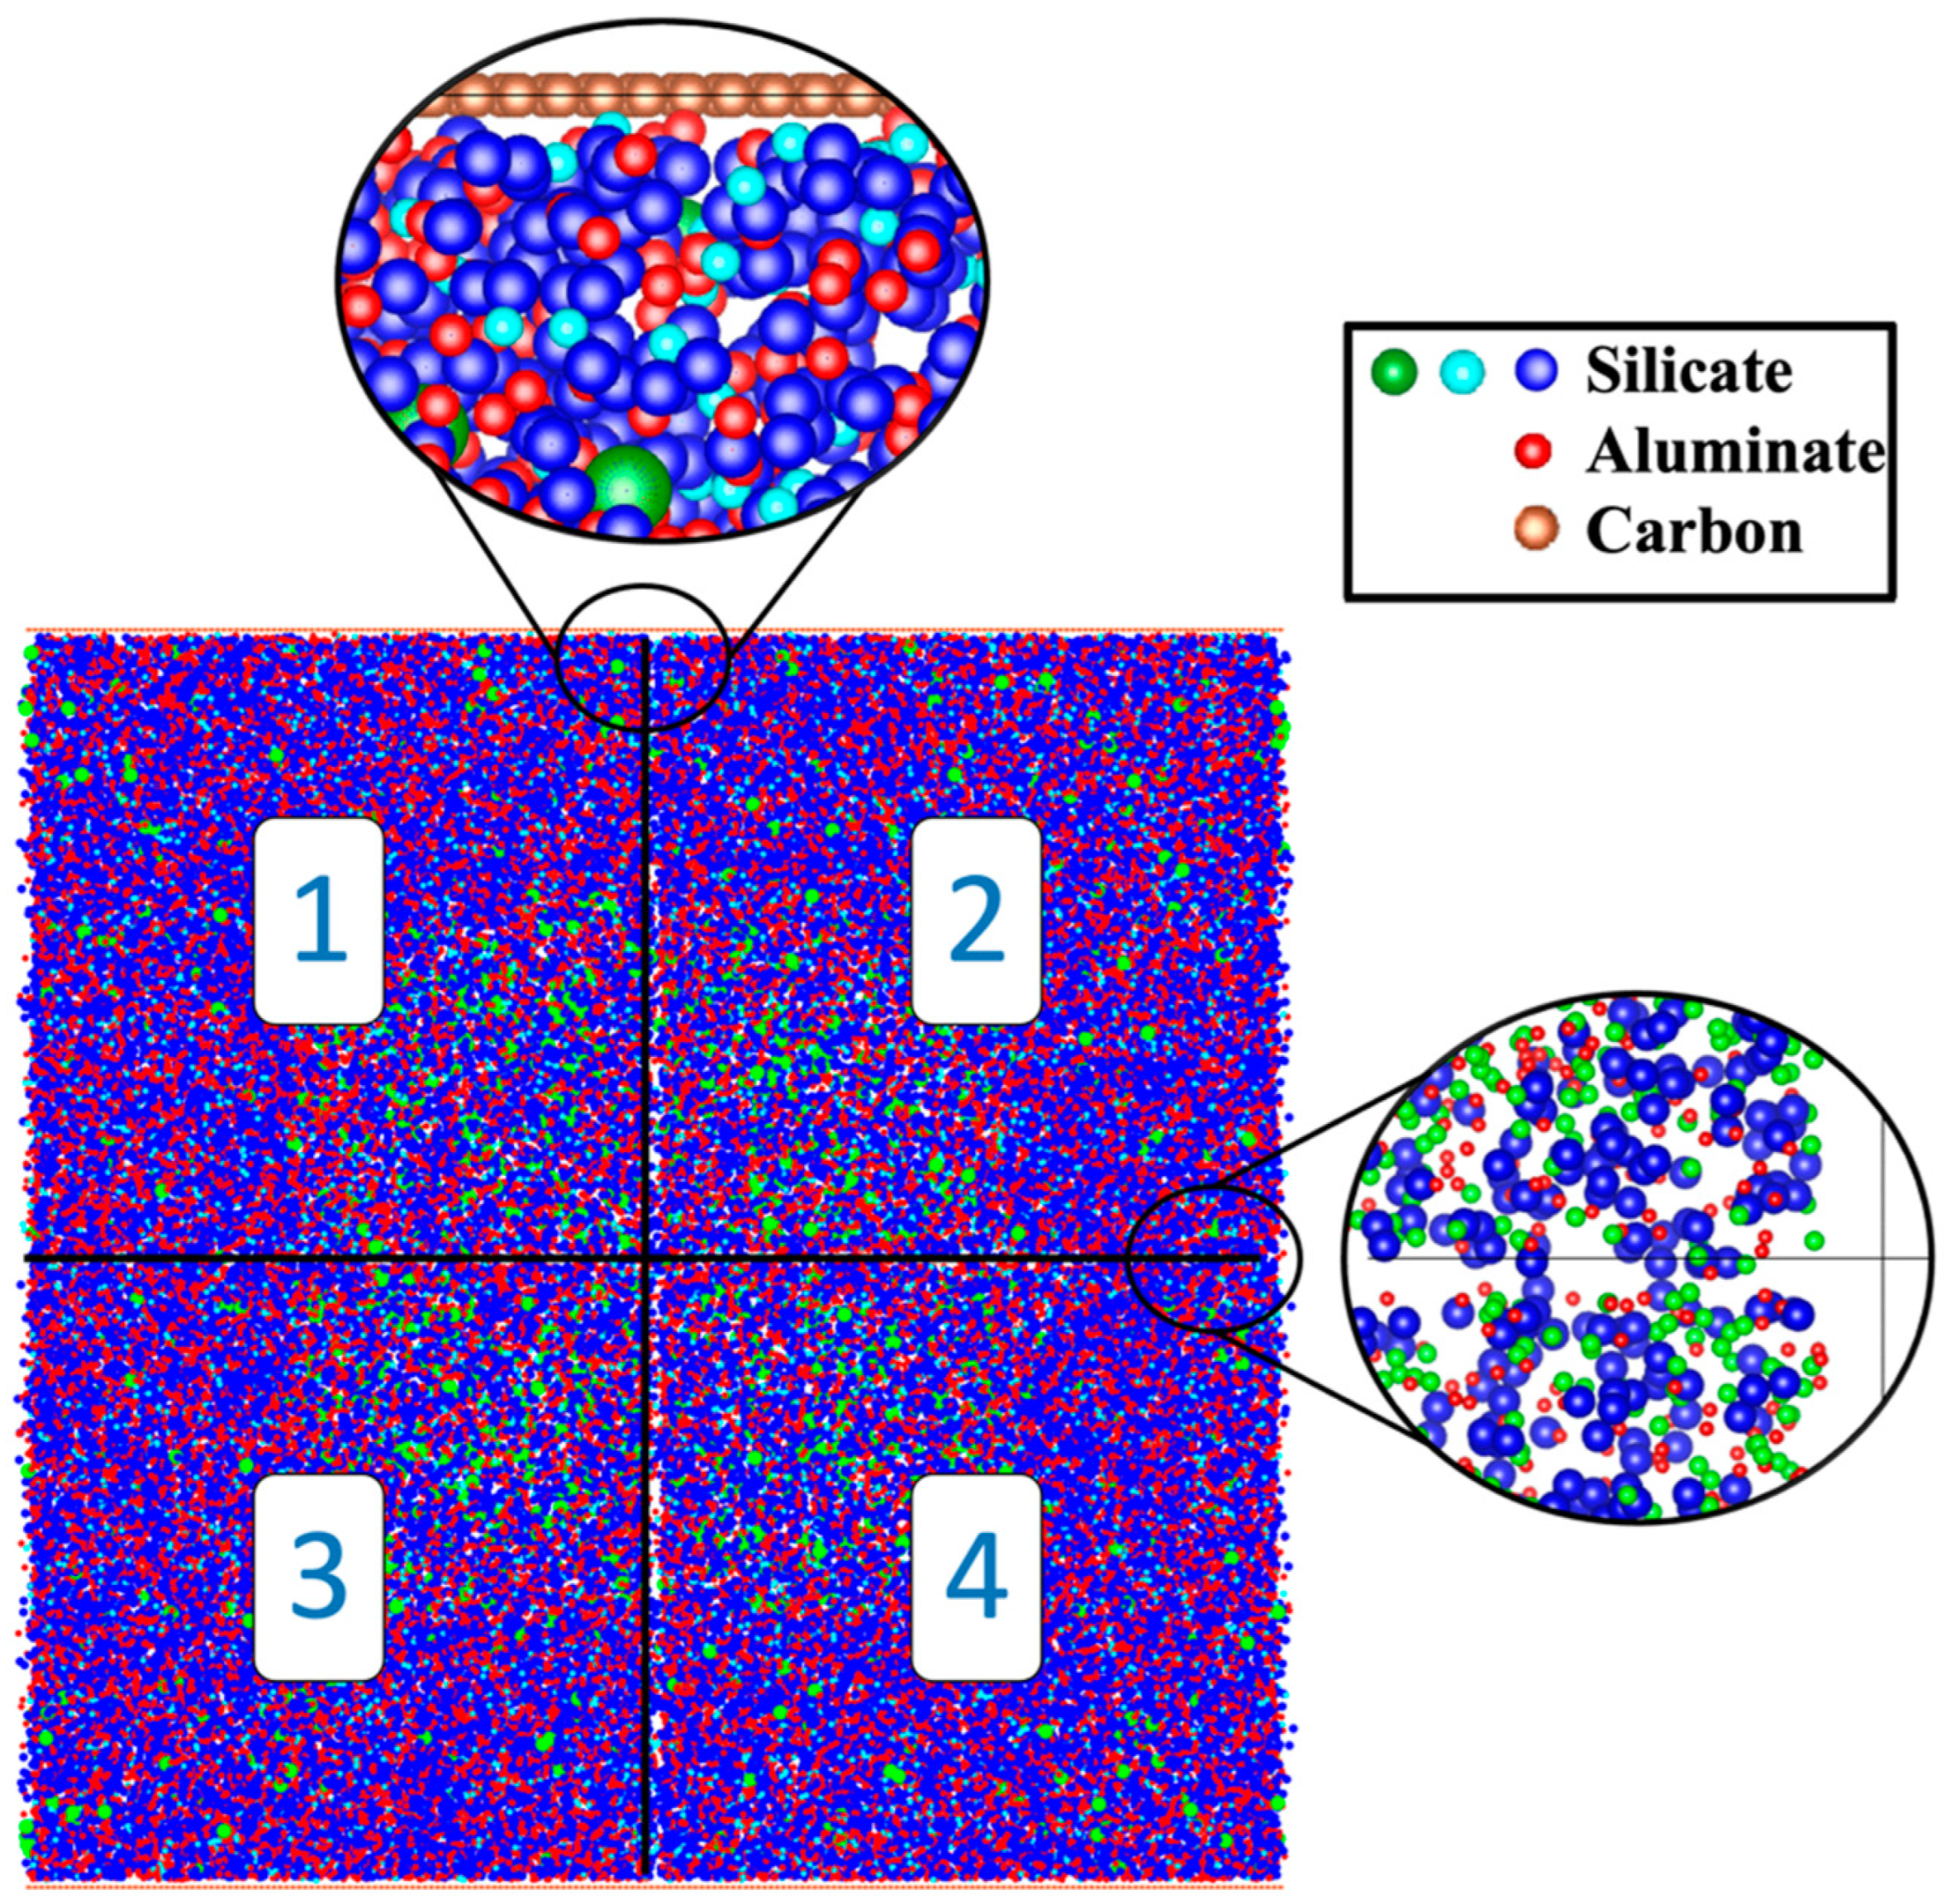
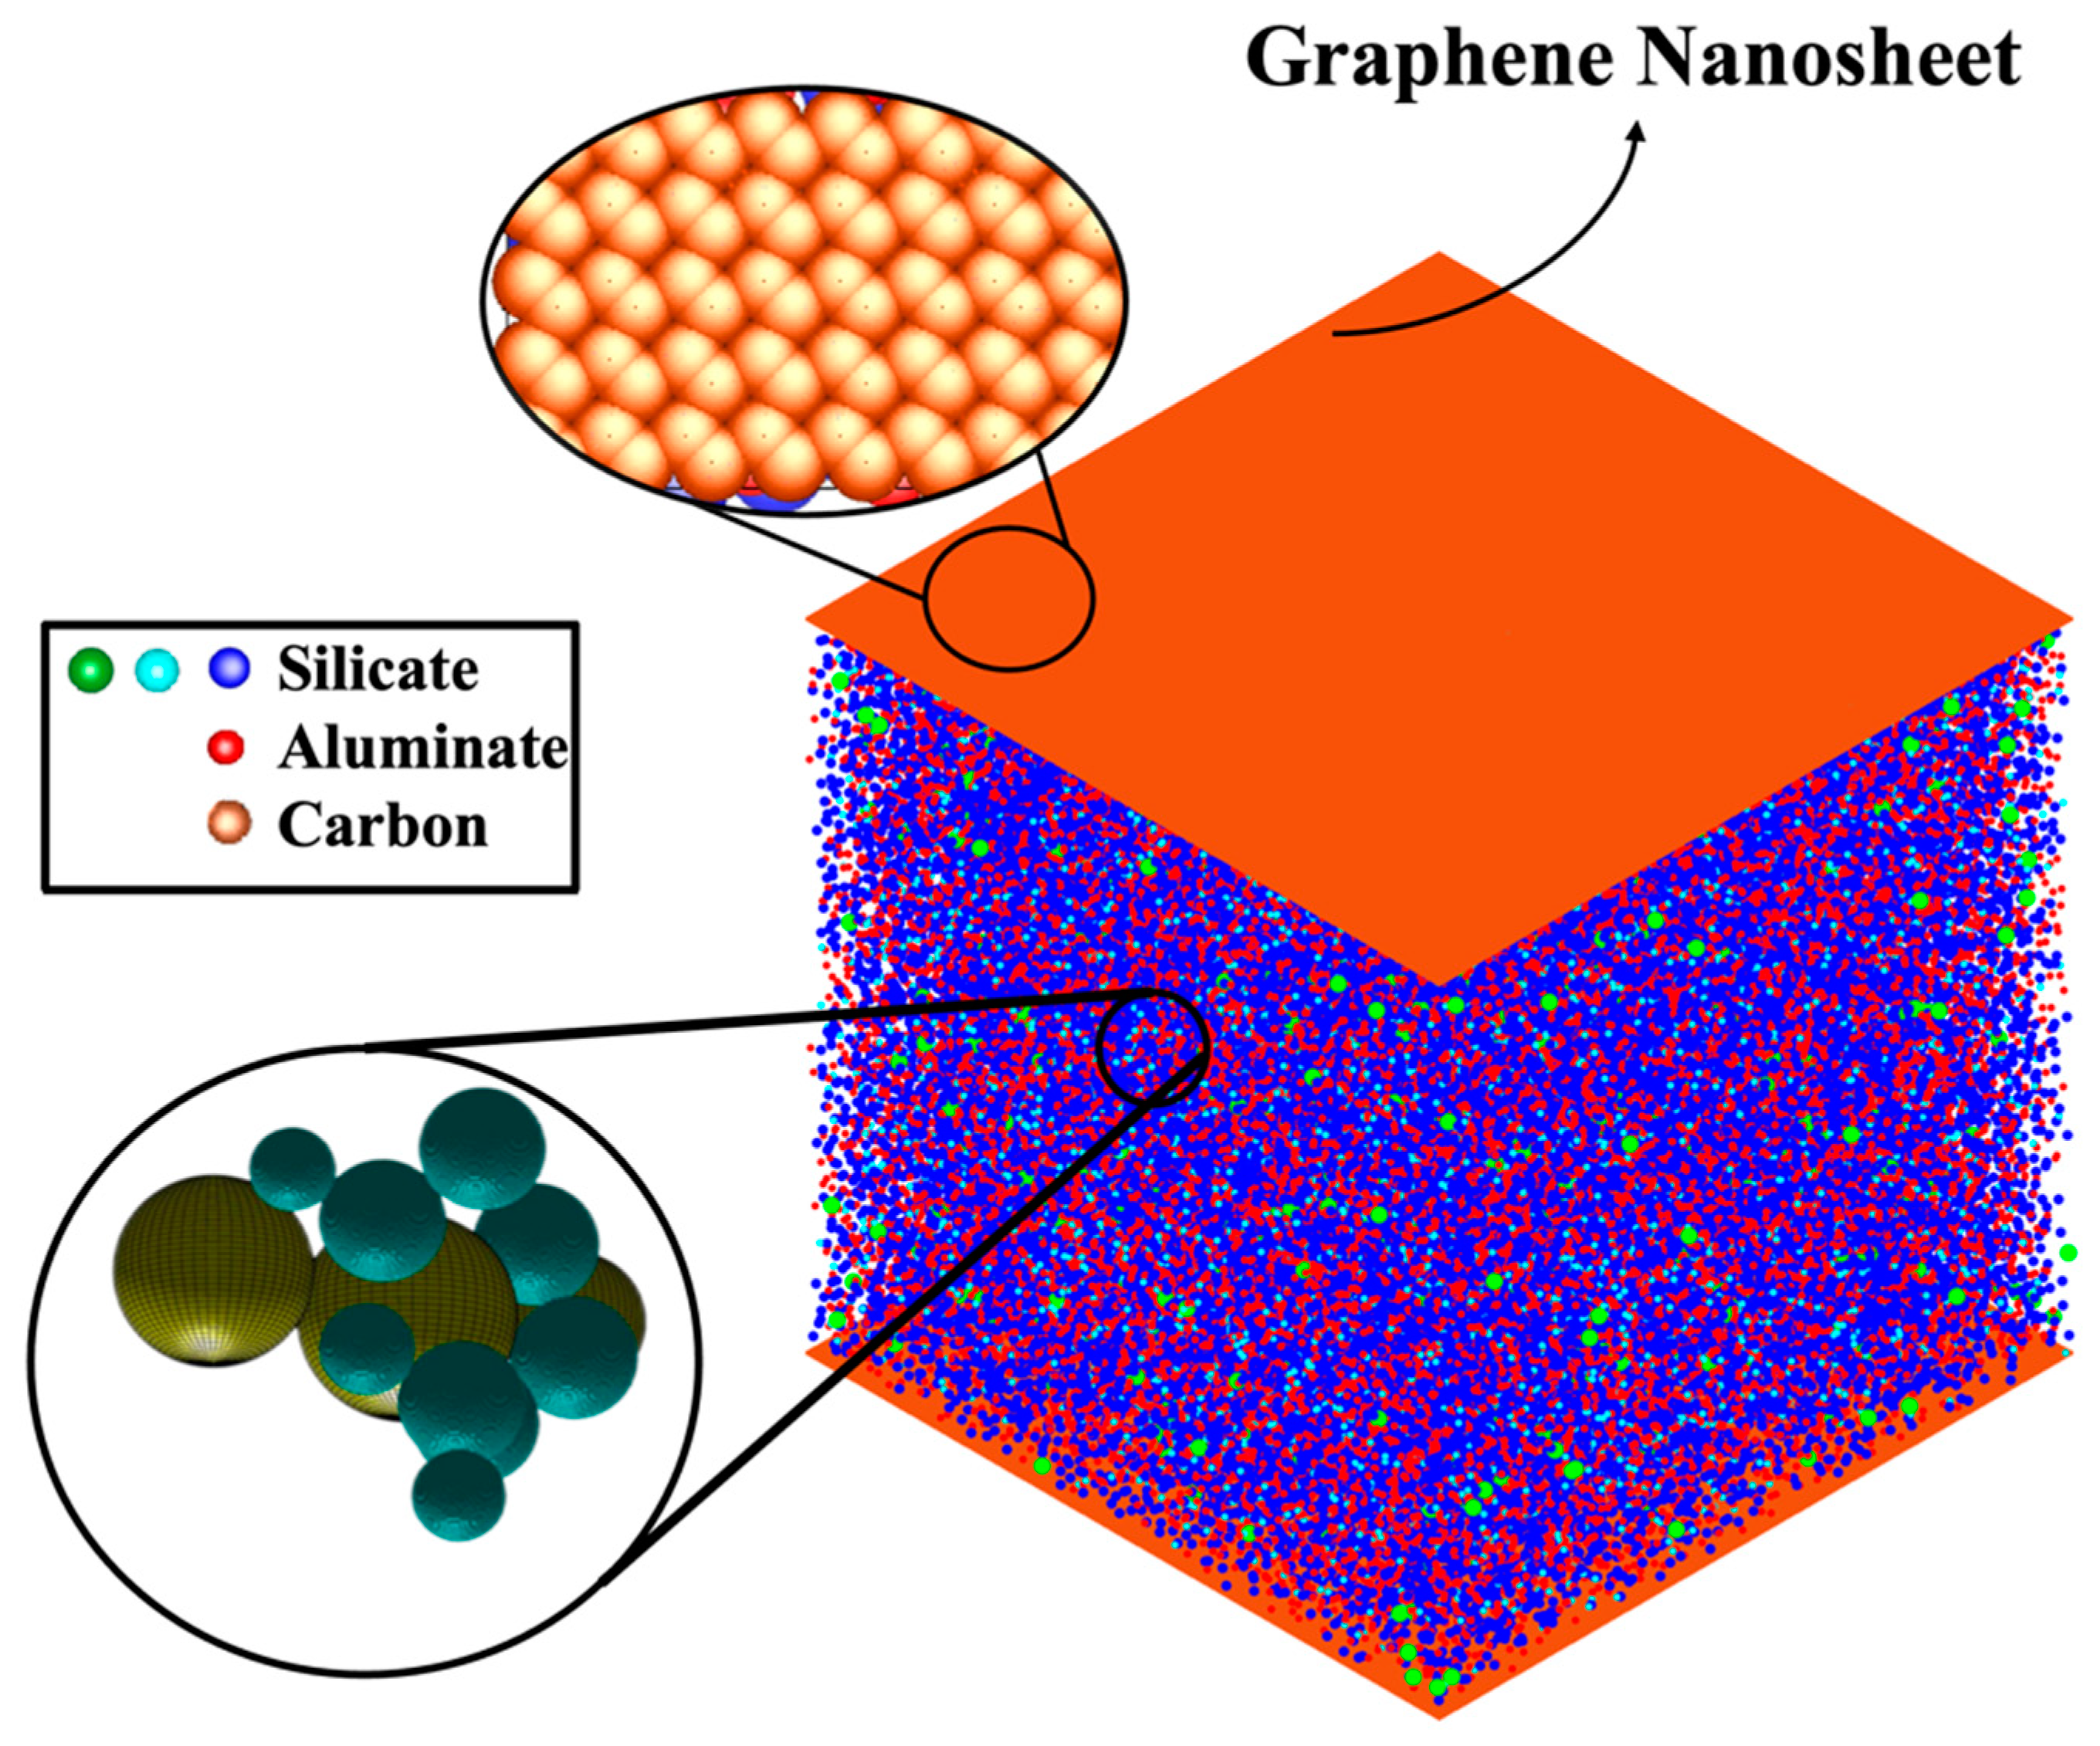
2.1. Atomistic Model Preparation
2.2. Monte Carlo Approach: Implementation in MATLAB Code
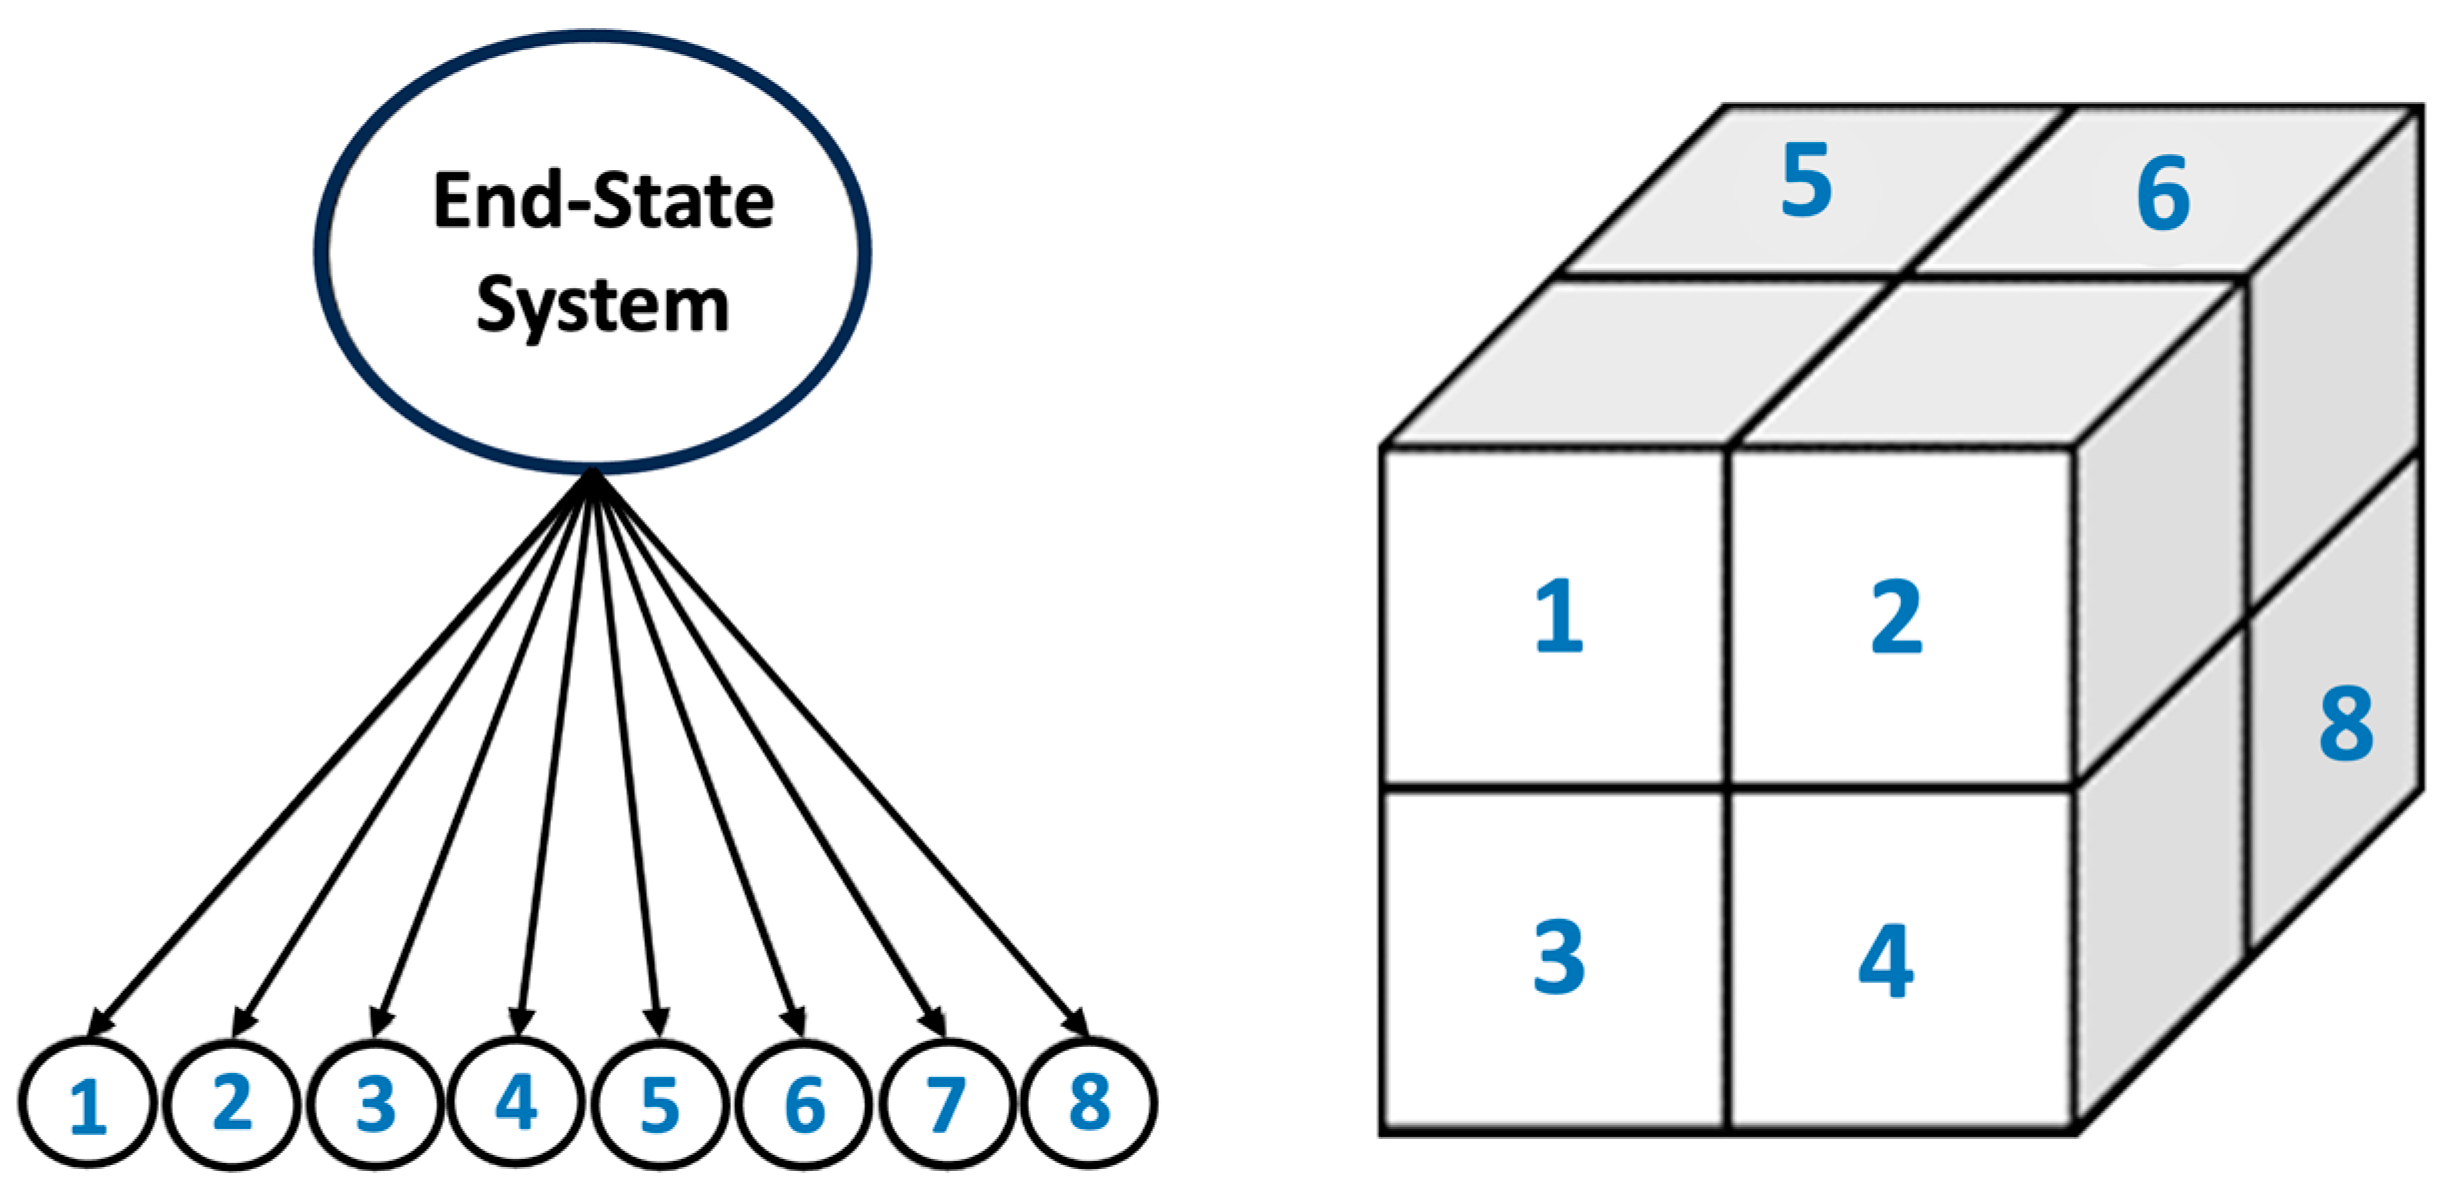
2.3. Octree Cells Approach: MATLAB Program Development
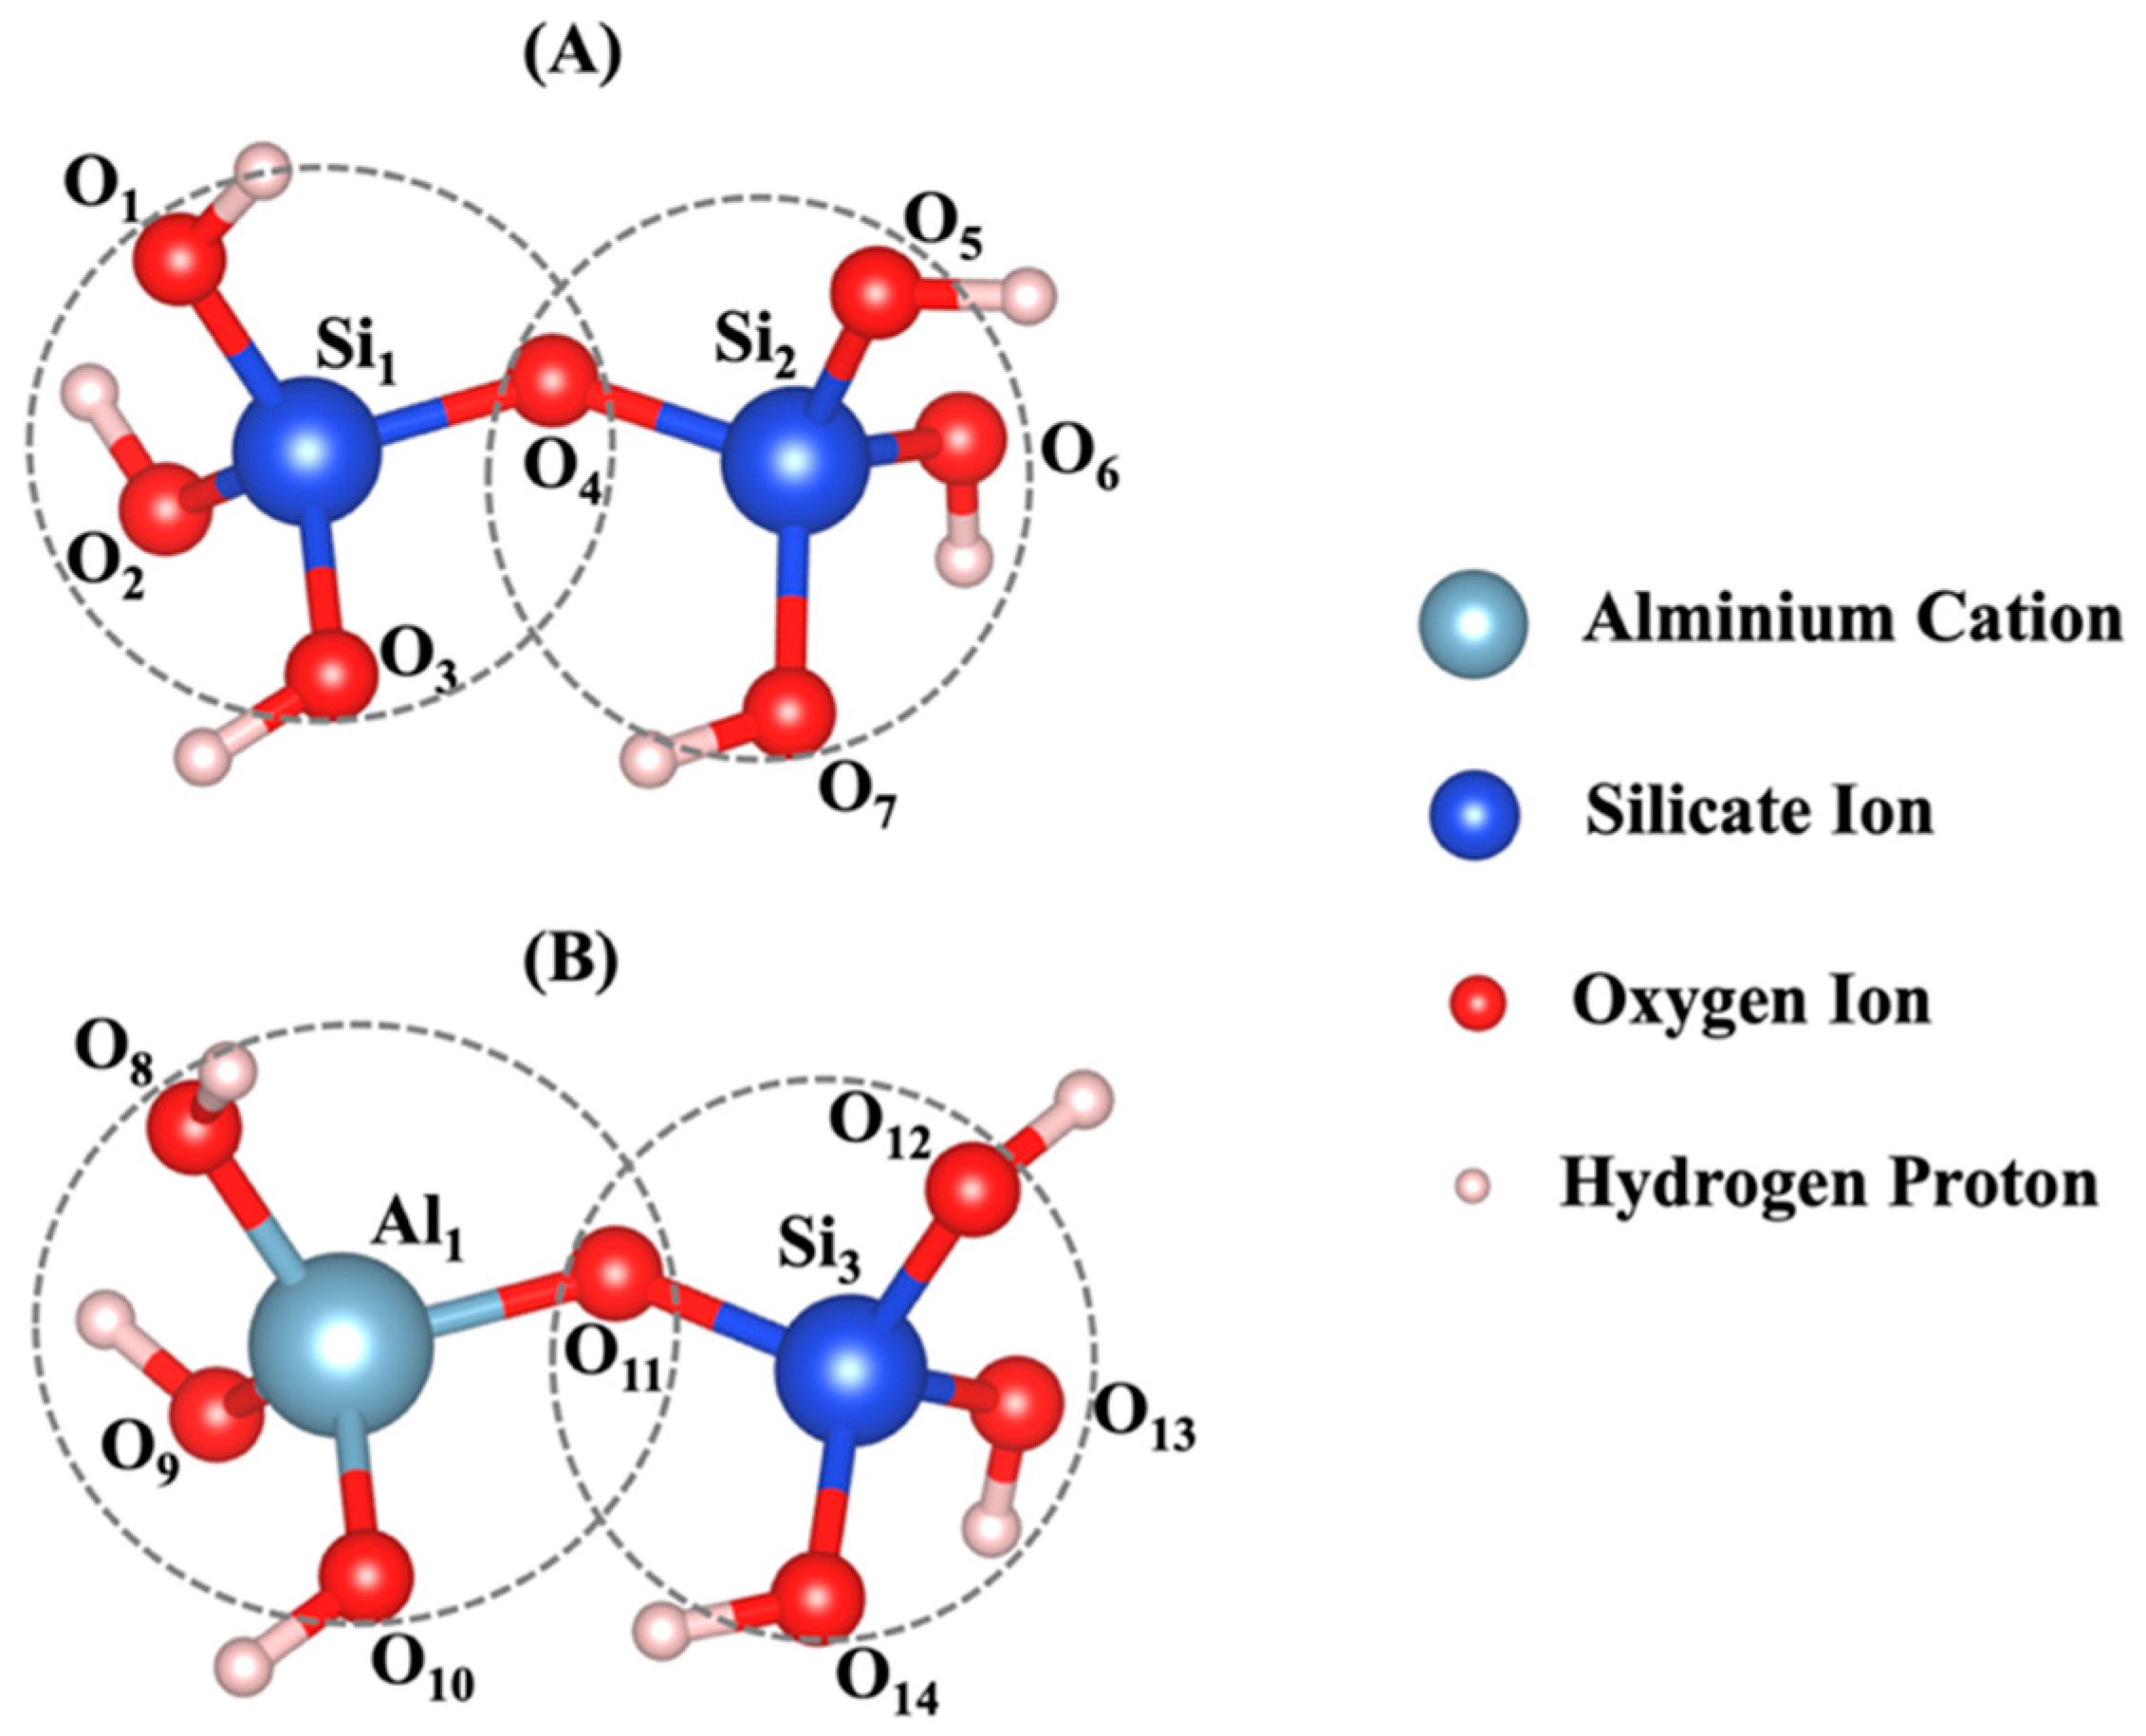
2.4. Density Functional Theory (DFT) Computational Modeling Method
3. Results and Discussions
4. Conclusions
- -
- The Octree cell approach significantly (eight times) reduced computational time and optimized high-performance computing (HPC) resources, enabling the efficient scaling of the CGMC simulations.
- -
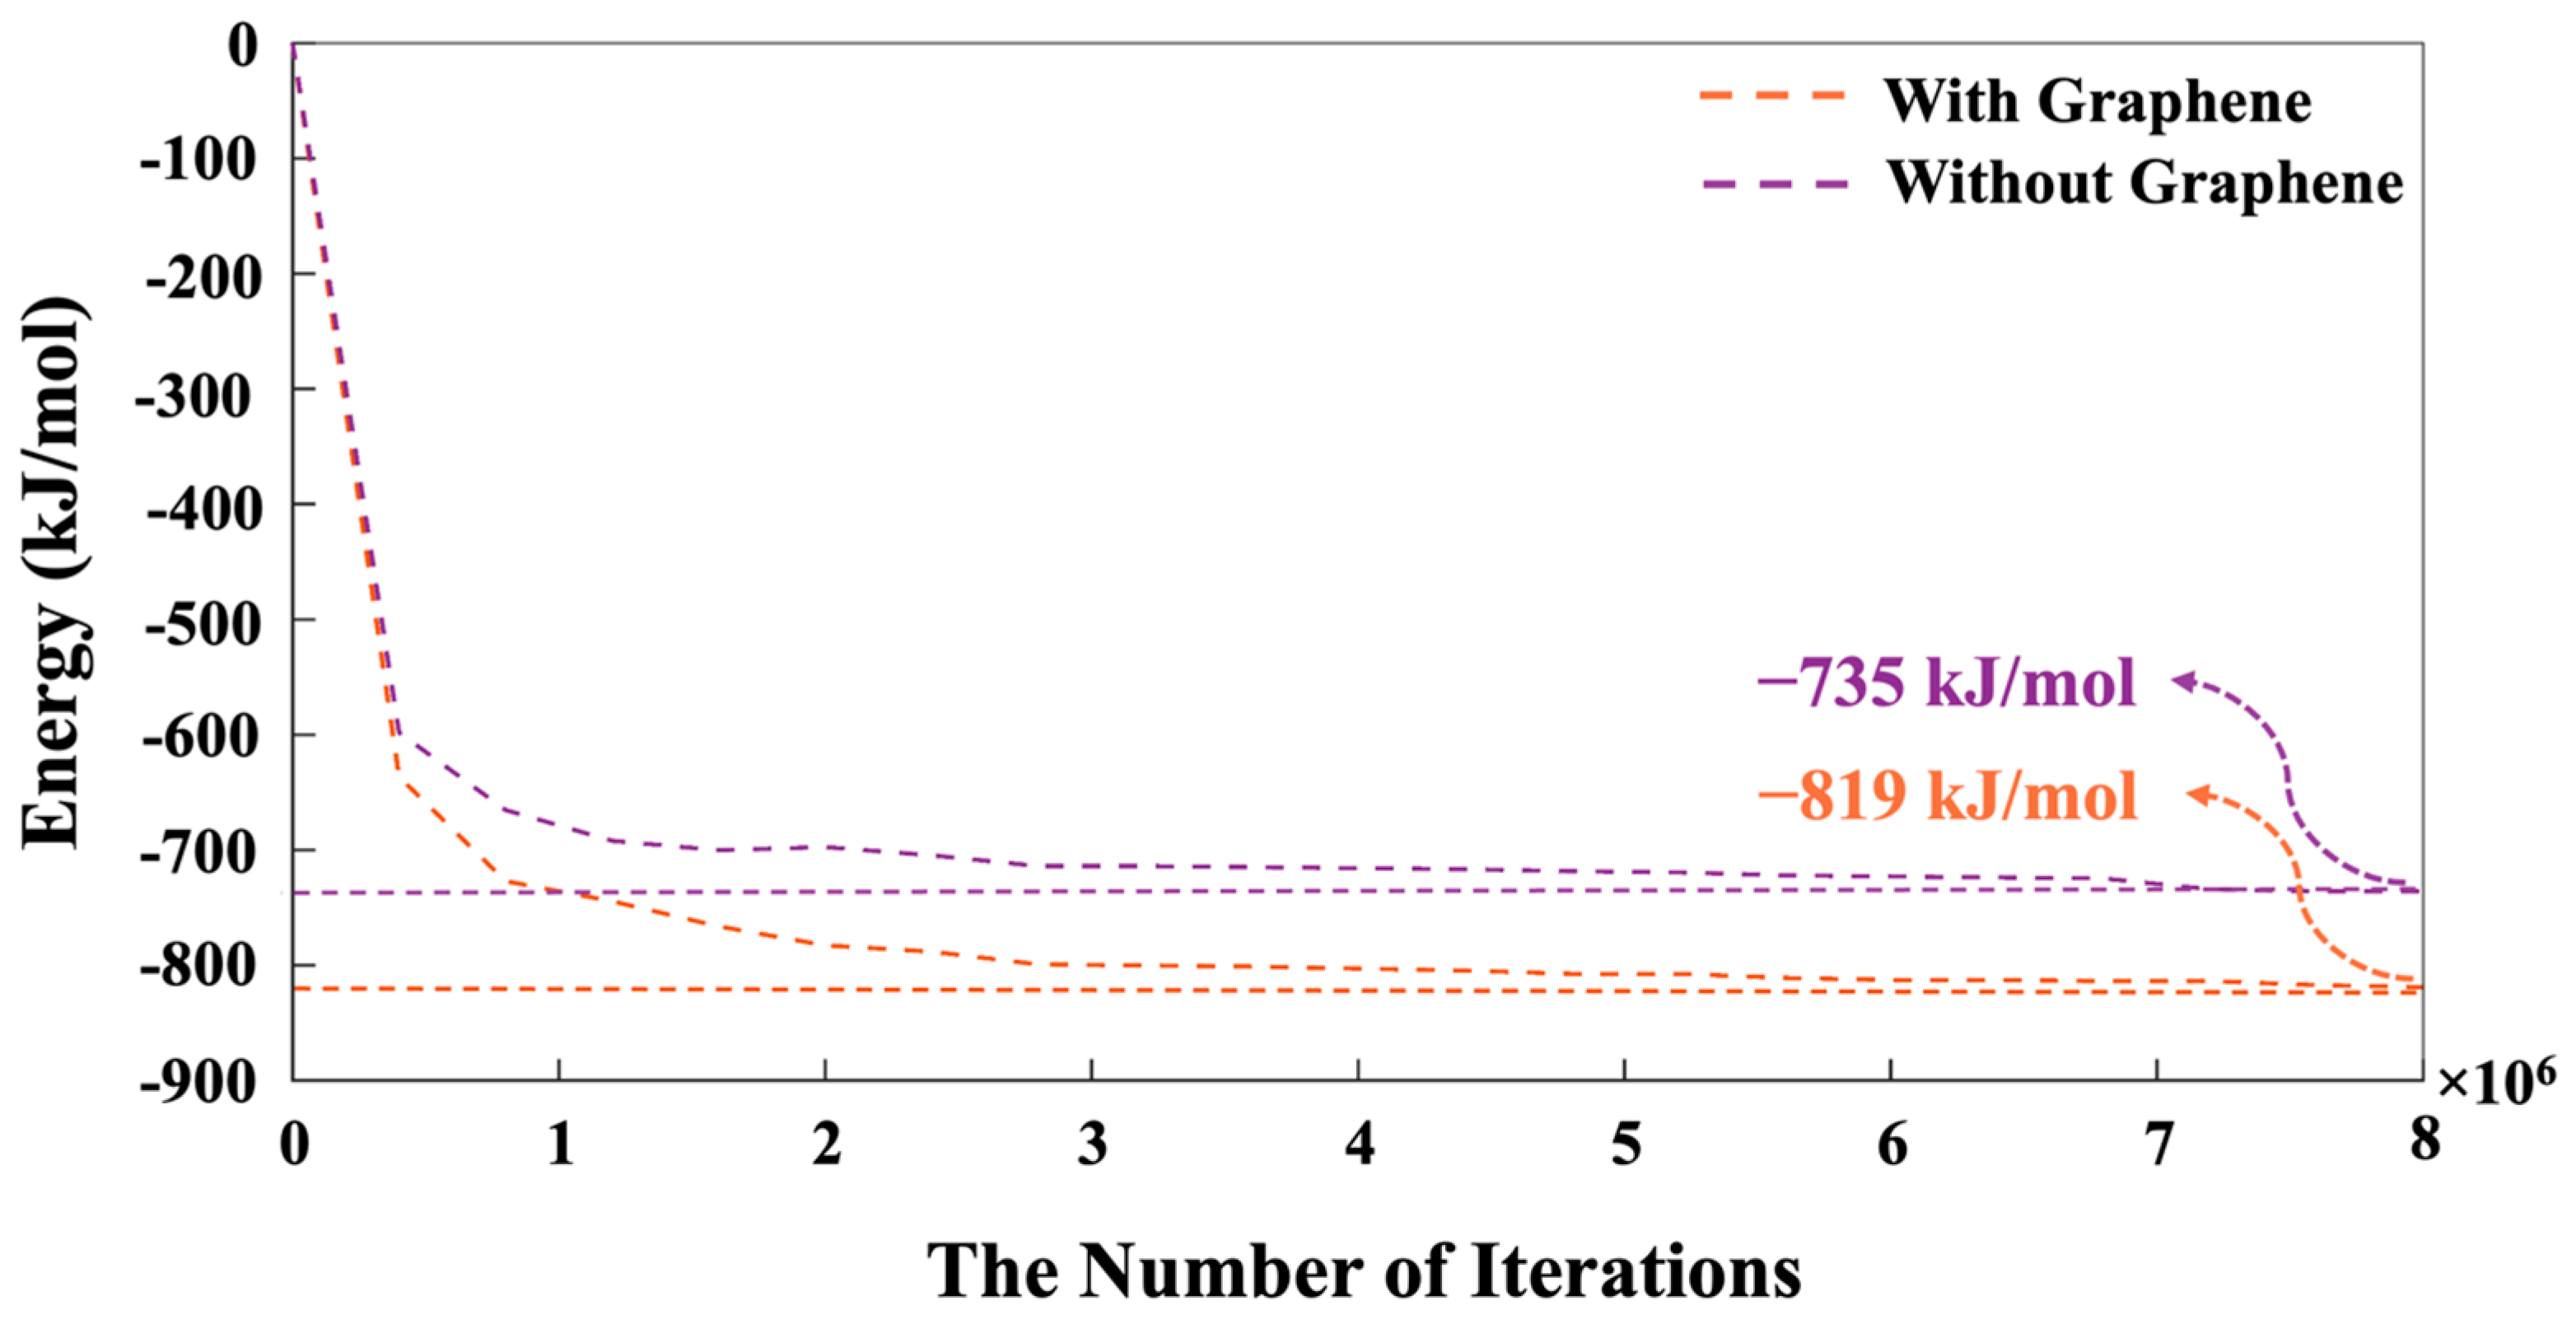
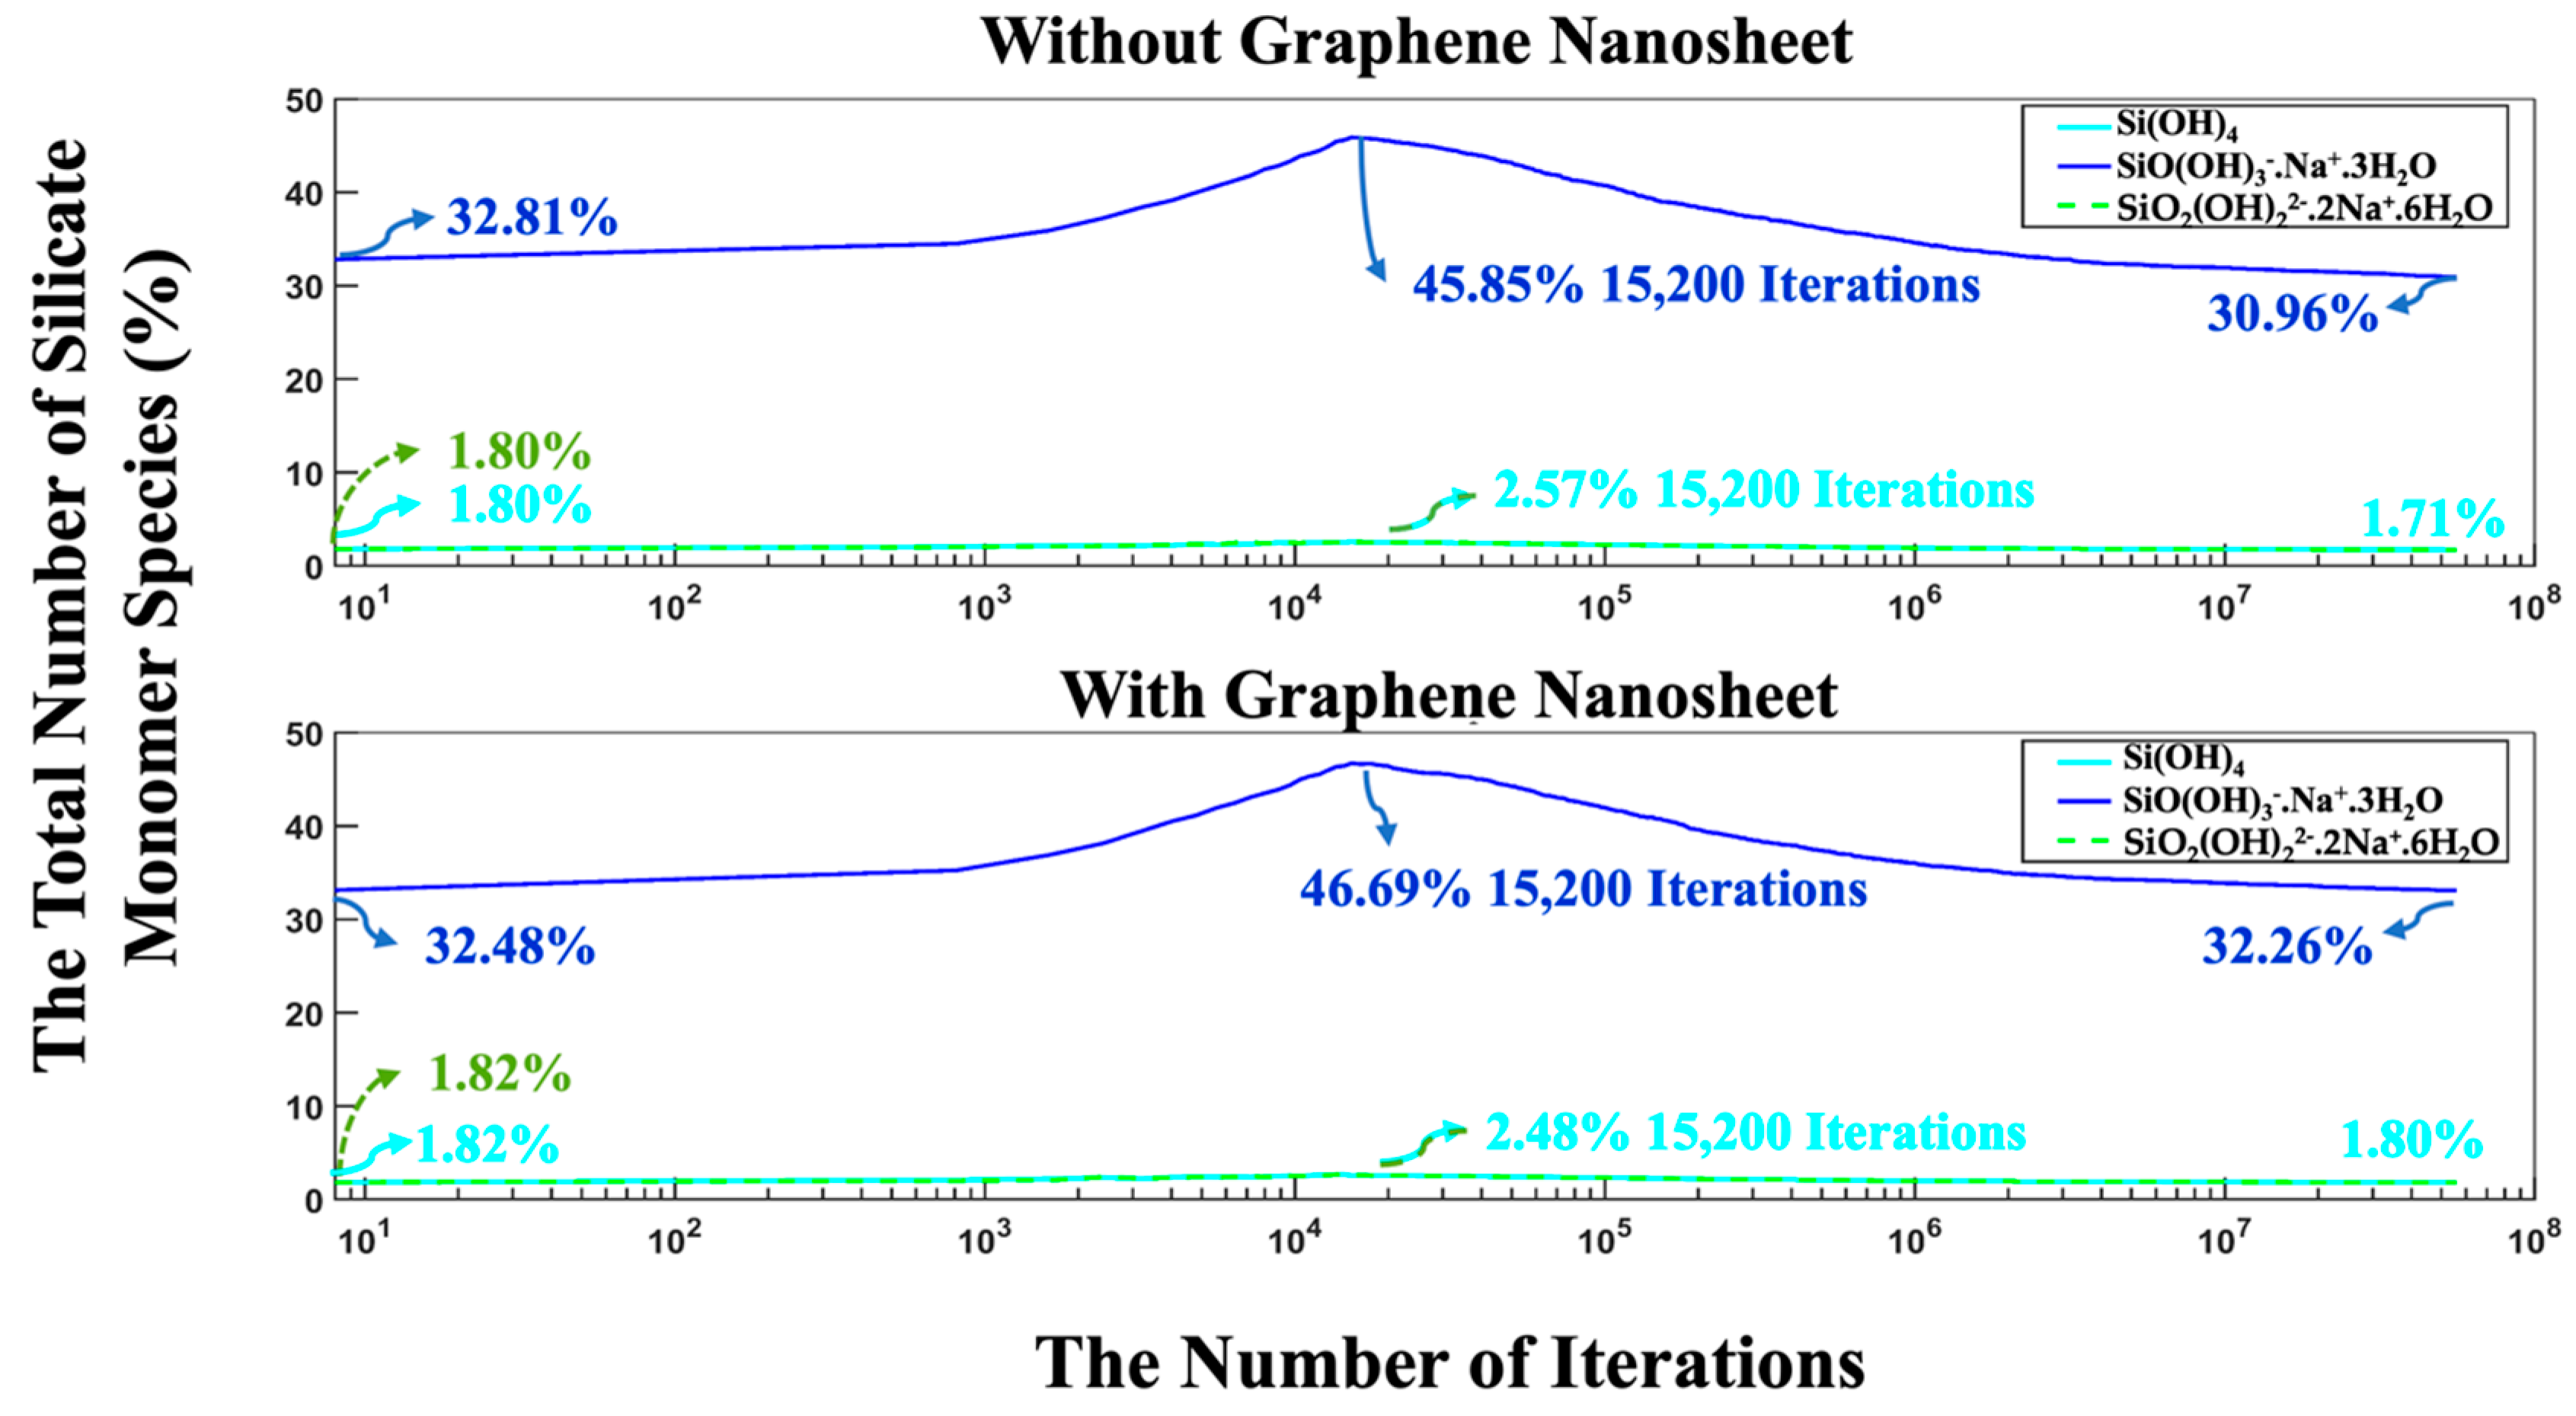
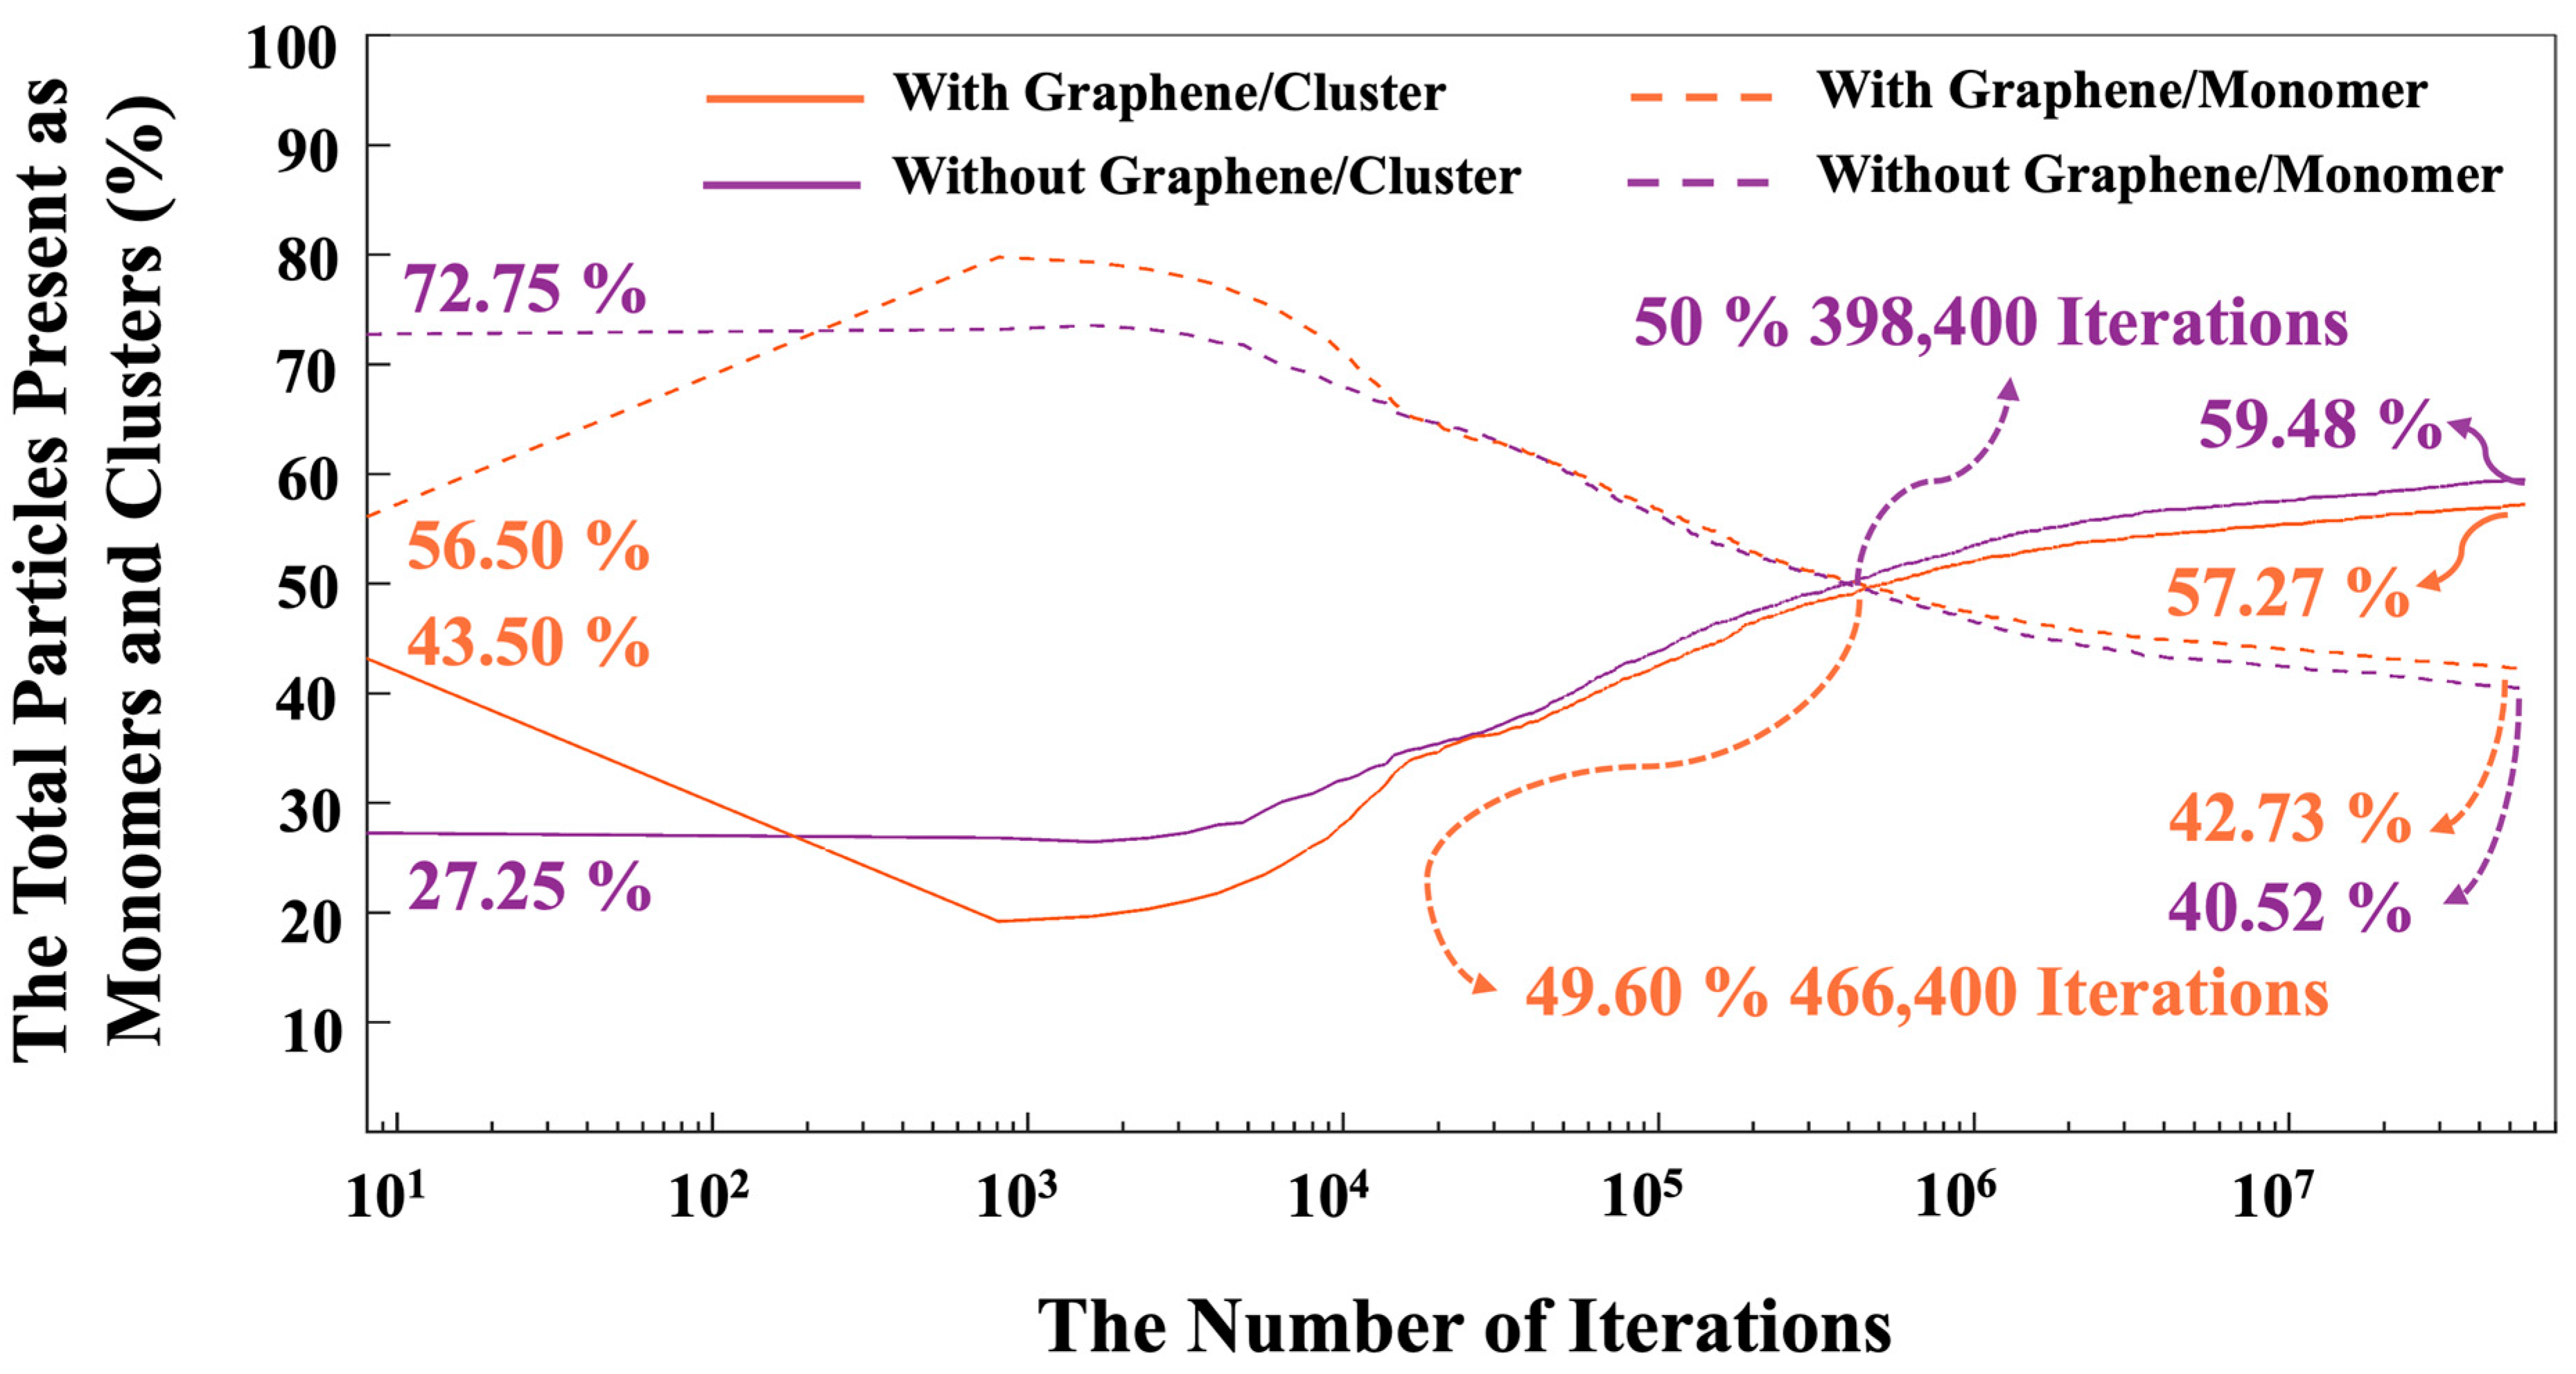
- The proportion of particles involved in cluster formation was (4.34%) lower in the system with graphene compared to the one without it. In contrast, the system containing graphene displayed a more favorable energy state, which can be ascribed to the weaker adsorption energy on the graphene nanosheet (heterogenous nucleation) compared to the homogenous nucleation.
- -
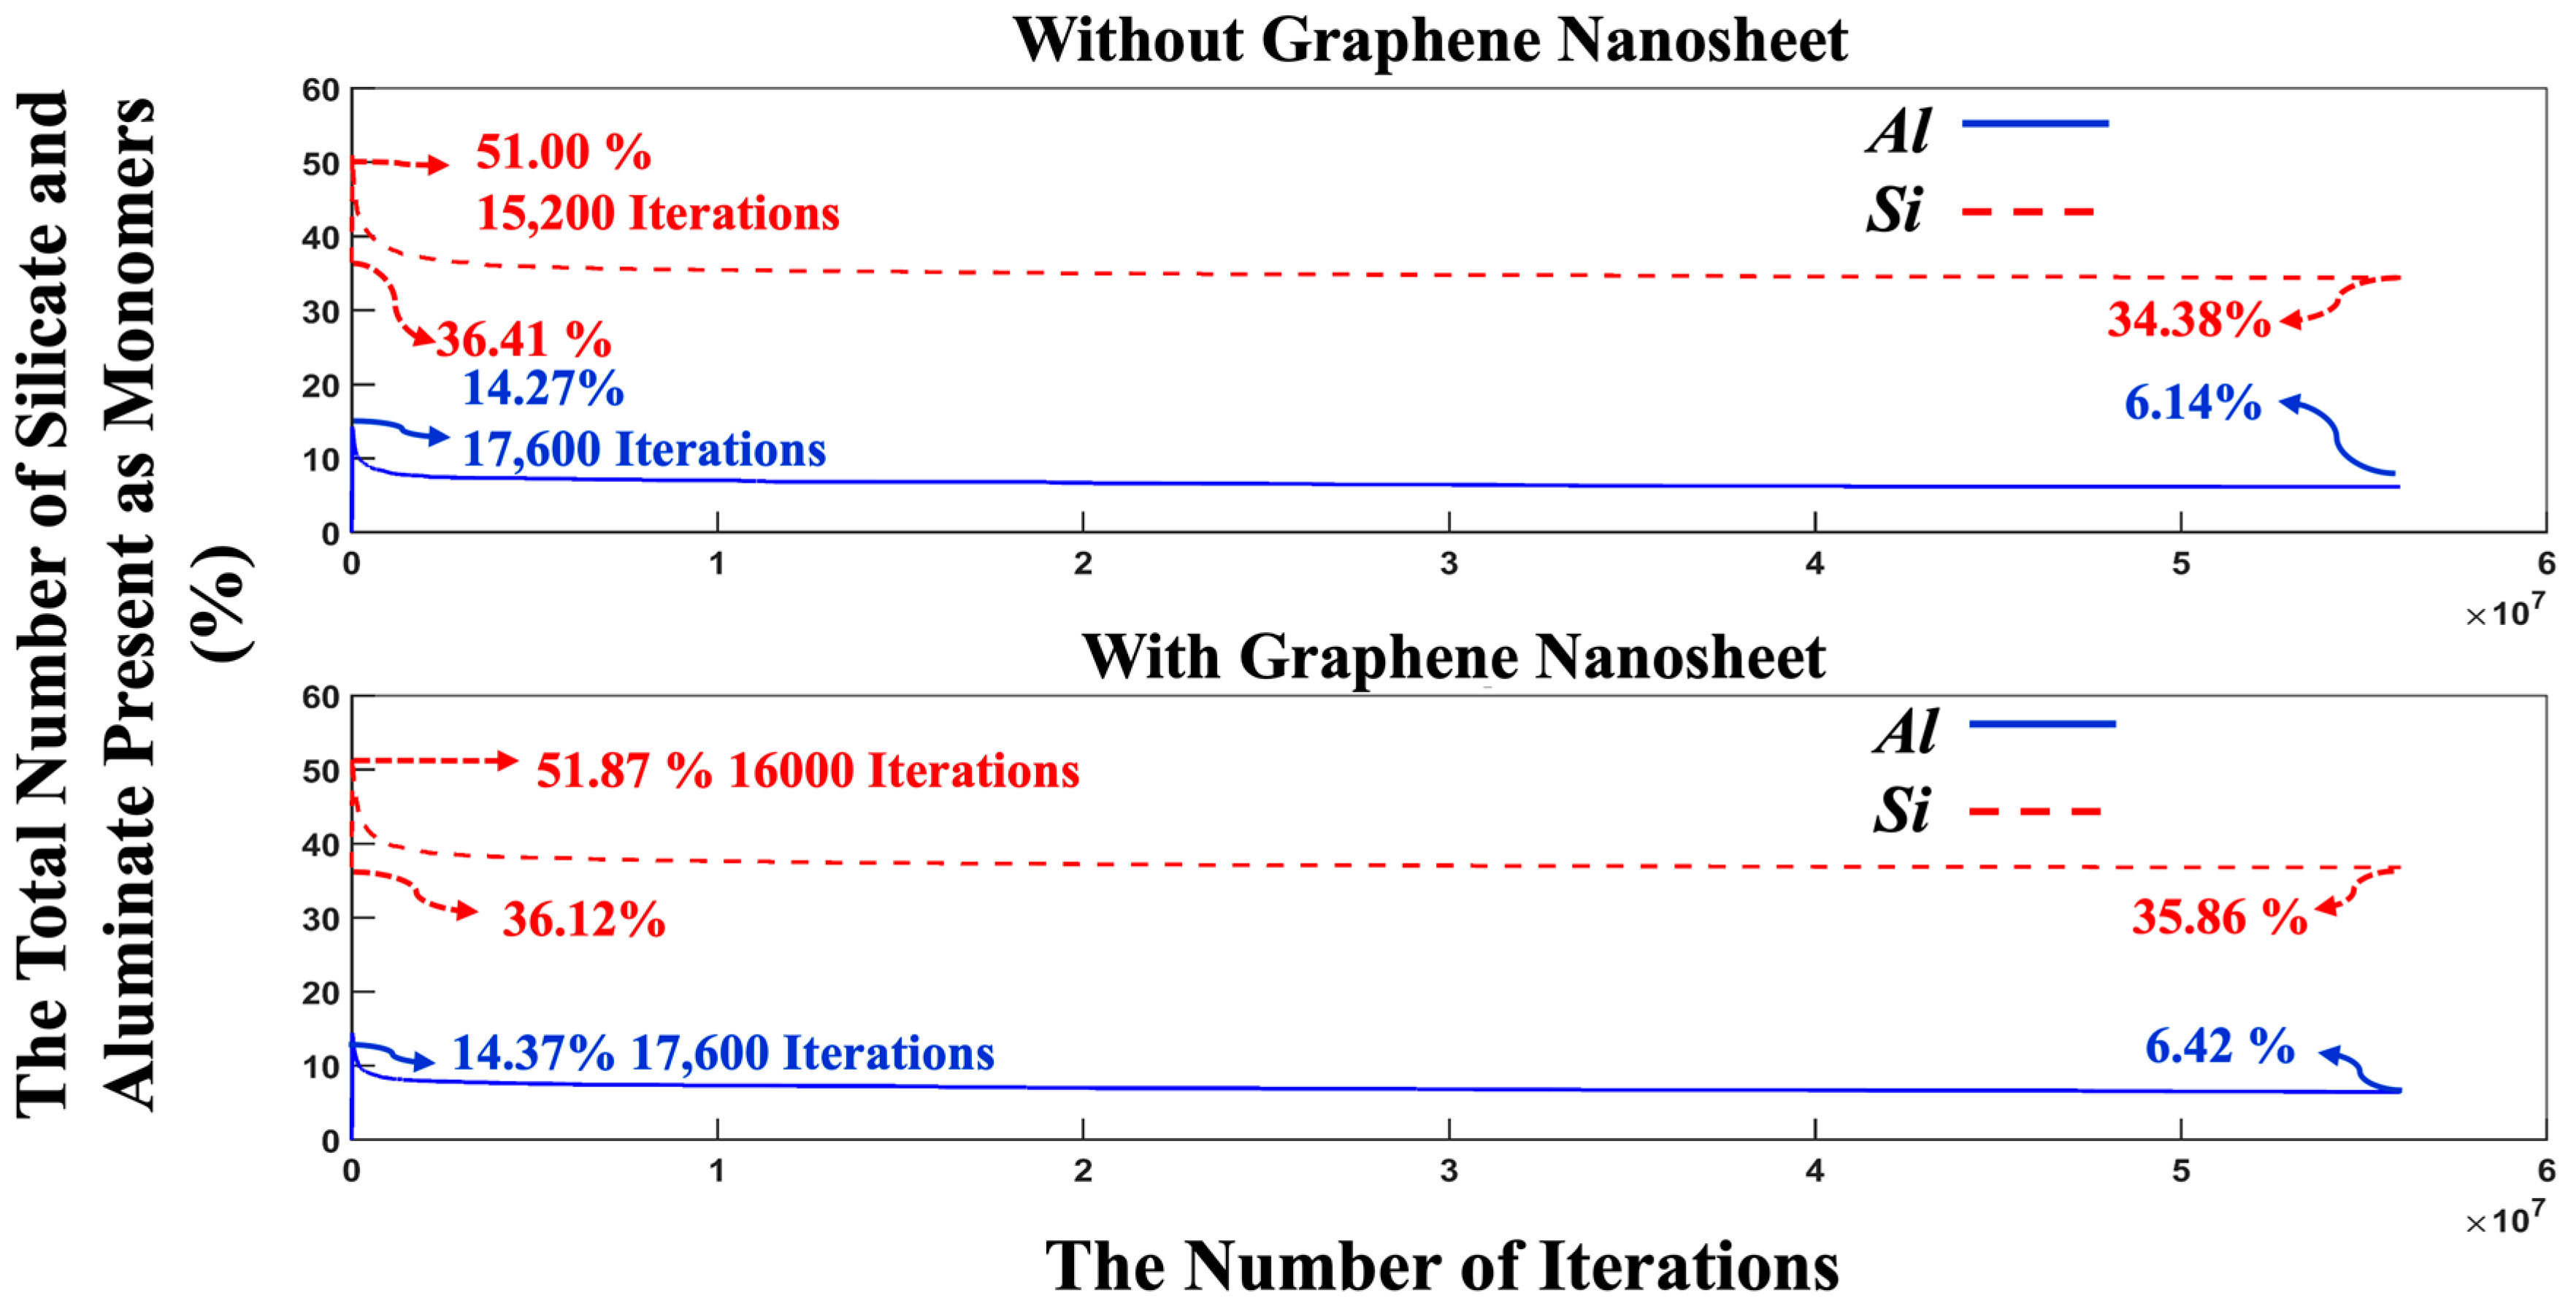
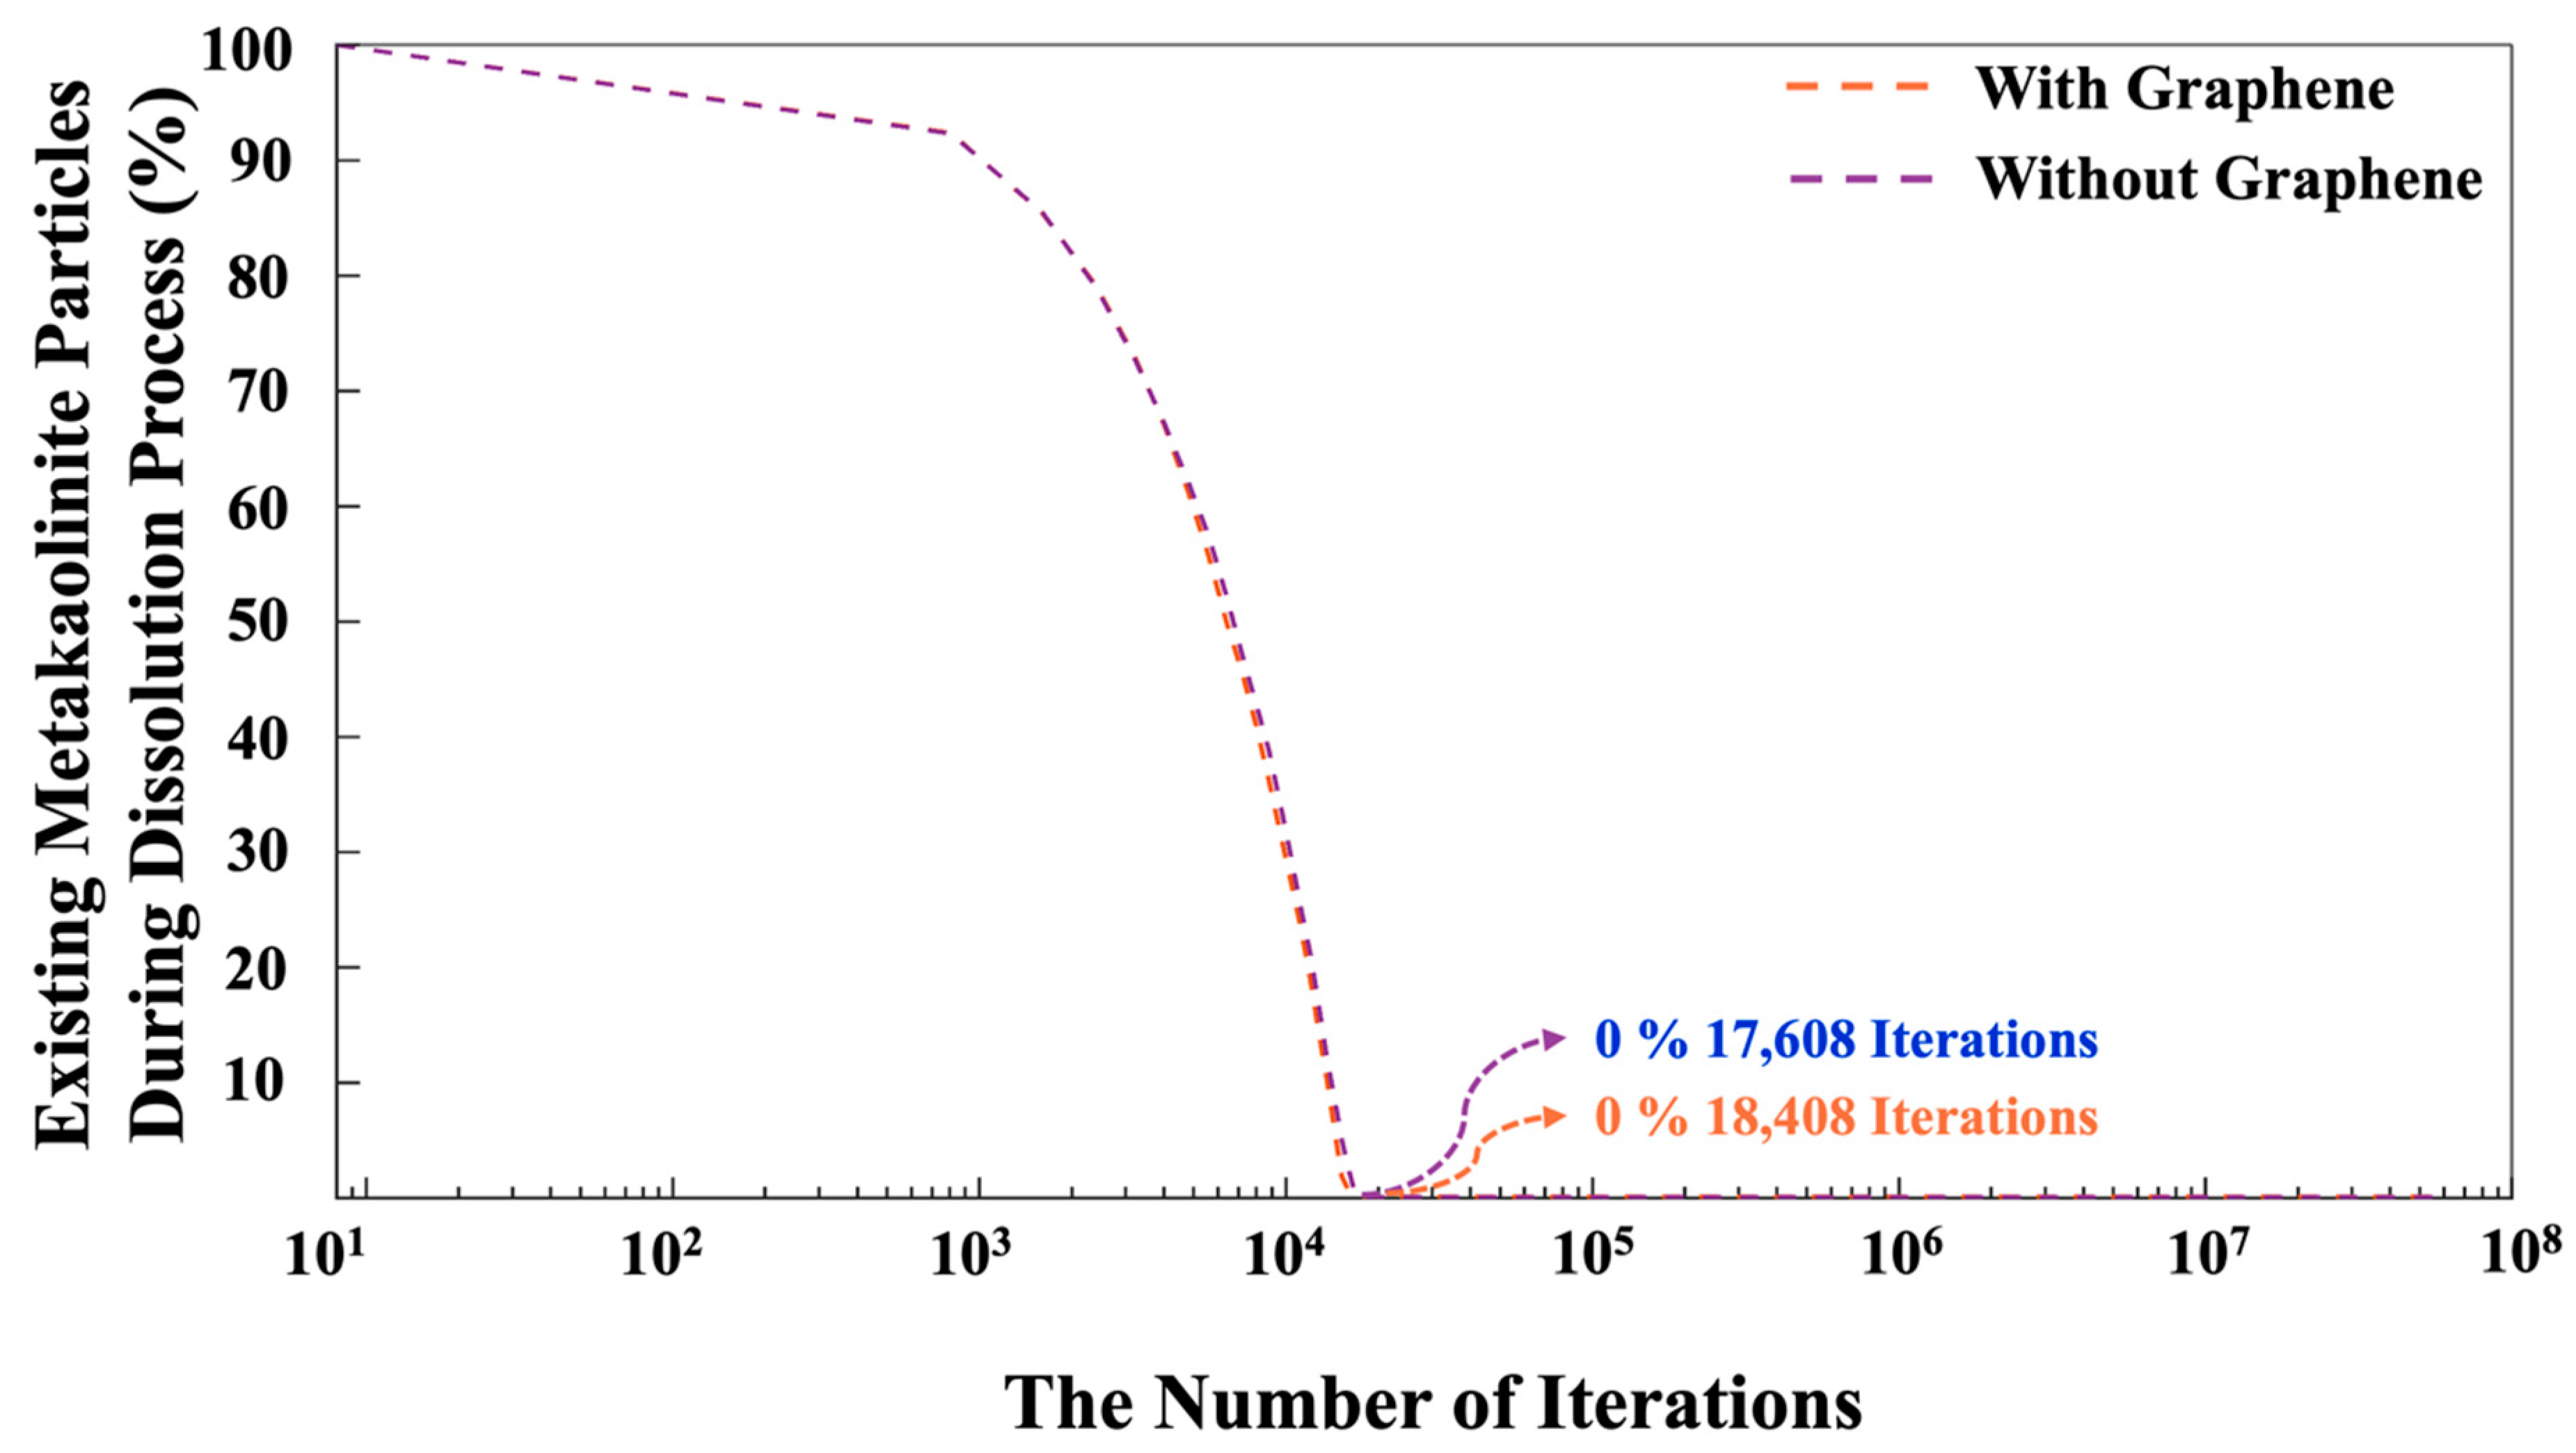
- The complete dissolution of MK required (4.54%) more iterations in the system with graphene than in the system without it, indicating slower geopolymerization due to steric hinderances and the less-favorable heterogenous nucleation.
- -
- After 56 million iterations, the graphene-containing system exhibited a lower cluster formation percentage (57.27%), while the system without graphene showed 59.48% cluster formation.
- -
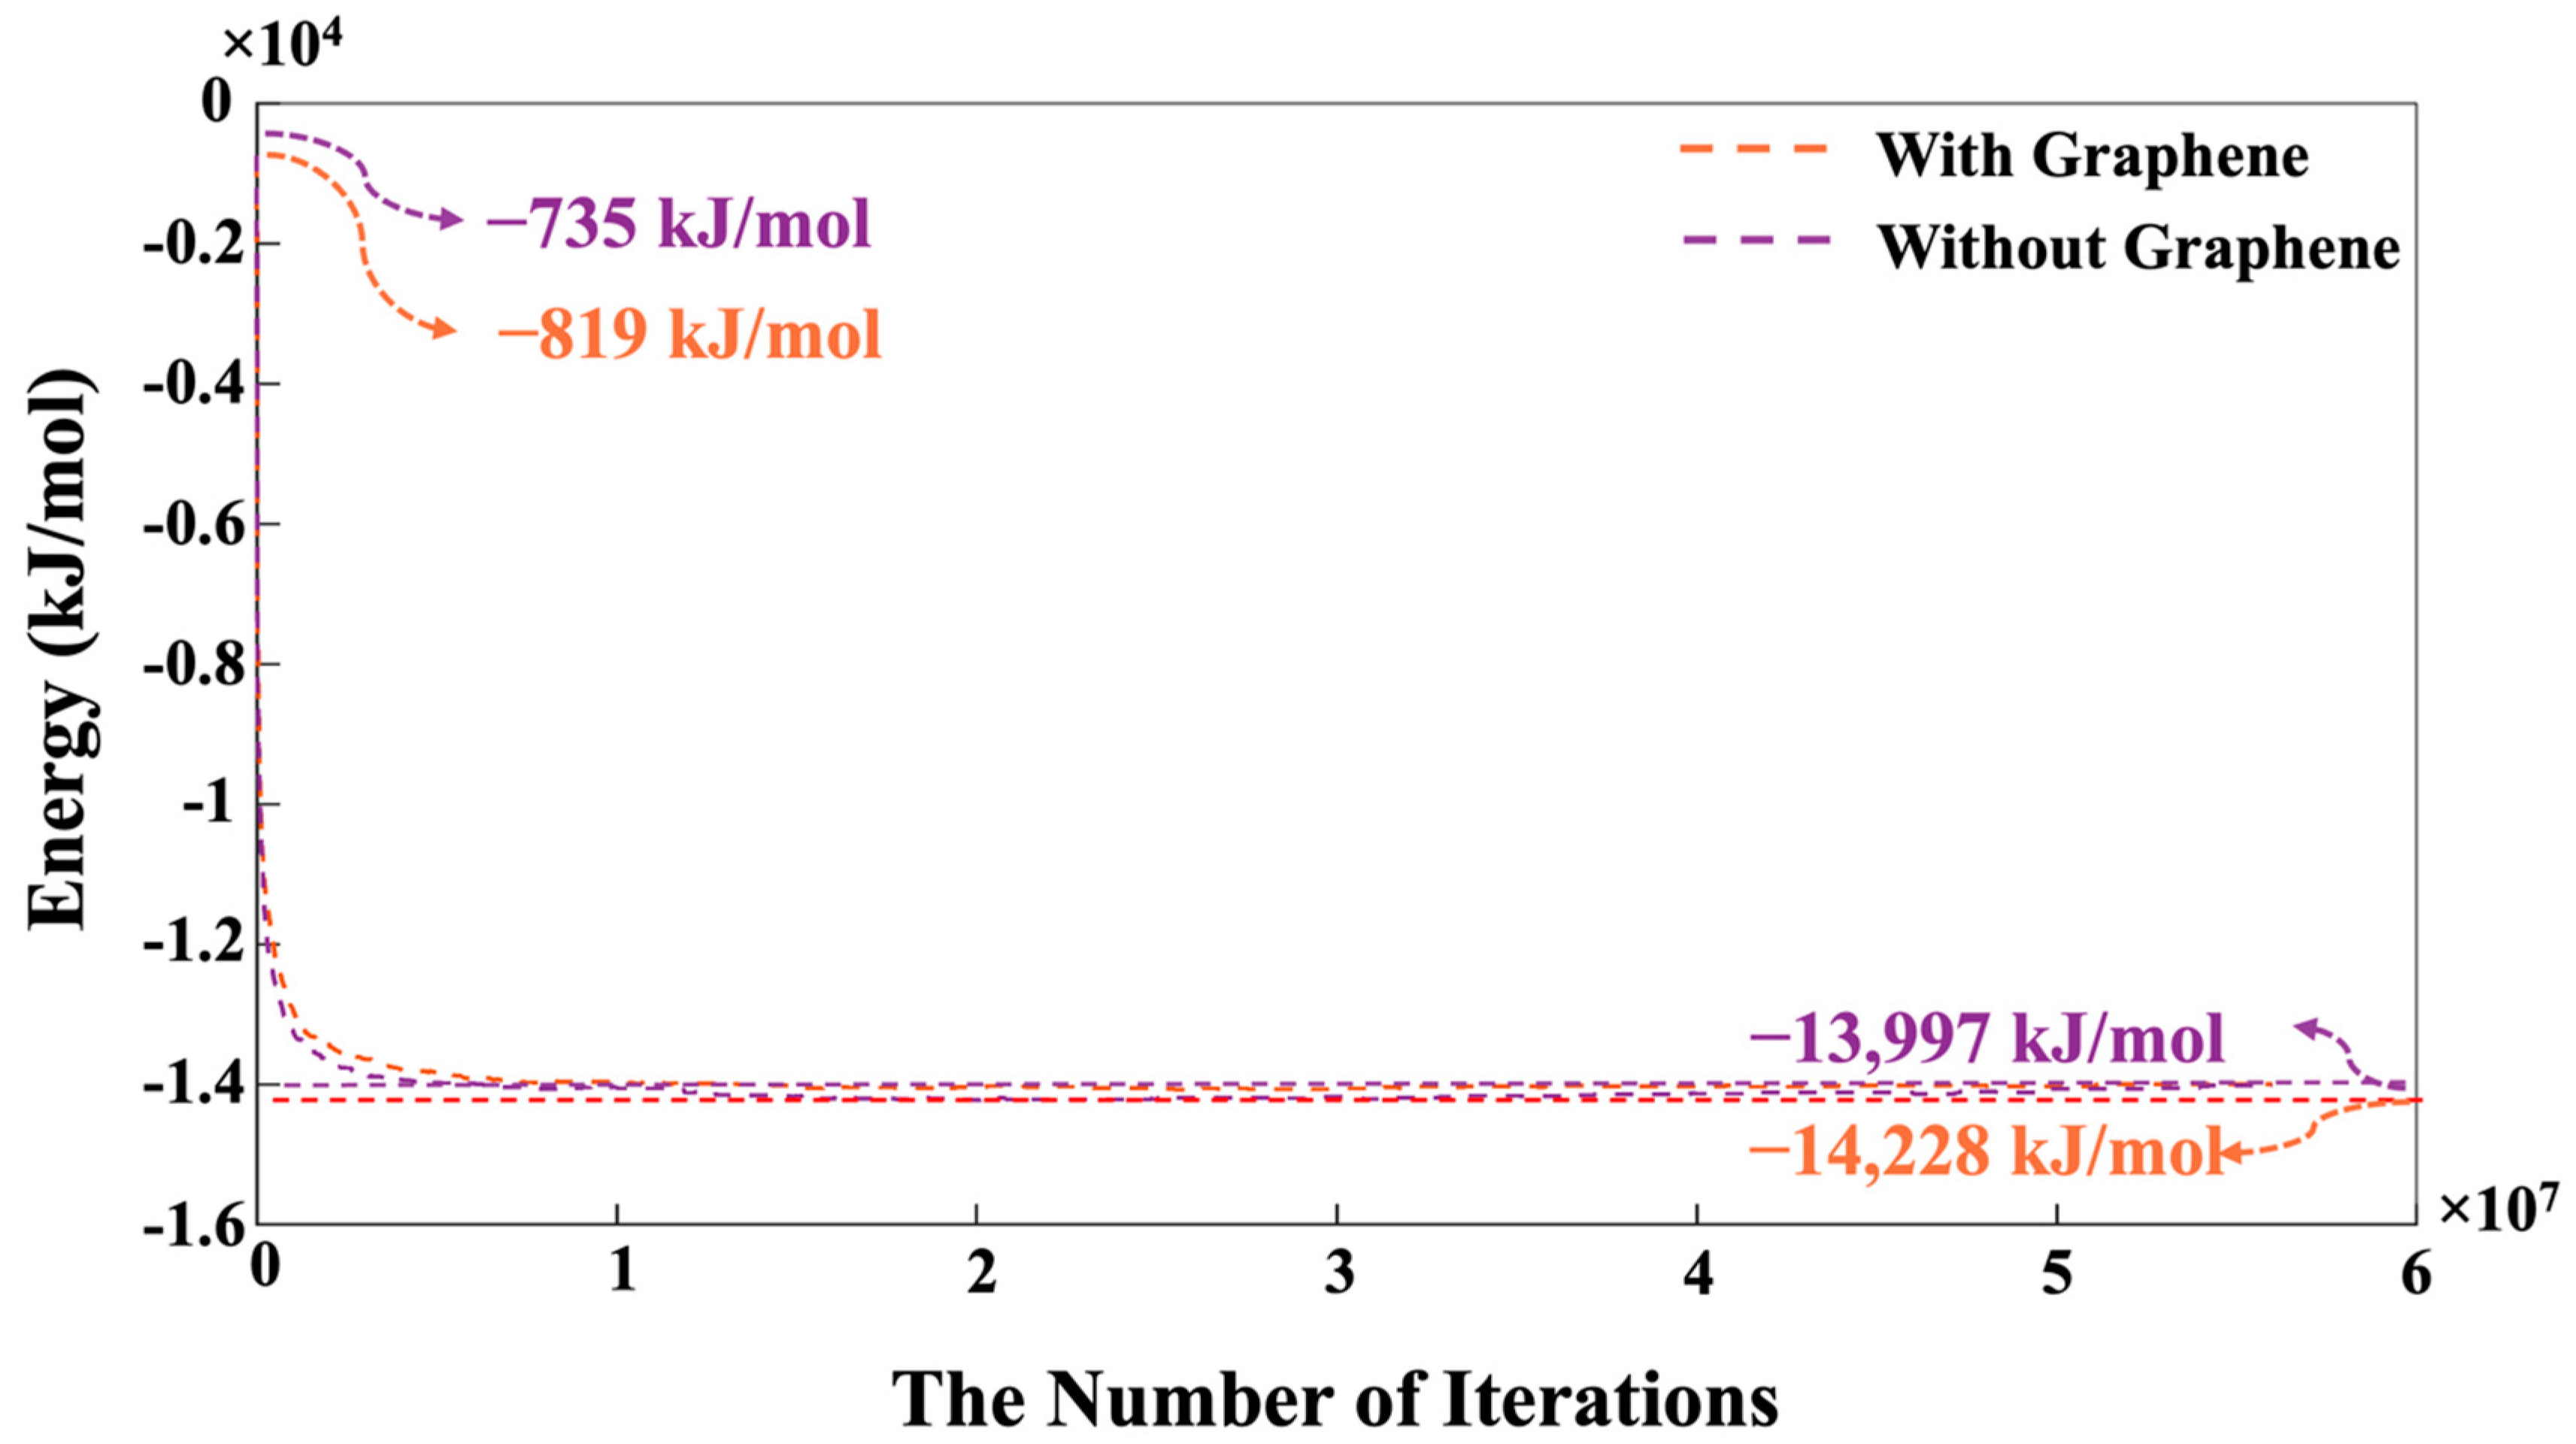
- The system containing graphene exhibited a more favorable (1.65% lower) energy state of −14,228 kJ/mol, compared to −13,997 kJ/mol in the system without graphene. This energy difference is due to the adsorption interactions between graphene and GP species.
- -
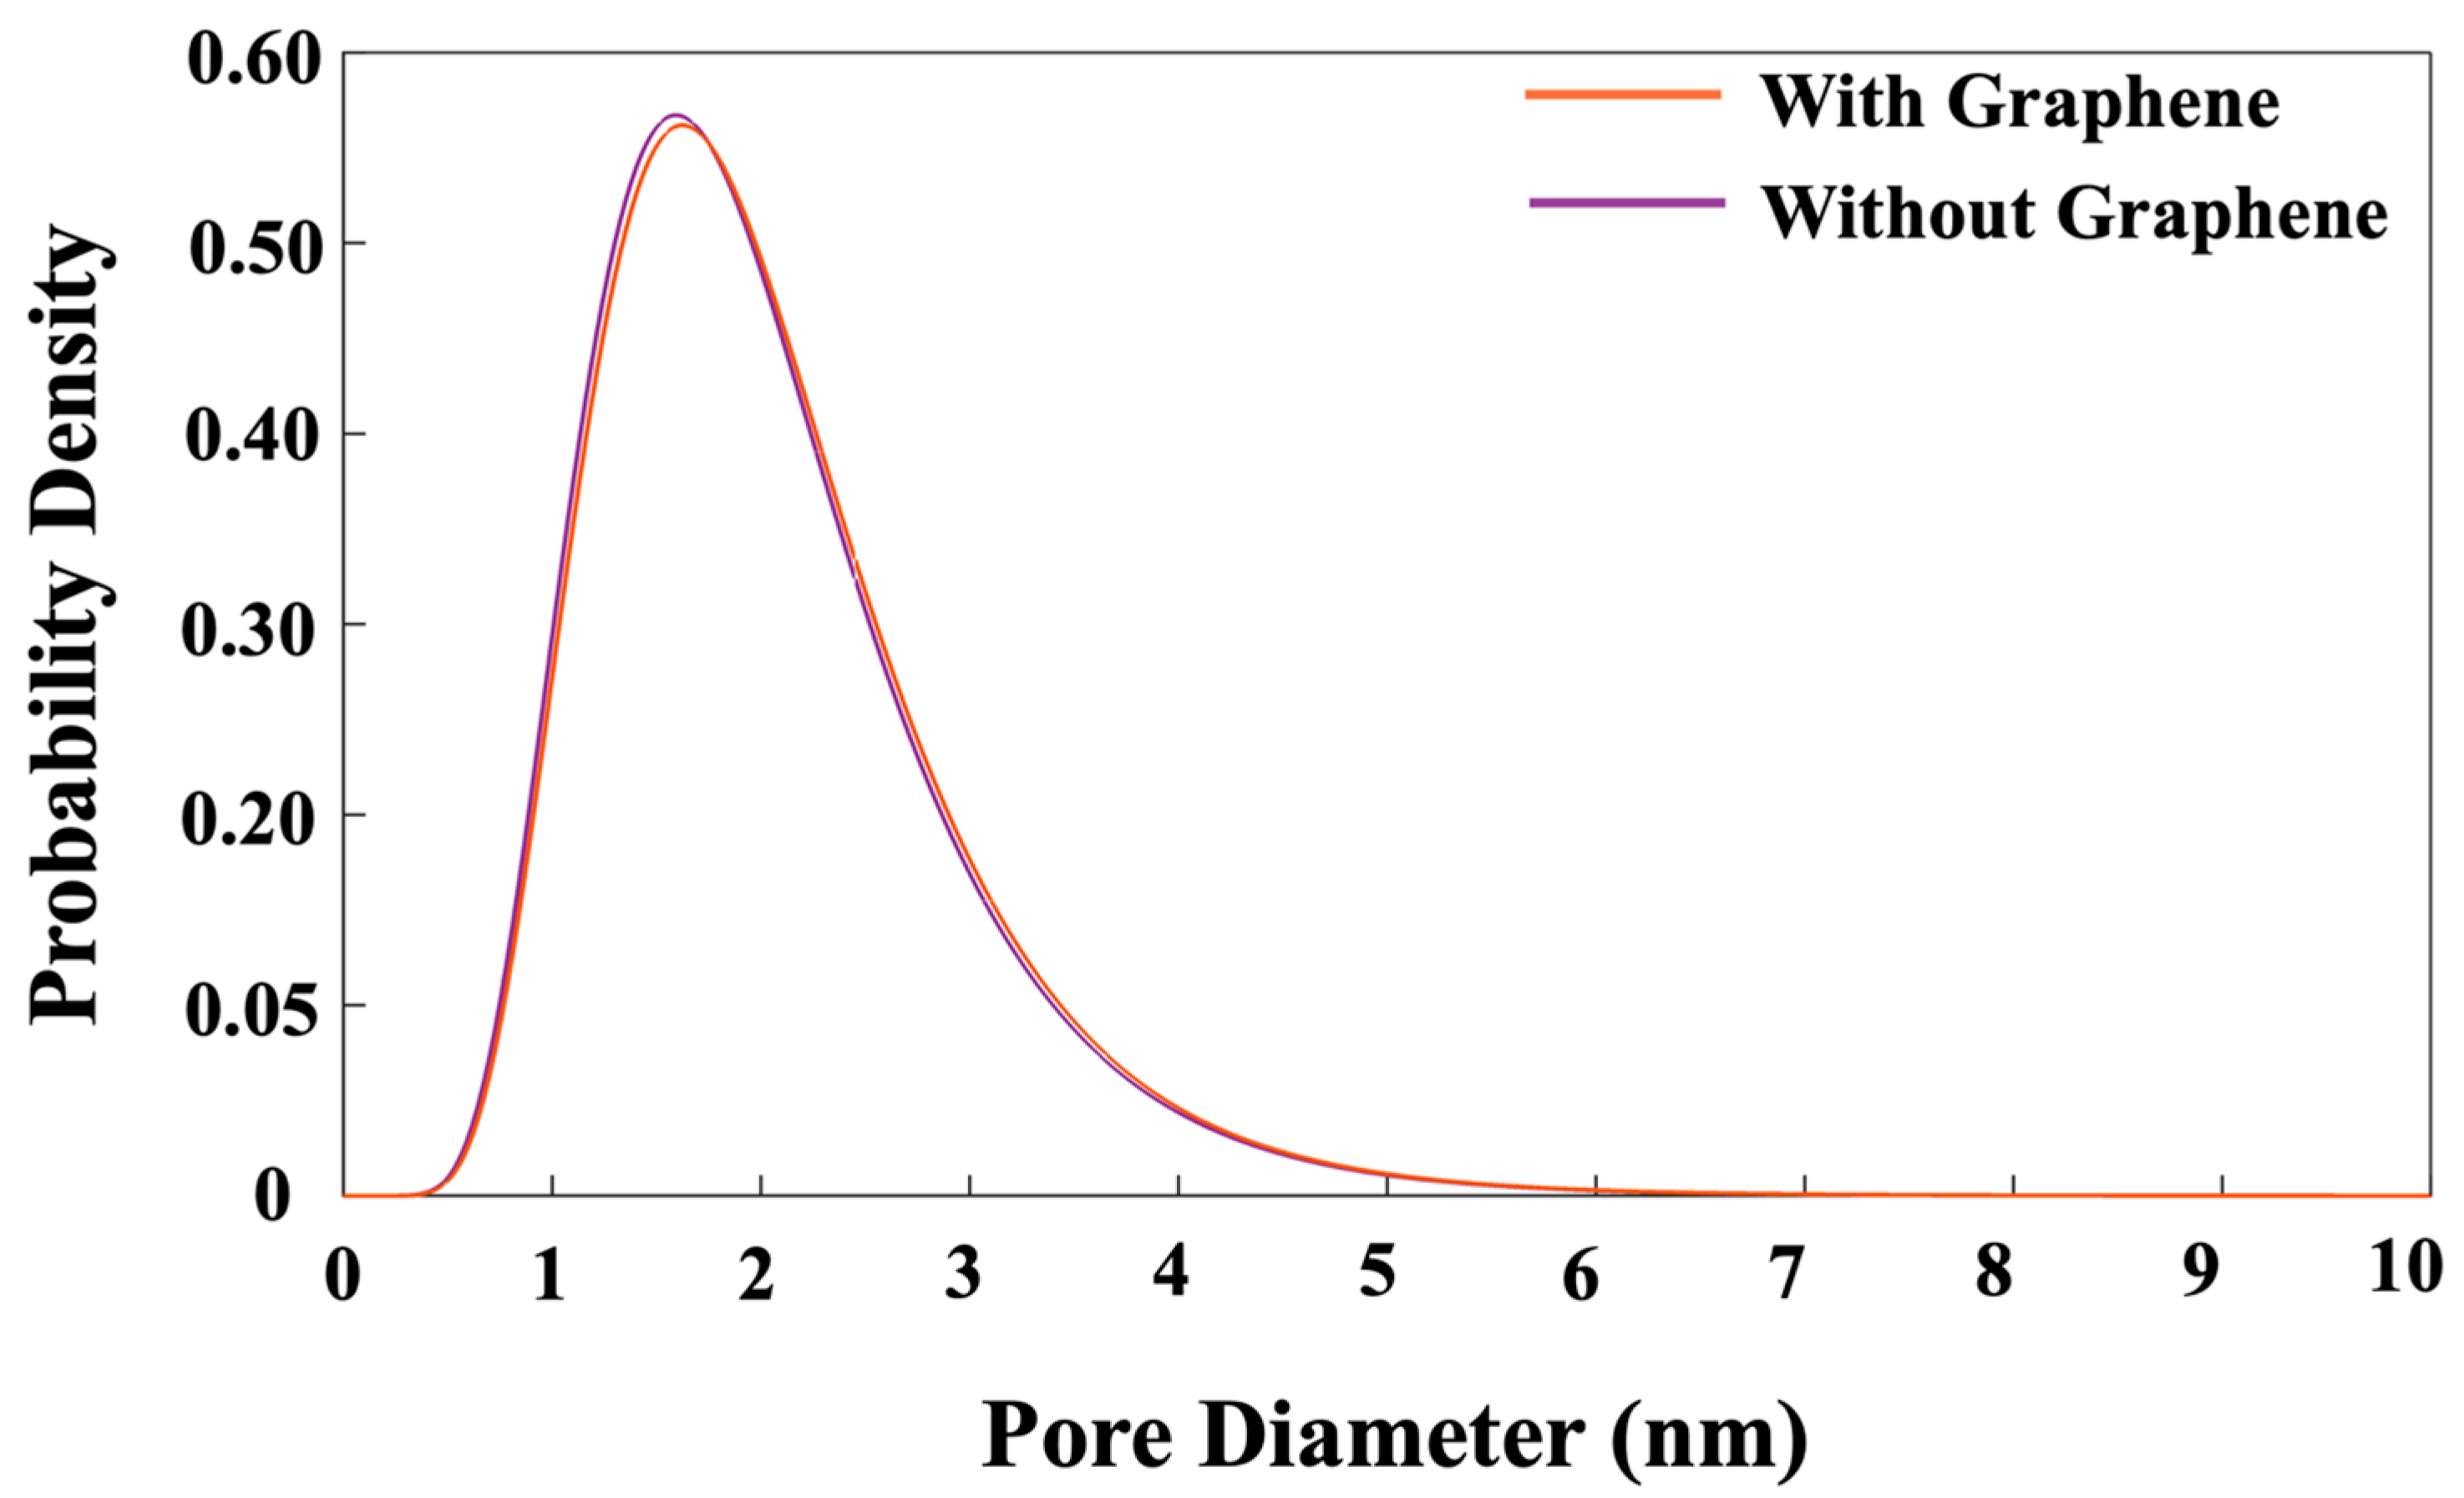
- Regarding pore size distribution, both systems exhibited an identical trend of pore size distribution. Notably, at a high probability density of 56.5%, the pore diameters were 1.62 nm for the system with graphene and 1.57 nm for the system without graphene.
Author Contributions
Funding
Data Availability Statement
Acknowledgments
Conflicts of Interest
References
- Davidovits, J. Geopolymers: Inorganic Polymeric New Materials. J. Therm. Anal. 1991, 37, 1633–1656. [Google Scholar] [CrossRef]
- Chitsaz, S.; Tarighat, A. Molecular Dynamics Simulation of N-A-S-H Geopolymer Macro Molecule Model for Prediction of Its Modulus of Elasticity. Constr. Build. Mater. 2020, 243, 118176. [Google Scholar] [CrossRef]
- Duxson, P.; Fernández-Jiménez, A.; Provis, J.L.; Lukey, G.C.; Palomo, A.; van Deventer, J.S.J. Geopolymer Technology: The Current State of the Art. J. Mater. Sci. 2007, 42, 2917–2933. [Google Scholar] [CrossRef]
- Izadifar, M.; Ukrainczyk, N.; Koenders, E. Silicate Dissolution Mechanism from Metakaolinite Using Density Functional Theory. Nanomaterials 2023, 13, 1196. [Google Scholar] [CrossRef]
- Izadifar, M.; Ukrainczyk, N.; Koenders, E. Atomistic Insights into Silicate Dissolution of Metakaolinite Under Alkaline Conditions: Ab Initio Quantum Mechanical Investigation. Langmuir 2024, 40, 19332–19342. [Google Scholar] [CrossRef]
- Buchwald, A.; Zellmann, H.-D.; Kaps, C. Condensation of Aluminosilicate Gels—Model System for Geopolymer Binders. J. Non-Cryst. Solids 2011, 357, 1376–1382. [Google Scholar] [CrossRef]
- Zhao, J.; Tong, L.; Li, B.; Chen, T.; Wang, C.; Yang, G.; Zheng, Y. Eco-Friendly Geopolymer Materials: A Review of Performance Improvement, Potential Application and Sustainability Assessment. J. Clean. Prod. 2021, 307, 127085. [Google Scholar] [CrossRef]
- Shobeiri, V.; Bennett, B.; Xie, T.; Visintin, P. A Comprehensive Assessment of the Global Warming Potential of Geopolymer Concrete. J. Clean. Prod. 2021, 297, 126669. [Google Scholar] [CrossRef]
- Tailby, J.; MacKenzie, K.J.D. Structure and Mechanical Properties of Aluminosilicate Geopolymer Composites with Portland Cement and Its Constituent Minerals. Cem. Concr. Res. 2010, 40, 787–794. [Google Scholar] [CrossRef]
- White, C.E.; Provis, J.L.; Proffen, T.; van Deventer, J.S.J. Molecular Mechanisms Responsible for the Structural Changes Occurring during Geopolymerization: Multiscale Simulation. AIChE J. 2012, 58, 2241–2253. [Google Scholar] [CrossRef]
- Izadifar, M.; Thissen, P.; Steudel, A.; Kleeberg, R.; Kaufhold, S.; Kaltenbach, J.; Schuhmann, R.; Dehn, F.; Emmerich, K. Comprehensive examination of dehydroxylation of kaolinite, disordered kaolinite, and dickite: Experimental studies and density functional theory. Clays Clay Miner. 2020, 68, 319–333. [Google Scholar] [CrossRef]
- Bakharev, T. Resistance of Geopolymer Materials to Acid Attack. Cem. Concr. Res. 2005, 35, 658–670. [Google Scholar] [CrossRef]
- Ukrainczyk, N.; Muthu, M.; Vogt, O.; Koenders, E. Geopolymer, Calcium Aluminate, and Portland Cement-Based Mortars: Comparing Degradation Using Acetic Acid. Materials 2019, 12, 3115. [Google Scholar] [CrossRef] [PubMed]
- Koenig, A.; Herrmann, A.; Overmann, S.; Dehn, F. Resistance of Alkali-Activated Binders to Organic Acid Attack: Assessment of Evaluation Criteria and Damage Mechanisms. Constr. Build. Mater. 2017, 151, 405–413. [Google Scholar] [CrossRef]
- Amran, M.; Huang, S.-S.; Debbarma, S.; Rashid, R.S.M. Fire Resistance of Geopolymer Concrete: A Critical Review. Constr. Build. Mater. 2022, 324, 126722. [Google Scholar] [CrossRef]
- Sadat, M.R.; Muralidharan, K.; Frantziskonis, G.N.; Zhang, L. From Atomic-Scale to Mesoscale: A Characterization of Geopolymer Composites Using Molecular Dynamics and Peridynamics Simulations. Comput. Mater. Sci. 2021, 186, 110038. [Google Scholar] [CrossRef]
- Henon, J.; Pennec, F.; Alzina, A.; Absi, J.; Smith, D.S.; Rossignol, S. Analytical and Numerical Identification of the Skeleton Thermal Conductivity of a Geopolymer Foam Using a Multi-Scale Analysis. Comput. Mater. Sci. 2014, 82, 264–273. [Google Scholar] [CrossRef]
- Lolli, F.; Manzano, H.; Provis, J.L.; Bignozzi, M.C.; Masoero, E. Atomistic Simulations of Geopolymer Models: The Impact of Disorder on Structure and Mechanics. ACS Appl. Mater. Interfaces 2018, 10, 22809–22820. [Google Scholar] [CrossRef] [PubMed]
- Izadifar, M.; Valencia, N.C.; Xiao, P.; Ukrainczyk, N.; Koenders, E. 3D Off-Lattice Coarse-Grained Monte Carlo Simulations for Nucleation of Alkaline Aluminosilicate Gels. Materials 2023, 16, 1863. [Google Scholar] [CrossRef] [PubMed]
- Chatterjee, A.; Vlachos, D.G.; Katsoulakis, M.A. Spatially Adaptive Lattice Coarse-Grained Monte Carlo Simulations for Diffusion of Interacting Molecules. J. Chem. Phys. 2004, 121, 11420–11431. [Google Scholar] [CrossRef] [PubMed]
- White, C.E.; Provis, J.L.; Kearley, G.J.; Riley, D.P.; Van Deventer, J.S.J. Density Functional Modelling of Silicate and Aluminosilicate Dimerisation Solution Chemistry. Dalton Trans. 2011, 40, 1348–1355. [Google Scholar] [CrossRef] [PubMed]
- Valencia, N.C.; Izadifar, M.; Ukrainczyk, N.; Koenders, E. Coarse-Grained Monte Carlo Simulations with Octree Cells for Geopolymer Nucleation at Different pH Values. Materials 2023, 17, 95. [Google Scholar] [CrossRef] [PubMed]
- Prasittisopin, L.; Sereewatthanawut, I. Effects of Seeding Nucleation Agent on Geopolymerization Process of Fly-Ash Geopolymer. Front. Struct. Civ. Eng. 2018, 12, 16–25. [Google Scholar] [CrossRef]
- Yang, K.; White, C.E. Modeling the Formation of Alkali Aluminosilicate Gels at the Mesoscale Using Coarse-Grained Monte Carlo. Langmuir 2016, 32, 11580–11590. [Google Scholar] [CrossRef] [PubMed]
- Izadifar, M.; Dolado, J.S.; Thissen, P.; Ukrainczyk, N.; Koenders, E.; Ayuela, A. Theoretical Elastic Constants of Tobermorite Enhanced with Reduced Graphene Oxide through Hydroxyl vs Epoxy Functionalization: A First-Principles Study. J. Phys. Chem. C 2023, 127, 18117–18126. [Google Scholar] [CrossRef]
- White, C.E.; Provis, J.L.; Proffen, T.; van Deventer, J.S.J. Quantitative Mechanistic Modeling of Silica Solubility and Precipitation during the Initial Period of Zeolite Synthesis. J. Phys. Chem. C 2011, 115, 9879–9888. [Google Scholar] [CrossRef]
- Novoselov, K.S.; Geim, A.K.; Morozov, S.V.; Jiang, D.; Zhang, Y.; Dubonos, S.V.; Grigorieva, I.V.; Firsov, A.A. Electric Field Effect in Atomically Thin Carbon Films. Science 2004, 306, 666–669. [Google Scholar] [CrossRef] [PubMed]
- Geim, A.K.; Novoselov, K.S. The Rise of Graphene. Nat. Mater 2007, 6, 183–191. [Google Scholar] [CrossRef]
- Loh, K.P.; Bao, Q.; Ang, P.K.; Yang, J. The Chemistry of Graphene. J. Mater. Chem. 2010, 20, 2277. [Google Scholar] [CrossRef]
- Liu, B.; Kang, W.; Lian, W.; Xing, F.; Sun, H.; Ma, H. Multi-Scale Modeling of Transport Properties in Cementitious Materials with GO Admixture. Nanomaterials 2025, 15, 222. [Google Scholar] [CrossRef] [PubMed]
- Intarabut, D.; Sukontasukkul, P.; Phoo-ngernkham, T.; Zhang, H.; Yoo, D.-Y.; Limkatanyu, S.; Chindaprasirt, P. Influence of Graphene Oxide Nanoparticles on Bond-Slip Reponses between Fiber and Geopolymer Mortar. Nanomaterials 2022, 12, 943. [Google Scholar] [CrossRef]
- Long, W.-J.; Ye, T.-H.; Luo, Q.-L.; Wang, Y.; Mei, L. Reinforcing Mechanism of Reduced Graphene Oxide on Flexural Strength of Geopolymers: A Synergetic Analysis of Hydration and Chemical Composition. Nanomaterials 2019, 9, 1723. [Google Scholar] [CrossRef] [PubMed]
- Balandin, A.A.; Ghosh, S.; Bao, W.; Calizo, I.; Teweldebrhan, D.; Miao, F.; Lau, C.N. Superior Thermal Conductivity of Single-Layer Graphene. Nano Lett. 2008, 8, 902–907. [Google Scholar] [CrossRef] [PubMed]
- Mortazavi, B. Ultra High Stiffness and Thermal Conductivity of Graphene like C3N. Carbon 2017, 118, 25–34. [Google Scholar] [CrossRef]
- Mortazavi, B.; Pötschke, M.; Cuniberti, G. Multiscale Modeling of Thermal Conductivity of Polycrystalline Graphene Sheets. Nanoscale 2014, 6, 3344–3352. [Google Scholar] [CrossRef]
- Mortazavi, B.; Ahzi, S. Thermal Conductivity and Tensile Response of Defective Graphene: A Molecular Dynamics Study. Carbon 2013, 63, 460–470. [Google Scholar] [CrossRef]
- Di Pierro, A.; Mortazavi, B.; Noori, H.; Rabczuk, T.; Fina, A. A Multiscale Investigation on the Thermal Transport in Polydimethylsiloxane Nanocomposites: Graphene vs. Borophene. Nanomaterials 2021, 11, 1252. [Google Scholar] [CrossRef] [PubMed]
- Lee, C.; Wei, X.; Kysar, J.W.; Hone, J. Measurement of the Elastic Properties and Intrinsic Strength of Monolayer Graphene. Science 2008, 321, 385–388. [Google Scholar] [CrossRef] [PubMed]
- Mortazavi, B.; Cuniberti, G. Atomistic Modeling of Mechanical Properties of Polycrystalline Graphene. Nanotechnology 2014, 25, 215704. [Google Scholar] [CrossRef]
- Williams, J.R.; DiCarlo, L.; Marcus, C.M. Quantum Hall Effect in a Gate-Controlled p-n Junction of Graphene. Science 2007, 317, 638–641. [Google Scholar] [CrossRef] [PubMed]
- Javvaji, B.; Mortazavi, B.; Rabczuk, T.; Zhuang, X. Exploration of Mechanical, Thermal Conductivity and Electromechanical Properties of Graphene Nanoribbon Springs. Nanoscale Adv. 2020, 2, 3394–3403. [Google Scholar] [CrossRef] [PubMed]
- Krishna, R.S.; Mishra, J.; Nanda, B.; Patro, S.K.; Adetayo, A.; Qureshi, T.S. The Role of Graphene and Its Derivatives in Modifying Different Phases of Geopolymer Composites: A Review. Constr. Build. Mater. 2021, 306, 124774. [Google Scholar] [CrossRef]
- Gao, X.; Li, W.; Wang, P.; Lu, Y.; Zhou, J.; Wang, X.Q. Advancing Energy Solutions: Carbon-Based Cementitious Composites in Energy Storage and Harvesting. J. Build. Eng. 2024, 91, 109720. [Google Scholar] [CrossRef]
- Zhang, Y.J.; He, P.Y.; Yang, M.Y.; Kang, L. A New Graphene Bottom Ash Geopolymeric Composite for Photocatalytic H 2 Production and Degradation of Dyeing Wastewater. Int. J. Hydrog. Energy 2017, 42, 20589–20598. [Google Scholar] [CrossRef]
- Zhong, J.; Zhou, G.-X.; He, P.-G.; Yang, Z.-H.; Jia, D.-C. 3D Printing Strong and Conductive Geo-Polymer Nanocomposite Structures Modified by Graphene Oxide. Carbon 2017, 117, 421–426. [Google Scholar] [CrossRef]
- Izadifar, M.; Sekkal, W.; Dubyey, L.; Ukrainczyk, N.; Zaoui, A.; Koenders, E. Theoretical Studies of Adsorption Reactions of Aluminosilicate Aqueous Species on Graphene-Based Nanomaterials: Implications for Geopolymer Binders. ACS Appl. Nano Mater. 2023, 6, 16318–16331. [Google Scholar] [CrossRef]
- Šefčík, J.; McCormick, A.V. Thermochemistry of Aqueous Silicate Solution Precursors to Ceramics. AIChE J. 1997, 43, 2773–2784. [Google Scholar] [CrossRef]
- Izadifar, M.; Ukrainczyk, N.; Salah Uddin, K.M.; Middendorf, B.; Koenders, E. Dissolution of β-C2S Cement Clinker: Part 2 Atomistic Kinetic Monte Carlo (KMC) Upscaling Approach. Materials 2022, 15, 6716. [Google Scholar] [CrossRef] [PubMed]
- Izadifar, M.; Ukrainczyk, N.; Salah Uddin, K.; Middendorf, B.; Koenders, E. Dissolution of Portlandite in Pure Water: Part 2 Atomistic Kinetic Monte Carlo (KMC) Approach. Materials 2022, 15, 1442. [Google Scholar] [CrossRef] [PubMed]
- Jorge, M.; Auerbach, S.M.; Monson, P.A. Modeling Spontaneous Formation of Precursor Nanoparticles in Clear-Solution Zeolite Synthesis. J. Am. Chem. Soc. 2005, 127, 14388–14400. [Google Scholar] [CrossRef]
- Kohn, W.; Sham, L.J. Self-Consistent Equations Including Exchange and Correlation Effects. Phys. Rev. 1965, 140, A1133–A1138. [Google Scholar] [CrossRef]
- Kresse, G.; Hafner, J. Ab Initio Molecular Dynamics for Liquid Metals. Phys. Rev. B 1993, 47, 558–561. [Google Scholar] [CrossRef] [PubMed]
- Kresse, G.; Furthmüller, J. Efficiency of Ab-Initio Total Energy Calculations for Metals and Semiconductors Using a Plane-Wave Basis Set. Comput. Mater. Sci. 1996, 6, 15–50. [Google Scholar] [CrossRef]
- Kresse, G.; Furthmüller, J. Efficient Iterative Schemes for Ab Initio Total-Energy Calculations Using a Plane-Wave Basis Set. Phys. Rev. B 1996, 54, 11169–11186. [Google Scholar] [CrossRef]
- Hafner, J. Ab-initio Simulations of Materials Using VASP: Density-functional Theory and Beyond. J. Comput. Chem. 2008, 29, 2044–2078. [Google Scholar] [CrossRef] [PubMed]
- Sun, G.; Kürti, J.; Rajczy, P.; Kertesz, M.; Hafner, J.; Kresse, G. Performance of the Vienna Ab Initio Simulation Package (VASP) in Chemical Applications. J. Mol. Struct. THEOCHEM 2003, 624, 37–45. [Google Scholar] [CrossRef]
- Kresse, G.; Joubert, D. From Ultrasoft Pseudopotentials to the Projector Augmented-Wave Method. Phys. Rev. B 1999, 59, 1758–1775. [Google Scholar] [CrossRef]
- Perdew, J.P.; Burke, K.; Ernzerhof, M. Generalized Gradient Approximation Made Simple. Phys. Rev. Lett. 1996, 77, 3865–3868. [Google Scholar] [CrossRef] [PubMed]
- Monkhorst, H.J.; Pack, J.D. Special Points for Brillouin-Zone Integrations. Phys. Rev. B 1976, 13, 5188–5192. [Google Scholar] [CrossRef]
- Momma, K.; Izumi, F. It VESTA: A Three-Dimensional Visualization System for Electronic and Structural Analysis. J. Appl. Crystallogr. 2008, 41, 653–658. [Google Scholar] [CrossRef]

Disclaimer/Publisher’s Note: The statements, opinions and data contained in all publications are solely those of the individual author(s) and contributor(s) and not of MDPI and/or the editor(s). MDPI and/or the editor(s) disclaim responsibility for any injury to people or property resulting from any ideas, methods, instructions or products referred to in the content. |
© 2025 by the authors. Licensee MDPI, Basel, Switzerland. This article is an open access article distributed under the terms and conditions of the Creative Commons Attribution (CC BY) license (https://creativecommons.org/licenses/by/4.0/).
Share and Cite
Izadifar, M.; Ukrainczyk, N.; Koenders, E. Coarse-Grained Monte Carlo Simulations of Graphene-Enhanced Geopolymer Nanocomposite Nucleation. Nanomaterials 2025, 15, 289. https://doi.org/10.3390/nano15040289
Izadifar M, Ukrainczyk N, Koenders E. Coarse-Grained Monte Carlo Simulations of Graphene-Enhanced Geopolymer Nanocomposite Nucleation. Nanomaterials. 2025; 15(4):289. https://doi.org/10.3390/nano15040289
Chicago/Turabian StyleIzadifar, Mohammadreza, Neven Ukrainczyk, and Eduardus Koenders. 2025. "Coarse-Grained Monte Carlo Simulations of Graphene-Enhanced Geopolymer Nanocomposite Nucleation" Nanomaterials 15, no. 4: 289. https://doi.org/10.3390/nano15040289
APA StyleIzadifar, M., Ukrainczyk, N., & Koenders, E. (2025). Coarse-Grained Monte Carlo Simulations of Graphene-Enhanced Geopolymer Nanocomposite Nucleation. Nanomaterials, 15(4), 289. https://doi.org/10.3390/nano15040289