Abstract
In this study, TiO2-P25 films on FTO substrates were synthesized using the sol-gel process and studied using Variable Angle Spectroscopy Ellipsometry (VASE) to determine their optical constants and thickness. The measurements were carried out at room temperature in the wavelength range of (300–900) nm at incident angles varying from 55° to 70°. The resulting thicknesses were found to be around 1000 nm. A graded layer model, which allowed for accurate representation of the depth-dependent optical variations, was employed to model the properties of these TiO2-P25 films. This modeling approach provided deeper insights into the internal structure of the films, particularly how the graded structural characteristics impact the overall optical behavior. Understanding these depth-dependent variations is essential for optimizing the use of TiO2-P25 films in technologies such as solar cells and optical devices.
1. Introduction
Titanium dioxide (TiO2) [1,2,3,4,5,6] has emerged as a leading semiconductor photocatalyst [7,8,9,10] due to its remarkable properties, including non-toxicity [11], chemical stability [12], high photocatalytic activity [13] and environmental compatibility [14,15]. These features make TiO2 particularly promising for a wide range of applications [16,17,18,19], especially as a film coating on various substrates [20]. TiO2 exists in three polymorphic forms [12]: anatase [21], rutile [22] and brookite [23]. Among these, rutile [24] is the most thermodynamically stable form and is commonly found in nature. Anatase [25], despite its larger bandgap of 3.2 eV [25] compared to rutile, demonstrates superior photocatalytic activity owing to its indirect bandgap, which prolongs the lifetime of photogenerated charge carriers and reduces the recombination rate of electron–hole pairs [26]. Brookite is the least common [27] and is often considered a metastable phase, transitioning between anatase and rutile.
TiO2 is commercially available in many forms, including pure anatase [28] and mixed-phase products like P25 [29], which is a mixture of anatase (80%) and rutile (approximately ≤20%), ideal for photocatalysis. P25 is widely recognized for its favorable electrochemical and photocatalytic properties [30], making it a cost-effective choice for numerous photocatalytic applications.
TiO2-P25 films [31] are highly regarded as surface coatings due to their excellent photocatalytic properties. Synthesis methods such as sol-gel processing [32], electrophoretic deposition [33] and the use of doctor blades [32] were employed to produce TiO2-P25 films with tailored properties suitable for several applications.
Recent research has focused on the use of TiO2-P25 films as photoelectrodes in solar cells [34] and as catalytic surfaces for water purification [32]. These applications have led to renewed interest in studying the optical properties of TiO2-P25 films [35] using ellipsometry. Variable Angle Spectroscopic Ellipsometry (VASE) [36,37,38] is particularly well-suited for the nondestructive characterization of thin films and bulk materials, offering high sensitivity and precision in measuring both optical constants and film thickness [39]. However, most of the existing literature on ellipsometry of TiO2 focuses on thin films, typically less than a few hundred nanometers thick, where the optical characterization is relatively straightforward [35].
Herein, TiO2-P25 films synthesized using the sol-gel process were studied using VASE to determine their optical constants and thickness. The focus of this study is 1000 nm thick TiO2-P25 films, which present unique challenges in characterization due to their substantial thickness and potential inhomogeneities. The novelty of this work lies in addressing these challenges, as VASE measurements are typically more straightforward for thinner films, making this study a significant step forward in understanding and characterizing thicker films with complex structures.
These films likely possess an inhomogeneous structure, where the optical properties vary along with the depth. This inhomogeneity makes techniques like VASE particularly challenging but also valuable for analyzing the film’s properties. The graded layer models [40] used in VASE help to provide a more detailed analysis of such films, accounting for the varying composition throughout the layers.
2. Materials and Methods
The TiO2-P25 samples used in this study were prepared using a sol-gel method [41].
Titanium dioxide (TiO2) nanoparticles (P25) were used to prepare a colloidal suspension (sol) by dispersing 3.2 g of the powder into 15 mL of deionized water. The mixture underwent sonication for approximately 48 h to disrupt nanoparticle aggregates and enhance dispersion. To improve stability and prevent re-aggregation, Triton X-100 (a surfactant) (Sigma Aldrich, St. Louis, MO, USA) and PEG-20000 (polyethylene glycol) (Sigma Aldrich, St. Louis, MO, USA) were added. The PEG-20000 also served to occupy interstitial spaces between the nanoparticles. The sol was sonicated further to achieve optimal uniformity. The resulting sol was deposited onto fluorine-doped tin oxide (FTO)-coated glass slides using spin coating, producing thin and uniform films. The coated substrates were then calcined at 451 °C for a minimum of 30 min to facilitate nanoparticle sintering and the removal of organic components, resulting in a porous and well-adhered TiO2 film. These films demonstrated stability in water, indicating strong adhesion to the FTO substrate. To achieve films with greater thickness, the deposition and sintering steps were repeated multiple times under identical conditions.
VASE was carried out to estimate both the thickness and the optical properties, n (refractive index) and k (extinction coefficient), of the samples. The WVASE32 [40] program was employed to analyze the ellipsometric data. It uses regression analysis and the Mean Squared Error (MSE) method to fit the model to the experimental data and uses the covariance matrix to provide error bars for the measured values. The optical model and parameter values for the films focus on minimizing the MSE [42]. The ellipsometric parameters, ψ and Δ, were measured using a J.A. M2000 F (Woollam Co., Lincoln, NE, USA) rotating compensator ellipsometer. This measurement covered a wavelength range of (300–900) at incident angles varying from 55° to 70° in 5° increments, all conducted at room temperature.
MSE [40] is defined by the following:
where is the number of data points, is the number of fitting parameters, ( and ( are the measured and modeled ellipsometric angles, respectively, and and are the standard deviations of the measured ellipsometric angles. The modeled ellipsometric angles ( are functions of the all fit parameters that define the multilayer optical models.
Figure 1 shows the data analysis process.
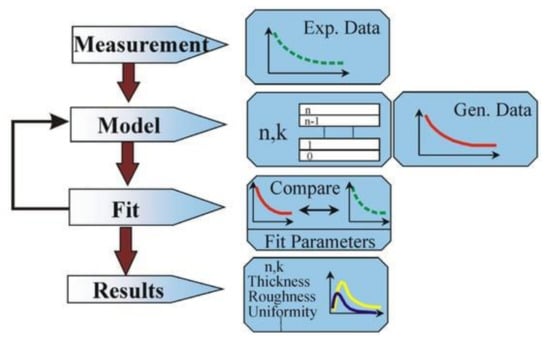
Figure 1.
A scheme of the ellipsometry data analysis [40].
The process begins with the execution of measurements. The model is then used to calculate the predicted determinations from Fresnel’s equations, which describe each material’s thickness and optical constants. In cases where these values are unknown, an estimate is used for preliminary calculations. The generated values (red lines in Figure 1) are then compared to the experimental data (green lines) using MSE as a figure of merit to measure the fit quality. At the end of the process, we observe the resulting optical constants n and k, depicted in Figure 1 in blue and yellow lines. Further details on VASE theory and data analysis can be found in the Supplementary Materials.
3. Results and Discussion
According to the literature, FTO substrate is typically modeled as a multilayer structure. Typically, this structure is made up of approximately 340 nm of SnO2-F, followed by 25 nm of SiO2 and an additional 30 nm of SnO2, all supported by a 2 mm glass substrate [43]. Herein, a five-layer model was employed, which included a roughness layer, a bulk SnO2-F layer, a SiO2 layer, a transparent SnO2 layer and the glass substrate. The roughness layer was modeled as a combination of SnO2-F and voids (43%) using the Bruggeman effective medium approximation (EMA) [44], while the SnO2-F layer was described using the Lorentz oscillator model [44]. The optical constants for the glass substrate, SnO2, SiO2 and SnO2-F were obtained from the WVASE32 database. The model provides excellent data fittings with an MSE ~ 14. Figure 2a,b present both the simulated and measured data for the ψ and Δ spectra across different incident angles within the wavelength range of 300 to 900 nm for FTO substrate.
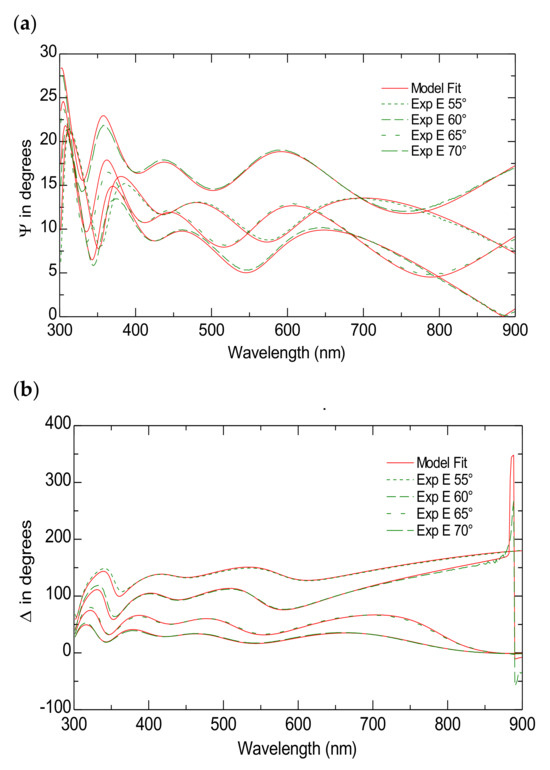
Figure 2.
The Variable Angle Spectroscopic Ellipsometry measurements of the FTO substrate. The experimental and model-generated ψ (a) and Δ (b) data fit at different angles of incidence.
Table 1 presents the scheme of the optical model, while Figure 3 displays the estimated dispersion laws of the FTO substrate.

Table 1.
A model of the FTO substrate.
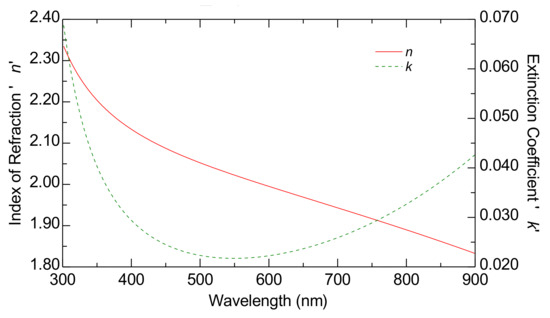
Figure 3.
The dispersion laws of the FTO substrate estimated using ellipsometry characterization. The curves represent the index of refraction (red curve) and the extinction coefficient (green curve).
In the initial attempts to model TiO2-P25 films, it became evident that the films are nonhomogeneous, as their composition and optical properties vary with depth. As a result, single-layer models are inadequate for accurately representing these films. Therefore, it is necessary to employ models and methods capable of addressing this inhomogeneity. One effective approach is to use a graded layer model, which simulates a layer with depth-dependent inhomogeneity [40]. Two methods are commonly used to model nonhomogeneous layers. The first is the “Simple Graded Layer” method, where the layer is divided into several sub-layers (typically 5 to 15), each differing slightly from the previous one. In this model, the optical constants at the top of the film are a fraction of those at the bottom, with the variation progressing consistently between sub-layers. This change does not necessarily follow a linear pattern, but it remains regular throughout the structure. The second method, known as the “Function-Based Graded Layer,” is more complex. In this approach, the parameters within each sub-layer can vary independently, without requiring the same fractional change across all layers, allowing for more flexibility in the model. The “Function-Based Graded Layer” method was employed in this work. In contrast to the “Simple Graded Layer” method, which allows the optical constants at the top of the film to be slightly offset from those at the bottom while maintaining a similar overall profile, the “Function-Based Graded Layer” method permits variations in both the optical constants and the shape throughout the film. This approach provides greater flexibility, allowing for a more accurate representation of the film [40]. The optical properties of the TiO2-P25 films were initially investigated with General Oscillator (Gen OSC) [40], to fit the experimental data and extract the optical constants. The Gen OSC model was selected for its ability to represent the dielectric function as a sum of various oscillators, each corresponding to different physical processes.
The fitting process began with the selection of four Gaussian oscillators [40]. An iterative fitting approach was employed to refine the model parameters, minimizing the difference between the measured ellipsometric data and the values predicted by the model. This process involved adjusting the oscillator parameters until a satisfactory fit was achieved, as indicated by a low MSE.
The function-based graded layer model in WVASE32 was utilized to account for potential inhomogeneity within the material’s thickness [40]. Unlike the simple graded layer model [40], which only allows for a slight offset in the optical constants between the top and bottom of the film while maintaining a similar overall shape, the function-based graded layer model [40] permits variations in the shape of the optical constants profile throughout the depth of the film.
Figure 4a,b present both the simulated and measured data for the ψ and Δ spectra across various incident angles in the wavelength range of (300–900) nm for the TiO2-P25 films on FTO substrates. Table 2 presents the scheme of the model used to fit the experimental data presented in Figure 3. The model achieves data fittings with an MSE of approximately 13.
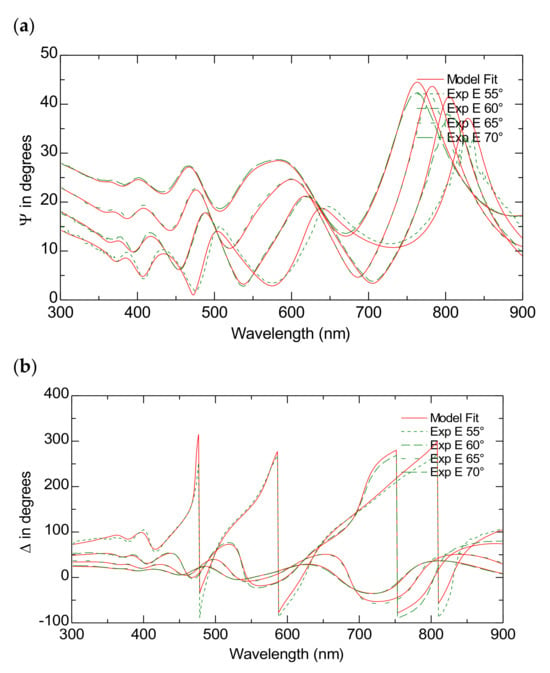
Figure 4.
The Variable Angle Spectroscopic Ellipsometry measurements of the TiO2-P25 on FTO. The experimental and model-generated ψ (a) and Δ (b) data fit at different angles of incidence.

Table 2.
The Model of the TiO2-P25 films on FTO.
Table 2 shows the multilayer structure beginning with a 1 mm thick glass substrate (layer 0). Layers 1 through 4 form the FTO (fluorine-doped tin oxide) layers, as detailed in Table 1. Above these FTO layers, the structure progresses with layers 5 through 6, which include the more complex TiO2-P25 film. Notably, layer 5 is a substantial graded layer, 907.78 nm thick, modeled using a General Oscillator approach. This layer features a gradual change in its properties, such as the refractive index, throughout its thickness, which is crucial for finely tuning the optical response of the film. The topmost layer, layer 6, is 35.84 nm thick and modeled with the Effective Medium Approximation (EMA), incorporating 47.3% voids. This suggests a porous and less dense structure at the surface.
Figure 5 displays the estimated dispersion laws of TiO2-P25 films on an FTO substrate. This image highlights the complex interplay between the absorption and the refractive index within the layers, highlighting the depth-dependent optical properties that could be critical for applications requiring precise optical tuning, such as those involving photonic devices or advanced coatings.
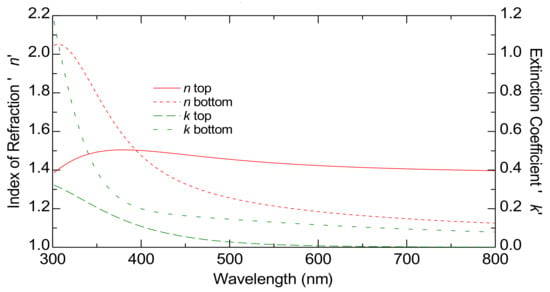
Figure 5.
The graded optical constants at the bottom and top of the TiO2-P25 films on FTO substrate by ellipsometry characterization. The curves represent the index of refraction (red curves) and the extinction coefficient (green curves).
In Figure 5, the solid red line shows n top while the dashed red line represents n bottom. Both refractive index n curves decrease with the increasing wavelength, which is normal for dielectric materials like TiO2. The extinction coefficients k are represented by dashed green lines, with k top as a long-dashed line and k bottom as a short-dashed line.
The higher n top compared to n bottom suggests that the region corresponding to n top has a higher density. This difference might indicate that the top part of the film is less porous or more compact compared to the bottom part. The model used in this study for 1000 nm thick films also works for thicker films, confirming its validity and reliability for greater thicknesses (see Supplementary Materials, Figures S1 and S2). This shows that the model is suitable for characterizing films with significant thickness.
Figure 6a,b show the porous structure of the films at different magnifications. TiO2 particles measure around 30 nm.
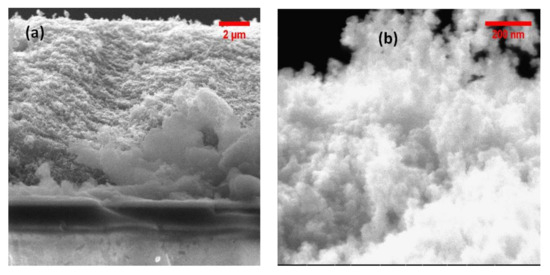
Figure 6.
Scanning electron microscope images of the TiO2-P25 films (a) at lower and higher magnification (b) on FTO substrate.
4. Conclusions
Herein, Variable Angle Spectroscopic Ellipsometry (VASE) was carried out to investigate the optical properties of thick films made of TiO2-P25, a material widely recognized for its photocatalytic effectiveness. The findings reveal that these films possess a highly porous and inhomogeneous structure, with significant variations in optical properties throughout their depth. Standard single-layer models proved inadequate in capturing these complexities, underscoring the necessity of employing a graded layer model for a more accurate representation of the films’ optical behavior. Therefore, a graded layer model was employed, which allowed for more accurate representation of the depth-dependent optical variations. This advanced modeling approach provided deeper insights into the internal structure of the films, particularly how the graded structural characteristics impact the overall optical behavior. The bottom layers of the films typically exhibited a significant increase in both refractive index and extinction coefficient, indicating greater density and higher absorbance compared to the top layers. Understanding these depth-dependent variations is essential for optimizing the use of TiO2-P25 films in technologies such as solar cells and optical devices, where precise control over material properties is critical.
Supplementary Materials
The following supporting information can be downloaded at: https://www.mdpi.com/article/10.3390/nano15020099/s1, Figure S1: Variable Angle Spectroscopic Ellipsometry measurements of 10.000-nm-thick TiO2-P25 films on FTO. Experimental and model generated ψ (a) and Δ (b) data fits at different angles of incidence; Table S1: Model of 10.000-nm-thick TiO2-P25 films on FTO; Figure S2: The optical constants at the bottom and top of the film of 10.000-nm-thick TiO2-P25 films on FTO substrate by ellipsometry characterization. The curves represent the index of refraction (red curves) and the extinction coefficient (green curves); Figure S3: Elemental composition of the films.
Funding
This research received no external funding.
Data Availability Statement
The data are contained inside the manuscript.
Conflicts of Interest
The author declares no conflict of interest.
References
- Gupta, S.M.; Tripathi, M. A review of TiO2 nanoparticles. Chin. Sci. Bull. 2011, 56, 1639–1657. [Google Scholar] [CrossRef]
- Tan, M.-Y.; Chan, K.-Y.; Eldjilali, C.Z.; Abdelhamed, A.H.E.; Soon How Thien, G.; Au, B.W.-C.; Goh, B.T.; Murthy, H.C.A. Rapid post-annealing effect on the TiO2-based electrochromic films. Opt. Mater. 2023, 145, 114455. [Google Scholar] [CrossRef]
- Qahtan, T.F.; Owolabi, T.O.; Saleh, T.A. Synthesis of TiO2 mesoporous film with the effect of 200 eV argon ion beam on its surface chemistry. Opt. Mater. 2023, 142, 114103. [Google Scholar] [CrossRef]
- Larsson, L.F.G.; Tractz, G.T.; Camargo Matheus, A.P.; Pinto Rodrigues, P.R. Influence of impregnation time on TiO2 films sensitized with N719 and 2-Mercaptobenzothiazole: An electrochemical analysis. Opt. Mater. 2024, 150, 115111. [Google Scholar] [CrossRef]
- Prasad, A.; Singh, F.; Dhuliya, V.; Purohit, L.P.; Ramola, R.C. Structural and optical characteristics of Cr-doped TiO2 thin films synthesized by sol-gel method. Opt. Mater. 2024, 151, 115411. [Google Scholar] [CrossRef]
- Komaraiah, D.; Radha, E.; Sivakumar, J.; Ramana Reddy, M.V.; Sayanna, R. Photoluminescence and photocatalytic activity of spin coated Ag+ doped anatase TiO2 thin films. Opt. Mater. 2020, 108, 110401. [Google Scholar] [CrossRef]
- Guo, Q.; Zhou, C.; Ma, Z.; Yang, X. Fundamentals of TiO2 Photocatalysis: Concepts, Mechanisms, and Challenges. Adv. Mater. 2019, 31, 1901997. [Google Scholar] [CrossRef]
- Schneider, J.; Matsuoka, M.; Takeuchi, M.; Zhang, J.; Horiuchi, Y.; Anpo, M.; Bahnemann, D.W. Understanding TiO2 Photocatalysis: Mechanisms and Materials. Chem. Rev. 2014, 114, 9919–9986. [Google Scholar] [CrossRef]
- González-Burciaga, L.A.; Núñez-Núñez, C.M.; Morones-Esquivel, M.M.; Avila-Santos, M.; Lemus-Santana, A.; Proal-Nájera, J.B. Characterization and Comparative Performance of TiO2 Photocatalysts on 6-Mercaptopurine Degradation by Solar Heterogeneous Photocatalysis. Catalysts 2020, 10, 118. [Google Scholar] [CrossRef]
- Dharma, H.N.; Jaafar, J.; Widiastuti, N.; Matsuyama, H.; Rajabsadeh, S.; Othman, M.H.; Rahman, M.A.; Jafri, N.N.; Suhaimin, N.S.; Nasir, A.M.; et al. A Review of Titanium Dioxide (TiO2)-Based Photocatalyst for Oilfield-Produced Water Treatment. Membranes 2022, 12, 345. [Google Scholar] [CrossRef]
- Basante-Romo, M.; Gutiérrez-M, J.O.; Camargo-Amado, R. Non-toxic doses of modified titanium dioxide nanoparticles (m-TiO2NPs) in albino CFW mice. Heliyon 2021, 7, e06514. [Google Scholar] [CrossRef] [PubMed]
- Zhu, T.; Gao, S.-P. The Stability, Electronic Structure, and Optical Property of TiO2 Polymorphs. J. Phys. Chem. C 2014, 118, 11385–11396. [Google Scholar] [CrossRef]
- Scirè, S.; Fiorenza, R.; Bellardita, M.; Palmisano, L. 21—Catalytic applications of TiO2. In Titanium Dioxide (TiO2) and Its Applications; Parrino, F., Palmisano, L., Eds.; Metal Oxides; Elsevier: Amsterdam, The Netherlands, 2021; pp. 637–679. ISBN 978-0-12-819960-2. [Google Scholar]
- Oi, L.E.; Choo, M.-Y.; Lee, H.V.; Ong, H.C.; Hamid, S.B.A.; Juan, J.C. Recent advances of titanium dioxide (TiO2) for green organic synthesis. RSC Adv. 2016, 6, 108741–108754. [Google Scholar] [CrossRef]
- Tsang, C.H.A.; Li, K.; Zeng, Y.; Zhao, W.; Zhang, T.; Zhan, Y.; Xie, R.; Leung, D.Y.C.; Huang, H. Titanium oxide based photocatalytic materials development and their role of in the air pollutants degradation: Overview and forecast. Environ. Int. 2019, 125, 200–228. [Google Scholar] [CrossRef]
- Hu, T.; Feng, P.; Guo, L.; Chu, H.; Liu, F. Construction of Built-In Electric Field in TiO2@Ti2O3 Core-Shell Heterojunctions toward Optimized Photocatalytic Performance. Nanomaterials 2023, 13, 2125. [Google Scholar] [CrossRef]
- Ni, S.; Wu, W.; Yang, Z.; Zhang, M.; Yang, J. Influence of Copper Valence in CuOx/TiO2 Catalysts on the Selectivity of Carbon Dioxide Photocatalytic Reduction Products. Nanomaterials 2024, 14, 1930. [Google Scholar] [CrossRef]
- Li, W.; Zhang, S.; Li, F. Effect of Chemical Polishing on the Formation of TiO2 Nanotube Arrays Using Ti Mesh as a Raw Material. Nanomaterials 2024, 14, 1893. [Google Scholar] [CrossRef]
- Duan, X.; Liu, W.; Guo, J. Microwave-Field-Optimized GO/TiO2 Nanomaterials for Enhanced Interfacial Charge Transfer in Photocatalysis. Nanomaterials 2024, 14, 1912. [Google Scholar] [CrossRef]
- Obregón, S.; Rodríguez-González, V. Photocatalytic TiO2 thin films and coatings prepared by sol–gel processing: A brief review. J. Sol-Gel Sci. Technol. 2022, 102, 125–141. [Google Scholar] [CrossRef]
- Katal, R.; Masudy-Panah, S.; Tanhaei, M.; Farahani, M.H.D.A.; Jiangyong, H. A review on the synthesis of the various types of anatase TiO2 facets and their applications for photocatalysis. Chem. Eng. J. 2020, 384, 123384. [Google Scholar] [CrossRef]
- Padmini, M.; Balaganapathi, T.; Thilakan, P. Mesoporous rutile TiO2: Synthesis, characterization and photocatalytic performance studies. Mater. Res. Bull. 2021, 144, 111480. [Google Scholar] [CrossRef]
- Di Paola, A.; Bellardita, M.; Palmisano, L. Brookite, the Least Known TiO2 Photocatalyst. Catalysts 2013, 3, 36–73. [Google Scholar] [CrossRef]
- Eddy, D.R.; Permana, M.D.; Sakti, L.K.; Sheha, G.A.; Solihudin; Hidayat, S.; Takei, T.; Kumada, N.; Rahayu, I. Heterophase Polymorph of TiO2 (Anatase, Rutile, Brookite, TiO2 (B)) for Efficient Photocatalyst: Fabrication and Activity. Nanomaterials 2023, 13, 704. [Google Scholar] [CrossRef]
- Wen, C.Z.; Jiang, H.B.; Qiao, S.Z.; Yang, H.G.; Lu, G.Q. (Max) Synthesis of high-reactive facets dominated anatase TiO2. J. Mater. Chem. 2011, 21, 7052–7061. [Google Scholar] [CrossRef]
- Fujishima, A.; Rao, T.N.; Tryk, D.A. Titanium dioxide photocatalysis. J. Photochem. Photobiol. C Photochem. Rev. 2000, 1, 1–21. [Google Scholar] [CrossRef]
- Chen, Z.; Xiong, J.; Cheng, G. Recent advances in brookite phase TiO2-based photocatalysts toward CO2 reduction. Fuel 2024, 357, 129806. [Google Scholar] [CrossRef]
- Gutiérrez-López, E.D.; Domínguez, D.; Ortiz-Dominguez, C.; Caudillo-Flores, U.; Guzmán-Cruz, M.A.; Fuentes-Moyado, S.; Morales de la Garza, L.; Díaz de León, J.N. Direct obtaining of pure anatase TiO2 nanostructures, characterization, size-tuning, and applications. Nano-Struct. Nano-Objects 2024, 39, 101215. [Google Scholar] [CrossRef]
- Hurum, D.C.; Agrios, A.G.; Gray, K.A.; Rajh, T.; Thurnauer, M.C. Explaining the Enhanced Photocatalytic Activity of Degussa P25 Mixed-Phase TiO2 Using EPR. J. Phys. Chem. B 2003, 107, 4545–4549. [Google Scholar] [CrossRef]
- Ohno, T.; Sarukawa, K.; Tokieda, K.; Matsumura, M. Morphology of a TiO2 Photocatalyst (Degussa, P25) Consisting of Anatase and Rutile Crystalline Phases. J. Catal. 2001, 203, 82–86. [Google Scholar] [CrossRef]
- Oshani, F.; Marandi, R.; Rasouli, S.; Farhoud, M.K. Photocatalytic investigations of TiO2–P25 nanocomposite thin films prepared by peroxotitanic acid modified sol–gel method. Appl. Surf. Sci. 2014, 311, 308–313. [Google Scholar] [CrossRef]
- Matoh, L.; Žener, B.; Kovačić, M.; Kušić, H.; Arčon, I.; Levstek, M.; Lavrenčič Štangar, U. Photocatalytic sol-gel/P25 TiO2 coatings for water treatment: Degradation of 7 selected pharmaceuticals. Ceram. Int. 2023, 49, 24395–24406. [Google Scholar] [CrossRef]
- Bandy, J.; Zhang, Q.; Garcia, B. Electrophoretic Deposition of Titanium Oxide Nanoparticle Films for Dye-Sensitized Solar Cell Applications. Mater. Sci. Appl. 2011, 2, 1427–1431. [Google Scholar] [CrossRef][Green Version]
- Maratin, V.G.; Harun, A.M.; Rahman, M.Y.A. Dye-sensitized Solar Cell Utilizing Degussa P25 and Anatase TiO2 films: Comparative Study of Photovoltaic Performance: Effect of N719 Dye Concentration. Int. J. Electrochem. Sci. 2020, 15, 1643–1654. [Google Scholar] [CrossRef]
- Gracia, F.; Holgado, J.P.; González-Elipe, A.R. Photoefficiency and Optical, Microstructural, and Structural Properties of TiO2 Thin Films Used as Photoanodes. Langmuir 2004, 20, 1688–1697. [Google Scholar] [CrossRef]
- Woollam, J.A.; Hilfiker, J.N.; Bungay, C.L.; Synowicki, R.A.; Tiwald, T.E.; Thompson, D.W. Spectroscopic ellipsometry from the vacuum ultraviolet to the far infrared. AIP Conf. Proc. 2001, 550, 511–518. [Google Scholar] [CrossRef]
- Politano, G.G. Optical Properties of Graphene Nanoplatelets on Amorphous Germanium Substrates. Molecules 2024, 29, 4089. [Google Scholar] [CrossRef]
- Politano, G.G. Optimizing Graphene Oxide Film Quality: The Role of Solvent and Deposition Technique. C 2024, 10, 90. [Google Scholar] [CrossRef]
- Woollam, J.A.; Snyder, P.G.; Rost, M.C. Variable angle spectroscopic ellipsometry: A non-destructive characterization technique for ultrathin and multilayer materials. Thin Solid Film. 1988, 166, 317–323. [Google Scholar] [CrossRef]
- J.A. Woollam Co. WVASE Manual “Guide to Using WVASE32”; J.A. Woollam Company: Lincoln, NE, USA, 2010. [Google Scholar]
- Danks, A.E.; Hall, S.R.; Schnepp, Z. The evolution of ‘sol–gel’ chemistry as a technique for materials synthesis. Mater. Horiz. 2016, 3, 91–112. [Google Scholar] [CrossRef]
- Moré, J.J. The Levenberg-Marquardt Algorithm: Implementation and Theory BT—Numerical Analysis; Watson, G.A., Ed.; Springer: Berlin/Heidelberg, Germany, 1978; pp. 105–116. [Google Scholar]
- Zhao, M.; Shi, Y.; Dai, J.; Lian, J. Ellipsometric study of the complex optical constants of a CsPbBr3 perovskite thin film. J. Mater. Chem. C 2018, 6, 10450–10455. [Google Scholar] [CrossRef]
- Woollam, J.A.; Johs, B.D.; Herzinger, C.M.; Hilfiker, J.N.; Synowicki, R.A.; Bungay, C.L. Overview of variable-angle spectroscopic ellipsometry (VASE): I. Basic theory and typical applications. Opt. Metrol. Crit. Rev. 1999, 10294, 3–28. [Google Scholar]
Disclaimer/Publisher’s Note: The statements, opinions and data contained in all publications are solely those of the individual author(s) and contributor(s) and not of MDPI and/or the editor(s). MDPI and/or the editor(s) disclaim responsibility for any injury to people or property resulting from any ideas, methods, instructions or products referred to in the content. |
© 2025 by the author. Licensee MDPI, Basel, Switzerland. This article is an open access article distributed under the terms and conditions of the Creative Commons Attribution (CC BY) license (https://creativecommons.org/licenses/by/4.0/).