
Enhancement of Fracture Toughness of NiTi Alloy by Controlling Grain Size Gradient

Abstract
1. Introduction
2. Materials and Methods
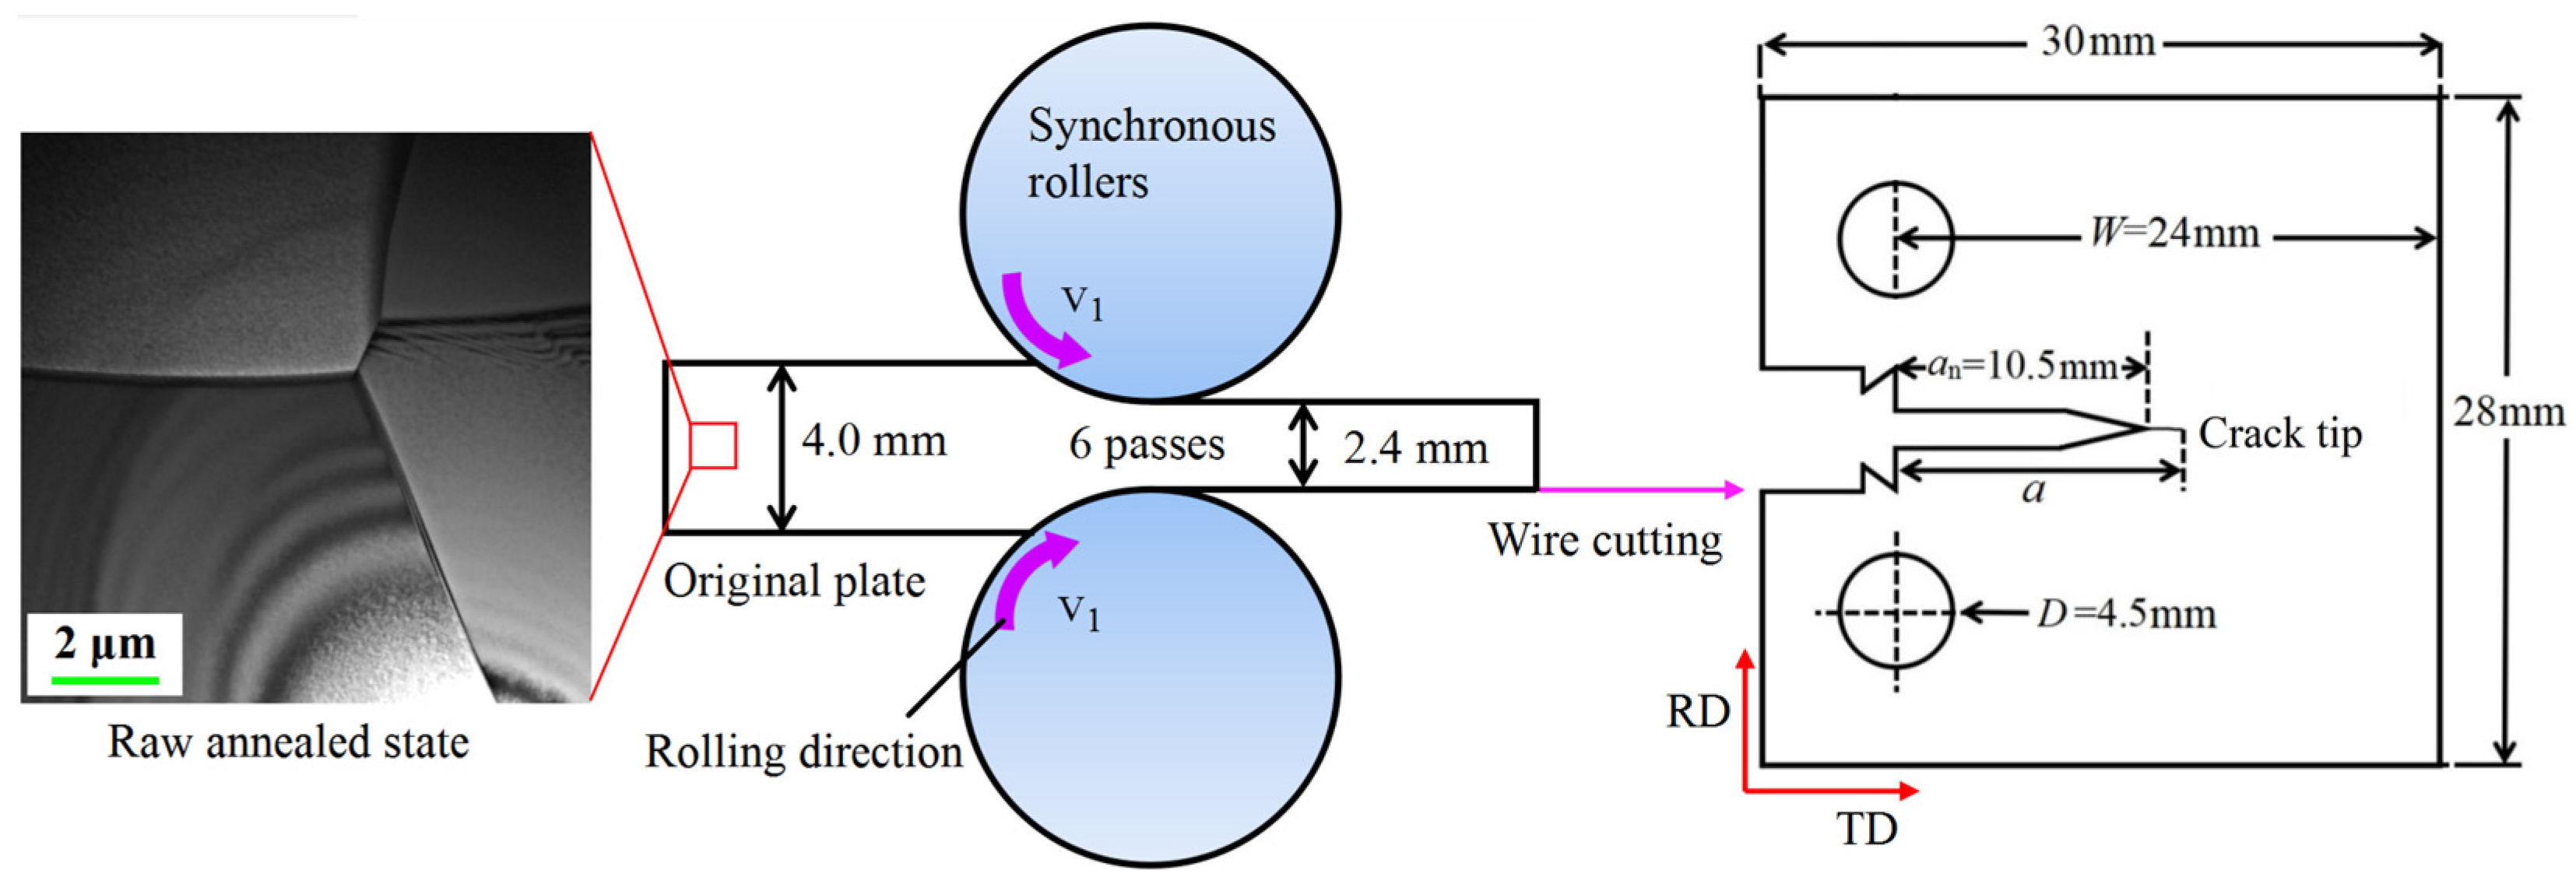
2.1. Material Preparation
- (1)
- Normal GS Distributions
- (2)
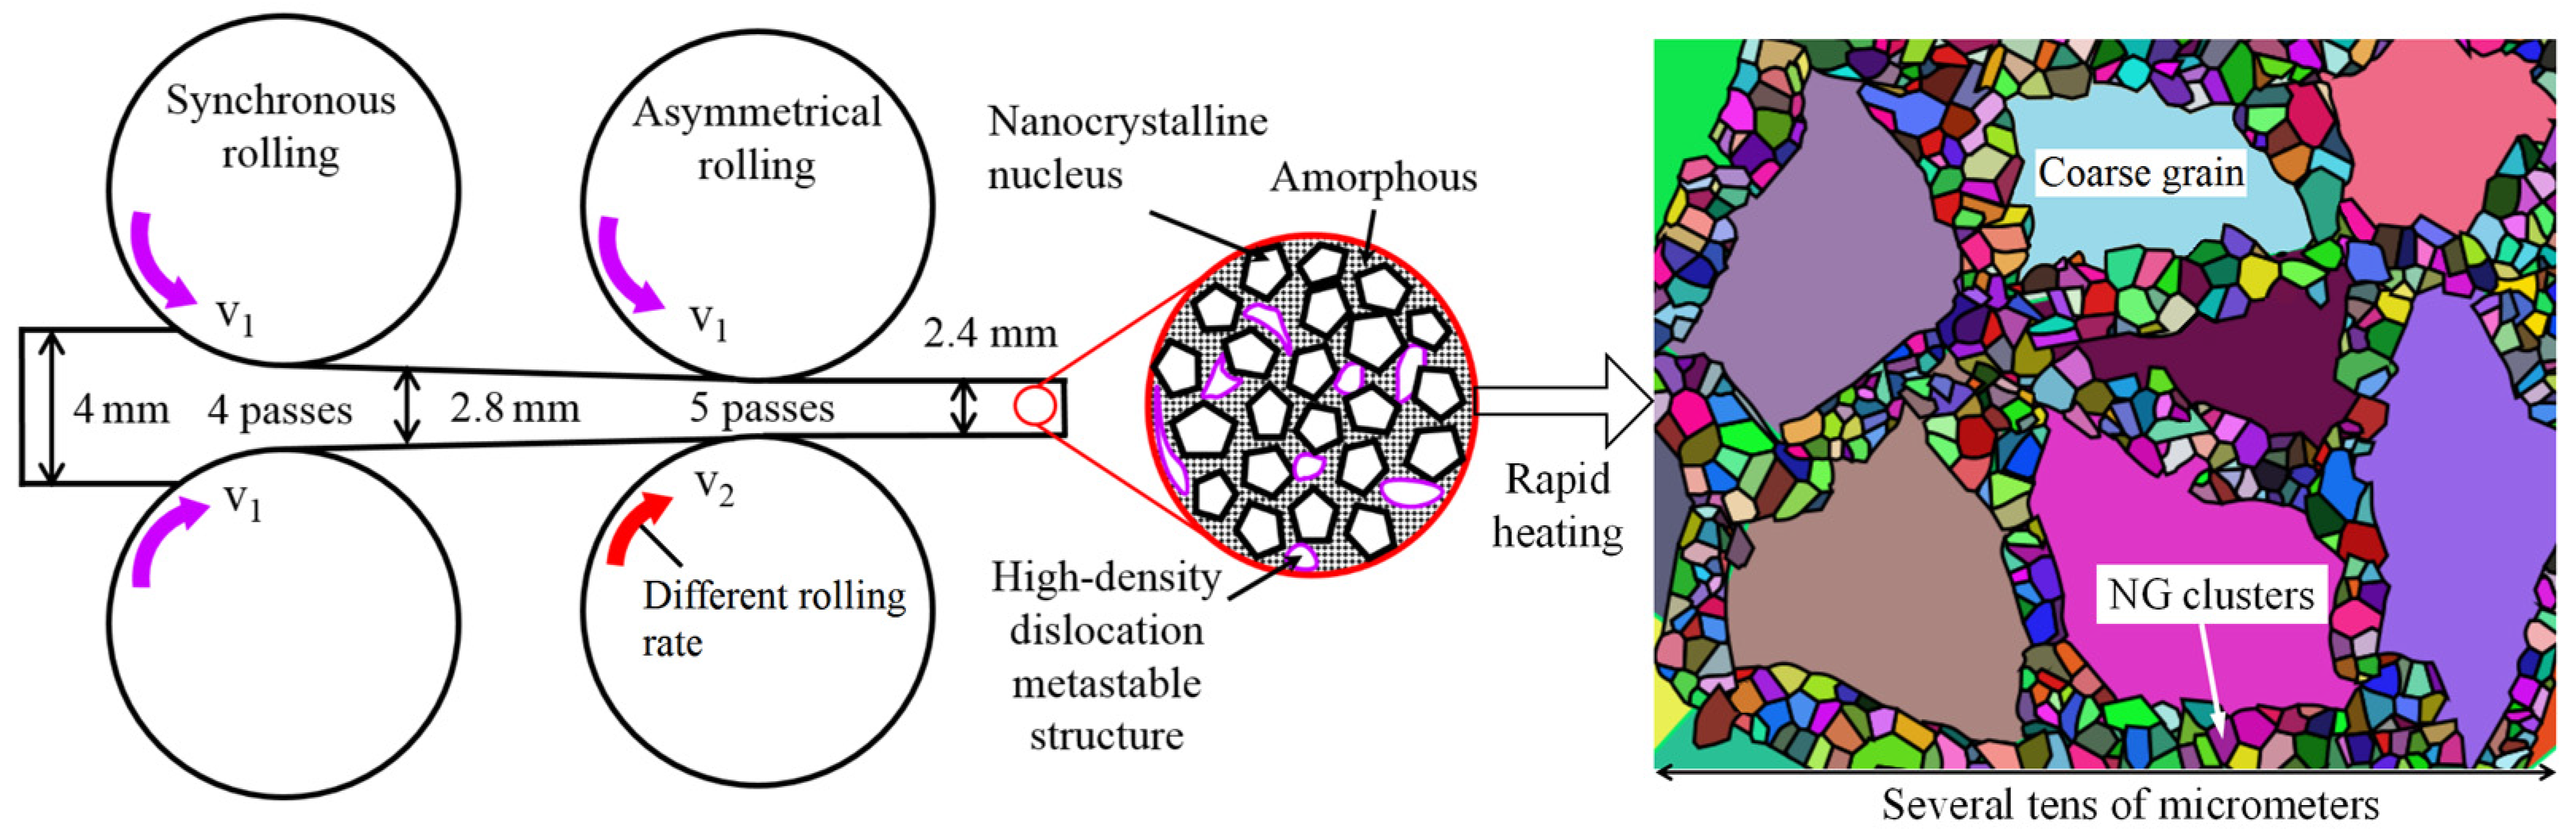
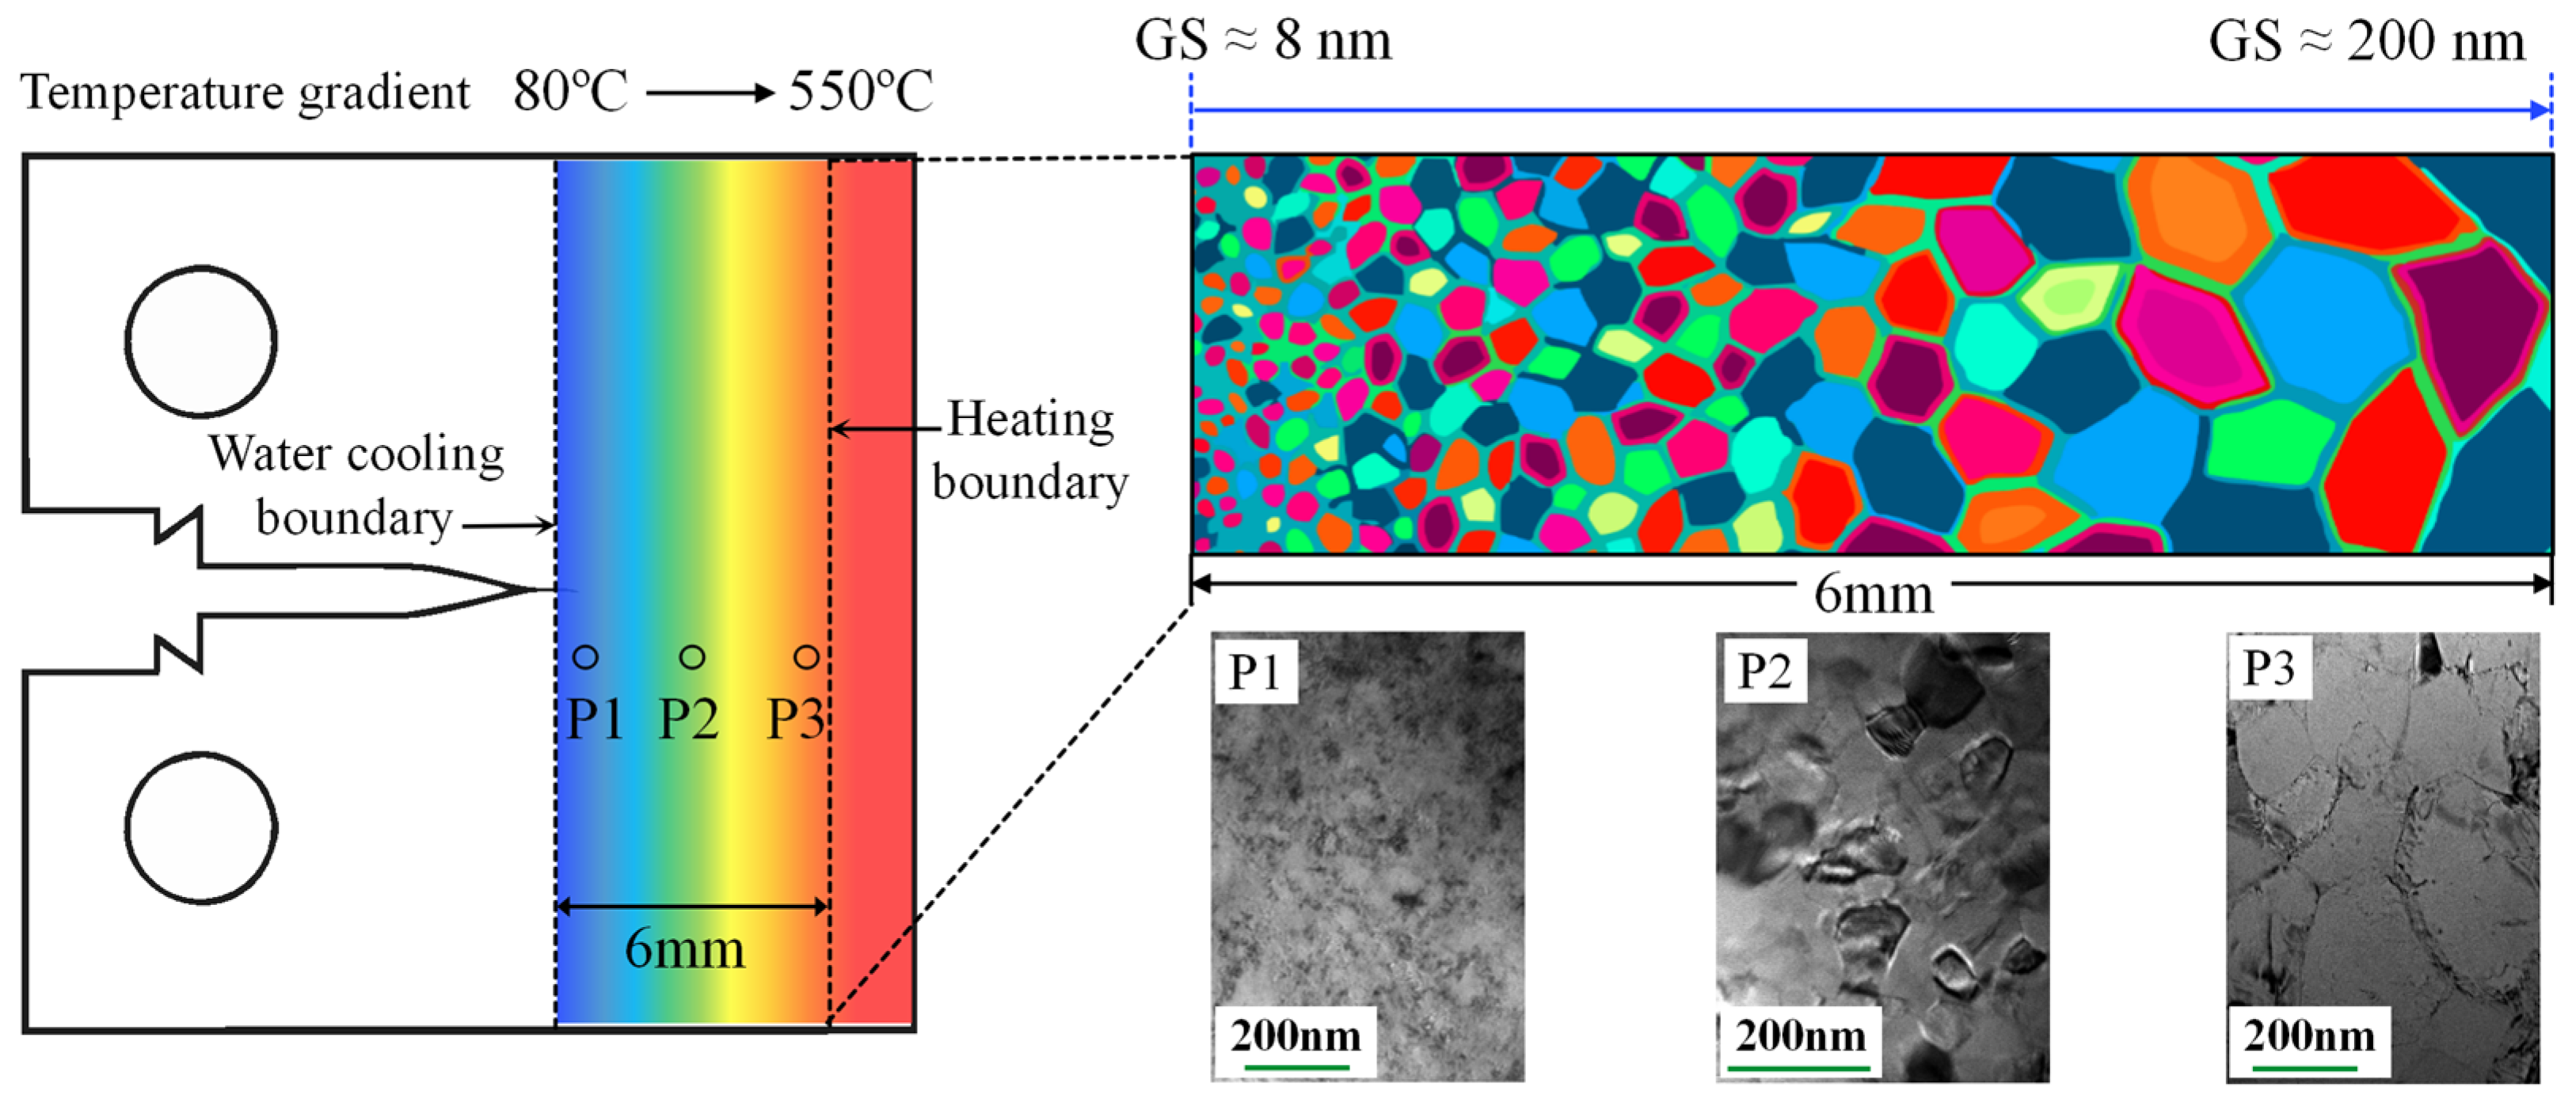
- Macroscopic Unidirectional GS Gradient
- (3)
- Locally High GS Gradient
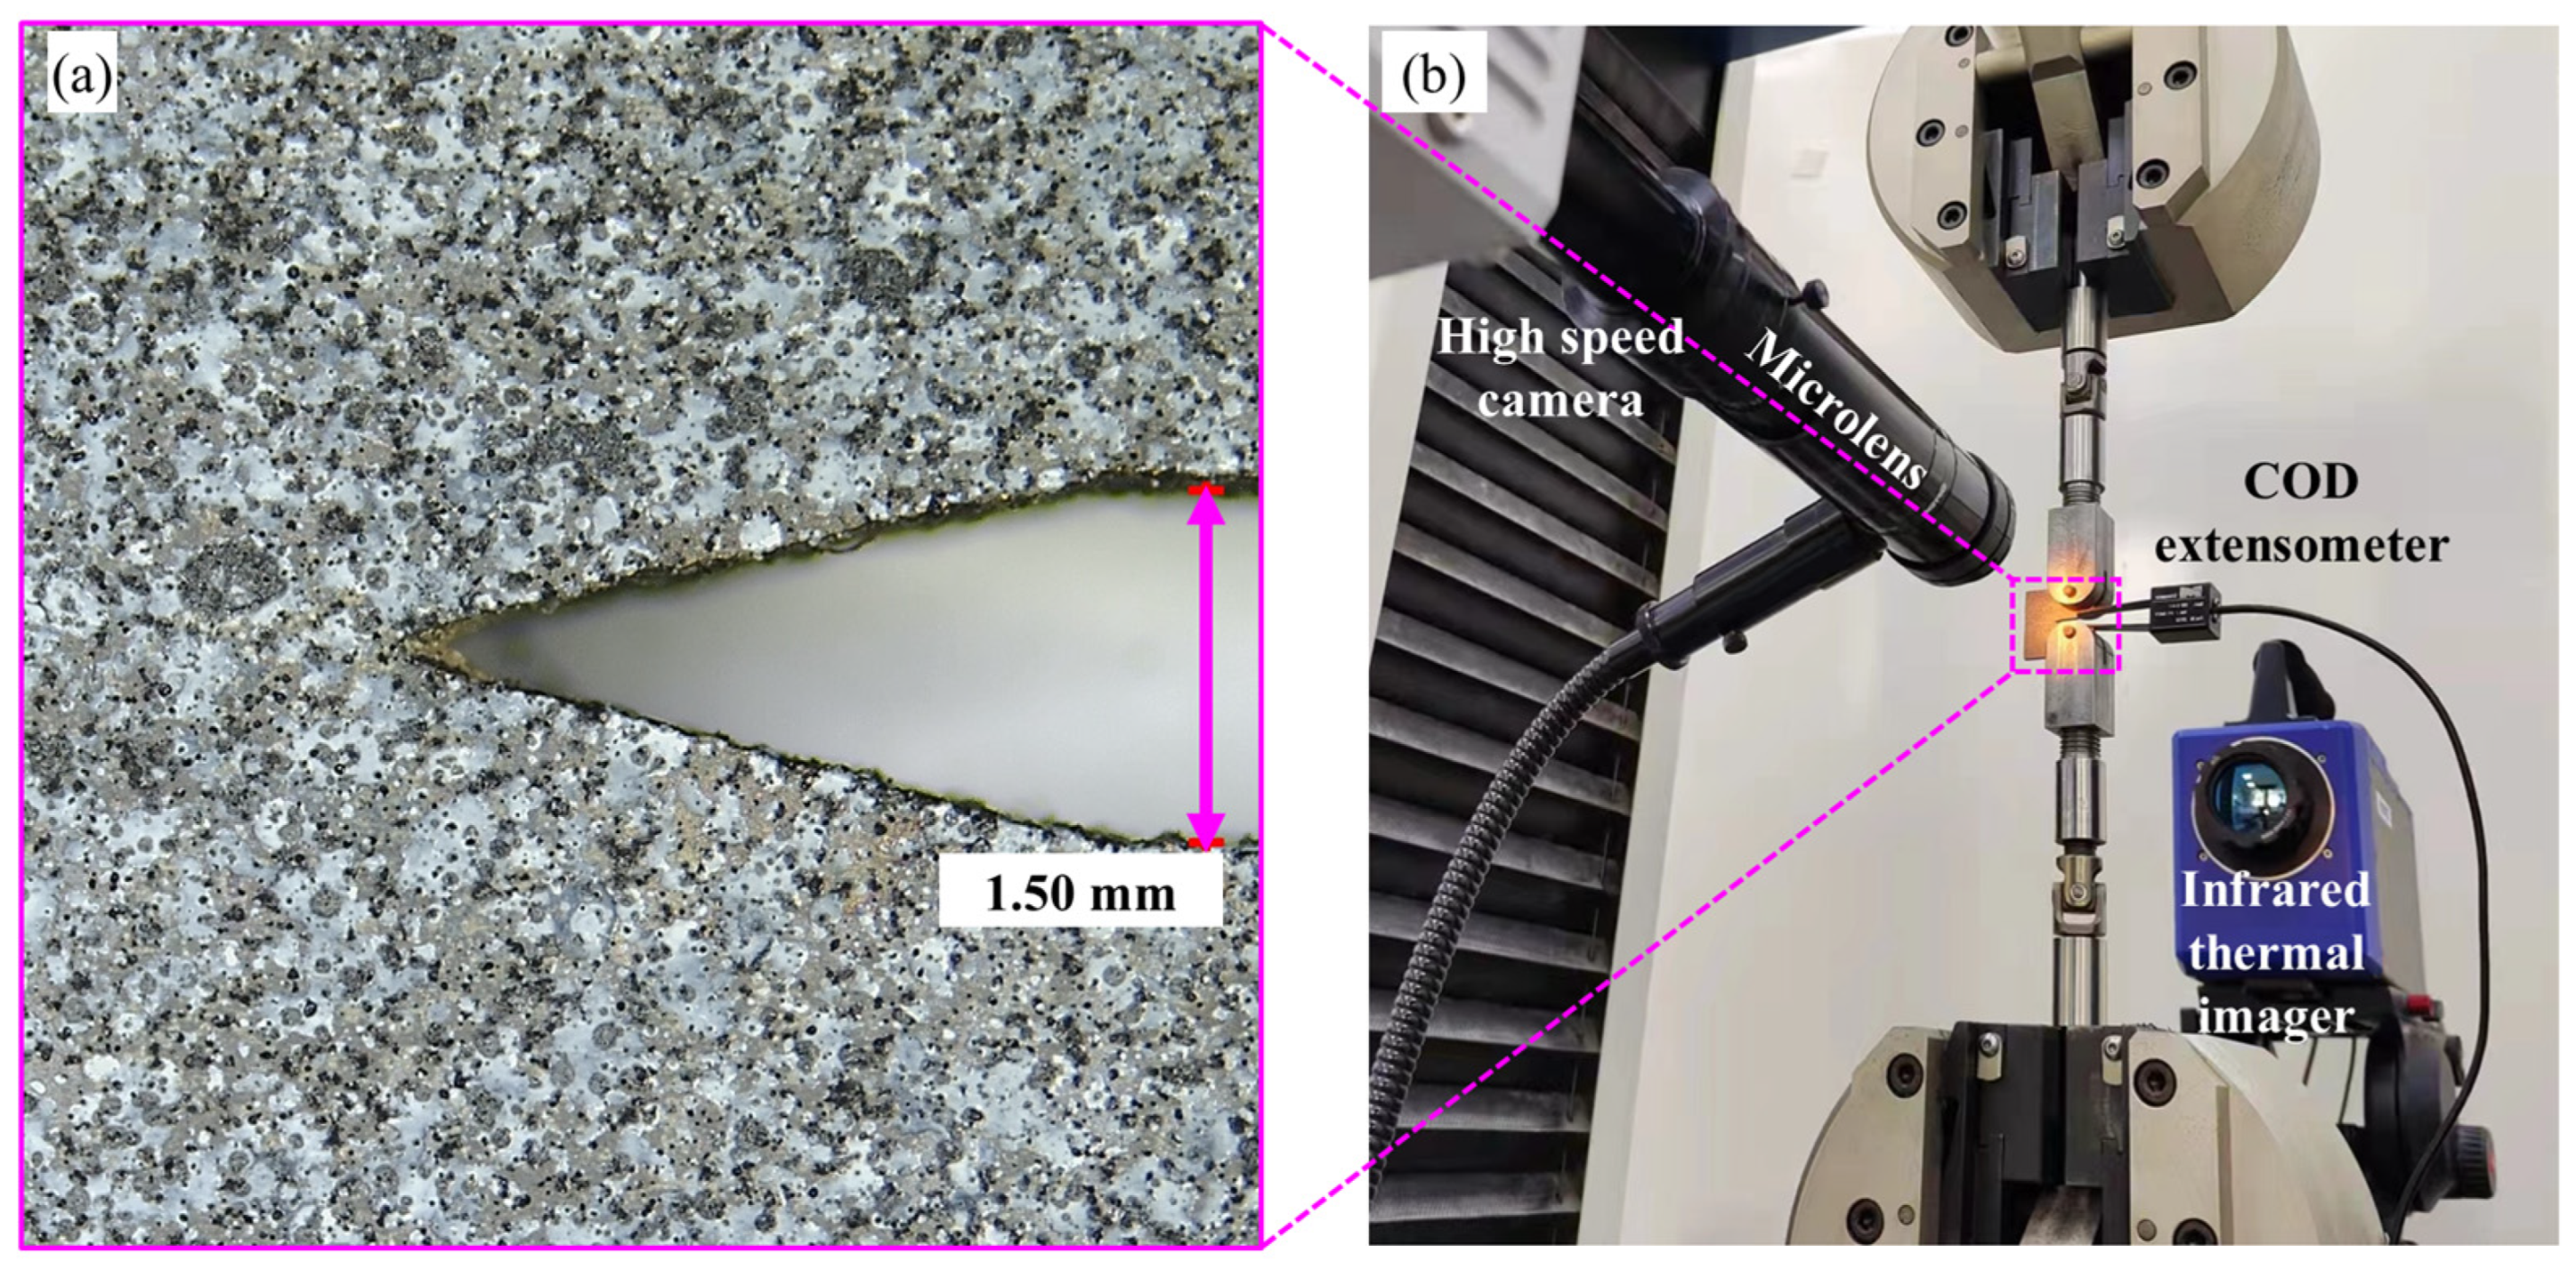
2.2. Testing Methods
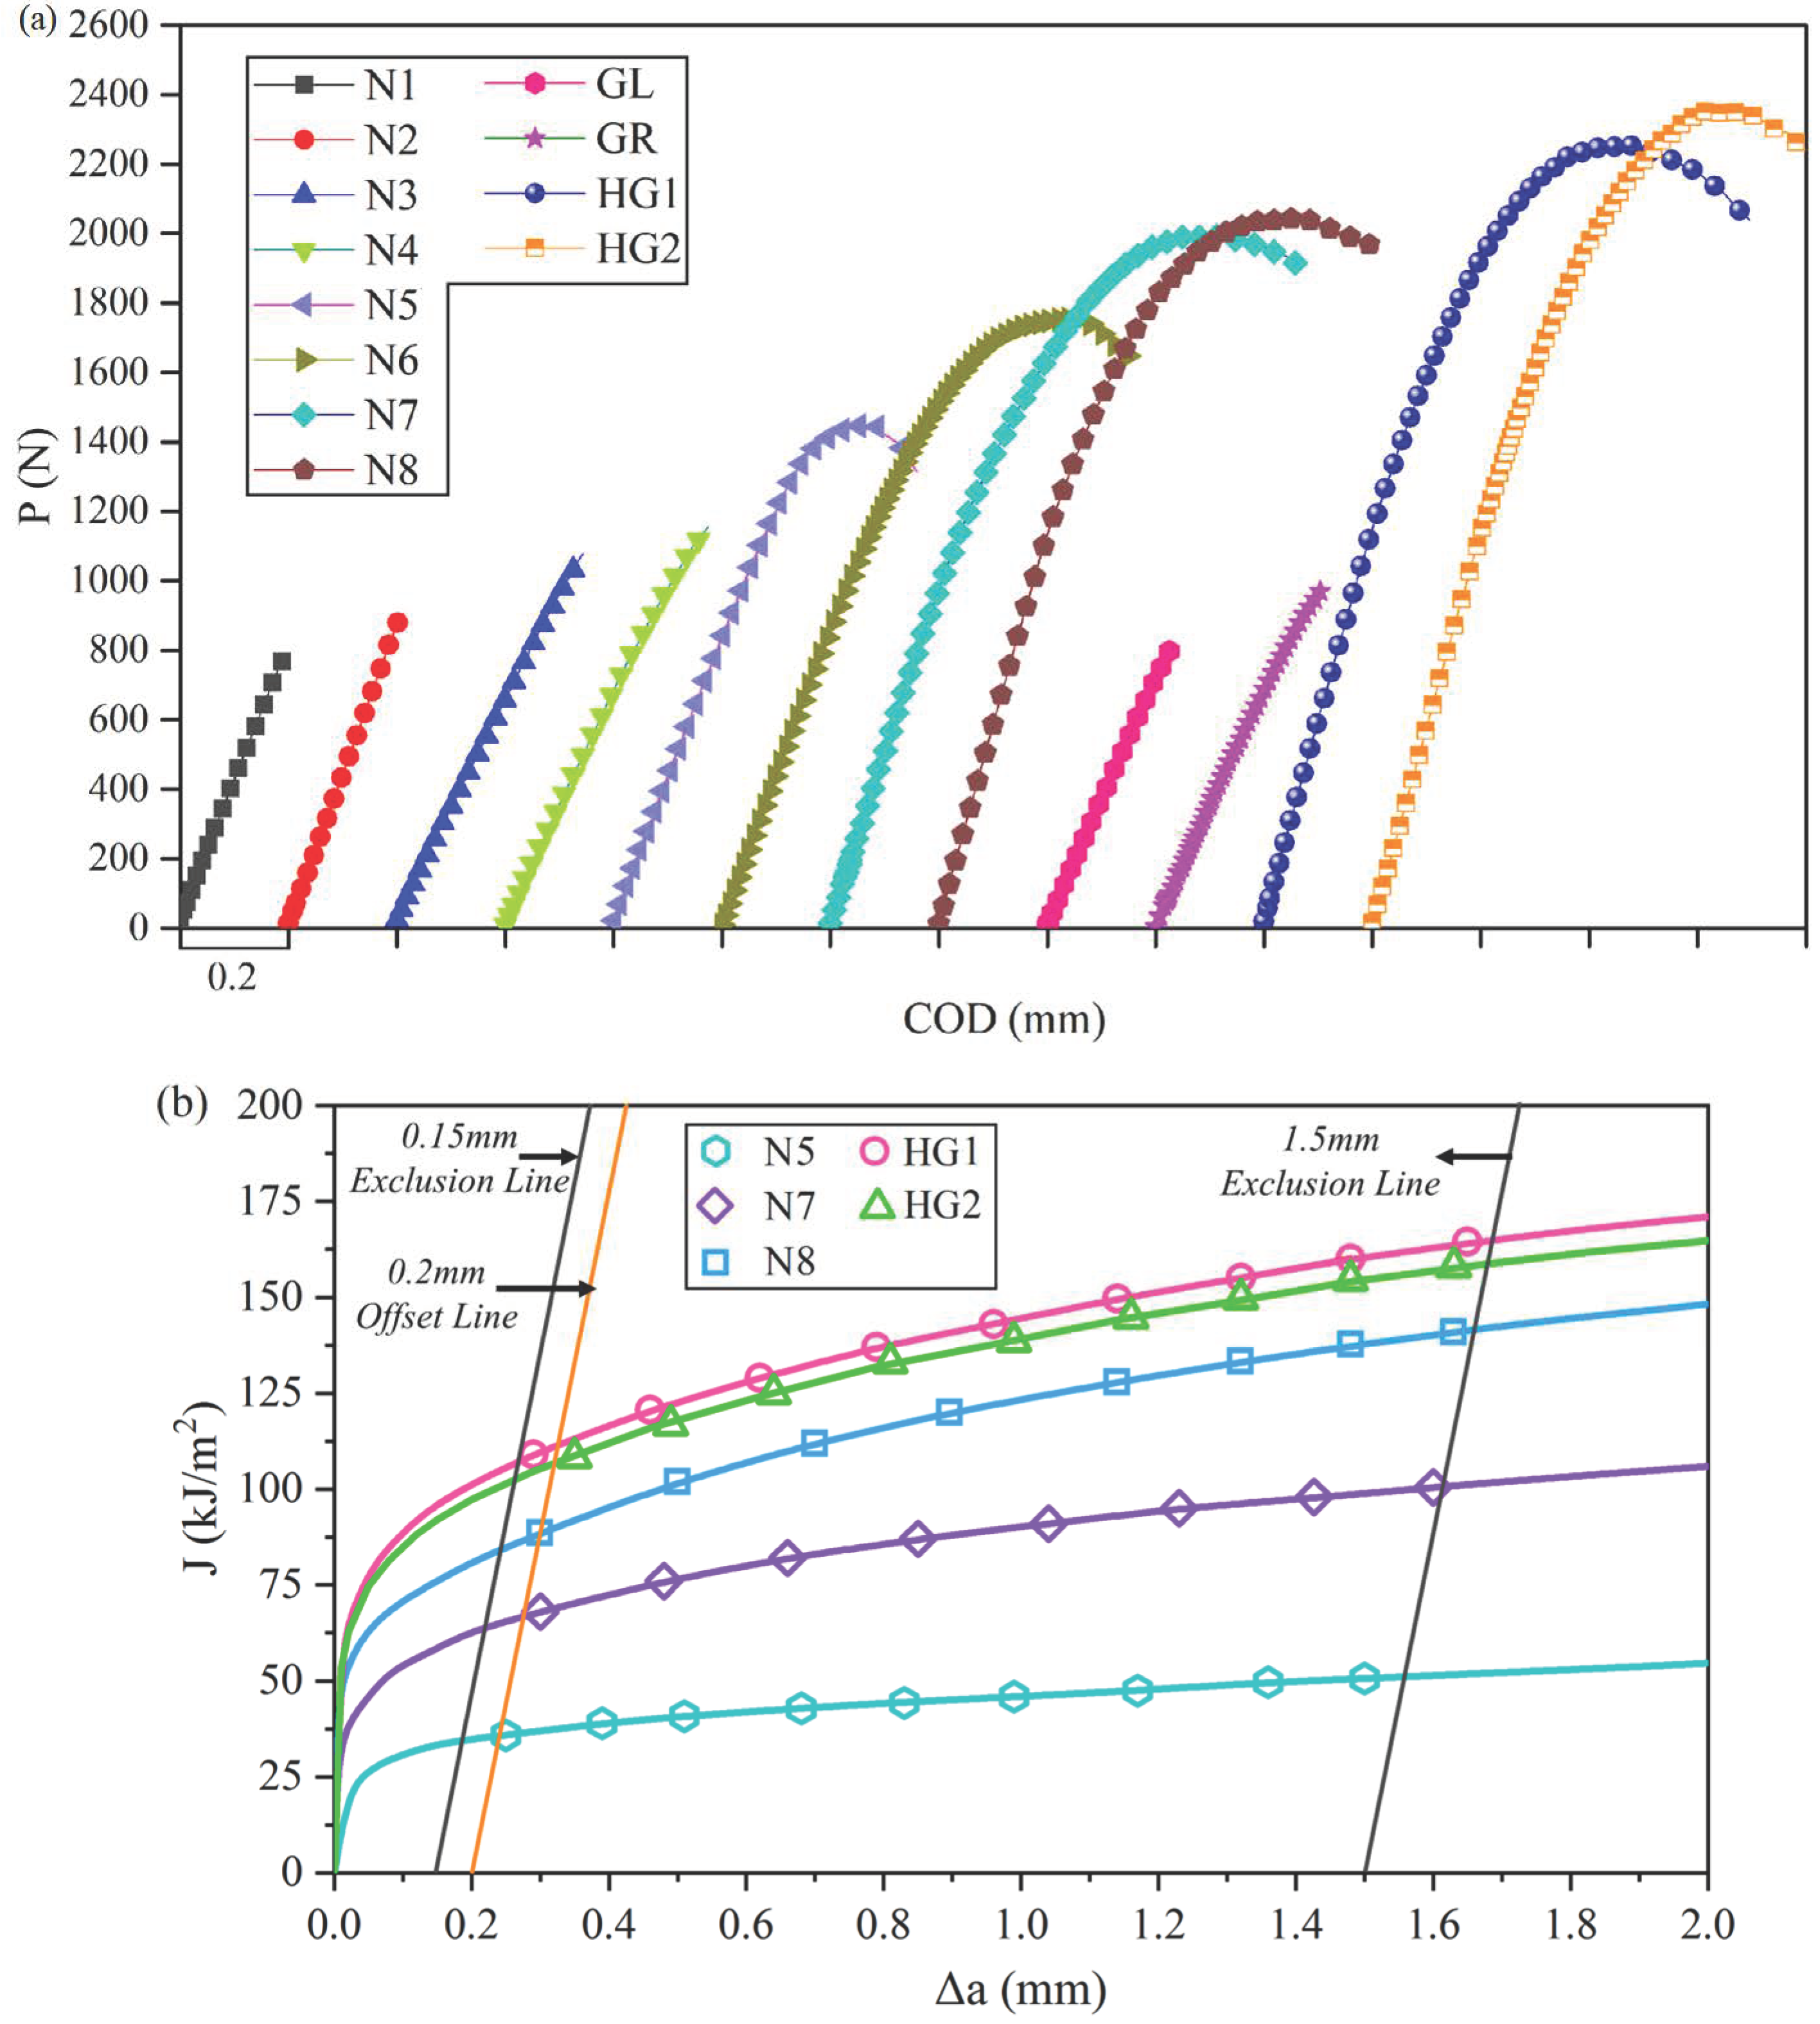
2.3. Evaluation Method for Fracture Toughness
3. Results
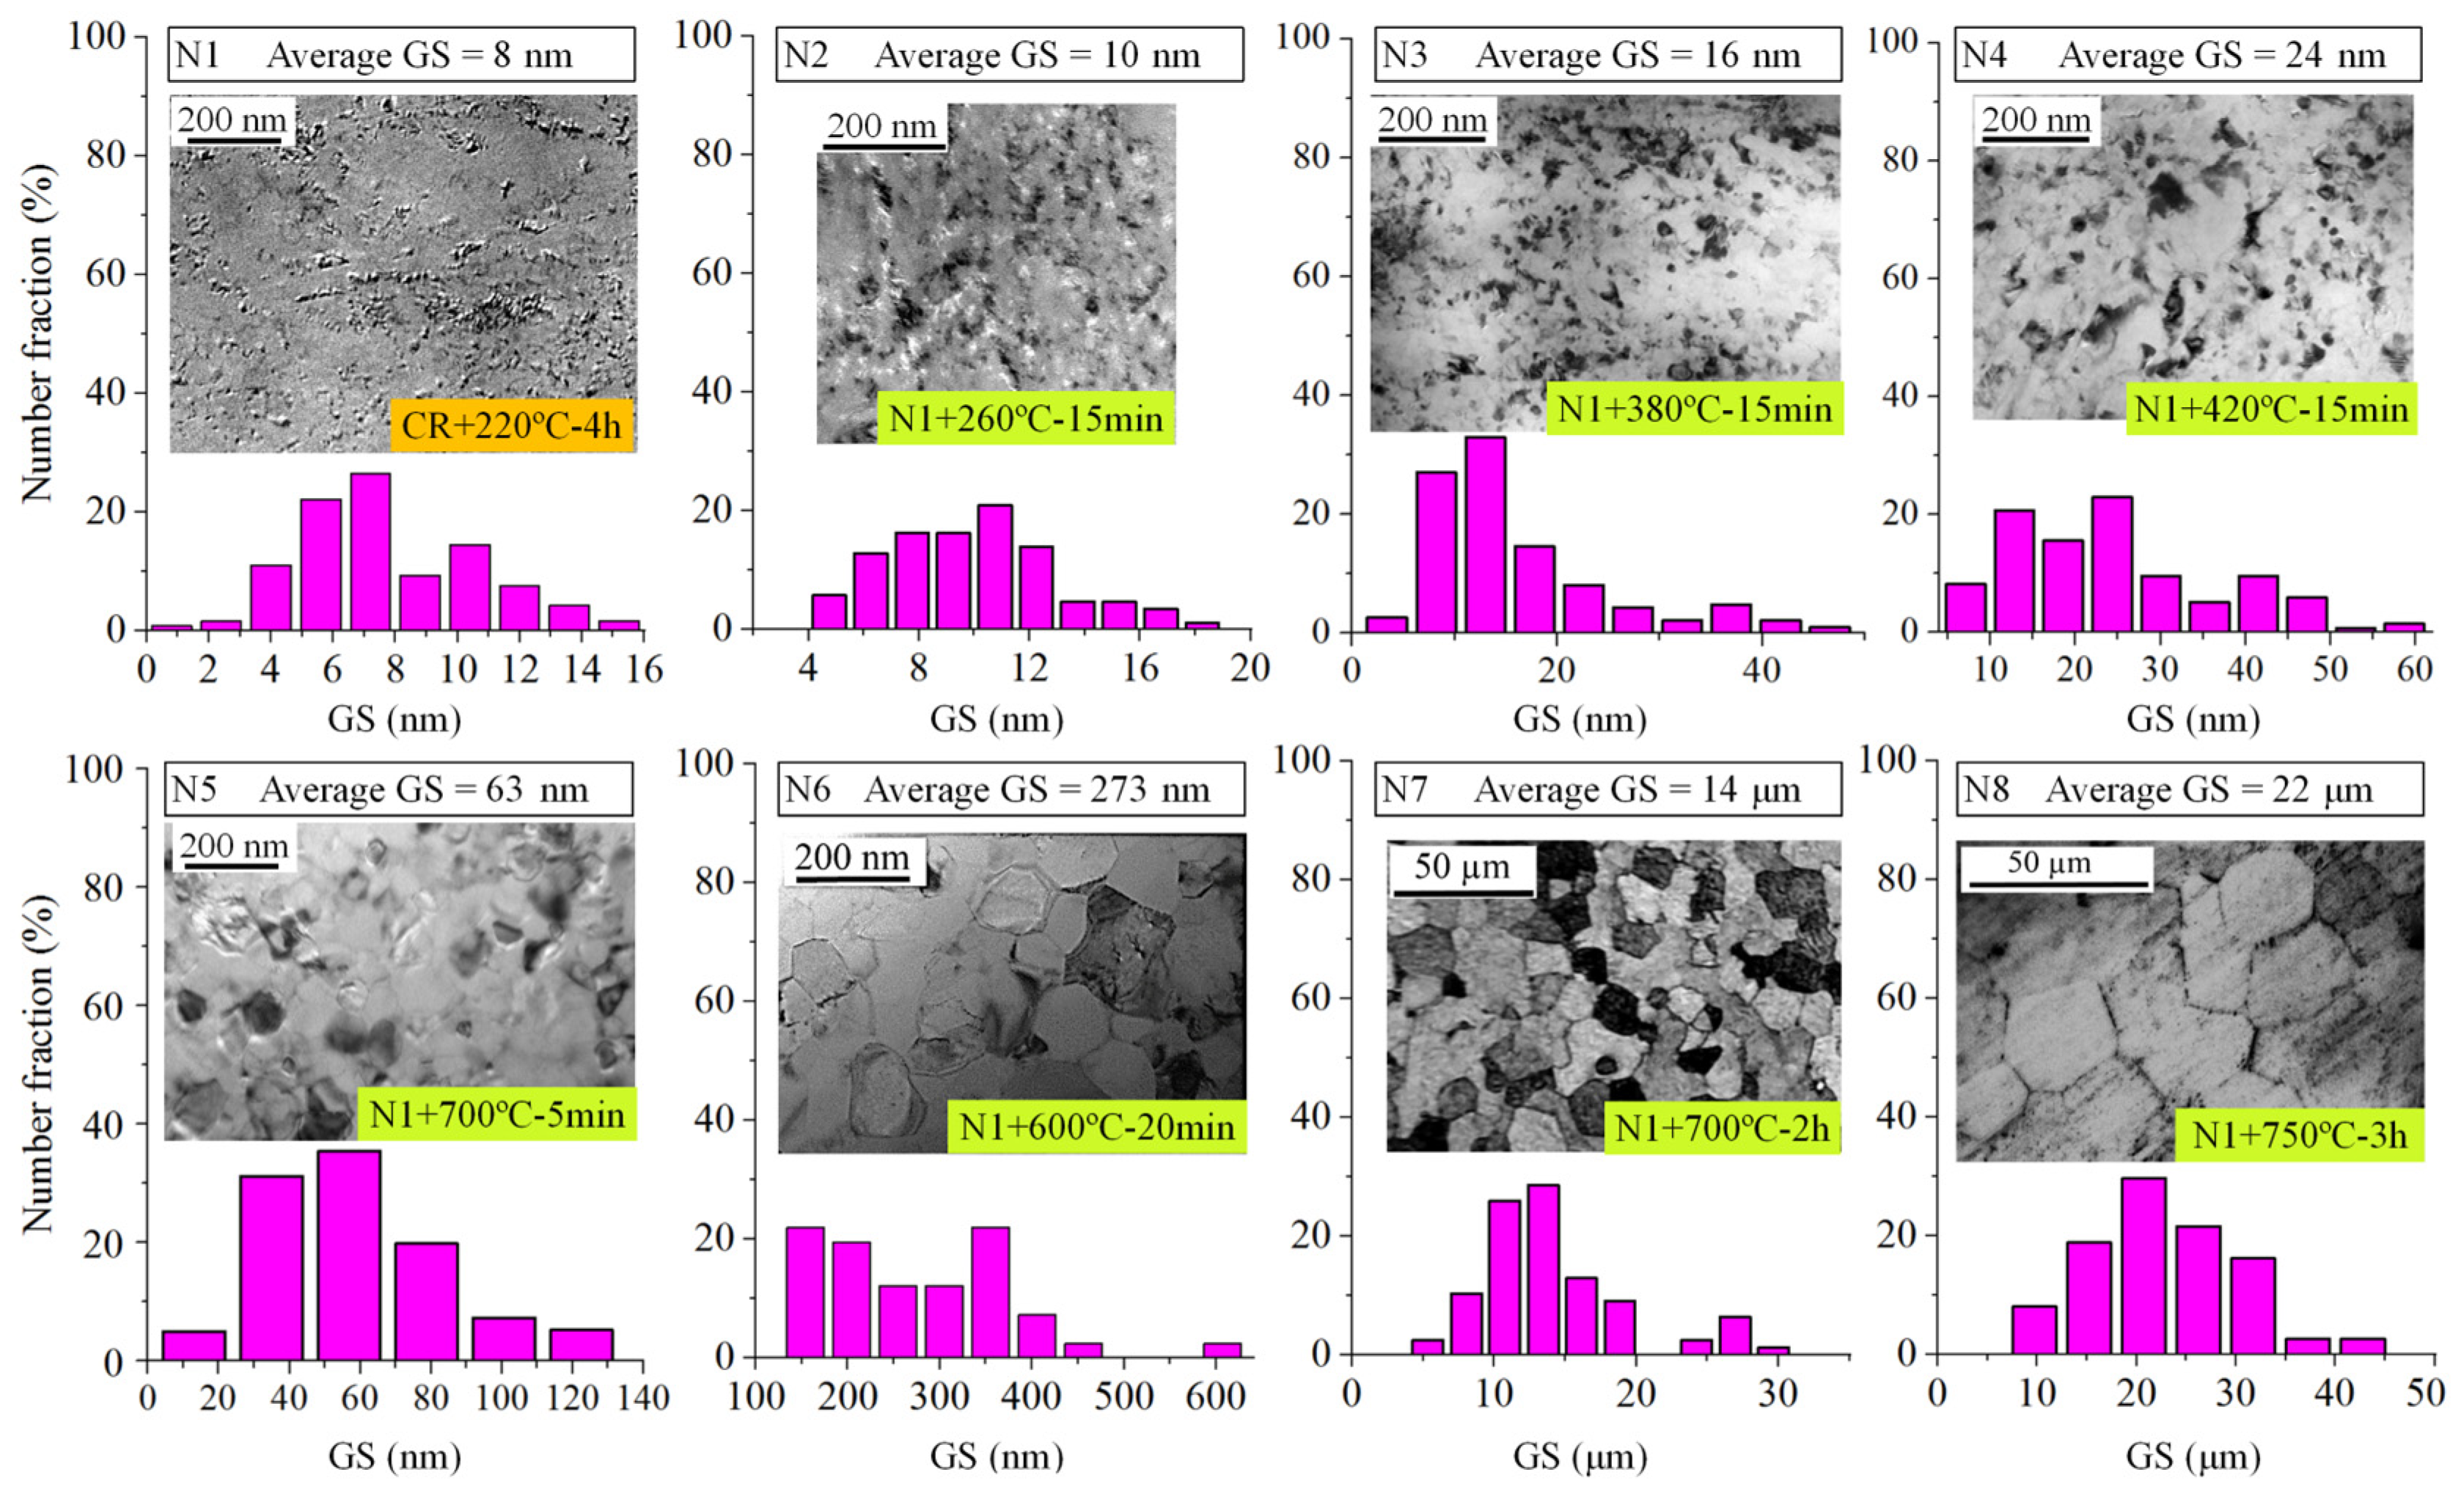
3.1. Results of GS Distributions
3.1.1. Normal GS Distributions
3.1.2. Macroscopic Unidirectional GS Gradient
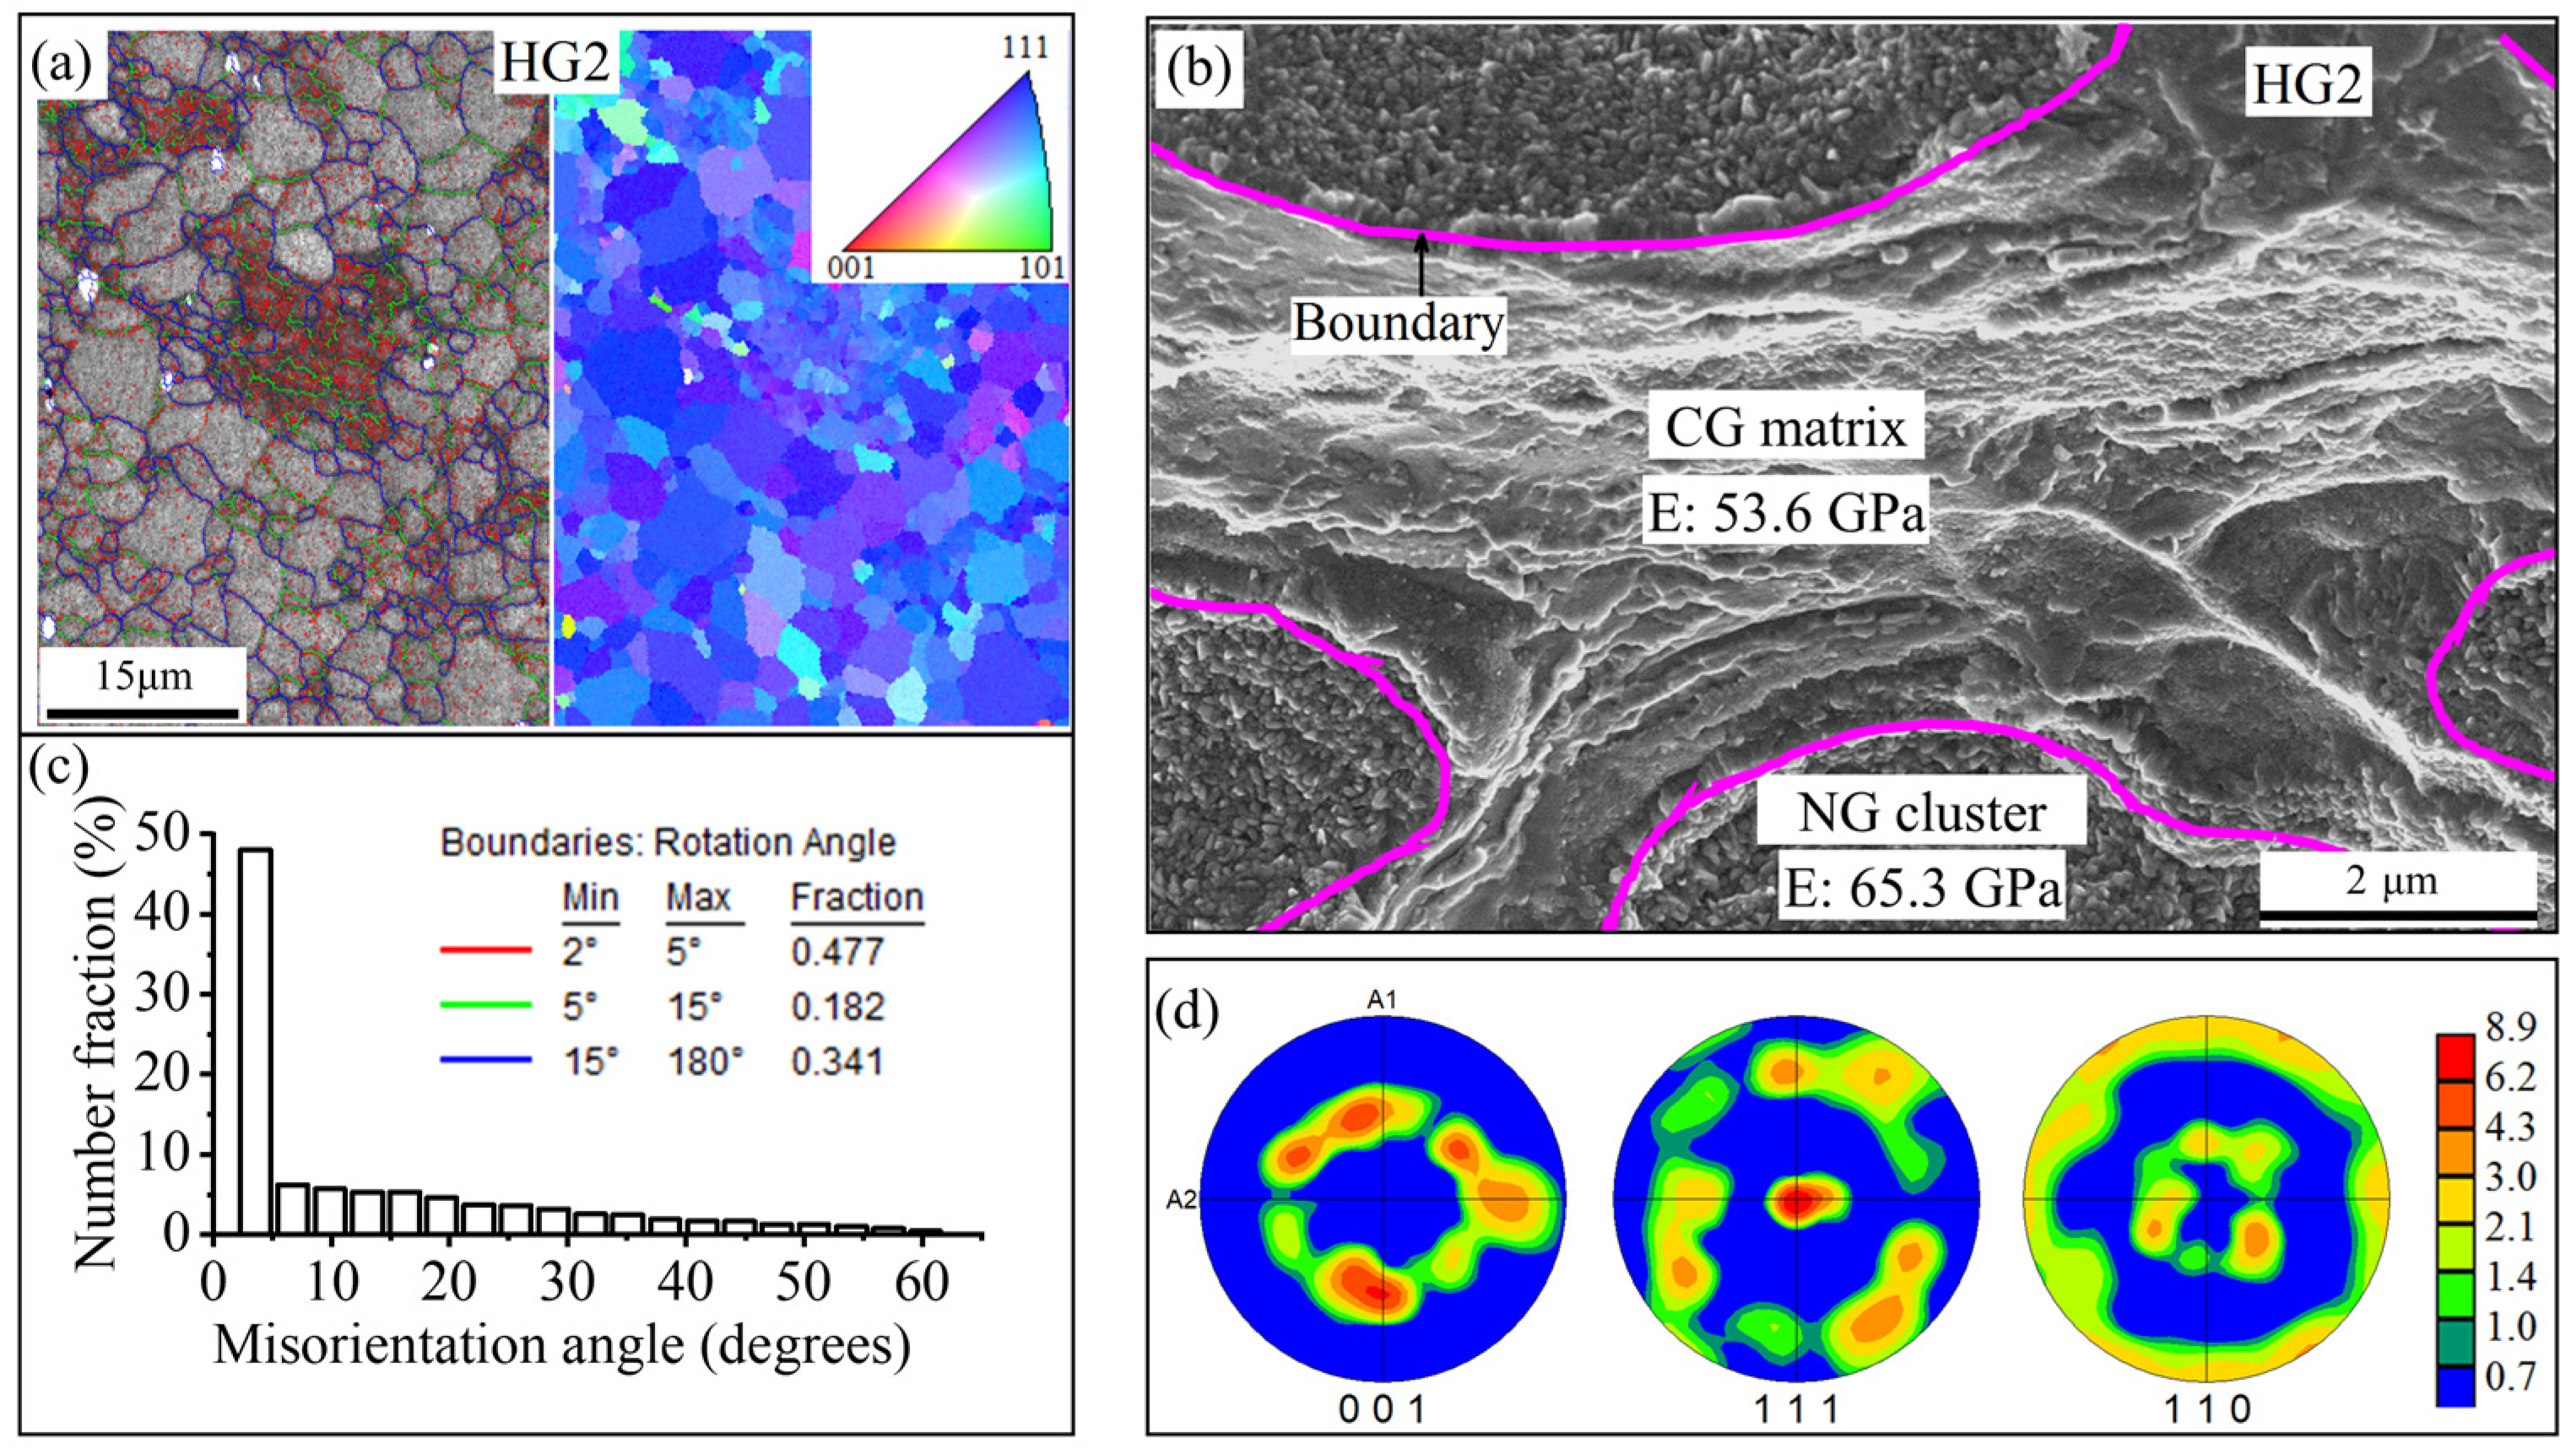
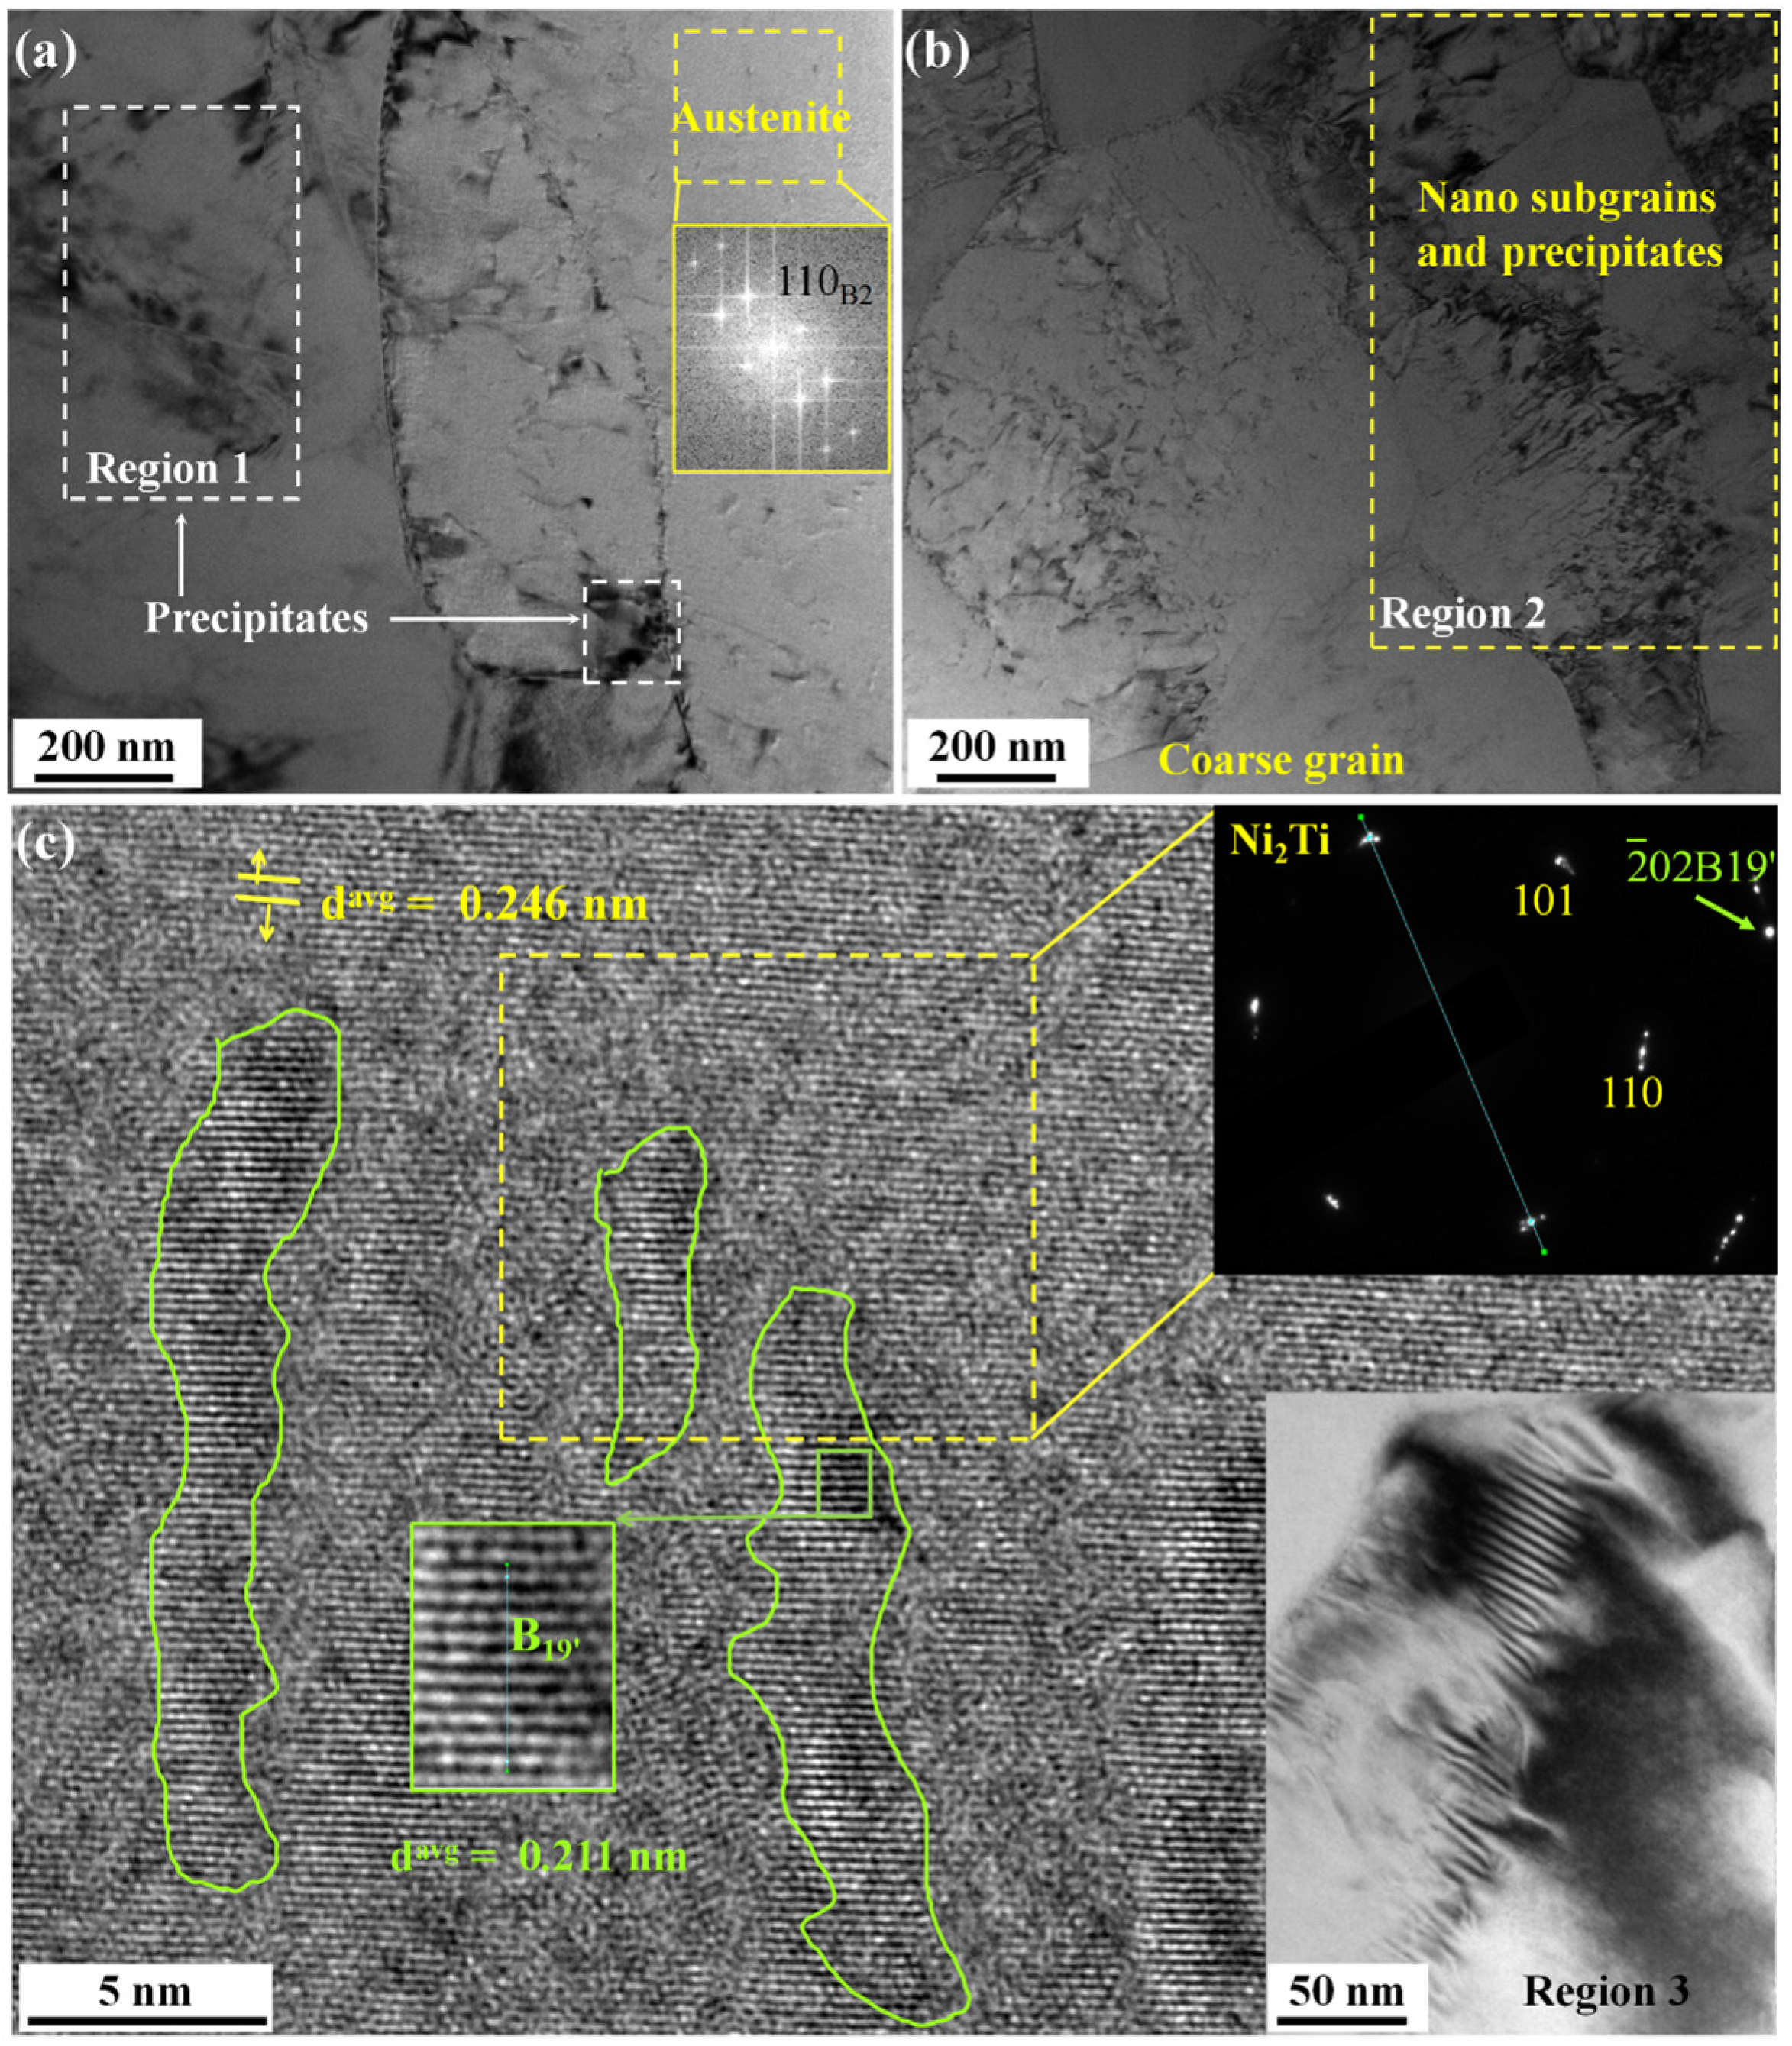
3.1.3. Locally High GS Gradient
3.2. Fracture Testing Results
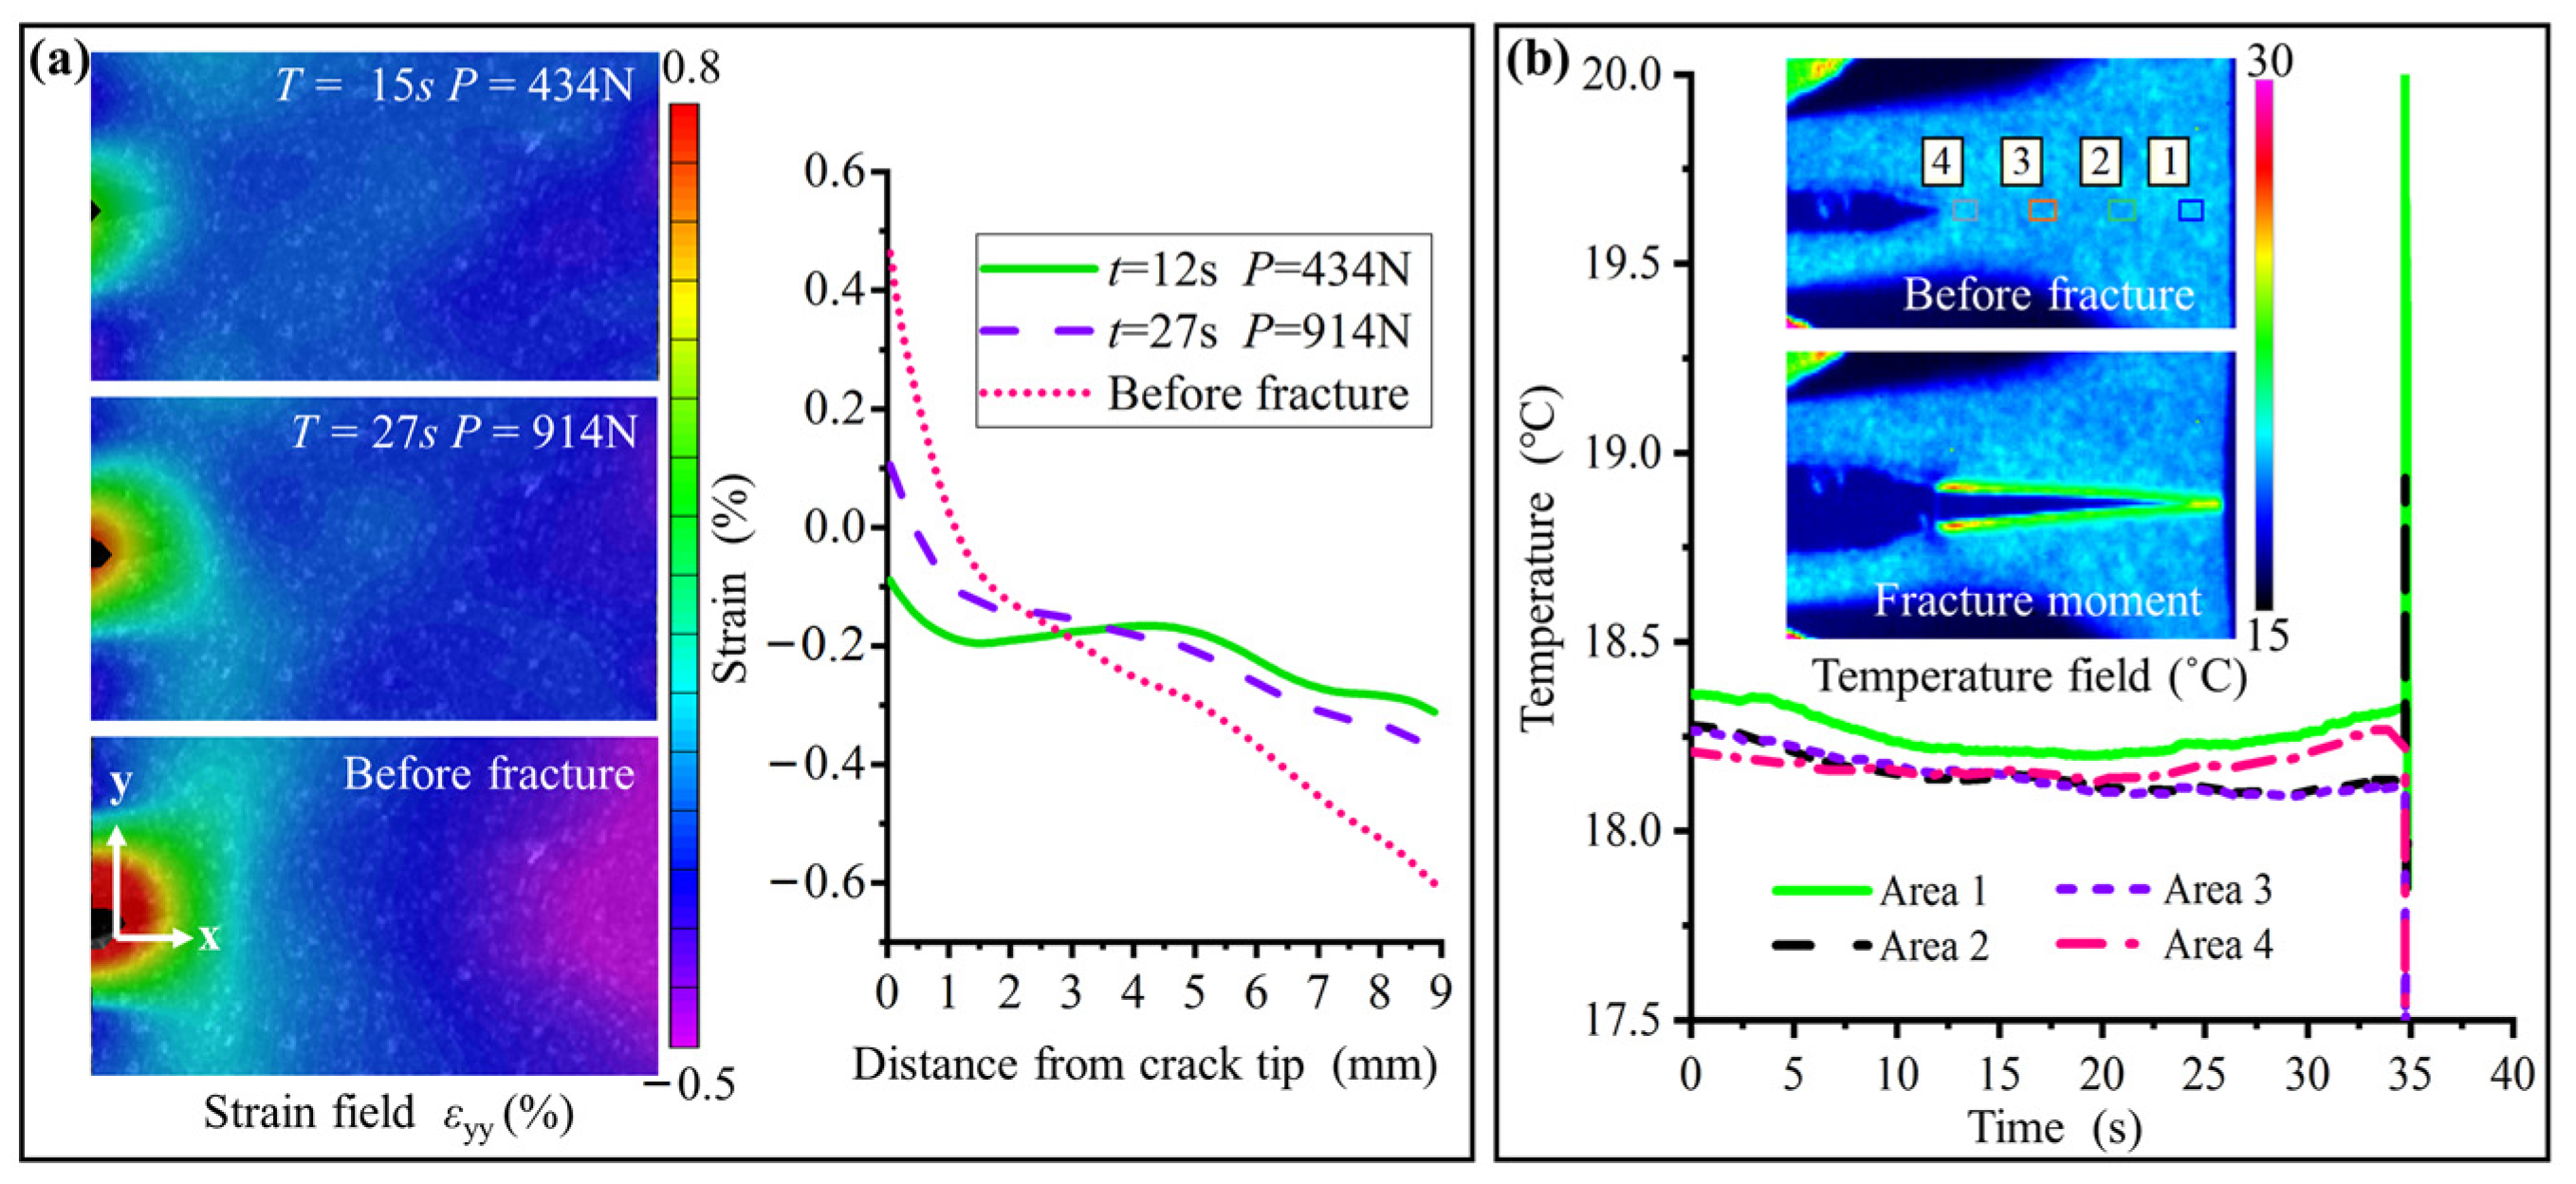
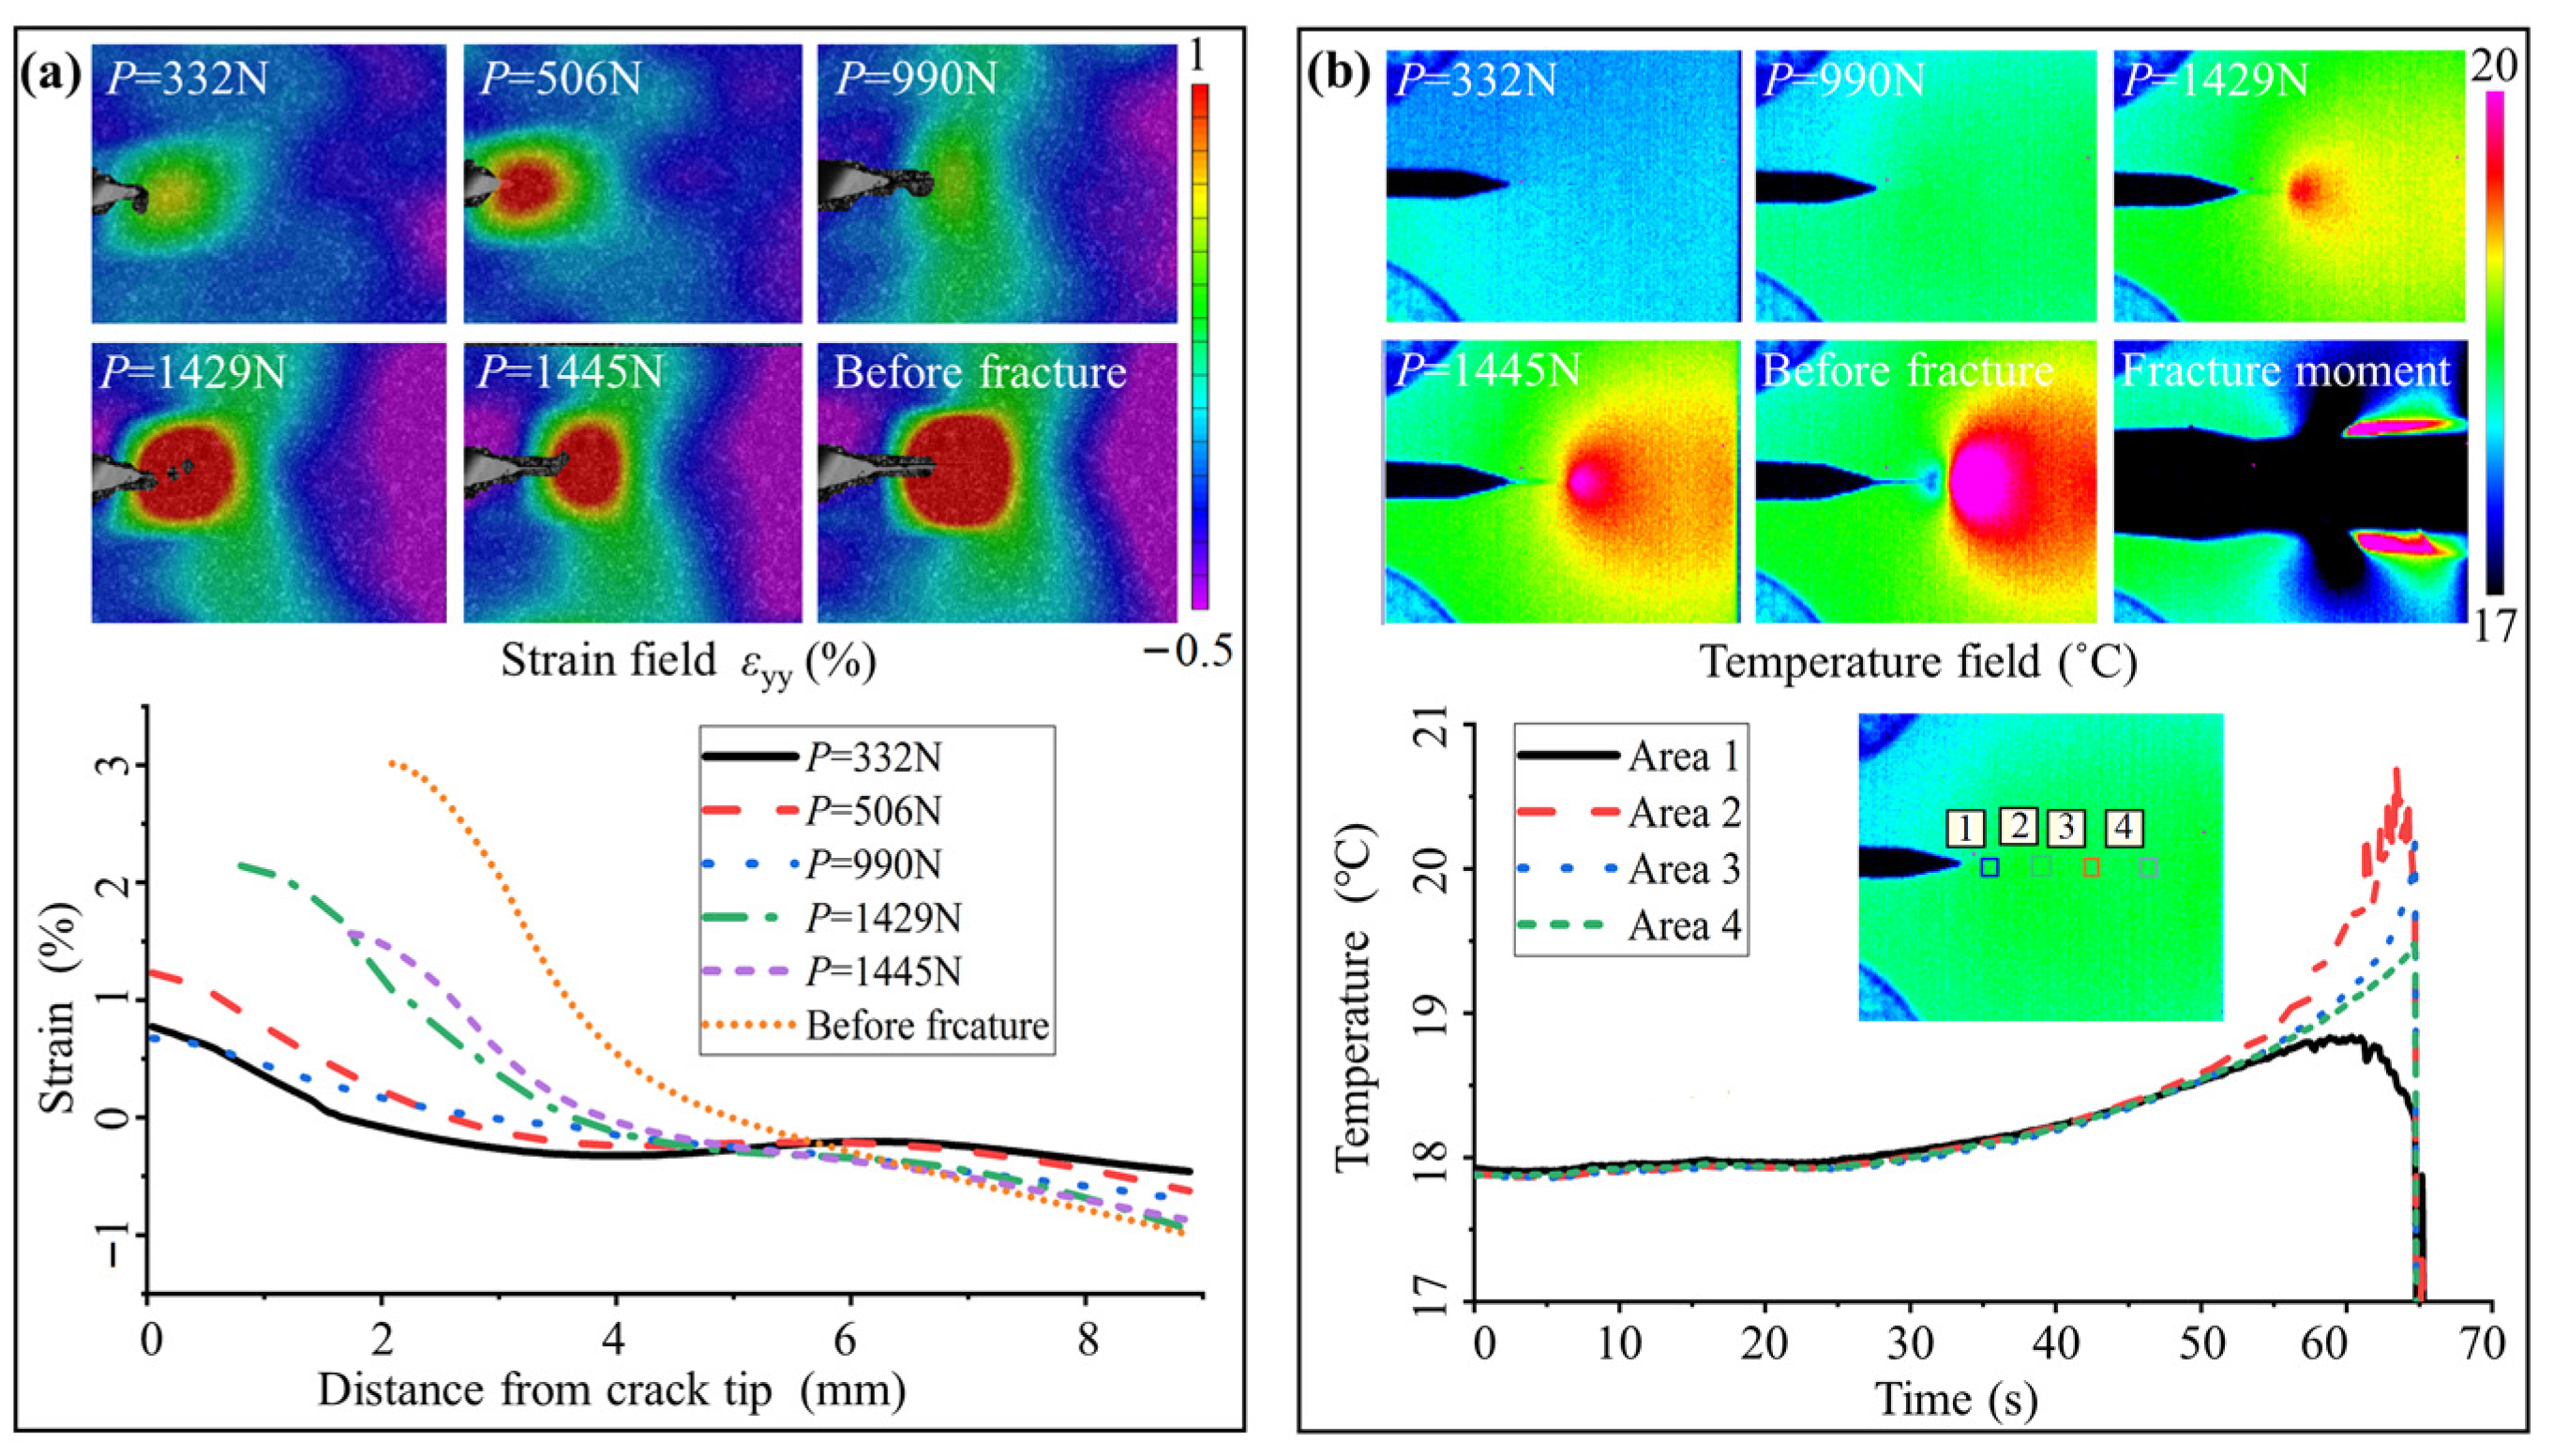
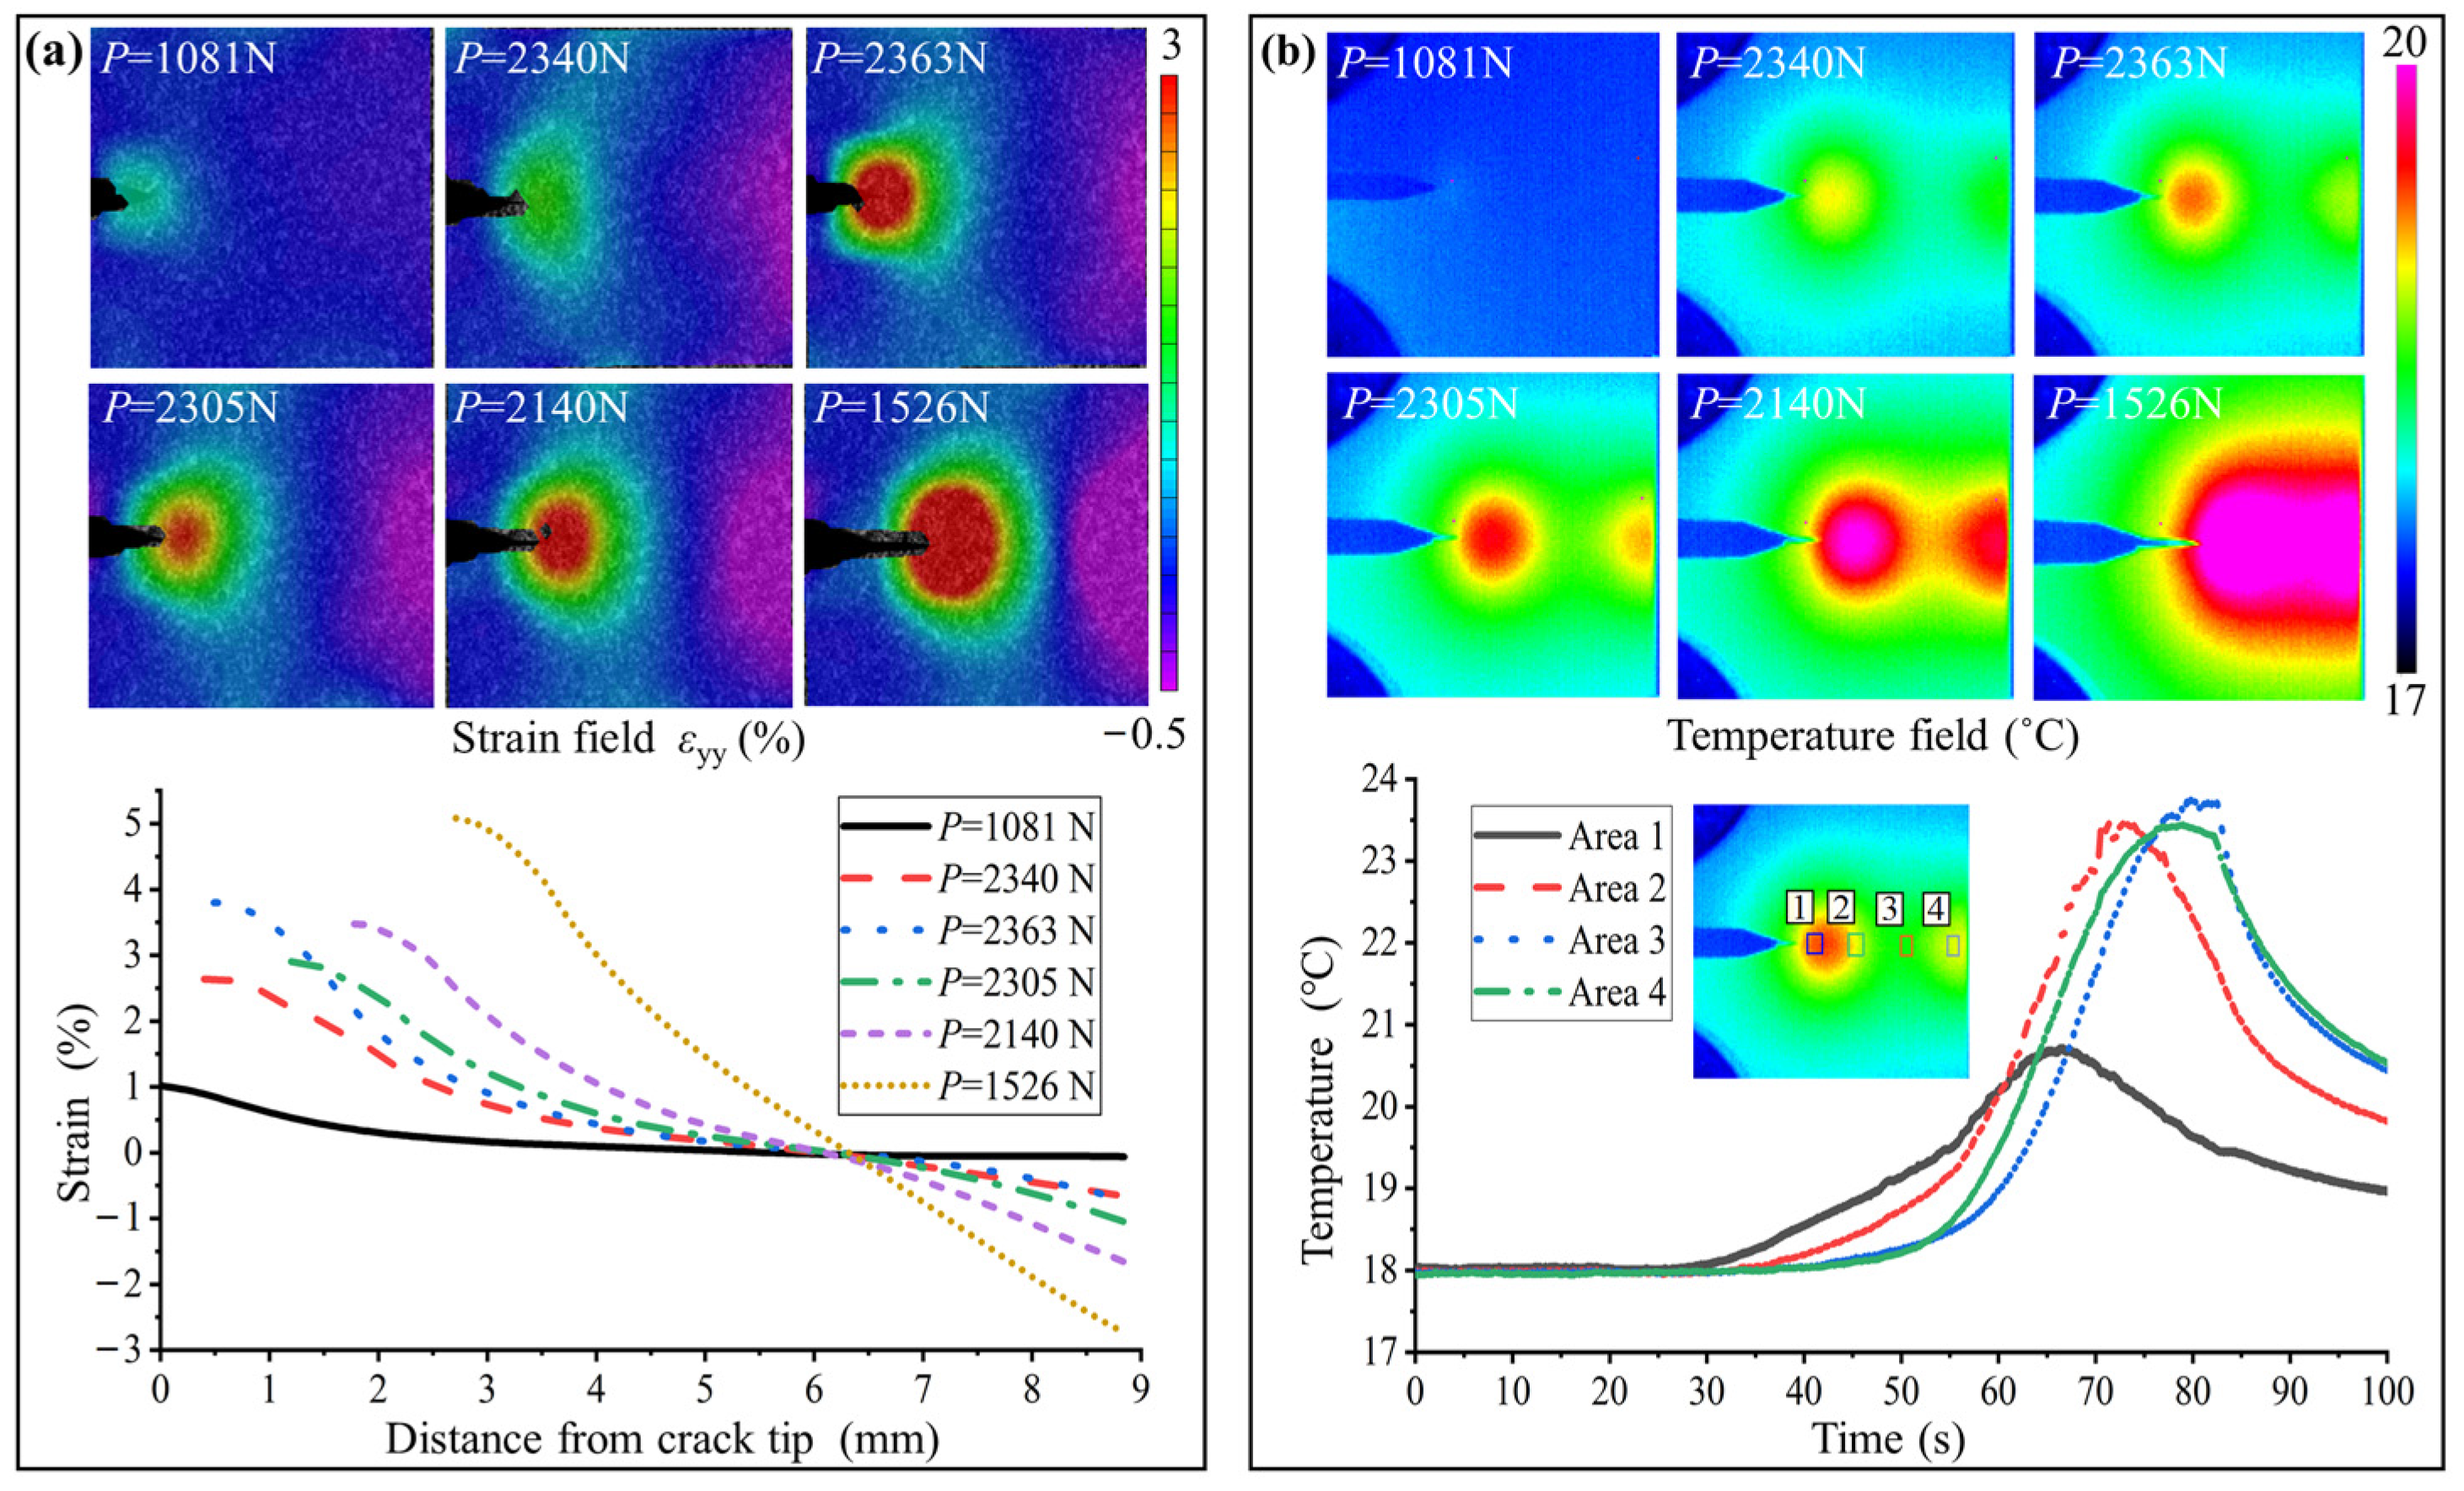
3.3. Thermal Coupling Fracture Behaviors
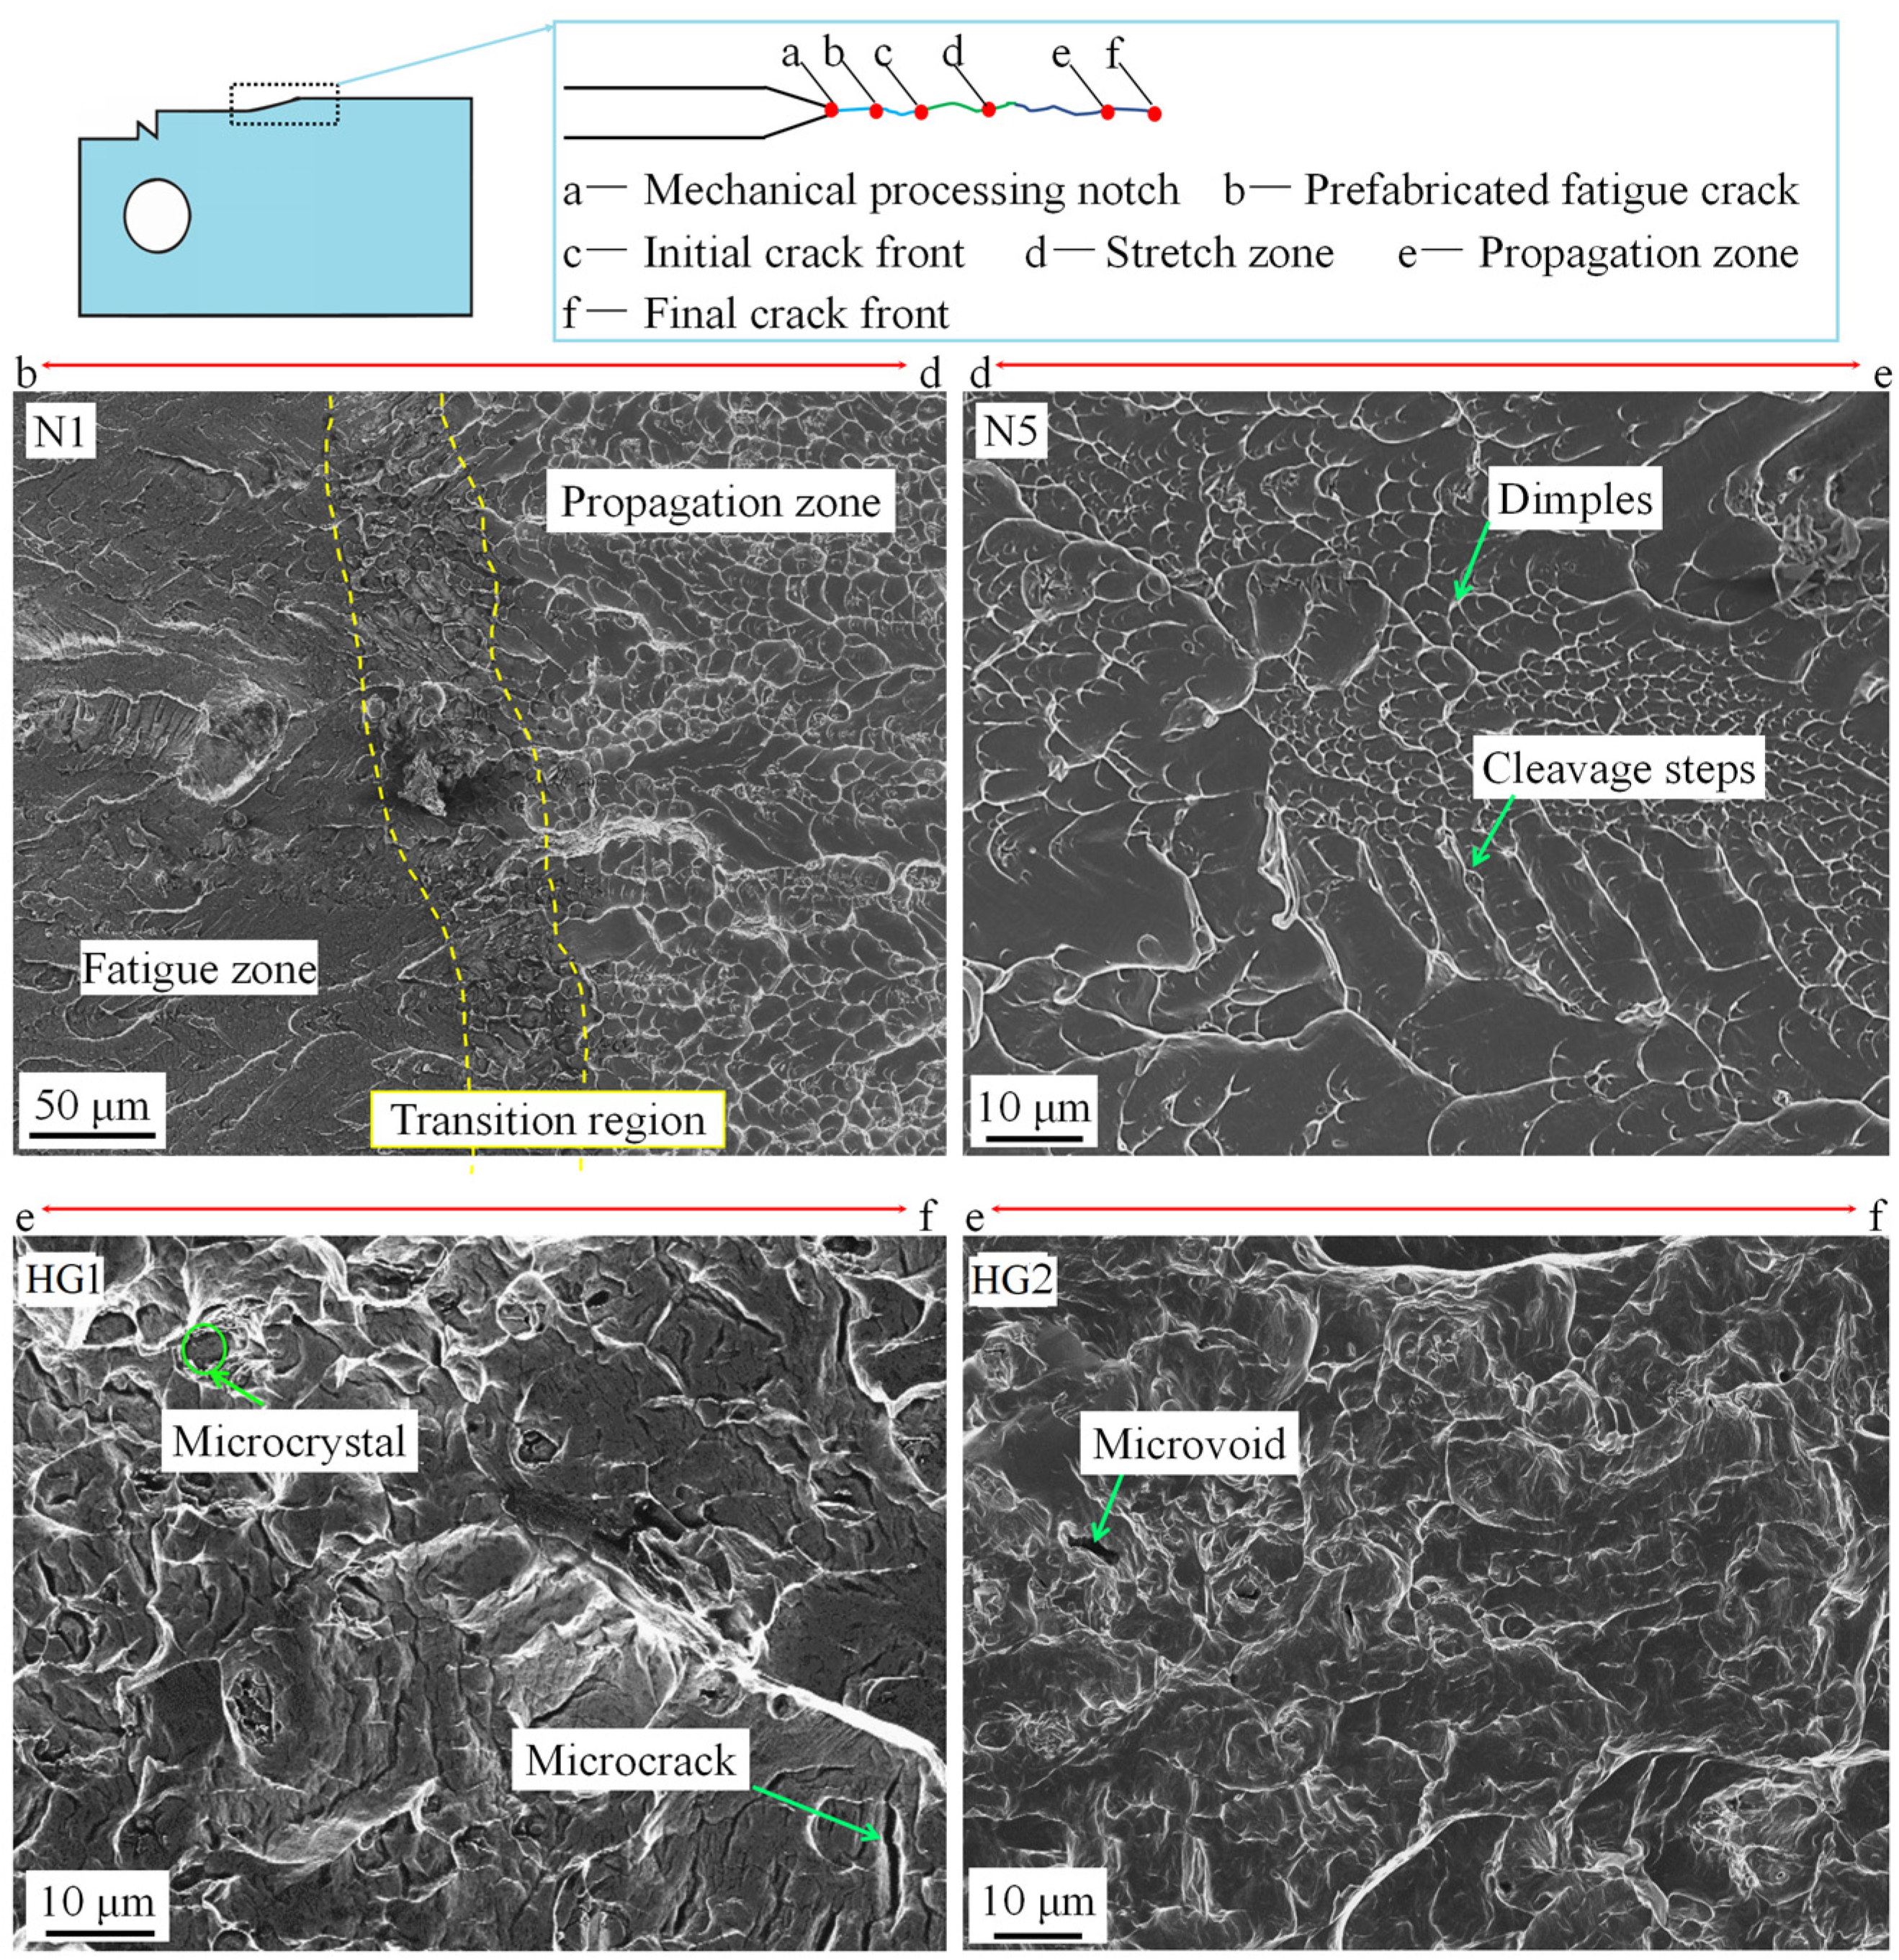
3.4. Fracture Characteristics
4. Discussions
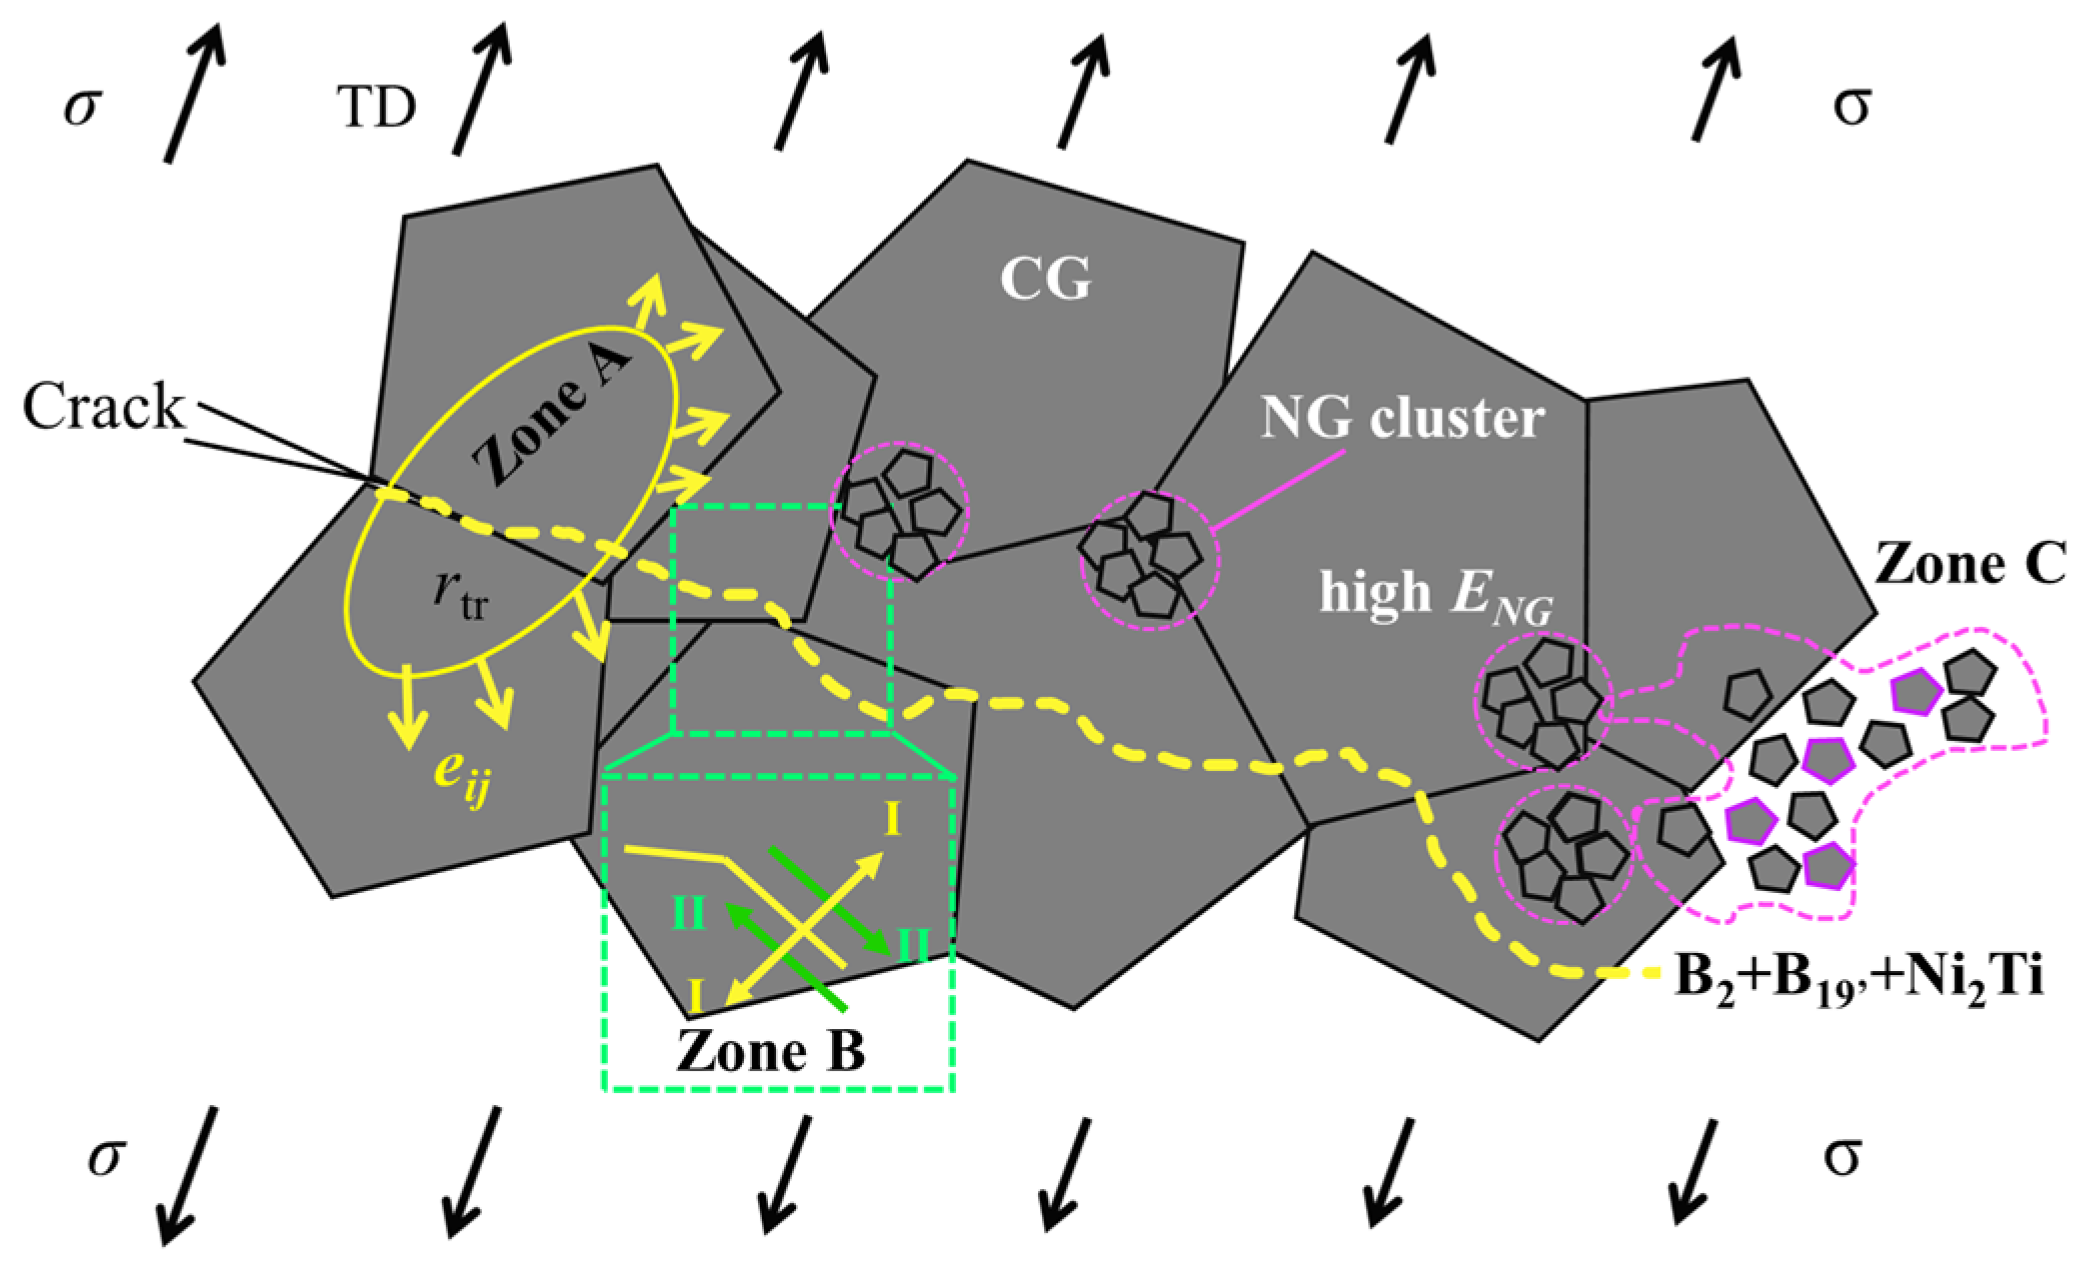
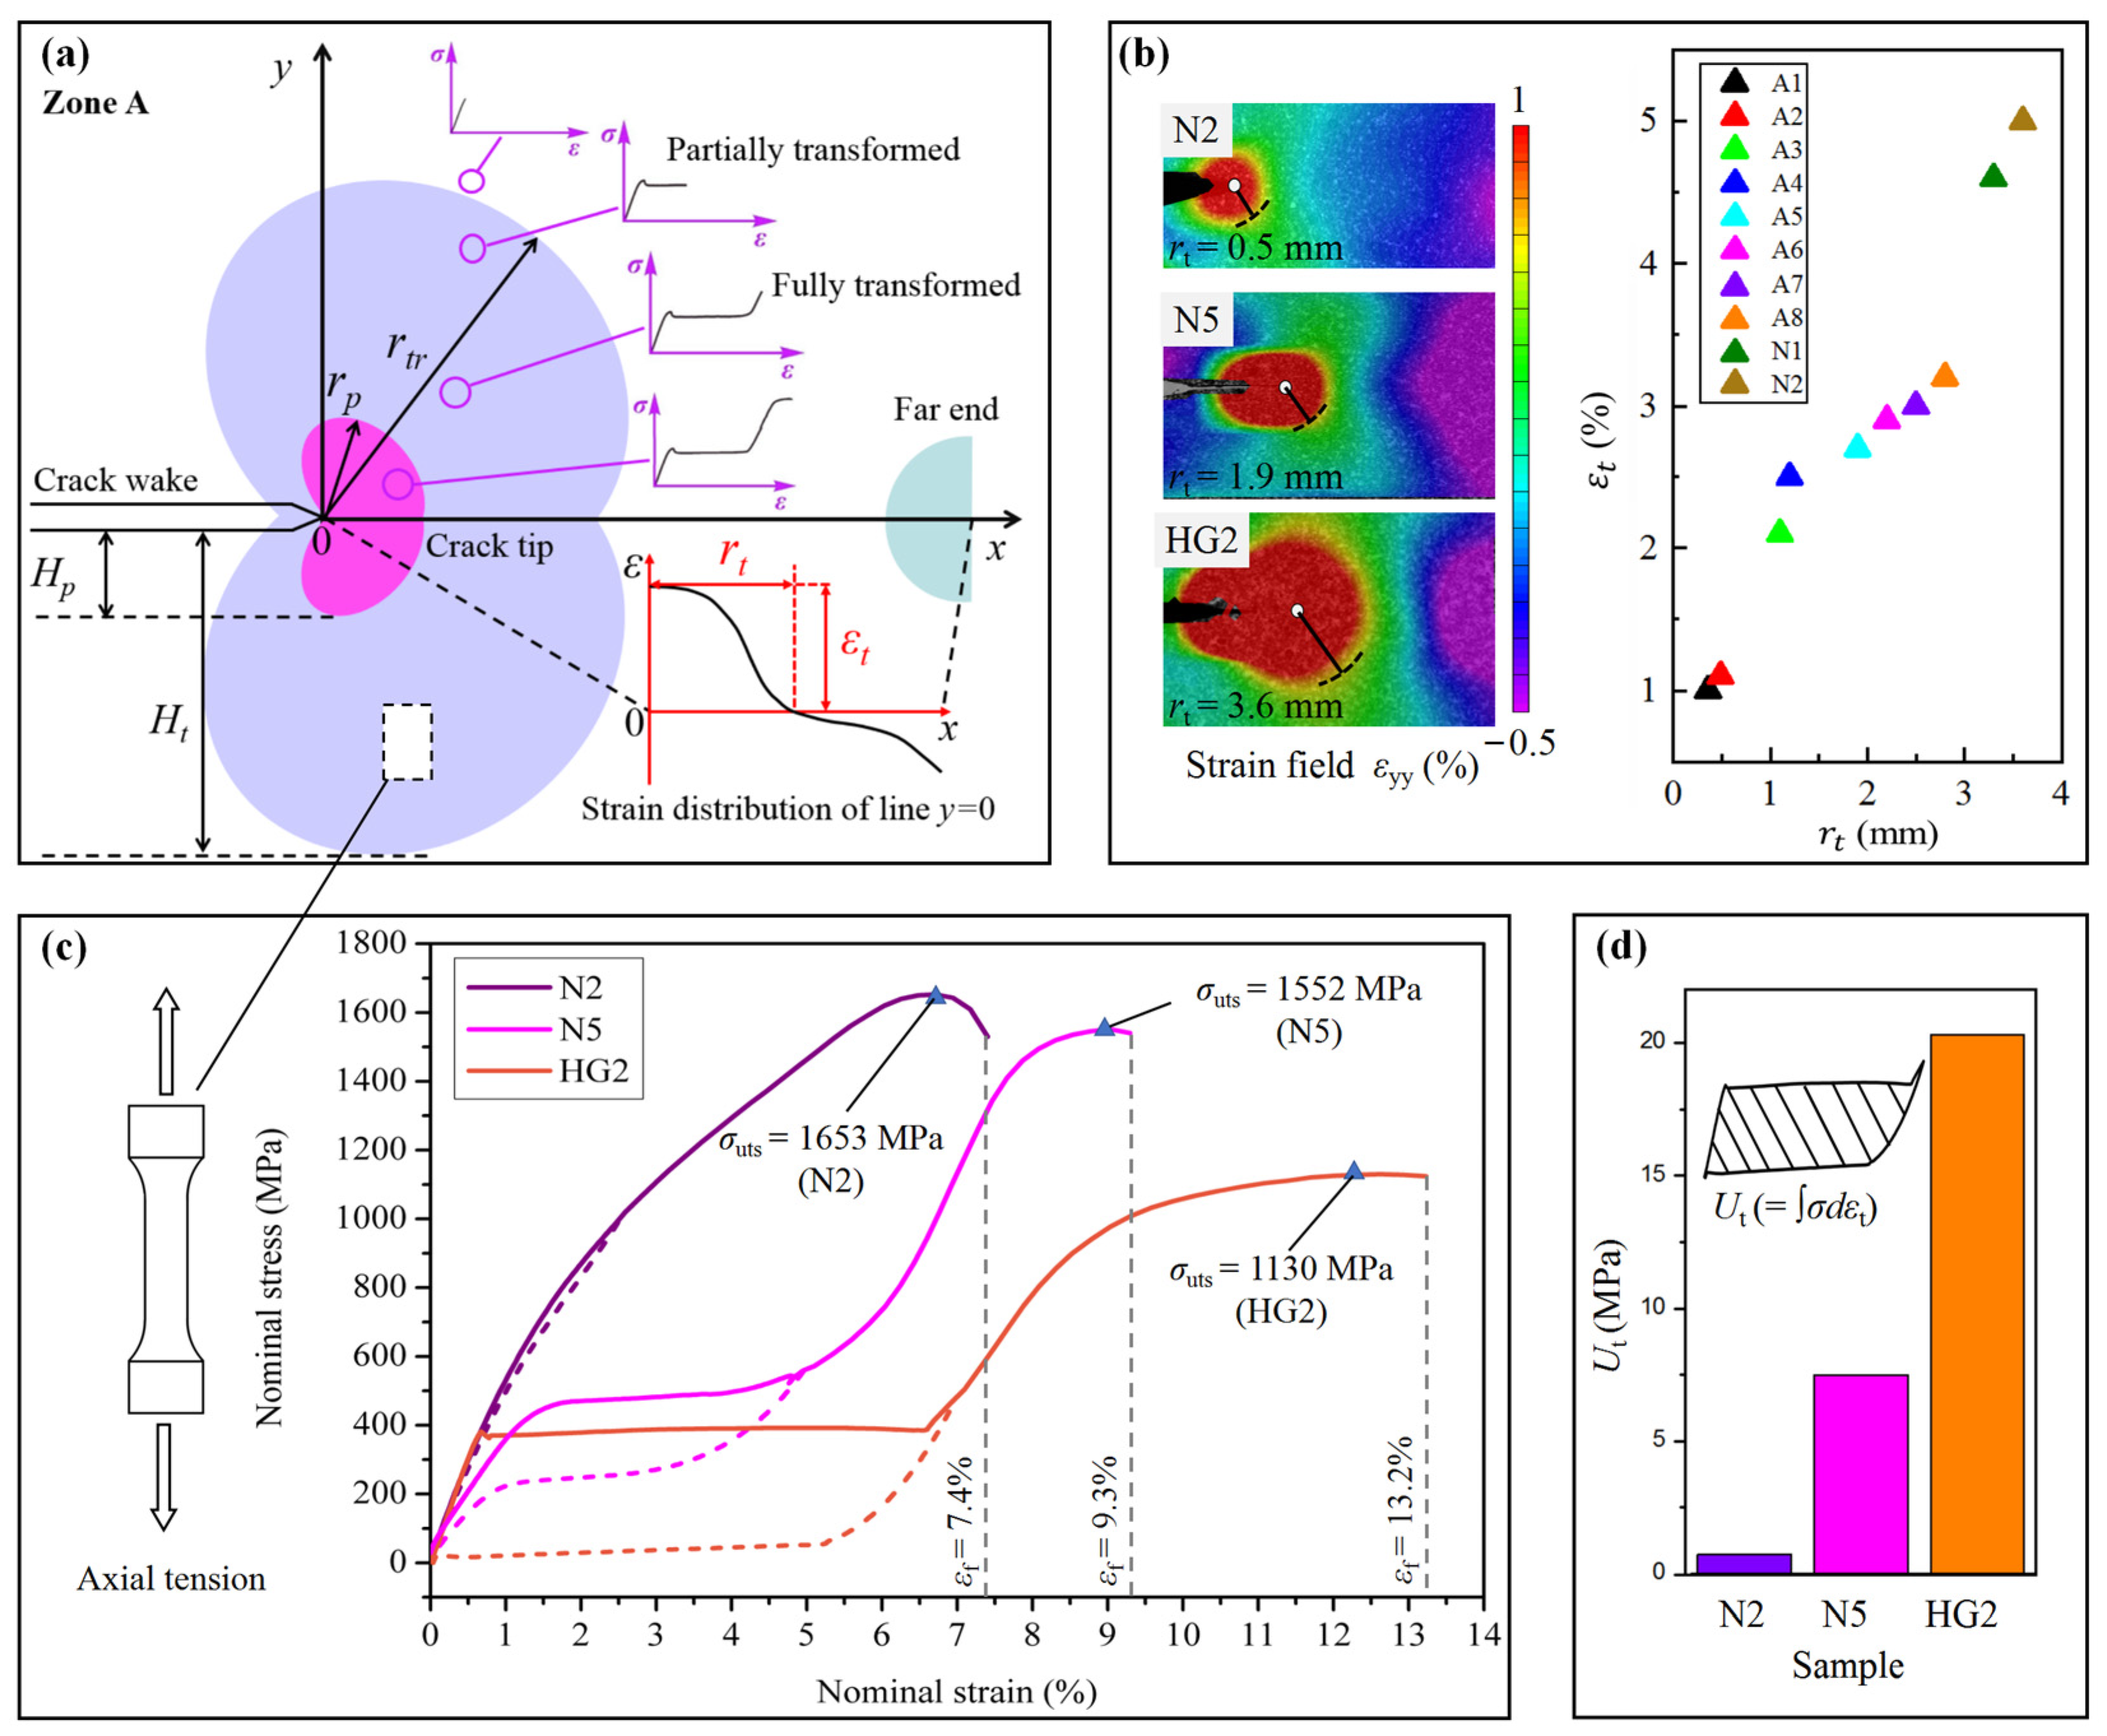
4.1. Toughening Enhancement by Stress-Induced PT in CG Region
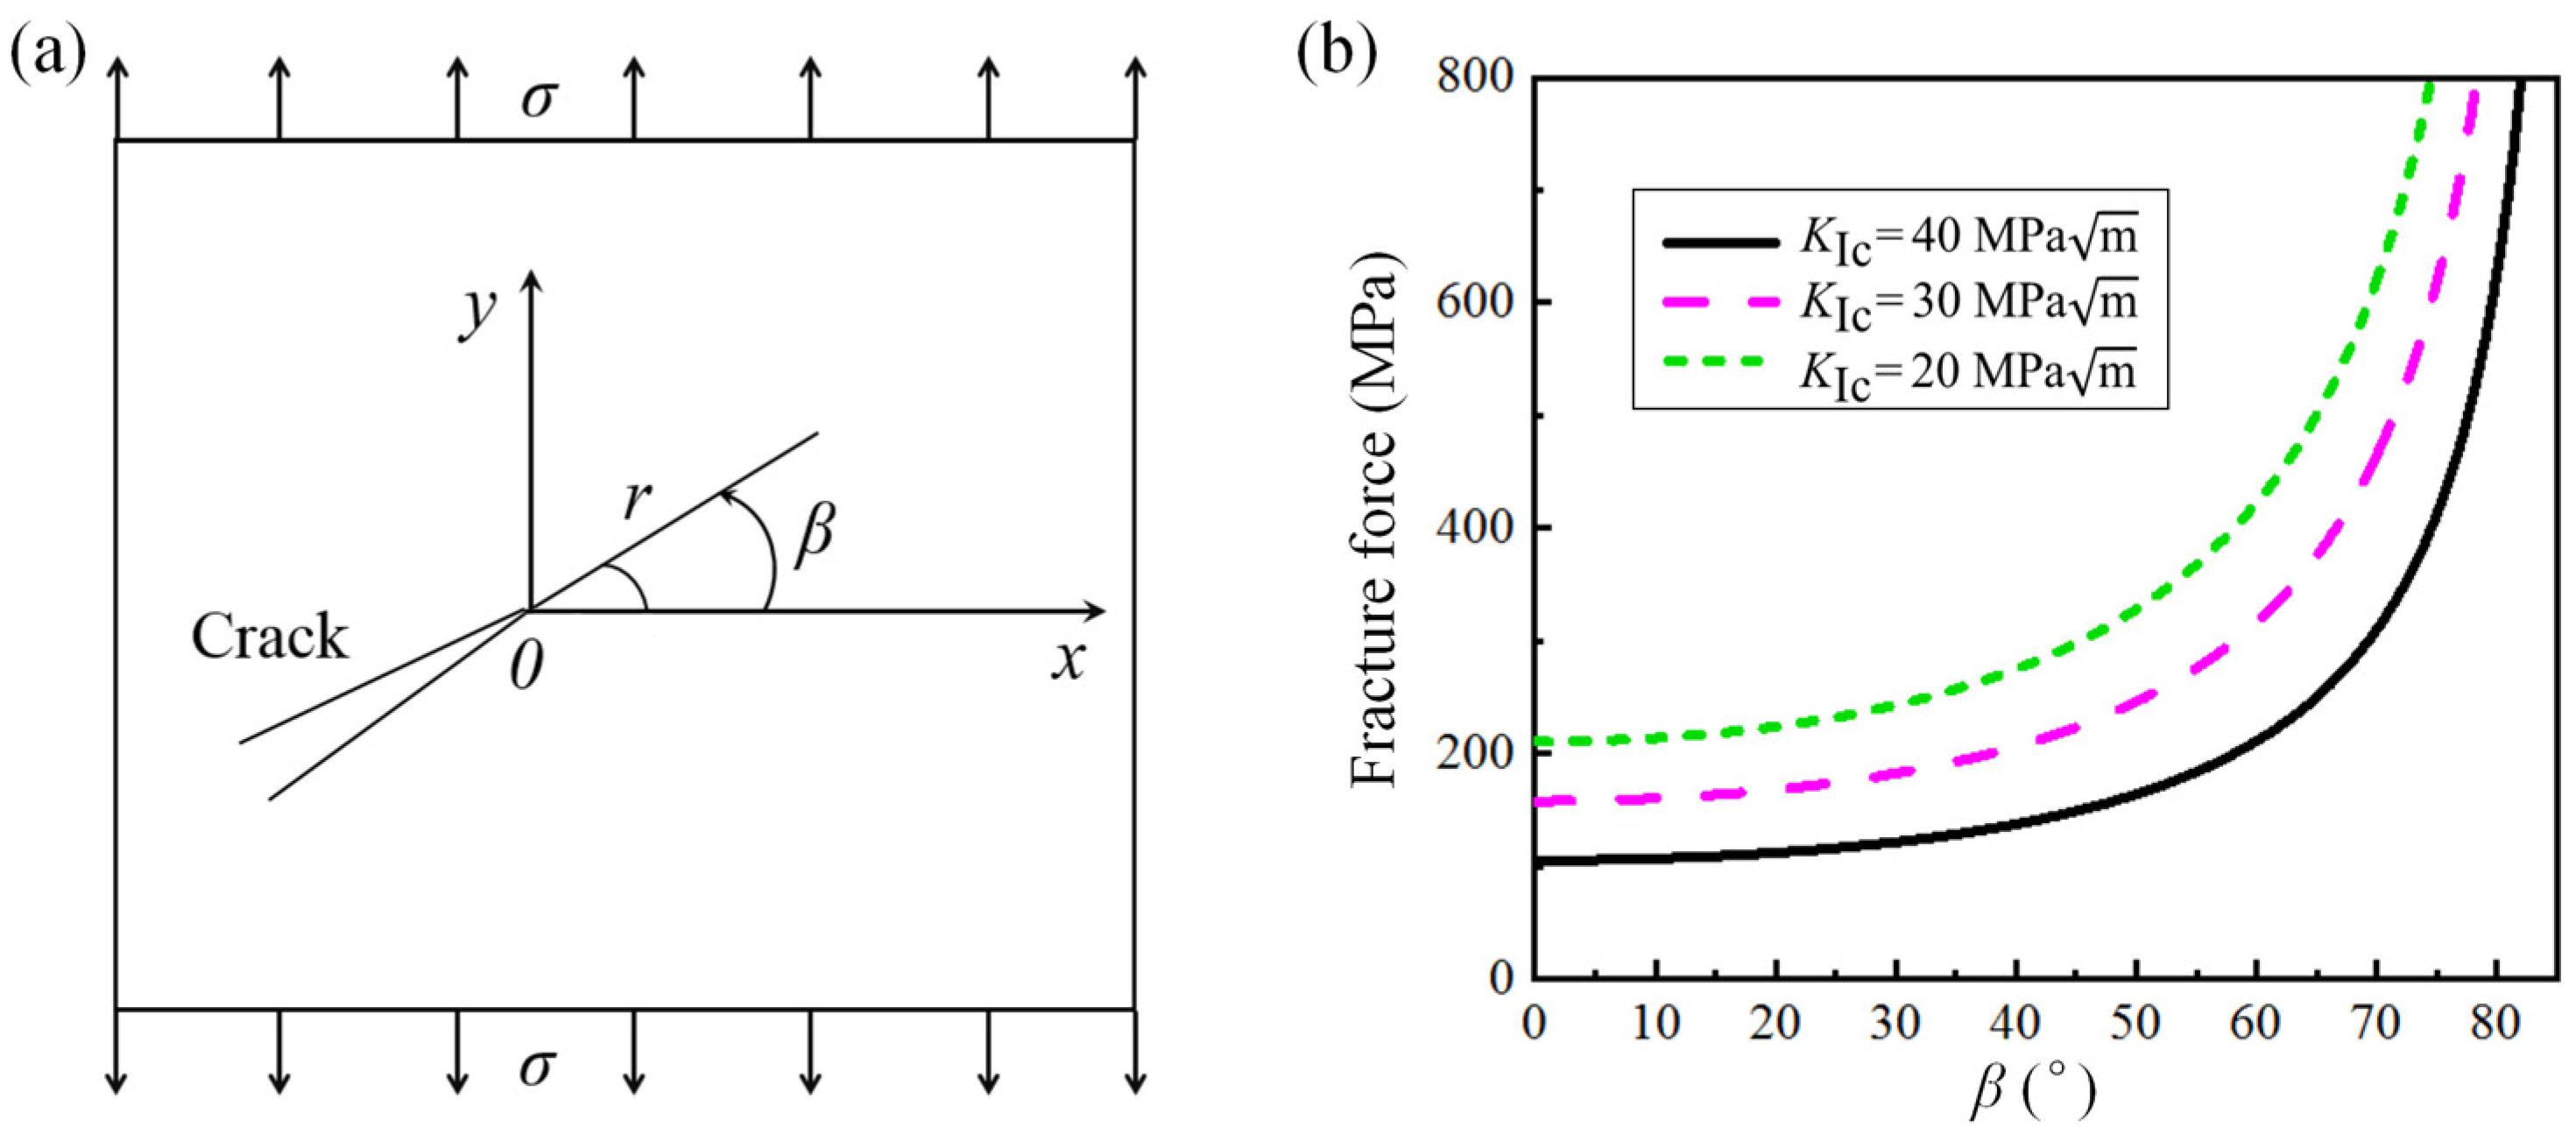
4.2. Toughening Enhancement by Locally Non-Uniform GS Distribution
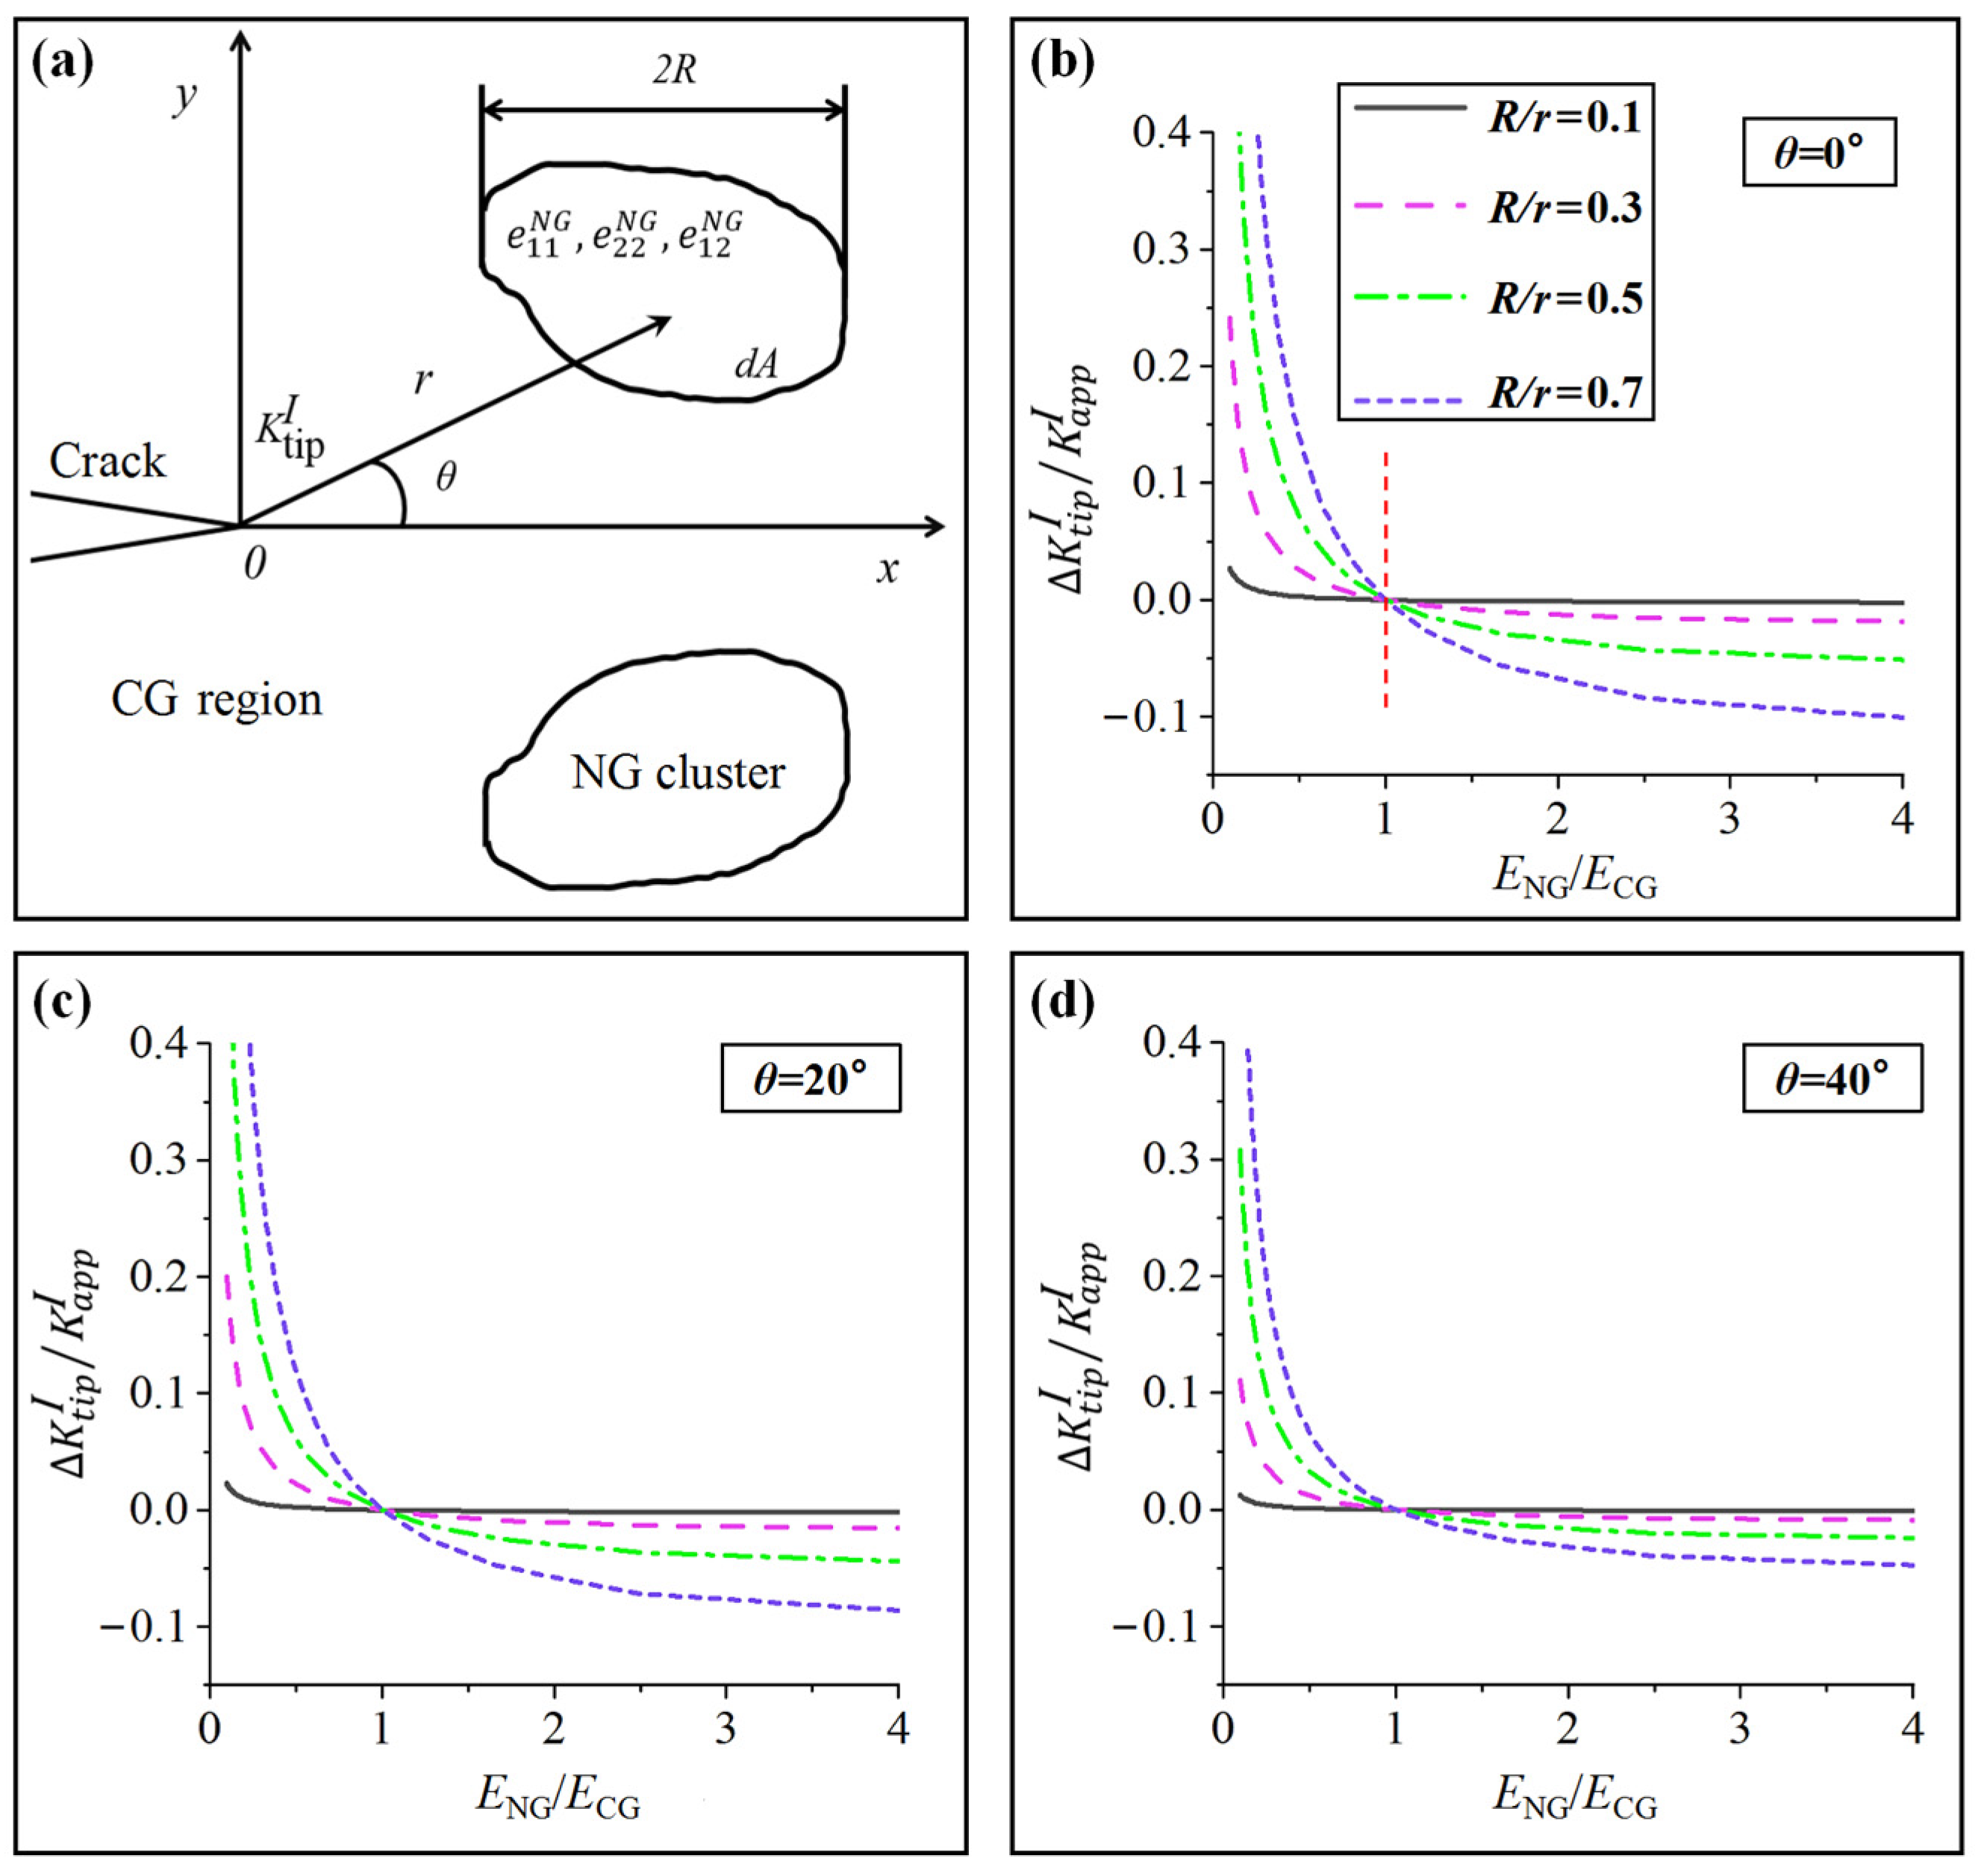
4.3. Toughening Enhancement by NG Clusters
5. Conclusions
- (1)
- The high degree of phase transition of coarse grains within the network greatly absorbs surface energy. In this case, both the radius of the phase transition zone, the strain of the core area, and the specific mechanical energy dissipation by PT are larger than any kind of normal distribution.
- (2)
- The deviation and tortuosity of the crack path, caused by high GS gradient and locally non-uniform GS distribution, result in a change in the crack mode from Type I to a composite mode, which increases the actual fracture stress.
- (3)
- The nanocrystalline clusters distributed at a small angle in front of the crack tip reduce the applied stress intensity factor due to their higher elastic modulus compared to the coarse-grained matrix in the network structure.
Supplementary Materials
Author Contributions
Funding
Data Availability Statement
Conflicts of Interest
References
- Silva, E.J.N.L.; Martins, J.N.R.; Lima, C.O.; Vieira, V.T.L.; Braz Fernandes, F.M.; De-Deus, G.; Versiani, M.A. Mechanical Tests, Metallurgical Characterization, and Shaping Ability of Nickel-Titanium Rotary Instruments: A Multimethod Research. J. Endod. 2020, 46, 1485–1494. [Google Scholar] [CrossRef]
- Kan, Q.; Zhang, Y.; Xu, Y.; Kang, G.; Yu, C. Tension-compression asymmetric functional degeneration of super-elastic NiTi shape memory alloy: Experimental observation and multiscale constitutive model. Int. J. Solids Struct. 2023, 280, 112384. [Google Scholar] [CrossRef]
- Xiang, Z.; Yang, Q.; Zhang, T.; Shen, X.; Hao, S.; Chen, J.; Huang, S. Tensile mechanical behavior of functionally graded NiTi alloy manufactured via laser powder bed fusion. Mater. Sci. Eng. A 2024, 914, 147119. [Google Scholar] [CrossRef]
- Cui, Y.; Zeng, X.; Tan, V.B.C.; Zhang, Z. Experimental and numerical studies of NiTi dynamic fracture behaviors under the impact loading. Int. J. Mech. Sci. 2022, 235, 107724. [Google Scholar] [CrossRef]
- Katanchi, B.; Choupani, N.; Khalil-Allafi, J.; Tavangar, R.; Baghani, M. Mixed-mode fracture of a superelastic NiTi alloy: Experimental and numerical investigations. Eng. Fract. Mech. 2018, 190, 273–287. [Google Scholar] [CrossRef]
- Voyiadjis, G.Z.; Bahrami, H.; Hoseini, S.H. Fracture analysis of shape memory alloy considering the effect of Ti-rich areas. Eng. Fail. Anal. 2023, 143, 106879. [Google Scholar] [CrossRef]
- Sidharth, R.; Stinville, J.C.; Sehitoglu, H. Fatigue and fracture of shape memory alloys in the nanoscale: An in-situ TEM study. Scr. Mater. 2023, 234, 115577. [Google Scholar] [CrossRef]
- Xie, G.; Wang, F.; Lai, X.; Xu, Z.; Zeng, X. Atomistic study on crystal orientation-dependent crack propagation and resultant microstructure anisotropy in NiTi alloys. Int. J. Mech. Sci. 2023, 250, 108320. [Google Scholar] [CrossRef]
- Gebretsadik, B.T.; Ali, A.N. Improving the fatigue strength of superelastic NiTi by using constrained groove pressing severe plastic deformation deform 3D modeling and microstructural analysis. Mater. Sci. Eng. A 2023, 885, 145628. [Google Scholar] [CrossRef]
- Yılmaz, K.; Uslu, G.; Gündoğar, M.; Özyürek, T.; Grande, N.M.; Plotino, G. Cyclic fatigue resistances of several nickel-titanium glide path rotary and reciprocating instruments at body temperature. Int. Endod. J. 2018, 51, 924–930. [Google Scholar] [CrossRef] [PubMed]
- Bhatt, A.; Rajkumar, B. A comparative evaluation of cyclic fatigue resistance for different endodontic NiTi rotary files: An in-vitro study. J. Oral Biol. Craniofacial Res. 2019, 9, 119–121. [Google Scholar] [CrossRef]
- Shariat, B.S.; Meng, Q.; Mahmud, A.S.; Wu, Z.; Bakhtiari, R.; Zhang, J.; Motazedian, F.; Yang, H.; Rio, G.; Nam, T.-h.; et al. Experiments on deformation behaviour of functionally graded NiTi structures. Data Brief 2017, 13, 562–568. [Google Scholar] [CrossRef]
- Ashbli, S.; Menzemer, C. On the Fatigue Behavior of Nanocrystalline NiTi Shape Memory Alloys: A Review. J. Nanomed. Nanotechnol. 2019, 10, 529. [Google Scholar] [CrossRef]
- dos Reis-Prado, A.H.; Abreu, L.G.; de Arantes, L.C.; dos Santos de Paula, K.; de Castro Oliveira, S.; Goto, J.; Viana, A.C.D.; Benetti, F. Influence of sodium hypochlorite on cyclic fatigue resistance of nickel–titanium instruments: A systematic review and meta-analysis of in vitro studies. Clin. Oral Investig. 2023, 27, 6291–6319. [Google Scholar] [CrossRef] [PubMed]
- Gangil, N.; Siddiquee, A.N.; Maheshwari, S. Towards applications, processing and advancements in shape memory alloy and its composites. J. Manuf. Process. 2020, 59, 205–222. [Google Scholar] [CrossRef]
- Yin, H.; He, Y.; Moumni, Z.; Sun, Q. Effects of grain size on tensile fatigue life of nanostructured NiTi shape memory alloy. Int. J. Fatigue 2016, 88, 166–177. [Google Scholar] [CrossRef]
- Kan, Q.; Qiu, B.; Zhang, X.; Yu, C.; Kang, G. Thermo-mechanically coupled functional fatigue of NiTi shape memory alloys under multiaxial cyclic loadings. Int. J. Fatigue 2023, 172, 107657. [Google Scholar] [CrossRef]
- Zhang, A.; Zhang, S.; Du, C.; Wu, F.; Li, C. Transformation pathway of NiTi shape memory alloy and its modulation based on grain size gradient: A molecular dynamics study. J. Mater. Res. Technol. 2024, 30, 3285–3296. [Google Scholar] [CrossRef]
- de Oliveira, H.M.R.; Louche, H.; Grassi, E.N.D.; Favier, D. Specific forward/reverse latent heat and martensite fraction measurement during superelastic deformation of nanostructured NiTi wires. Mater. Sci. Eng. A 2020, 774, 138928. [Google Scholar] [CrossRef]
- Chen, Y.; Molnárová, O.; Tyc, O.; Kadeřávek, L.; Heller, L.; Šittner, P. Recoverability of large strains and deformation twinning in martensite during tensile deformation of NiTi shape memory alloy polycrystals. Acta Mater. 2019, 180, 243–259. [Google Scholar] [CrossRef]
- Yu, C.; Kang, G.; Kan, Q. A micromechanical constitutive model for grain size dependent thermo-mechanically coupled inelastic deformation of super-elastic NiTi shape memory alloy. Int. J. Plast. 2018, 105, 99–127. [Google Scholar] [CrossRef]
- Yan, B.; Zhang, Y.; Jiang, S.; Yu, J.; Sun, D.; Tang, M. Mechanical properties and fracture mechanisms of martensitic NiTi shape memory alloy based on various thermomechanical-processing microstructures. J. Alloys Compd. 2021, 883, 160797. [Google Scholar] [CrossRef]
- Lu, M.; Wang, F.; Zeng, X.; Chen, W.; Zhang, J. Cohesive zone modeling for crack propagation in polycrystalline NiTi alloys using molecular dynamics. Theor. Appl. Fract. Mech. 2020, 105, 102402. [Google Scholar] [CrossRef]
- Nie, K.; Li, M.P.; Wu, W.P.; Sun, Q.P. Grain size-dependent energy partition in phase transition of NiTi shape memory alloys studied by molecular dynamics simulation. Int. J. Solids Struct. 2021, 221, 31–41. [Google Scholar] [CrossRef]
- Wang, F.; He, L.; Zeng, X.; Qi, Z.; Song, B.; Yang, X. Triaxial tension-induced damage behavior of nanocrystalline NiTi alloy and its dependence on grain size. J. Mater. Sci. Technol. 2021, 77, 90–99. [Google Scholar] [CrossRef]
- Hua, P.; Xia, M.; Onuki, Y.; Sun, Q. Nanocomposite NiTi shape memory alloy with high strength and fatigue resistance. Nat. Nanotechnol. 2021, 16, 409–413. [Google Scholar] [CrossRef]
- Zhang, Q.; Chen, J.; Fang, G. From mechanical behavior and elastocaloric effect to microscopic mechanisms of gradient-structured NiTi alloy: A phase-field study. Int. J. Plast. 2023, 171, 103809. [Google Scholar] [CrossRef]
- Peterlechner, M.; Waitz, T.; Gammer, C.; Antretter, T. Martensitic phase transformations of nanocrystalline NiTi shape memory alloys processed by repeated cold rolling. J. Mater. Res. 2011, 102, 634–642. [Google Scholar] [CrossRef]
- Hong, S.-H.; Park, H.-J.; Song, G.-A.; Kim, K.-B. Recent Developments in Ultrafine Shape Memory Alloys Using Amorphous Precursors. Materials 2023, 16, 7327. [Google Scholar] [CrossRef]
- Hong, S.H.; Park, H.J.; Song, G.; Liaw, P.K.; Kim, K.B. Ultrafine shape memory alloys synthesized using a metastable metallic glass precursor with polymorphic crystallization. Appl. Mater. Today 2021, 22, 100961. [Google Scholar] [CrossRef]
- Xu, B.; Yu, C.; Kang, G. Phase field study on the microscopic mechanism of grain size dependent cyclic degradation of super-elasticity and shape memory effect in nano-polycrystalline NiTi alloys. Int. J. Plast. 2021, 145, 103075. [Google Scholar] [CrossRef]
- Shi, X.B.; Guo, F.M.; Zhang, J.S.; Ding, H.L.; Cui, L.S. Grain size effect on stress hysteresis of nanocrystalline NiTi alloys. J. Alloys Compd. 2016, 688, 62–68. [Google Scholar] [CrossRef]
- Chen, J.; Yin, H.; Sun, Q. Effects of grain size on fatigue crack growth behaviors of nanocrystalline superelastic NiTi shape memory alloys. Acta Mater. 2020, 195, 141–150. [Google Scholar] [CrossRef]
- Hasan, M.M.; Baxevanis, T. Structural fatigue and fracture of shape memory alloy actuators: Current status and perspectives. J. Intell. Mater. Syst. Struct. 2021, 33, 1475–1486. [Google Scholar] [CrossRef]
- Baxevanis, T.; Lagoudas, D.C. Fracture mechanics of shape memory alloys: Review and perspectives. Int. J. Fract. 2015, 191, 191–213. [Google Scholar] [CrossRef]
- Ahadi, A.; Sun, Q. Grain size dependence of fracture toughness and crack-growth resistance of superelastic NiTi. Scr. Mater. 2016, 113, 171–175. [Google Scholar] [CrossRef]
- Leitner, T.; Sabirov, I.; Pippan, R.; Hohenwarter, A. The effect of severe grain refinement on the damage tolerance of a superelastic NiTi shape memory alloy. J. Mech. Behav. Biomed. Mater. 2017, 71, 337–348. [Google Scholar] [CrossRef] [PubMed]
- Xie, G.; Wang, F.; Song, B.; Cheng, J.; Wang, J.; Zeng, X. Grain size dependence of cracking performance in polycrystalline NiTi alloys. J. Alloys Compd. 2021, 884, 161132. [Google Scholar] [CrossRef]
- Bhardwaj, A.; Ojha, M.; Garudapalli, A.; Gupta, A.K. Microstructural, mechanical and strain hardening behaviour of NiTi alloy subjected to constrained groove pressing and ageing treatment. J. Mater. Process. Technol. 2021, 294, 117132. [Google Scholar] [CrossRef]
- Luo, J.; Ye, W.; Ma, X.; Bobanga, J.O.; Lewandowski, J.J. The evolution and effects of second phase particles during hot extrusion and re-extrusion of a NiTi shape memory alloy. J. Alloys Compd. 2018, 735, 1145–1151. [Google Scholar] [CrossRef]
- Peterlechner, M.; Waitz, T.; Karnthaler, H.P. Nanocrystallization of NiTi shape memory alloys made amorphous by high-pressure torsion. Scr. Mater. 2008, 59, 566–569. [Google Scholar] [CrossRef]
- Peterlechner, M.; Waitz, T.; Karnthaler, H.P. Nanoscale amorphization of severely deformed NiTi shape memory alloys. Scr. Mater. 2009, 60, 1137–1140. [Google Scholar] [CrossRef]
- Khalil-Allafi, J.; Daneshvar, H.; Safavi, M.S.; Khalili, V. A survey on crystallization kinetic behavior of direct current magnetron sputter deposited NiTi thin films. Phys. B Condens. Matter 2021, 615, 413086. [Google Scholar] [CrossRef]
- Inaekyan, K.; Brailovski, V.; Prokoshkin, S.; Korotitskiy, A.; Glezer, A. Characterization of amorphous and nanocrystalline Ti–Ni-based shape memory alloys. J. Alloys Compd. 2009, 473, 71–78. [Google Scholar] [CrossRef]
- Peterlechner, M.; Bokeloh, J.; Wilde, G.; Waitz, T. Study of relaxation and crystallization kinetics of NiTi made amorphous by repeated cold rolling. Acta Mater. 2010, 58, 6637–6648. [Google Scholar] [CrossRef]
- Salwa, P.; Goryczka, T. Crystallization of Mechanically Alloyed Ni50Ti50 and Ti50Ni25Cu25 Shape Memory Alloys. J. Mater. Eng. Perform. 2020, 29, 2848–2852. [Google Scholar] [CrossRef]
- Chu, K.; Wang, B.; Li, Q.; Onuki, Y.; Ren, F. Grain size effect on the temperature-dependence of elastic modulus of nanocrystalline NiTi. J. Alloys Compd. 2023, 934, 167907. [Google Scholar] [CrossRef]
- Alsawalhi, M.Y.; Landis, C.M. On the fracture toughness of shape memory alloys. Int. J. Fract. 2022, 236, 201–218. [Google Scholar] [CrossRef]
- Luo, J.; He, J.; Wan, X.; Dong, T.; Cui, Y.; Xiong, X. Fracture properties of polycrystalline NiTi shape memory alloy. Mater. Sci. Eng. A 2016, 653, 122–128. [Google Scholar] [CrossRef]
- LePage, W.S.; Ahadi, A.; Lenthe, W.C.; Sun, Q.-P.; Pollock, T.M.; Shaw, J.A.; Daly, S.H. Grain size effects on NiTi shape memory alloy fatigue crack growth. J. Mater. Res. 2018, 33, 91–107. [Google Scholar] [CrossRef]
- Feng, K.; Zhang, B.; Shen, X.; Yi, Y.; Jin, H. Research on the influence of differential speed ratio on the microstructure and properties of 316L/Ni/EH40 composite plate by asymmetrical rolling. Mater. Today Commun. 2023, 37, 107431. [Google Scholar] [CrossRef]
- Guo, X.; Ren, Z.; Chai, Z.; Wang, T.; Huang, Q. Research on microstructure and mechanical properties of TC4/304 clad plates by asymmetric rolling with local strong stress. Mater. Sci. Eng. A 2024, 893, 146166. [Google Scholar] [CrossRef]
- Sun, D.; Jiang, S.; Zhang, Y.; Yan, B.; Yu, J. Influence of annealing on incomplete detwinning and deformation twinning in equiatomic NiTi shape memory alloy undergoing severe plastic deformation. J. Alloys Compd. 2021, 871, 159550. [Google Scholar] [CrossRef]
- Anderson, T.L. Fracture Mechanics: Fundamentals and Applications; CRC Press: Boca Raton, FL, USA, 2005. [Google Scholar]
- Haghgouyan, B.; Hayrettin, C.; Baxevanis, T.; Karaman, I.; Lagoudas, D.C. Fracture toughness of NiTi–Towards establishing standard test methods for phase transforming materials. Acta Mater. 2019, 162, 226–238. [Google Scholar] [CrossRef]
- Huang, K.; Sun, Q.; Yu, C.; Yin, H. Deformation behaviors of gradient nanostructured superelastic NiTi shape memory alloy. Mater. Sci. Eng. A 2020, 786, 139389. [Google Scholar] [CrossRef]
- Deng, Z.; Huang, K.; Yin, H.; Sun, Q. Temperature-dependent mechanical properties and elastocaloric effects of multiphase nanocrystalline NiTi alloys. J. Alloys Compd. 2023, 938, 168547. [Google Scholar] [CrossRef]
- Ahadi, A.; Sun, Q. Stress-induced nanoscale phase transition in superelastic NiTi by in situ X-ray diffraction. Acta Mater. 2015, 90, 272–281. [Google Scholar] [CrossRef]
- Cao, R.; Yu, Q.; Pan, J.; Lin, Y.; Sweet, A.; Li, Y.; Ritchie, R.O. On the exceptional damage-tolerance of gradient metallic materials. Mater. Today 2020, 32, 94–107. [Google Scholar] [CrossRef]
- Freed, Y.; Banks-Sills, L. Crack growth resistance of shape memory alloys by means of a cohesive zone model. J. Mech. Phys. Solids 2007, 55, 2157–2180. [Google Scholar] [CrossRef]
- Sun, Q.; Xu, X. Pseudoelastic toughening of a shock-resistant composite with transformable reinforcement. Mater. Sci. 1995, 30, 439–447. [Google Scholar] [CrossRef]
- Xia, M.; Liu, P.; Sun, Q. Grain size dependence of Young’s modulus and hardness for nanocrystalline NiTi shape memory alloy. Mater. Lett. 2018, 211, 352–355. [Google Scholar] [CrossRef]

| Category | Sample | Transformation Stress (MPa) | Yield Stress (MPa) | Transformation Strain (%) | Fracture Force (N) | KIC () | KJIC () |
|---|---|---|---|---|---|---|---|
| Normal | N1 | N/A | N/A | N/A | 785 | 20.5 | N/A |
| N2 | N/A | N/A | N/A | 908 | 23.7 | N/A | |
| N3 | 559 | 2180 | 2.0 | 1178 | 30.7 | N/A | |
| N4 | 535 | 1669 | 2.9 | 1156 | 28.8 | N/A | |
| N5 | 460 | 1536 | 4.1 | 1446 | N/A | 47.3 | |
| N6 | 433 | 1247 | 6.2 | 1753 | N/A | 59.9 | |
| N7 | 292 | 1153 | 6.6 | 1994 | N/A | 67.2 | |
| N8 | 287 | 1125 | 6.5 | 2044 | N/A | 75.3 | |
| Unidirectional gradient | GL | N/A | N/A | N/A | 800 | 20.8 | N/A |
| GR | N/A | N/A | N/A | 980 | 25.5 | N/A | |
| Locally high gradient | HG1 | 380 | 1178 | 6.4 | 2256 | N/A | 82.8 |
| HG2 | 377 | 1103 | 6.6 | 2363 | N/A | 84.5 |
Disclaimer/Publisher’s Note: The statements, opinions and data contained in all publications are solely those of the individual author(s) and contributor(s) and not of MDPI and/or the editor(s). MDPI and/or the editor(s) disclaim responsibility for any injury to people or property resulting from any ideas, methods, instructions or products referred to in the content. |
© 2025 by the authors. Licensee MDPI, Basel, Switzerland. This article is an open access article distributed under the terms and conditions of the Creative Commons Attribution (CC BY) license (https://creativecommons.org/licenses/by/4.0/).
Share and Cite
Huang, K.; Deng, Z.; Yin, H. Enhancement of Fracture Toughness of NiTi Alloy by Controlling Grain Size Gradient. Nanomaterials 2025, 15, 125. https://doi.org/10.3390/nano15020125
Huang K, Deng Z, Yin H. Enhancement of Fracture Toughness of NiTi Alloy by Controlling Grain Size Gradient. Nanomaterials. 2025; 15(2):125. https://doi.org/10.3390/nano15020125
Chicago/Turabian StyleHuang, Kai, Zhongzheng Deng, and Hao Yin. 2025. "Enhancement of Fracture Toughness of NiTi Alloy by Controlling Grain Size Gradient" Nanomaterials 15, no. 2: 125. https://doi.org/10.3390/nano15020125
APA StyleHuang, K., Deng, Z., & Yin, H. (2025). Enhancement of Fracture Toughness of NiTi Alloy by Controlling Grain Size Gradient. Nanomaterials, 15(2), 125. https://doi.org/10.3390/nano15020125