Article

Dry Reforming of Methane Using Gd-promoted Ni/SBA-16 Catalyst: Structure, Activity and Process Optimization with Response Surface Methodology

by
Salma A. Al-Zahrani
1,2,*,
Mohammed F. Alotibi
3,*,
Ahmed I. Osman
4,
Ahmed A. Bhran
5,
Maha Awjan Alreshidi
1,2,
Ahmed Al Otaibi
1,2,
Hessah Difallah A. Al-Enazy
1,2,
Nuha Othman S. Alsaif
1,2 and
Ahmed S. Al-Fatesh
6,*
1
Chemistry Department, Faculty of Science, University of Ha’il, P.O. Box 2440, Ha’il 81451, Saudi Arabia
2
Scientific and Engineering Research Center, University of Ha’il, Ha’il 2440, Saudi Arabia
3
Institute of Refining and Petrochemicals Technologies, King Abdulaziz City for Science and Technology (KACST), P.O. Box 6086, Riyadh 11442, Saudi Arabia
4
School of Sciences, Psychology, Arts and Humanities, Computing, Engineering & Sports, Canterbury Christ Church University, Canterbury CT1 1QU, UK
5
Chemical Engineering Department, College of Engineering, Imam Mohammad Ibn Saud Islamic University (IMSIU), Riyadh 11432, Saudi Arabia
6
Chemical Engineering Department, College of Engineering, King Saud University, P.O. Box 800, Riyadh 11421, Saudi Arabia
*
Authors to whom correspondence should be addressed.
Nanomaterials 2025, 15(19), 1527; https://doi.org/10.3390/nano15191527
Submission received: 12 September 2025 / Revised: 30 September 2025 / Accepted: 3 October 2025 / Published: 6 October 2025

Abstract

This work examines the effect of gadolinium (Gd) promotion on nickel-based SBA-16 catalysts for the dry reforming of methane (DRM), with the goal of improving syngas production by optimizing catalyst composition and operating conditions. Catalysts with varying Gd loadings (0.5–3 wt.%) were synthesised using co-impregnation. XRD, N2 physisorption, FTIR, XPS, and H2-TPR–CO2-TPD–H2-TPR were used to examine the structural features, textural properties, surface composition, and redox behaviour of the catalysts. XPS indicated formation of enhanced metal–support interactions, while initial and post-treatment H2–TPR analyses showed that moderate Gd loadings (1–2 wt.%) maintained a balanced distribution of reducible Ni species. The catalysts were tested for DRM performance at 800 °C and a gas hourly space velocity (GHSV) of 42,000 mL g−1 h−1. 1–2 wt.% Gd-promoted catalysts achieved the highest H2 (~67%) and CO yield (~76%). Response surface methodology (RSM) was used to identify optimal reaction conditions for maximum H2 yield. RSM predicted 848.9 °C temperature, 31,283 mL g−1 h−1 GHSV, and a CH4/CO2 ratio of 0.61 as optimal, predicting a H2 yield of 96.64%, which closely matched the experimental value of H2 yield (96.66%). The 5Ni–2Gd/SBA-16 catalyst exhibited minimal coke deposition, primarily of a graphitic character, as evidenced by TGA–DSC and Raman analyses. These results demonstrate the synergy between catalyst design and process optimization in maximizing DRM efficiency.

1. Introduction

Hydrogen (H2) is widely recognised as a cornerstone of the clean energy transition, due to its zero carbon emissions and versatility across both industrial and energy sectors. Current global H2 demand reached more than 97 million tonnes per year in 2023 [1]. The major processes for H2 production include steam methane reforming, electrolysis, and biomass gasification [2]. H2 must be produced through sustainable pathways to make a significant contribution to the global energy transition [3]. Dry reforming of methane (DRM) is an effective process that reduces two major greenhouse gases, i.e., carbon dioxide (CO2) and methane (CH4), while producing a mixture of carbon monoxide (CO) and H2, a valuable syngas stream [4,5]. The DRM reaction is represented as:
C H 4 + C O 2 2 C O + 2 H 2                 Δ H 298 k o = 247.3   k J · m o L 1
One of the key benefits of DRM is that it produces syngas with an H2:CO ratio close to 1:1, which supports the stoichiometric requirements of processes including Fischer–Tropsch synthesis and methanol production, and can be further processed to obtain high-purity H2 [6]. DRM is a highly endothermic reaction and typically needs high temperatures (700–900 °C) to achieve significant conversions [7]. Under such conditions, the conventional catalysts are prone to deactivation via sintering of metal particles and deposition of carbonaceous species, resulting in a gradual decline in activity [8].
Ni-based catalysts are commonly used in DRM due to their relatively low cost, high intrinsic activity for CH4 and CO2 activation, and industrial scalability. However, their performance can be significantly enhanced using suitable supports and promoters [9]. An ideal support should have a high surface area for Ni dispersion, thermal stability under DRM conditions, and regulate the redox properties of the catalyst system [10]. Silica-based supports have gained attention due to their surface area, ease of surface modification, and inert nature. SBA-16 is a 3D mesoporous silica material characterized by its cage-like pores. It has emerged as a promising support for Ni-based catalysts in recent years. Its structure offers good thermal stability and allows uniform dispersion of active metal nanoparticles, which are essential for DRM [11,12].
Promoters are added to catalysts to enhance their stability, activity, and resistance to deactivation. The structure of SBA-16 is reported to synergize effectively with redox promoters, particularly with rare-earth metals, to enhance catalytic performance and stability. In the study by Zhang et al. (2013), the cerium-promoted Ni/SBA-16 achieved high conversions and catalyst stability over 100 h [13]. Huo et al. (2017) modified SBA-16 via ammonia nitridation and reported that N incorporation improved Lewis basicity and metal–support interaction and resulted in higher activity compared to unpromoted Ni/SBA-16 [14]. Taherian et al. (2021) studied Ni/SBA-16 systems promoted with yttrium, cerium, and lanthanum over MgO-modified SBA-16 and observed enhanced CO2 activation, improved metal dispersion, and reduced coke formation [11]. Among the rare-earth elements, Gadolinium (Gd) is known for its high capacity for oxygen storage, strong redox behaviour, and its capability to form thermally stable oxides [15]. The promotional effects of Gd are studied across various catalyst supports. The Gd loadings on Ni/MCM-41 improved CH4 and CO2 conversions up to ~87% and ~91%, respectively, even at 0.1 wt.% loading. Catalysts maintained a H2/CO ratio of ~1 by enhancing Ni dispersion and generating surface oxygen vacancies [16]. Similarly, Zhang et al. showed that promotion of Gd to mesoporous Ni/Al2O3-CeO2 catalysts enhanced the catalytic stability over prolonged operation [17]. Fakeeha et al. (2023) in their studies demonstrated that Gd-promoted Ni/YZr catalysts achieved high H2 yield [15,18]. These studies emphasized that the Gd promoter can effectively improve the activity of Ni-based catalysts with various supports.
In addition to proper catalyst design, optimizing operating conditions is essential to bridge the gap between experimental DRM performance and practical, industrial applications. Response Surface Methodology (RSM) is a statistical method that allows systematic evaluation of multiple operating variables and their interactions, enabling the identification of optimum conditions with fewer experiments [19]. RSM is generally applied to balance operating feed ratio, temperature, and gas hourly space velocity (GHSV) to optimize performance parameters in DRM [20].
Although Ni catalysts, SBA-16 supports, and rare-earth promoters have been investigated individually, the combined effect of Gd incorporation into Ni/SBA-16 systems remains unexplored. The present work addresses this gap by systematically examining how Gd influences the structural and redox properties of Ni/SBA-16 and correlating these changes with catalytic performance in DRM. Gd-promoted Ni/SBA-16 catalysts with varying Gd loadings (0.5–3 wt.%) were synthesized via co-impregnation. Catalytic activity was evaluated in terms of H2, CO yields, and H2/CO ratio under DRM conditions at 800 °C and a GHSV of 42,000 mLg−1 h−1. The novelty of this work lies in integrating Gd-promoted Ni/SBA-16 catalysts with RSM-based process optimization for DRM. This approach may provide a statistical understanding of how reaction parameters influence catalyst properties and offer a predictive framework for identifying operating conditions that maximize H2 and CO yields.

2. Materials and Methods

2.1. Materials

Ni (NO3)2.6H2O (Nickel nitrate; 98%, Alfa Aesar); Gd (NO3)3.6H2O (Gadolinium nitrate; 98%, Alfa Aesar); SBA-16 (99.9%, Sigma-Aldrich, Darmstadt, Germany), and distilled water are used to prepare catalysts.

2.2. Catalyst Synthesis

A one-step wet impregnation process was used to prepare the Ni+xGd/SBA-16 catalysts. First, the solution was prepared by dissolving different amounts of Gd (NO3)3 6H2O (to obtain 0, 0.5, 1, 2, and 3 wt.% Gd) and a calculated amount of Ni (NO3)2 6H2O for a final loading of 5 wt.%. Ni in 30 mL of water. The SBA-16 support was subsequently impregnated with this mixture. Stirring was maintained until the liquid evaporated and the mixture thickened into a paste, ensuring uniform distribution of metal precursors. The prepared samples were dried at 120 °C for 12 h, followed by calcination in air at 600 °C for 3 h (heating rate 10 °C min−1) to obtain the final catalysts. The catalysts were designated as 5Ni+xGd/SBA-16, where x indicates the wt.% of Gd.

2.3. Catalyst Characterization Description

Catalyst characterization details are given in the Supplementary Material (S1).

2.4. Catalyst Evaluation

Catalytic testing for DRM was conducted in a stainless steel fixed-bed tubular reactor (PID Eng & Tech micro-activity reactor, Madrid, Spain) with an internal diameter of 0.94 cm and a length of 30 cm. A 0.1 g portion of undiluted catalyst powder was positioned over a glass wool plug inside the reactor, with a thermocouple placed in direct contact with the catalyst bed to monitor temperature. Before the reaction, the catalyst was reduced in a H2 flow (30 mL min−1) at 700 °C for 1 h. The reactor was then purged with nitrogen (20 mL min−1) to remove residual H2, and GC measurements confirmed its absence while heating to 800 °C under nitrogen flow. The DRM reaction was carried out at 1 bar with a CH4/CO2/N2 feed ratio of 3:3:1 (corresponding to 30, 30, and 10 mL min−1, respectively), giving a total flow of 70 mL min−1 and a GHSV of 42,000 mLg−1 h−1. Product analysis was performed using an online gas chromatograph (Shimadzu GC-2014, Shimadzu Corporation, Tokyo, Japan) equipped with molecular sieve and Porapak Q columns in combination with a thermal conductivity detector (TCD). The H2 yield, CO yield, and H2/CO were calculated using following equations:
H 2 Y i e l d ( % ) = m o l   o f   H 2   p r o d u c e d 2 × m o l   o f   C H 4   f e d × 100
C O   Y i e l d ( % ) = m o l   o f   C O   p r o d u c e d m o l   o f   C H 4   f e d + m o l   o f   C O 2   f e d × 100
H 2 C O r a t i o = m o l   o f   H 2   p r o d u c e d m o l   o f   C O   p r o d u c e d

2.5. Experimental Design and Modelling Approach

2.5.1. Central Composite Design (CCD)

Central Composite Design (CCD) is a widely used statistical design under the RSM framework that combines factorial runs, axial (star) points, and center points to model both linear and quadratic effects. This design enables efficient estimation of curvature, interactions among process variables, and provides rotatability, which ensures uniform prediction variance across the experimental space [21,22]. Due to these advantages, CCD has been extensively applied in the optimization of catalytic processes where nonlinear effects are expected. CCD was used to study the individual and interactive effects of GHSV, reaction temperature, and the molar ratio of CH4/CO2. The design included three types of runs. First, eight factorial points (23 full factorial) were set at the low (−1) and high (+1) coded levels of each factor (Table 1).
Six axial points were added along each factor’s axis at a distance (α) of approximately 1.682 from the centre to capture the non-linear, quadratic effects required for a second-order model, thus ensuring rotatability and uniform prediction variance. Three replicate centre points were included, with all factors set at their midpoint (coded level 0), to evaluate experimental error and identify curvature in the response surface. The factor ranges were standardized by taking the midpoint of each factor as the central value, with deviations used to define variation limits, thereby improving the interpretability of the regression. The complete experimental design matrix is presented in Table 2.

2.5.2. Quadratic Polynomial Regression Model

A second-order polynomial regression model was employed to describe the relationship between the input variables and the response. Higher-order models (e.g., cubic) were not chosen to avoid overfitting and unnecessary complexity. The general form of the quadratic regression model is expressed as:
Y ^ = β 0 + i = 1 3 β i X i + i = 1 3 β i i X i 2 + i = 1 2 j = i + 1 3 β i j X i X j + ε
here Y ^ is the predicted response, Xi and Xj are the coded input variables, β0 is the intercept, βi are the linear coefficients, βii are the quadratic coefficients (capturing curvature), βij are the interaction coefficients (accounting for combined effects), and ε is the random error term.

2.5.3. Model Validation and Analysis

The adequacy of the model was assessed using analysis of variance (ANOVA). Model quality was assessed through R2, adjusted R2, and p-values, with terms having p < 0.05 considered statistically significant at the 95% confidence level. Residual analysis was conducted to verify assumptions of normality, independence, and constant variance. Predictive accuracy was confirmed by comparing experimental and predicted values, with correlations illustrated in parity plots.

3. Results and Discussion

3.1. Catalyst Characterization Results

3.1.1. X-Ray Diffraction (XRD) Analysis

XRD patterns of the reduced 5Ni+xGd/SBA-16 (x = 0, 0.5, 1, 2, 3 wt.%) are presented in Figure 1.
It is observed from Figure 1 that all catalysts exhibited a diffuse hump in the 2θ range of 15–30° corresponding to amorphous silica from the support SBA-16 [23]. All catalyst samples exhibited three distinct diffraction peaks at 2θ ≈ 44.5°, 51.8°, and 76.3°, corresponding to the (111), (200), and (220) planes, respectively, for metallic Ni0 (face-centred cubic) (reference PDF No. 00-004-0850). In the unpromoted 5Ni/SBA-16 sample, the Ni0 peaks are comparatively sharp and intense. However, a slight decrease in peak intensity can be observed upon Gd addition, indicating the formation of smaller Ni crystallites and their improved dispersion [24]. No distinct diffraction peaks corresponding to Gd were observed in the 2θ range of (e.g., ~29°, 33°, 47.5°, 56°), suggesting Gd species are highly dispersed, amorphous, or below the detection limits.

3.1.2. N2 Adsorption–Desorption Isotherms

The N2 adsorption–desorption isotherms of 5Ni+xGd/SBA-16 (x = 0, 0.5, 1, 2, 3 wt.%) are depicted in Figure 2a. The associated pore size distribution curves are presented in Figure 2b. All 5Ni+xGd/SBA-16 catalysts exhibited type IV isotherms with H2(b) hysteresis loop (H2(b) being the IUPAC classification for loops typically associated with cage-like mesoporous structures or ‘ink-bottle’ pores). Figure 2a characteristic of mesoporous materials with cage–like pores and interconnected networks, as in SBA-16. The corresponding BJH pore size distribution curves (Figure 2b) show narrow, symmetric peaks centred in the mesopore range (5–6 nm), with no significant broadening or shift upon Gd addition. This indicated the preservation of the ordered mesoporous structure of SBA-16 after Ni and Gd incorporation [25].

3.1.3. FTIR Analysis

The FTIR spectrum of fresh 5Ni+xGd/SBA-16 catalysts (Figure S1, Supplementary Information) showed typical characteristic vibrations of the SiO2 framework and surface hydroxyl groups. The strong band observed around 1080–1250 cm−1 corresponds to the asymmetric stretching of Si–O–Si bonds. A medium-intensity band near ~800 cm−1 is assigned to the symmetric stretching of Si–O–Si, while the weak band around 460–470 cm−1 corresponds to Si–O–Si bending modes [26].
Surface hydroxyl groups are indicated by a sharp band at ~3745 cm−1, attributed to isolated silanol (Si–OH) groups, and a broad band between 3200–3650 cm−1 due to hydrogen-bonded –OH groups or adsorbed water. Additionally, the -OH bending mode appeared as a weak band near 1630 cm–1. The presence of silanol groups on the surface suggested potential sites for functionalization or metal anchoring, while the characteristic Si–O–Si bands confirmed that the mesoporous silica framework is preserved after calcination during catalyst synthesis. No distinct peaks of NiO or Gd2O3 were observed due to overlapping and masking from SiO2 peaks [27].

3.1.4. X-Ray Photoelectron Spectroscopy (XPS) Analysis

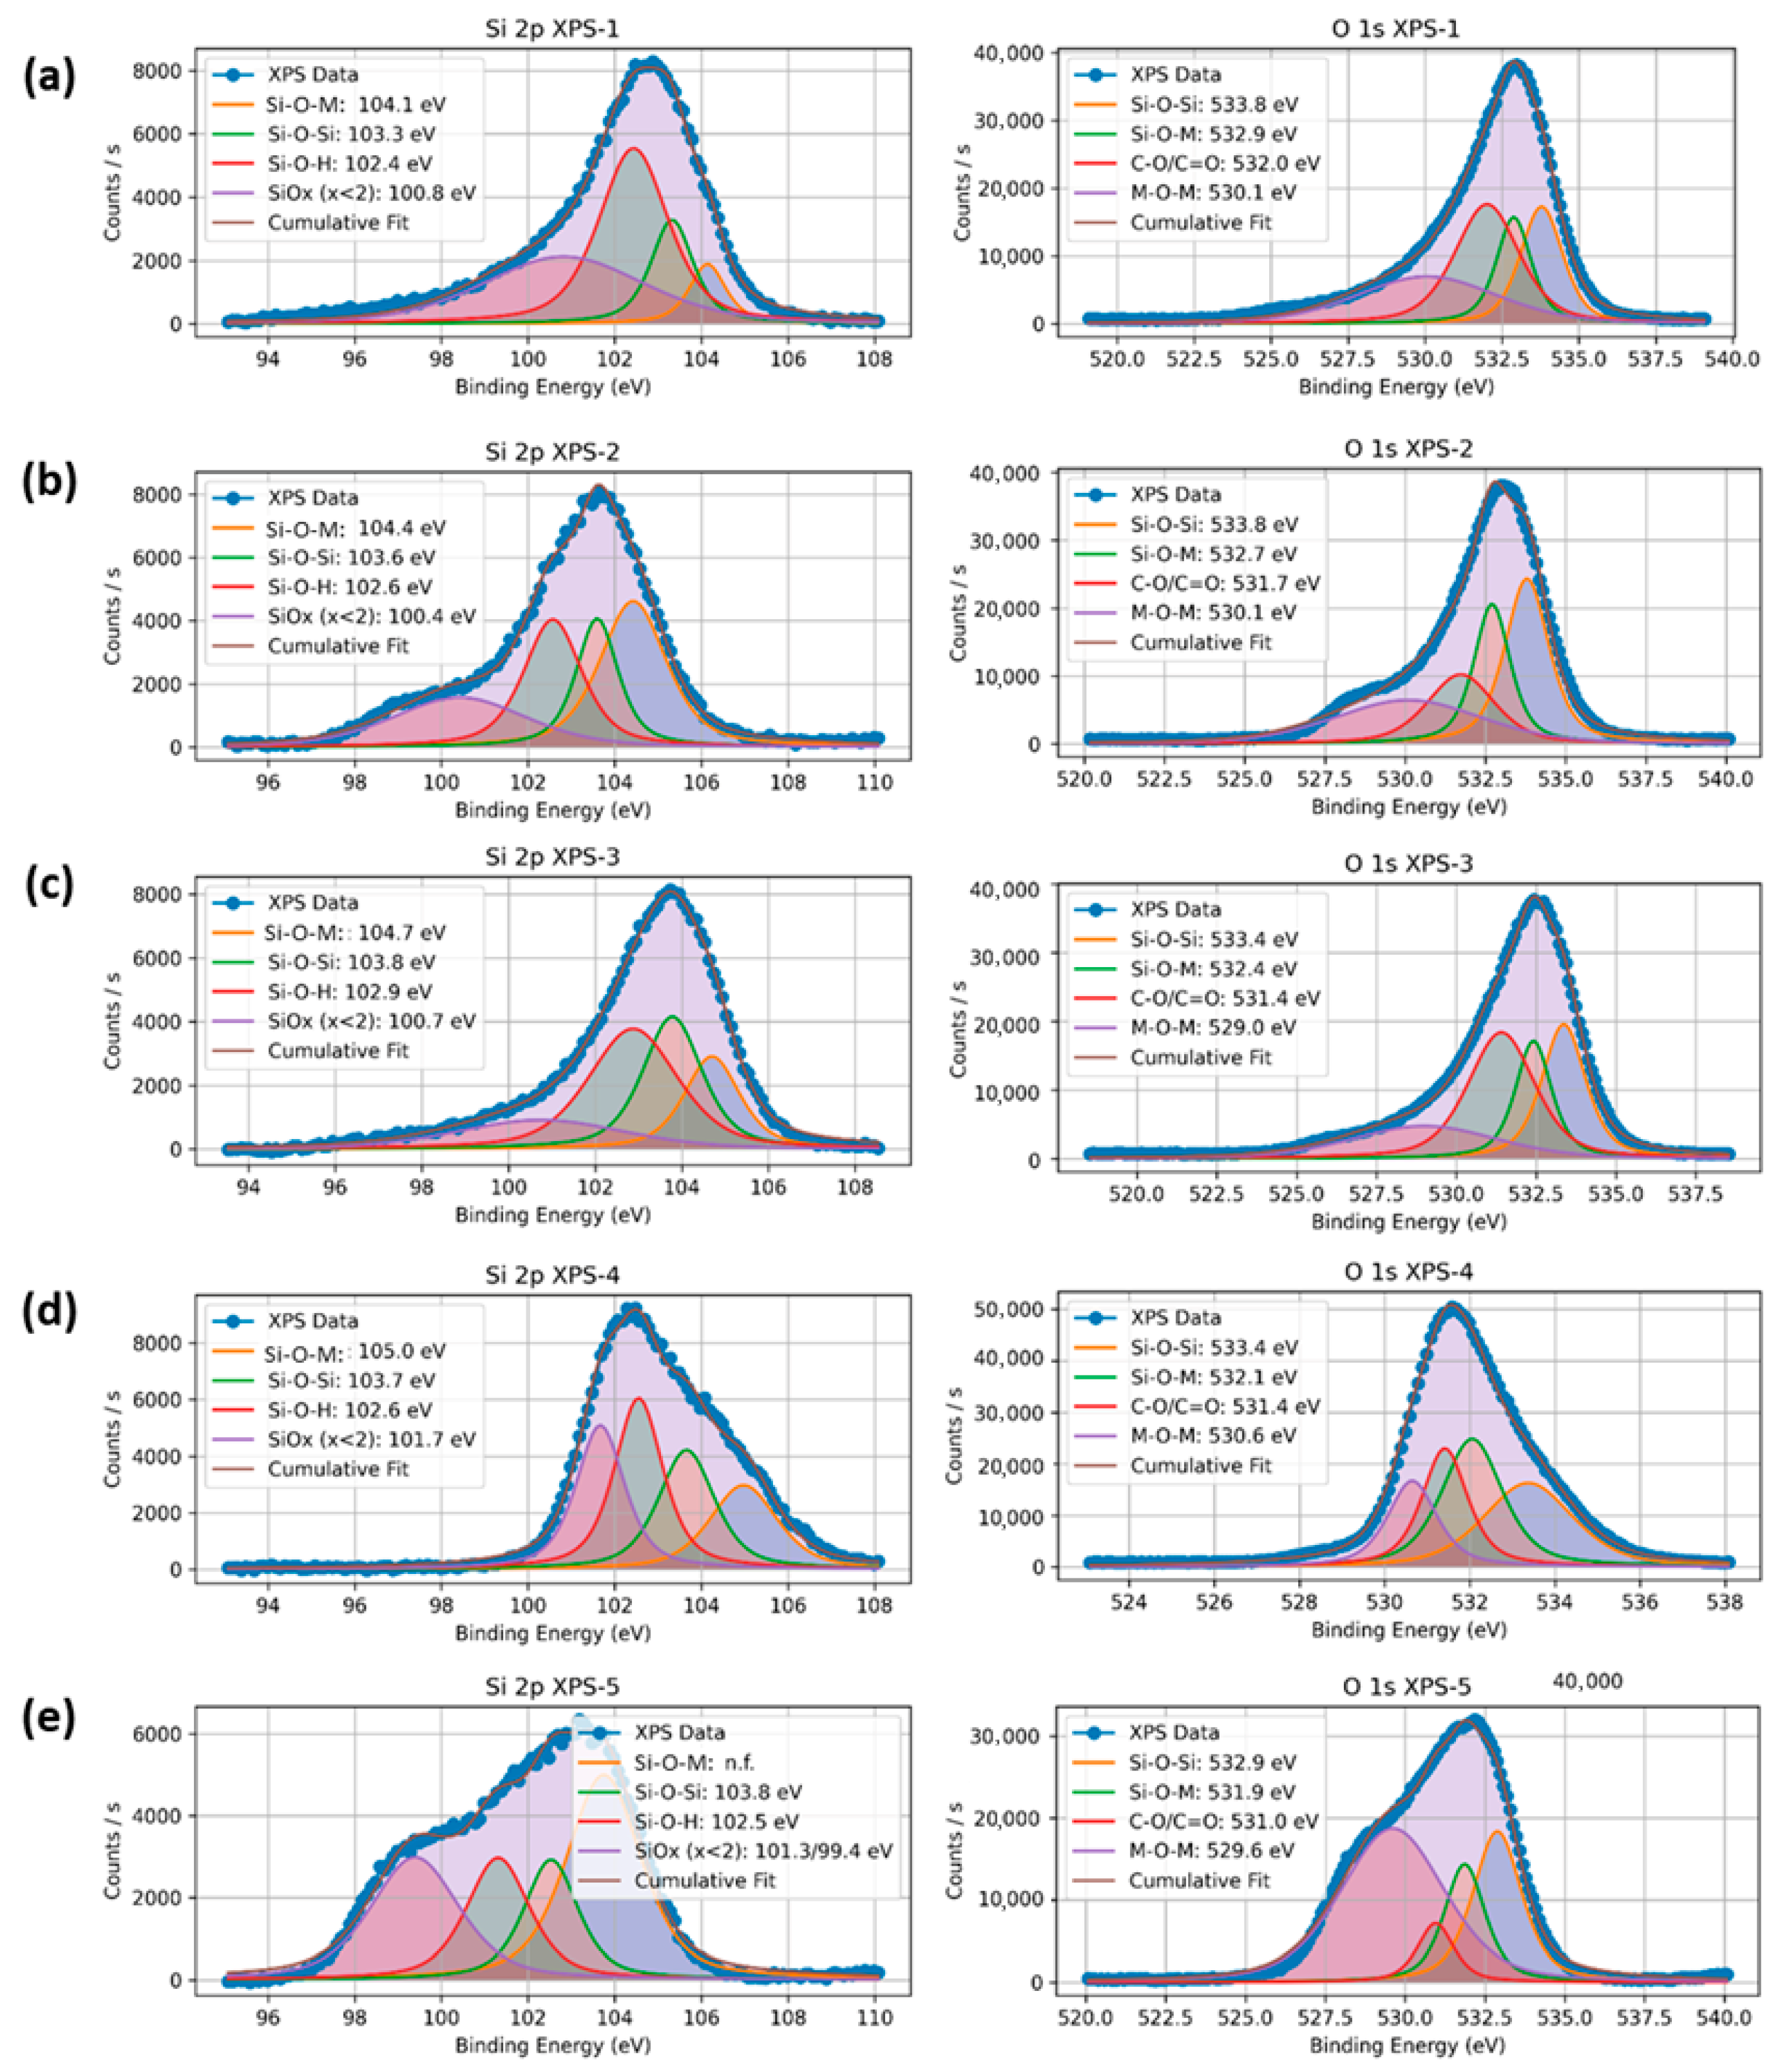
XPS analysis was carried out to examine the surface chemical states, metal–support interactions, and electronic environment of Ni and Gd in the SBA-16-supported catalysts. Deconvoluted spectra of Si 2p and O 1s are shown in Figure 3, and the corresponding peak positions and area contributions are listed in Table 3a,b.
The Si 2p spectra (Figure 3) were fitted into four components: (i) Si–O–M (metal–support interaction) at ~104.1–105.0 eV, (ii) Si–O–Si (siloxane) at ~103.3–103.8 eV, (iii) Si–O–H (silanol) at ~102.4–102.6 eV, and (iv) SiOx (x < 2) at ~100.4–101.7 eV. Similar assignments have been reported in earlier XPS studies on mesoporous silica-based systems [28], [23]. For 5Ni/SBA-16, the Si–O–M (M = Ni or Gd) fraction was 8.1%. With 0.5 wt.% Gd loading, this increased to 33.4% and remained relatively high at 1 and 2 wt.% Gd loading (18.7–19.6%). This indicated the formation of Si-O-(Ni/Gd) linkages.
At 3 wt.% Gd, the Si-O-M component was absent, while Si–O–Si increased to 37.9% and Si–O–H decreased from 42.1% to 16.8%, suggesting surface dehydroxylation and a reduced density of interfacial bonds. The SiOx contribution showed no consistent trend. This may be attributed to local disorder in the amorphous silica network [29].
The O 1s spectra contained Si–O–Si (~533.8–532.9 eV), Si–O–M (~532.9–531.9 eV), C–O/C=O (~532.0–531.0 eV), and a lattice-oxygen band at ~529–530.6 eV. The latter is assigned to overlapping Ni–O and Gd–O contributions, as the binding energies for NiO and Gd2O3 lattice-oxygen are similar and cannot be distinguished from O 1s alone. At 3 wt.% Gd, the lattice-oxygen fraction increased to 50.1%, indicating higher surface oxide coverage [9,29,30].
This trend is in line with the observed decrease in the C–O/C=O contribution (33.8% to 7.6%) and the reduction in Si–O–H in Si 2p at higher Gd loadings. Variations in Si–O–Si and Si–O–M contributions did not follow a clear trend; however, it suggested that the excessive Gd promoted oxide coverage or aggregation, thereby reducing the number of effective metal–support linkages [28,31].

3.1.5. H2-TPR and Post-CO2-TPD Analysis

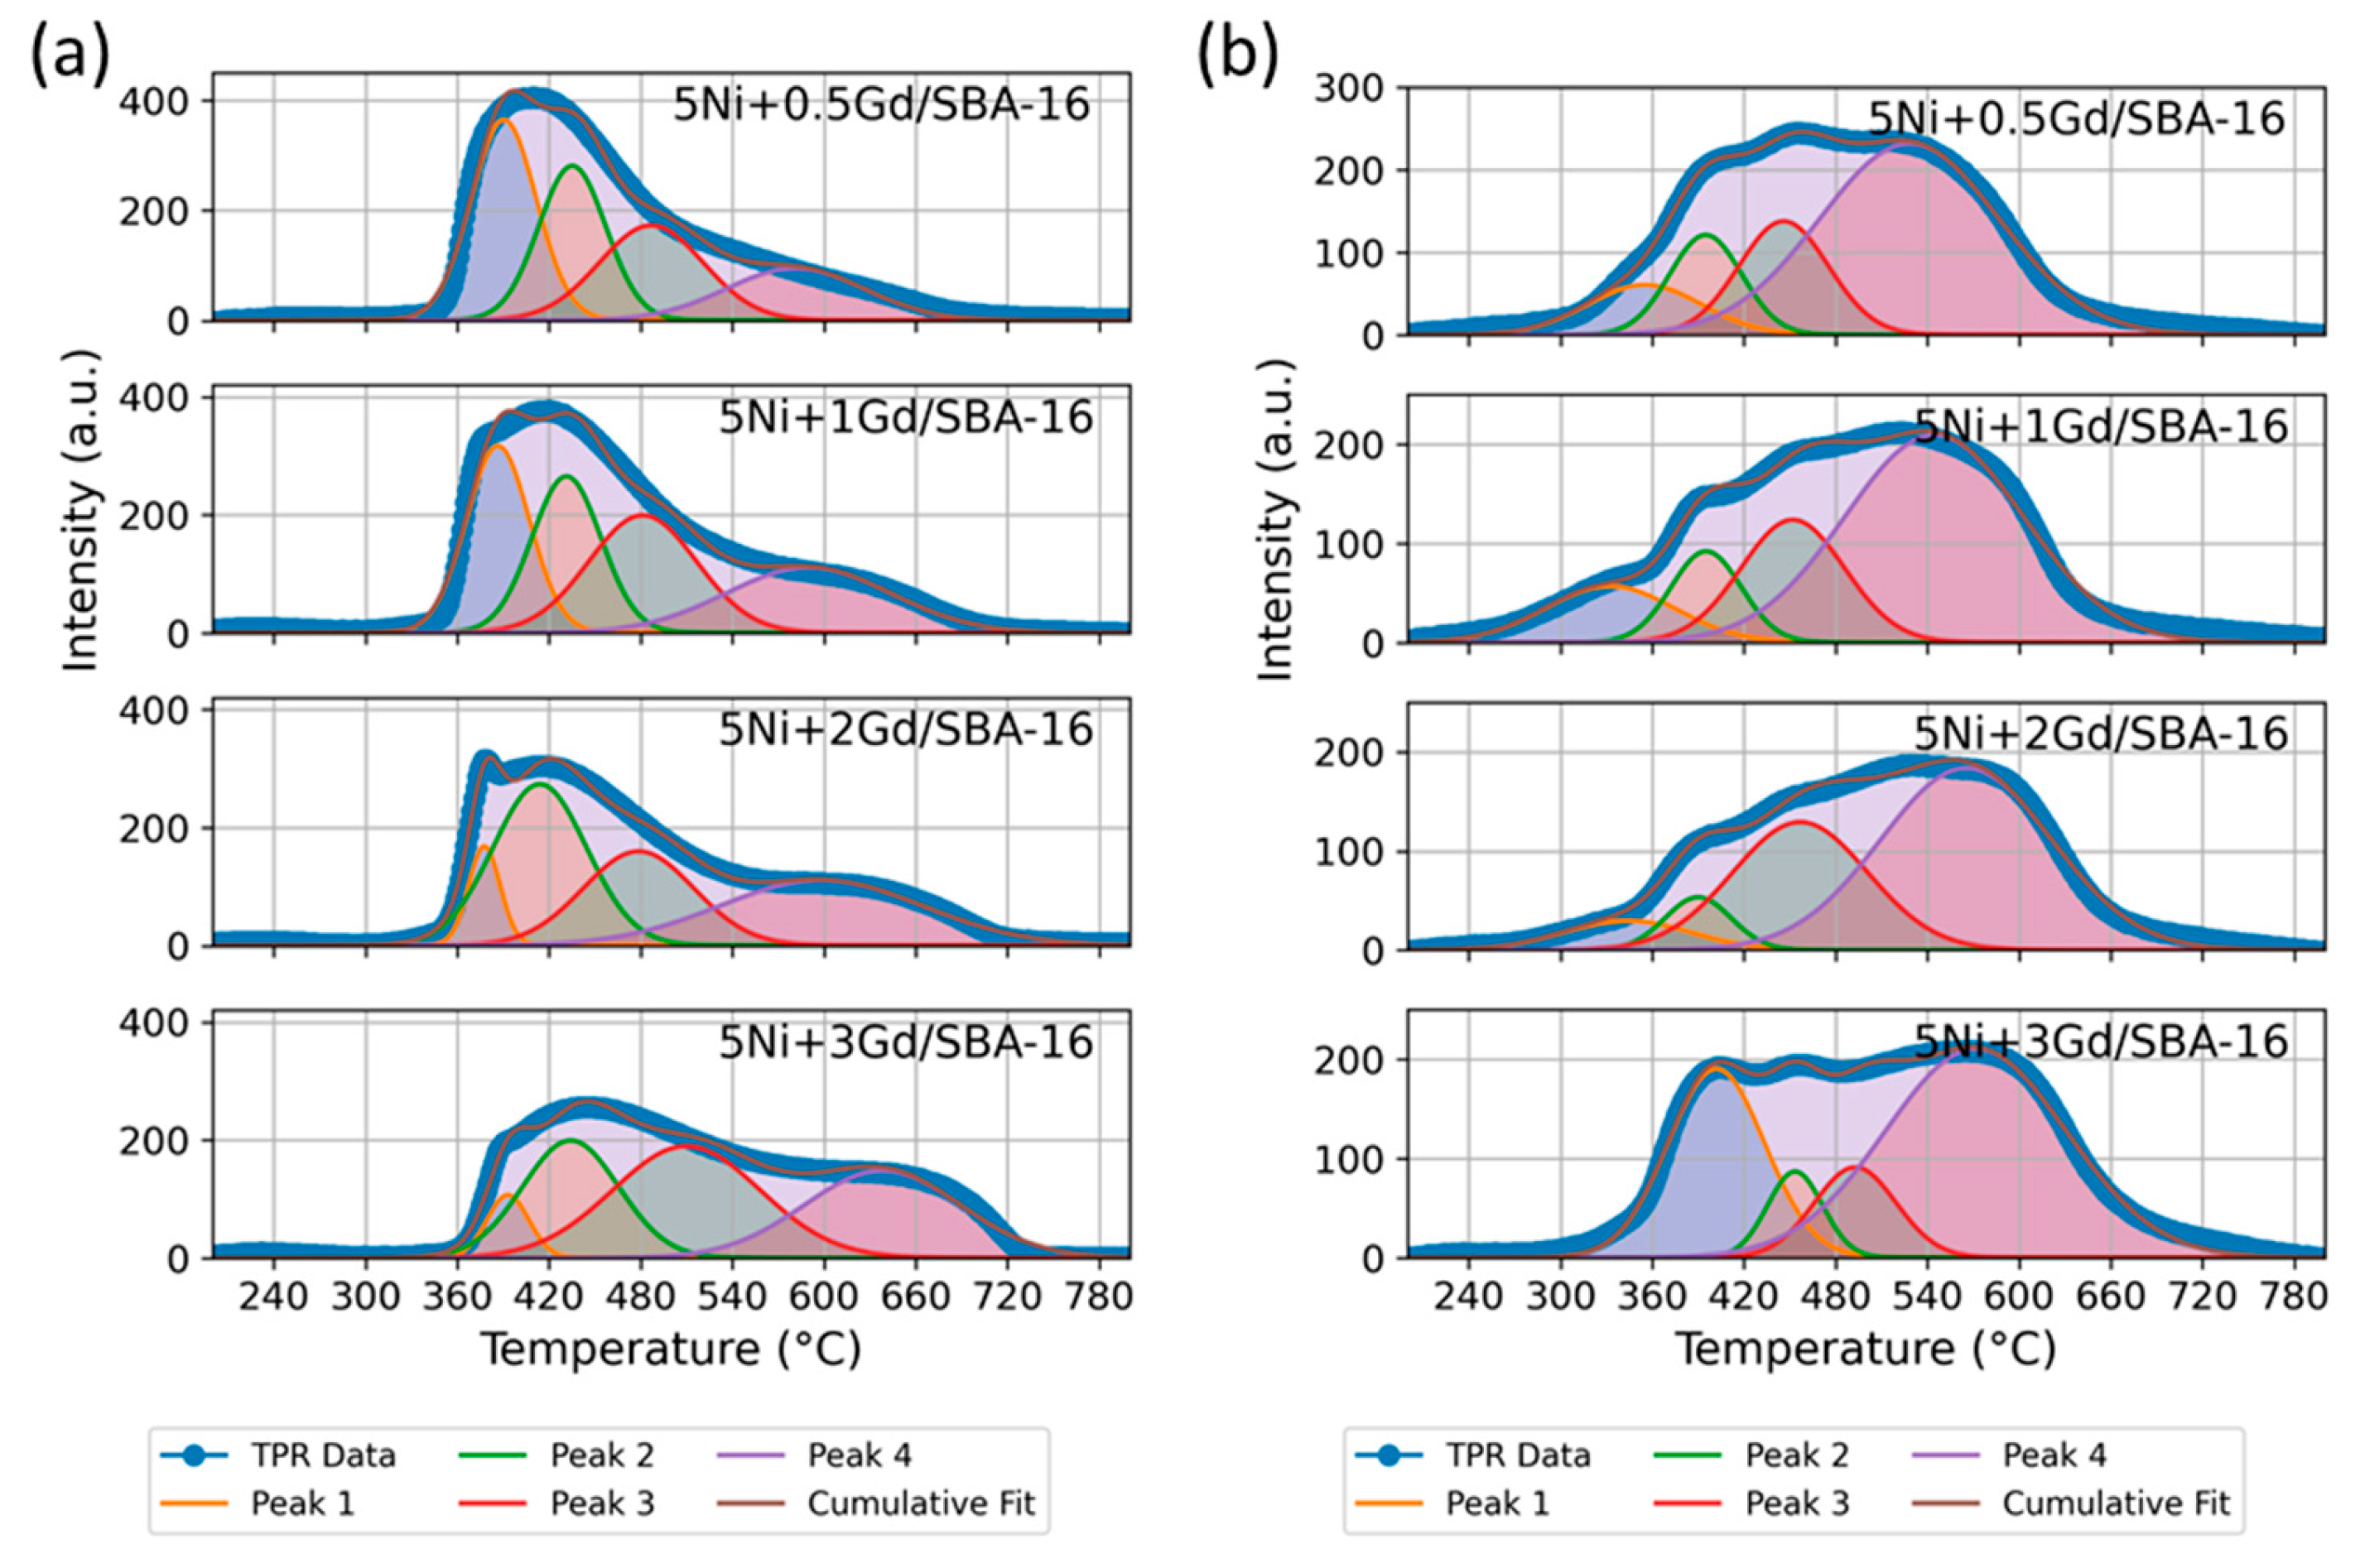
H2–TPR was performed to investigate the reduction behaviour of Gd-promoted Ni/SBA-16 catalysts. The reduction profiles for the fresh catalysts are presented in Figure 4a, and the corresponding peak temperatures and relative areas are summarized in Table 4.
Four main reduction peaks were identified. Peak 1 (~377–393 °C) was attributed to the reduction of free or weakly interacting NiO species. Peak 2 (~414–434 °C) corresponded to NiO moderately interacting with the SBA-16 support. Peak 3 (~478–519 °C) corresponded to NiO species interacting strongly with the support, possibly involving Ni–O–Si and/or Ni–O–Gd linkages. The relative area of this peak varied slightly between 0.5–2 wt.% Gd (24.4–27.5%) and was highest for 3 wt.% Gd (37.7%). Peak 4 (>580 °C) was associated with NiO incorporated into the silica framework or forming stable Ni–Gd–O phases. The position of Peak 4 shifted progressively to higher temperature with increasing Gd loading, while the area increased from 17.6% to about 30% at 2–3 wt.% Gd.
In the post-treatment profiles, changes were observed in both peak positions and their relative areas. For 0.5–2 wt.% Gd loadings, all peaks shifted to lower temperatures (by approximately 20–54 °C for Peak 1), and the area of Peak 1 decreased compared to the fresh state. In these samples, Peak 4 became the dominant feature (~56–60% area).
At 3 wt.% Gd, Peak 1 area increased from 6.1% to 26.9%, accompanied by a small rise in temperature, while Peak 3 area decreased from 37.7% to 10.9%. Peak 4 remained the largest contributor (~55%) but shifted to a lower temperature than in the fresh state. These results indicated that moderate Gd loadings (1–2 wt.%) maintained a balanced distribution of reducible Ni species after CO2 cycling, while excessive loading (3 wt.%) led to a redistribution towards both weakly and strongly bound Ni populations [32].

3.2. Catalytic Activity

The catalytic performance of 5Ni/SBA-16 catalysts with varying Gd loadings was evaluated for DRM conditions at 800 °C and a GHSV of 42,000 mL g−1 h−1. The long-term performance over 320 min is depicted in Figure 5, which presents (a) the yield of H2, (b) the yield of CO, and (c) the molar ratio of H2/CO for all catalysts.
The unpromoted 5Ni/SBA-16 catalyst exhibited the lowest H2 yield, decreasing from 57% at the start of reaction to 53% after 320 min on-stream (TOS). The incorporation of 0.5 wt.% Gd led to an increase in the initial H2 yield to 62%, with a slight decline over time. The highest H2 yields were obtained with 1 wt.% Gd and 2 wt.% Gd catalysts, both starting at nearly 66–67% and showing minimal decrease during TOS. At 3 wt.% Gd loading, the H2 yield (65% initially) was lower than that of the 1–2 wt.% samples and showed a faster decline, although still higher than that of the unpromoted catalyst. The CO yield trends (Figure 5b) were similar to the H2 yield. The unpromoted catalyst initially showed a 68% CO yield, which decreased to 62% over TOS. The 0.5 wt.% Gd catalyst improved CO yield to 72%. The 1 wt.% and 2 wt.% Gd catalysts maintained the highest CO yields (76–73% and 75–73%, respectively). At 3 wt.% Gd, CO yield (74% initially) did not improve further and declined slightly faster than the optimum Gd-loaded samples. Overall, at the end of 320 min time on stream; H2-yield and CO-yield remained highest for 1–2 wt.% Gd promoted catalysts. These catalysts (5Ni+1Gd/SBA-16 and 5Ni+2Gd/SBA-16) also showed optimum CH4 conversion (69%) and optimum CO2 conversion (72–73%) at the end of 320 min time on stream (Table S1).
The molar ratio of H2/CO (Figure 5c) for the unpromoted catalyst started at ~0.84 and gradually declined. The 0.5 wt.% Gd catalyst had the lowest ratio (0.85) throughout the test. The 1 wt.% and 2 wt.% Gd catalysts showed the highest ratios (0.88–0.92), while the 3 wt.% Gd catalyst was intermediate (0.82–0.86).
Table S2 (Supplementary Information) summarizes the catalytic performance of the 5Ni+xGd/SBA-16 catalysts (x = 1 and 2 wt.%) along with various other promoters and Ni/SBA-16 systems reported in the literature. At 800 °C and a GHSV of 42,000 mL·g−1·h−1, the 1–2 wt.% Gd–Ni/SBA-16 catalyst gave comparable H2 and CO yield with a H2/CO ratio of 0.92. These results are comparable to those previously reported for Ni/SBA-16 systems.
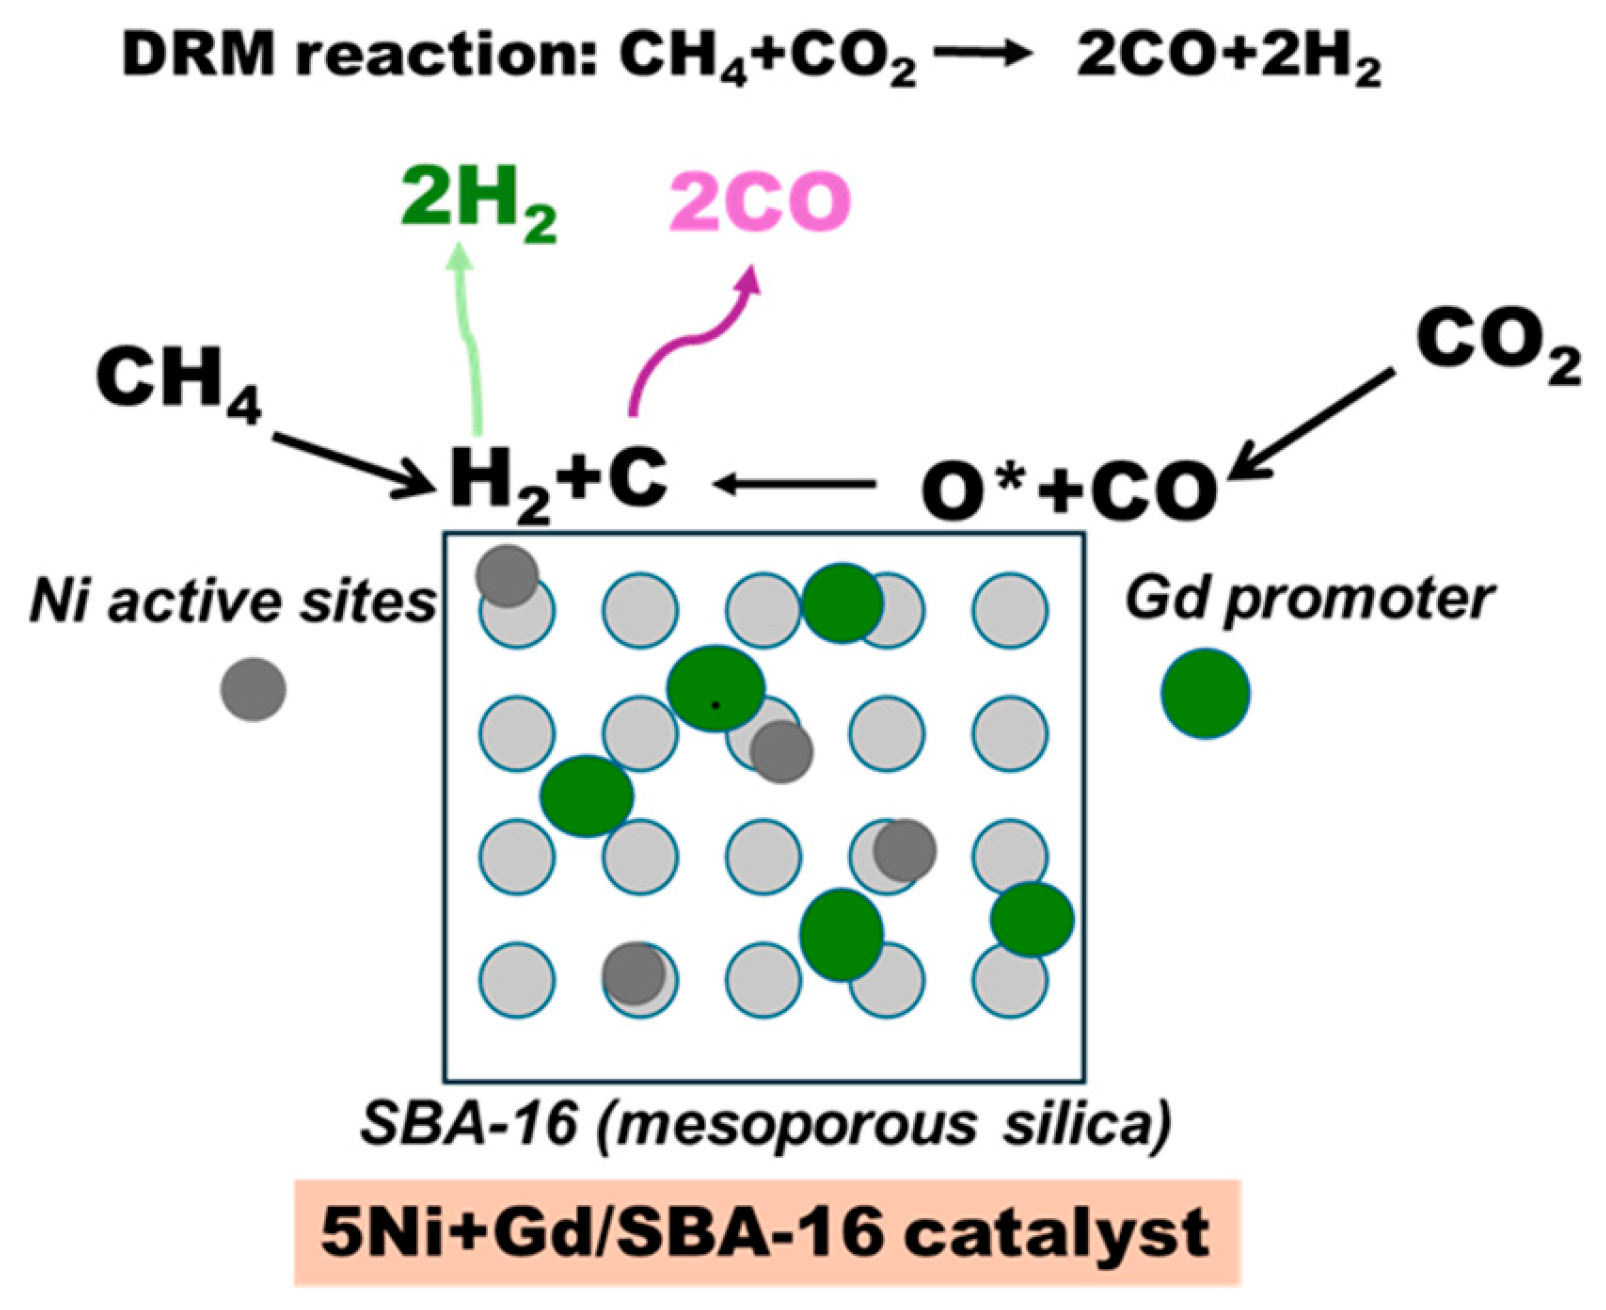
The better performance of the 1 wt.% and 2 wt.% Gd catalysts can be correlated with earlier characterization results. XPS showed a higher fraction of Si–O–M linkages at 1–2 wt.%, indicating stronger metal–support interactions. Initial and post-treatment H2–TPR analyses showed that these catalysts retained a balanced distribution of reducible Ni species after treatment, which is favourable for stable activity. In contrast, 3 wt.% Gd showed reduced Si–O–M linkages and an increased fraction of weakly interacting NiO and reduced strongly bound species. Figure 6 presents the proposed reaction mechanism for DRM over Gd-promoted Ni/SBA-16 catalysts, highlighting the roles of Ni active sites and Gd promoter over the mesoporous SBA-16 support.

3.3. Design of Experiments and Model Validation

A suitable power transformation (Equation (5)) was incorporated within the CCD framework to stabilize variance and improve model fit [33]. ANOVA results (Table S3—Supporting Information) indicated that all model terms were statistically significant (p < 0.05), while high coefficients of determination (R2 = 99.54% for H2 yield and 99.41% for CO yield) and confirmed strong agreement between experimental and model-predicted values. The correlation in predicted vs. observed plots (Figure S2) further confirmed model reliability [22,34,35]. By applying ANOVA at a significance level of α = 0.05 and using the Stat-Ease package, the experimental data were analysed, and the following models were proposed.
H 2 Y i e l d ( % ) = -   804.87256 + 1.97534   T   -   0.002679   V + 154.79755   R + 0.00000351104   T   V -   0.119507   T   R   -   0.000361   V   R   -   0.001097   T 2   -   0.00000000539685    V 2   -   39.31307   R 2
C O   Y i e l d % = - 942.0243 + 2.46091   T   -   0.002235   V + 72.10662   R + 0.00000358111   T   V   - 0.089684   T   R - 0.000265   V   R -   0.001461     T 2 - 0.00000000109012    V 2 -   4.91681   R 2  
The models (6) and (7) consist of multiple components: the intercept terms (β0), which indicate the expected value of the response when all independent variables are set to zero, while the main effects ( i = 1 3 β i X i ), indicating the linear impact of each factor on the response while holding the others constant; the interaction terms ( i = 1 2 j = i + 1 3 β i i X i X j ), which represent the combined influence of two interacting variables; and the quadratic terms ( i = 1 3 β i i X i 2 ), which account for curvature or nonlinear effects in the response.

Response Surface Analysis and Optimization of Process Parameters

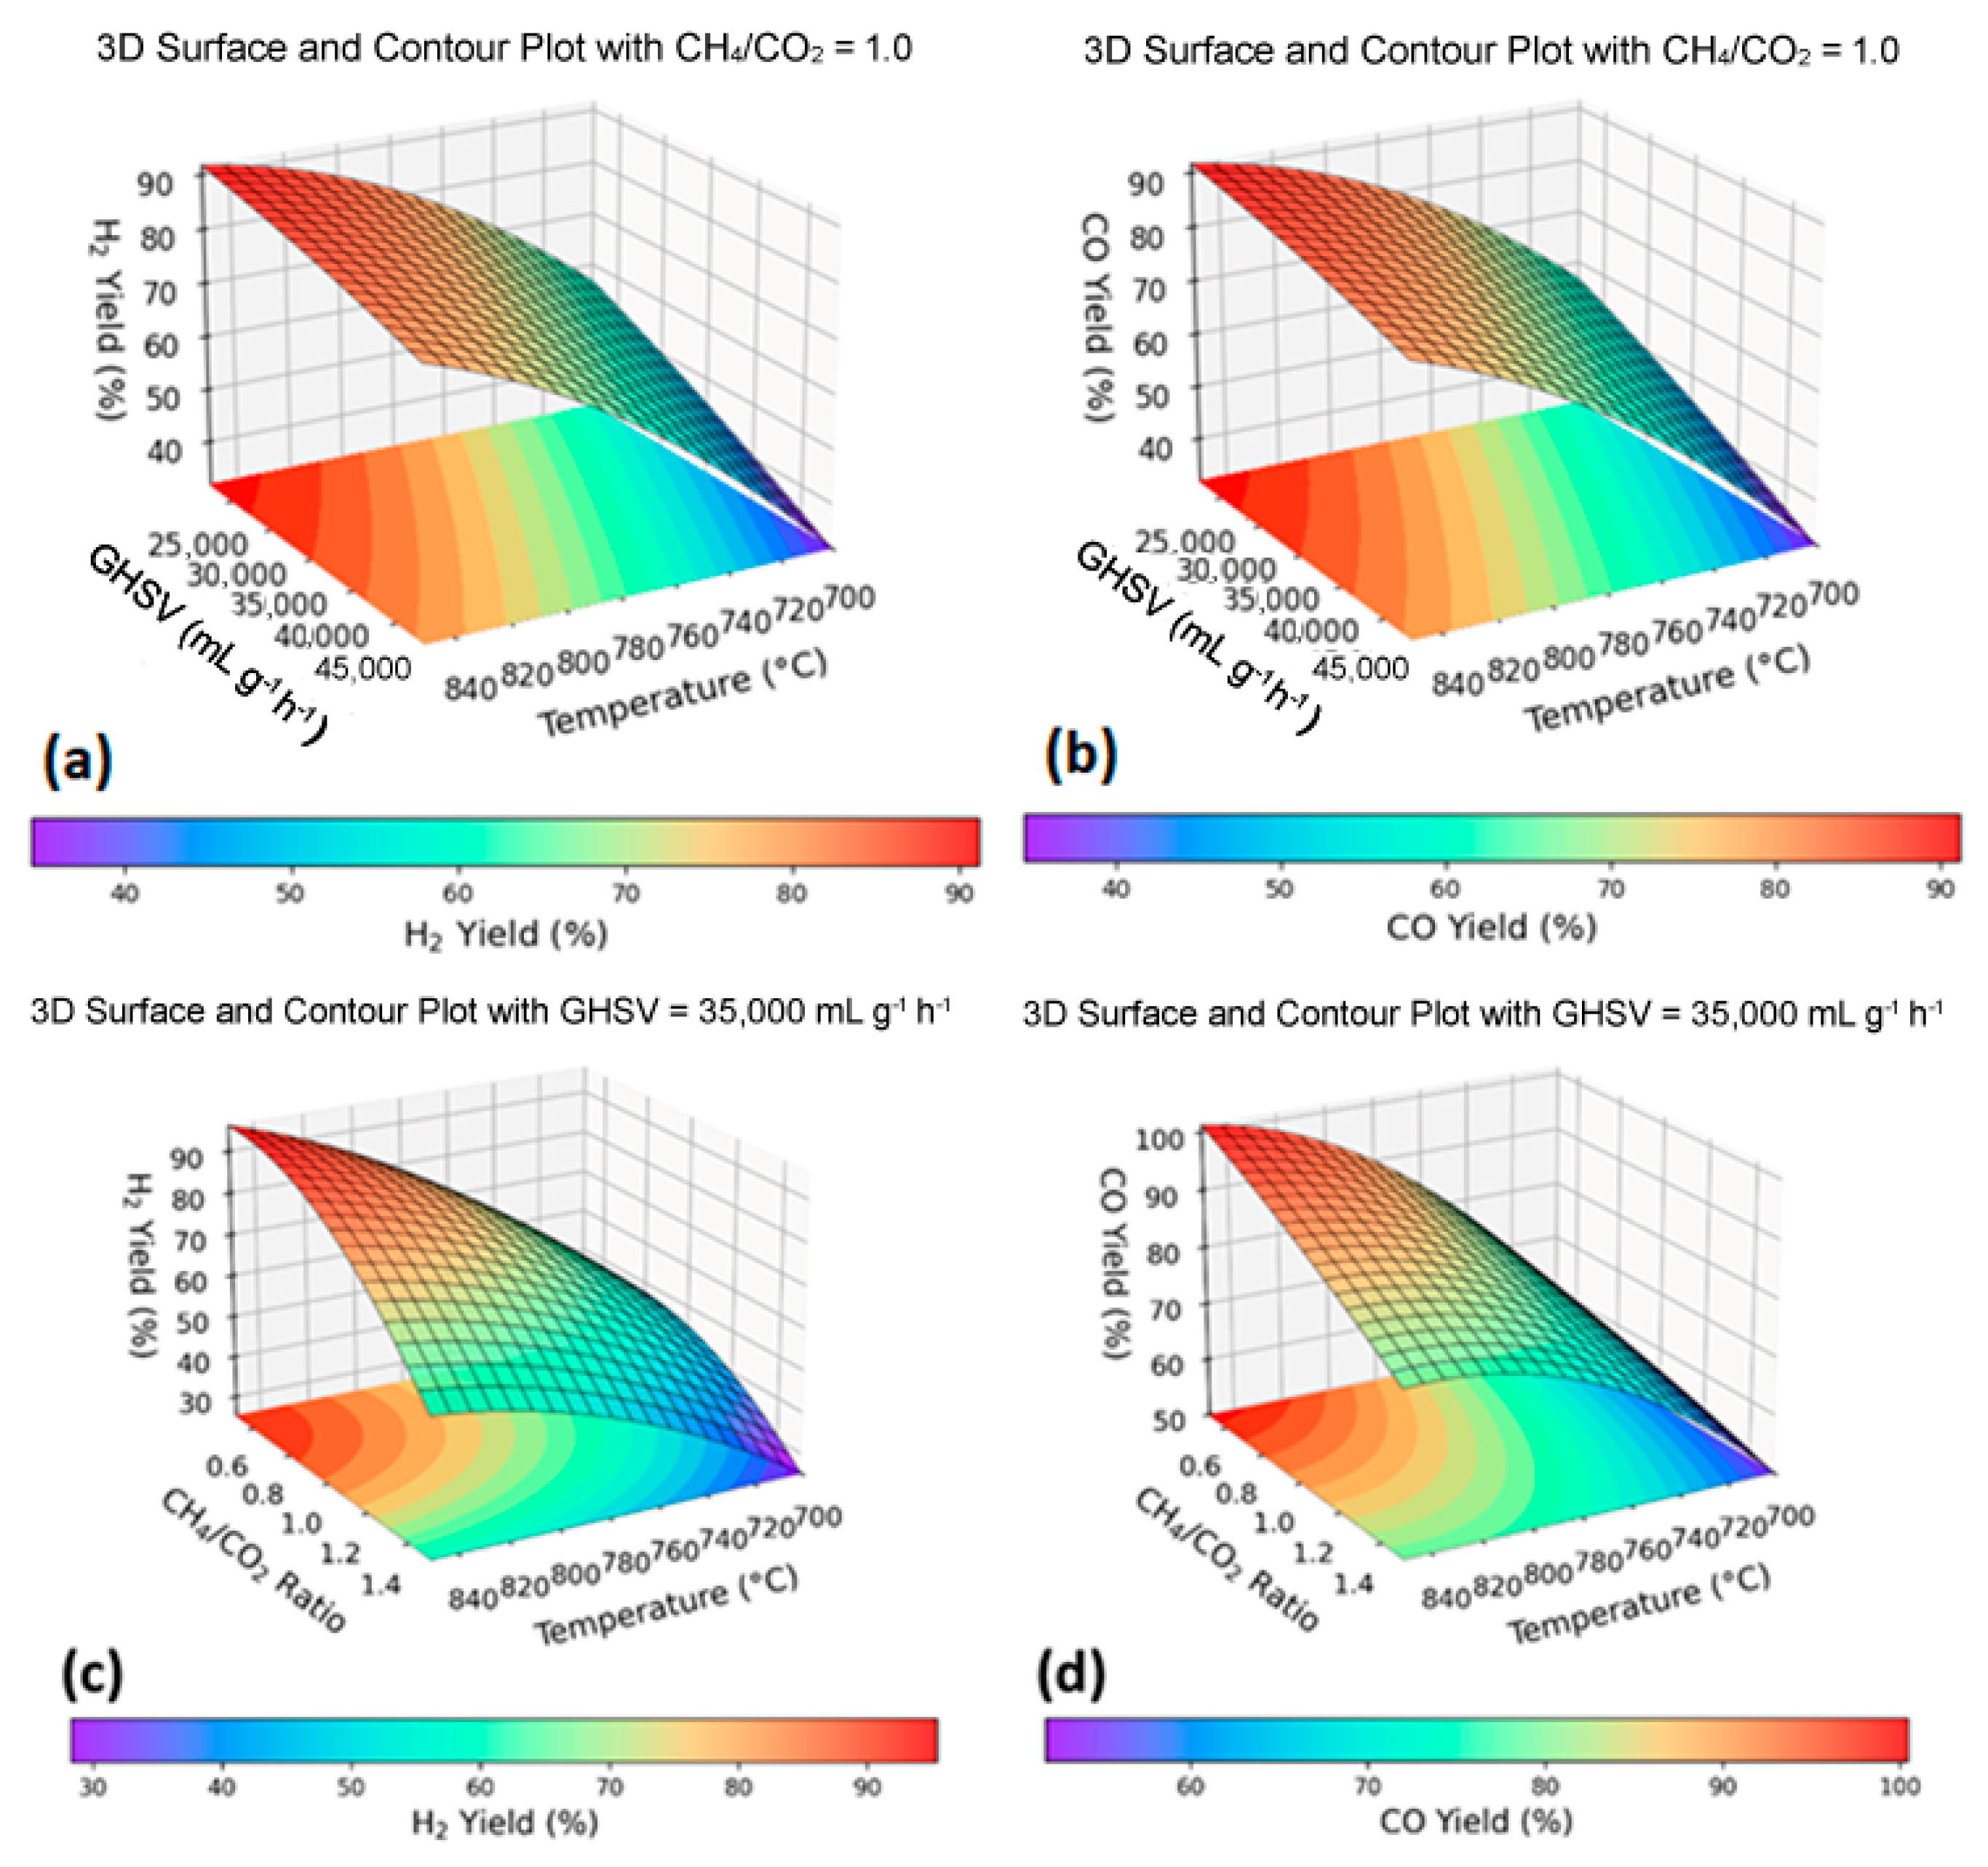
Three-dimensional (3D) response surface plots derived from the models are presented in Figure 7 to visualize the interactive effects of GHSV, temperature, and CH4/CO2 ratio on H2 and CO yields during DRM. These visualizations highlight the interactive effects of process variables, enabling identification of optimal operating conditions.
When the CH4/CO2 ratio was fixed at 1 (Figure 7a), H2 yield improved with rising temperature and with decrease in GHSV. Under these conditions, H2 yield enhanced from 42.1% at 700 °C to 95.09% at 850 °C for a GHSV—32,000 mL g−1 h−1. Similarly, at GHSV fixed at 35,000 mL g−1 h−1 (Figure 7c), increasing the temperature and lowering the CH4/CO2 ratio further enhanced H2 yield.
For the CO yield, a similar trend was observed. At a CH4/CO2 ratio of 1 (Figure 7b), CO yield increased from 42.12% at 700 °C to 95.09% at 850 °C at a GHSV of 32,000 mL g−1 h−1. Similarly, at a constant GHSV of 35,000 mL g−1 h−1 (Figure 7d), higher temperatures and lower CH4/CO2 ratios promoted higher CO yields. These results indicate that elevated temperatures and reduced GHSV favour endothermic DRM kinetics and improve reactant–surface interactions. Additional 2D contour plots (Figure S3, Supplementary Information) are provided for complementary visualization of these trends.
Numerical optimization using the Stat-Ease software identified the optimal process parameters for maximizing H2 yield. The solution with the highest desirability index yielded the following theoretical conditions: temperature = 848.9 °C, GHSV = 31, 283 mL g−1 h−1, and CH4/CO2 ratio = 0.61, predicting a H2 yield of 96.64%. Experimental validation in these conditions produced a 96.66% yield, confirming the accuracy of the model. The theoretical and experimental optimum conditions are summarized in Table 5.
The optimized process parameters identified through RSM modelling offered complementary insight into the potential performance of the catalysts under varied operating conditions. The catalytic activity section focused on fixed reaction parameters (temperature 800 °C and GHSV = 42,000 mL g−1 h−1). This model extended this understanding by predicting conditions that could further enhance H2 and CO yields.

3.4. TGA–DSC and Raman Characterization of Coke Deposition on Spent Catalyst

The TGA and Raman analyses of the spent 5Ni+2Gd/SBA-16 under optimized reaction conditions (presented in Table 5) were carried out in order to investigate the presence of carbon deposition on the catalyst surface. The TGA–DSC profile of the spent 5Ni+2Gd/SBA-16 catalyst (Figure S4, Supplementary Information) exhibited a gradual weight loss of ~1.76% in the temperature range 580–780 °C. This can be attributed to the oxidation of carbonaceous deposits (coke) formed during the catalytic reaction. The corresponding DSC curve, however, did not exhibit a distinct exothermic peak; instead, it displayed a steady downward drift. This behaviour suggests that the heat released during coke combustion is small in magnitude and distributed over a broad temperature range. The absence of a well-defined DSC peak indicates the presence of a relatively small amount of surface coke undergoing slow oxidation [36].
The Raman spectrum of the spent catalyst (Figure S5, Supplementary Information) showed characteristic peaks associated with carbonaceous deposits. The D band (~1350 cm−1) corresponds to disordered or defect sites in carbon, while the G band (~1580 cm−1) arises from the in-plane stretching vibrations of sp2–sp2-hybridized carbon domains, indicating the presence of graphitic structures. Additionally, the 2D band (~2700 cm−1), a second-order overtone of the D band, reflected the graphitic ordering and stacking of sp2 carbon layers [37]. The relative intensities of these peaks suggested that the deposited carbon is a mixture of amorphous and graphitic forms [38].
The combined TGA–DSC and Raman results indicated that the spent catalyst 5Ni+2Gd/SBA-16 under optimized conditions accumulated a limited amount of coke, majorly graphitic in nature, which oxidizes slowly over a wide temperature range.

4. Conclusions

Gd-promoted Ni/SBA-16 catalysts (0.5–3 wt.%) were evaluated for DRM at 800 °C with a GHSV of 42,000 mLg−1 h−1. The 5Ni/SBA-16 catalysts with 1–2 wt.% Gd loading exhibited the best performance, achieving stable H2 yields of ~67% and CO yields of 73–76%, with H2/CO ratios of 0.88–0.91 sustained over 320 min of time-on-stream. XPS, together with initial and post-treatment H2–TPR, indicated stronger Ni–support interactions and a favourable distribution of reducible Ni species at these loadings. CCD-RSM gave well-fitted models (R2 = 0.9954 for H2, 0.9941 for CO) and identified optimum conditions of 848.9 °C, 31,283 mL g−1 h−1, and CH4/CO2 = 0.61, where the predicted H2 yield (96.64%) was very close to the experimental value (96.66%). Combined TGA–DSC and Raman analyses of the spent 5Ni+2Gd/SBA-16 catalyst under optimized conditions exhibited limited coke deposition, mainly graphitic in nature. These findings highlight the synergistic role of rare-earth promotion and process parameter optimization in enhancing DRM efficiency and providing a mechanistic basis for future catalyst design.

Supplementary Materials

The following supporting information can be downloaded at: https://www.mdpi.com/article/10.3390/nano15191527/s1, Catalyst characterization S1; Model accuracy S2; Figure S1. FTIR spectra of 5Ni–xGd/SBA-16 catalysts (x = 0, 0.5, 1.0, 2.0, 3.0 wt.%) showing surface –OH vibrations and Si–O–Si bands; Figure S2. Comparison between the actual and estimated data for the response variables; Figure S3. Two-dimensional relationship between factors (Temperature (T), Space Velocity (GHSV), and C H 4 / C O 2 ) and H2 yield; Figure S4. TGA–DSC of the spent 5Ni+2Gd/SBA-16 catalyst (under optimized conditions) showing 1.76% weight loss from 580–780 °C due to slow coke oxidation, with no distinct exothermic DSC peak; Figure S5. Raman spectrum of the spent catalyst showing peak-fitted carbon features: The D band (~1350 cm−1), the G band (~1580 cm−1), and the 2D band (~2700 cm−1); Table S1. Performance data of the studied catalysts [7,11,12,13,14,15,39,40]; Table S2. Comparison of the DRM performance of Ni/SBA-16-based catalysts from this work and the literature; Table S3. Analysis of variance (ANOVA) for the quadratic models of the three response variables.

Author Contributions

Software, Writing, and Formal analysis: S.A.A.-Z. and M.F.A.; Writing—review & editing. A.I.O.: Software, Resources, and Formal analysis. A.A.B. and M.A.A.; Formal analysis and Investigation A.A.O. and H.D.A.A.-E.; Data curation and Methodology, N.O.S.A.; Conceptualization, Writing—review & editing, Funding acquisition, and Project administration: A.I.O. and A.S.A.-F. All authors have read and agreed to the published version of the manuscript.

Funding

This research has been funded by the Scientific Research Deanship at the University of Ha’il—Saudi Arabia through project number <<RCP-25 002>>.

Data Availability Statement

All data that support the findings of this study are included within the article.

Conflicts of Interest

The authors declare no conflicts of interest. The funders had no role in the design of the study; in the collection, analyses, or interpretation of data; in the writing of the manuscript; or in the decision to publish the results.

References

  1. International Energy Agency. The Future of Hydrogen; IEA: Paris, France, 2019; Available online: https://www.iea.org/reports/the-future-of-hydrogen (accessed on 28 July 2025).
  2. Remme, U. Global Hydrogen Review 2024; International Energy Agency: Paris, France, 2024; Available online: https://www.iea.org/reports/global-hydrogen-review-2024 (accessed on 31 July 2025).
  3. Segovia-Hernández, J.G.; Hernández, S.; Cossío-Vargas, E.; Juarez-García, M.; Sánchez-Ramírez, E. Green hydrogen production for sustainable development: A critical examination of barriers and strategic opportunities. RSC Sustain. 2025, 3, 134–157. [Google Scholar] [CrossRef]
  4. Teh, L.P.; Setiabudi, H.D.; Timmiati, S.N.; Aziz, M.A.A.; Annuar, N.H.R.; Ruslan, N.N. Recent progress in ceria-based catalysts for the dry reforming of methane: A review. Chem. Eng. Sci. 2021, 242, 116606. [Google Scholar] [CrossRef]
  5. Al-Zahrani, S.A.; Al-Fatesh, A.S.; Fakeeha, A.H.; Ibrahim, A.A.; Alsaiari, M.A.; Arafat, Y.; Khan, W.U.; Alhamed, Y.A.; Al-Otaibi, R.L. High carbon-resistant nickel supported on yttria–zirconia catalysts for syngas production by dry reforming of methane: The promoting effect of cesium. Alex. Eng. J. 2023, 74, 371–386. [Google Scholar] [CrossRef]
  6. Chaudhary, K.J.; Rawat, S.; Sharma, A.; Rana, R.; Tiwari, D.; Patel, P.; Yadav, R.; Singh, P.; Yadav, A.K. Enhanced hydrogen production through methane dry reforming: Evaluating the effects of promoter-induced variations in reducibility, basicity, and crystallinity on Ni/ZSM-5 catalyst performance. Energy Convers. Manag. X 2024, 23, 100631. [Google Scholar] [CrossRef]
  7. Fakeeha, A.H.; Al-Fatesh, A.S.; Ibrahim, A.A.; Khan, W.U.; Abasaeed, A.E.; Al-Zahrani, S.A.; Alharthi, F.A.; Shaikh, H.M.; Albarraq, A.A. Holmium promoted yttria–zirconia supported Ni catalyst for H2 production via dry reforming of methane. Int. J. Hydrogen Energy 2022, 47, 38242–38257. [Google Scholar] [CrossRef]
  8. Pakhare, D.; Spivey, J. A review of dry (CO2) reforming of methane over noble metal catalysts. Chem. Soc. Rev. 2014, 43, 7813–7837. [Google Scholar] [CrossRef] [PubMed]
  9. Zhu, H.; Chen, H.; Zhang, M.; Liang, C.; Duan, L. Recent advances in promoting dry reforming of methane using nickel-based catalysts. Catal. Sci. Technol. 2024, 14, 1712–1729. [Google Scholar] [CrossRef]
  10. Alwadai, N.; Khan, W.U.; Osman, A.I.; Alhoshan, M.S.; Al-Zahrani, S.A.; Algarni, T.S. Strontium-promoted Ni/SiO2–ZrO2 catalysts for methane dry reforming: Unraveling the role of basicity, metal–support interaction, and coke resistance. ACS Appl. Energy Mater. 2025, 8, 10423. [Google Scholar] [CrossRef]
  11. Taherian, Z.; Khataee, A.; Orooji, Y. Nickel-based nanocatalysts promoted over MgO-modified SBA-16 for dry reforming of methane for syngas production: Impact of support and promoters. J. Energy Inst. 2021, 97, 100–108. [Google Scholar] [CrossRef]
  12. Sun, C.; Wang, Z.; Li, J.; Chen, J.; Zhang, Q.; He, H.; Zhang, H.; Luo, J. Boosting CO2 reforming of methane via the metal–support interaction in mesostructured SBA-16-derived Ni nanoparticles. Appl. Mater. Today 2022, 26, 101354. [Google Scholar] [CrossRef]
  13. Zhang, S.; Muratsugu, S.; Ishiguro, N.; Tada, M. Ceria-doped Ni/SBA-16 catalysts for dry reforming of methane. ACS Catal. 2013, 3, 1855–1864. [Google Scholar] [CrossRef]
  14. Huo, M.; Li, L.; Zhao, X.; Zhang, Y.; Li, J. Synthesis of Ni-based catalysts supported on nitrogen-incorporated SBA-16 and their catalytic performance in the reforming of methane with carbon dioxide. J. Fuel Chem. Technol. 2017, 45, 172–181. [Google Scholar] [CrossRef]
  15. Fakeeha, A.H.; Al-Fatesh, A.S.; Srivastava, V.K.; Ibrahim, A.A.; Abahussain, A.A.M.; Abu-Dahrieh, J.K.; Alotibi, M.F.; Rawesh, R. Hydrogen production from gadolinium-promoted yttrium–zirconium-supported Ni catalysts through dry methane reforming. ACS Omega 2023, 8, 22108. [Google Scholar] [CrossRef]
  16. Al-Fatesh, A.S.; Fakeeha, A.H.; Ibrahim, A.A.; Abasaeed, A.E.; Khan, W.U.; Al-Zahrani, S.A. CO2 reforming of CH4: Effect of Gd as promoter for Ni supported over MCM-41 as catalyst. Renew. Energy 2019, 140, 658–667. [Google Scholar] [CrossRef]
  17. Zhang, G.; Guo, H.; Zhao, L.; Wang, Y.; Li, J. Effect of Gd promoter on the structure and catalytic performance of mesoporous Ni/Al2O3–CeO2 in dry reforming of methane. Ind. Eng. Chem. Res. 2018, 57, 17076–17085. [Google Scholar] [CrossRef]
  18. Fakeeha, A.H.; Al-Fatesh, A.S.; Ibrahim, A.A.; Khan, W.U.; Al-Zahrani, S.A.; Alsaiari, M.A.; Osman, A.I. Role of promoters over yttria–zirconia supported Ni catalyst for dry reforming of methane. Energy Sci. Eng. 2023, 11, 4366–4380. [Google Scholar] [CrossRef]
  19. Mageed, A.K.; Ayodele, B.V.; Mustapa, S.I. Response surface optimization of hydrogen-rich syngas production by greenhouse gases reforming. Chem. Eng. Technol. 2020, 43, 742–751. [Google Scholar] [CrossRef]
  20. Hossain, M.A.; Ayodele, B.V.; Cheng, C.K.; Khan, M.R. Optimization of renewable hydrogen-rich syngas production from catalytic reforming of greenhouse gases (CH4 and CO2) over calcium iron oxide supported nickel catalyst. J. Energy Inst. 2019, 92, 177–194. [Google Scholar] [CrossRef]
  21. Sarrai, A.; Belkacem, M.; Trari, M.; Abdelmalek, F.; Fourcade, F.; Amrane, A. Using central composite experimental design to optimize the degradation of tylosin from aqueous solution by photo-Fenton reaction. Materials 2016, 9, 428. [Google Scholar] [CrossRef]
  22. Ahmadi Azqhandi, M.H.; Ghaedi, M.; Yousefi, F.; Jamshidi, M. Application of random forest, radial basis function neural networks and central composite design for modeling and/or optimization of the ultrasonic assisted adsorption of brilliant green on ZnS-NP-AC. J. Colloid Interface Sci. 2017, 505, 278–292. [Google Scholar] [CrossRef]
  23. Feliczak-Guzik, A.; Jadach, B.; Piotrowska, H.; Murias, M.; Lulek, J.; Nowak, I. Synthesis and characterization of SBA-16 type mesoporous materials containing amine groups. Microporous Mesoporous Mater. 2016, 220, 231–238. [Google Scholar] [CrossRef]
  24. Song, Q.; Ran, R.; Wu, X.; Si, Z.; Weng, D. Dry reforming of methane over Ni catalysts supported on micro- and mesoporous silica. J. CO2 Util. 2023, 68, 102387. [Google Scholar] [CrossRef]
  25. Barrett, E.P.; Joyner, L.G.; Halenda, P.P. The determination of pore volume and area distributions in porous substances. I. Computations from nitrogen isotherms. J. Am. Chem. Soc. 1951, 73, 373–380. [Google Scholar] [CrossRef]
  26. Ide, M.; El Fallah, J.; Galarneau, A.; Di Renzo, F.; Fajula, F. Quantification of silanol sites for the most common mesoporous ordered silicas and organosilicas: Total versus accessible silanols. Phys. Chem. Chem. Phys. 2013, 15, 642–650. [Google Scholar] [CrossRef]
  27. Gupta, R.; Layek, S.; Pathak, D.D. Synthesis and characterization of guanine-functionalized mesoporous silica (SBA-16-G): A metal-free and recyclable heterogeneous solid base catalyst for synthesis of pyran-annulated heterocyclic compounds. Res. Chem. Intermed. 2019, 45, 1619–1637. [Google Scholar] [CrossRef]
  28. Simonsen, M.E.; Sønderby, C.; Li, Z.; Søgaard, E.G. XPS and FT-IR investigation of silicate polymers. J. Mater. Sci. 2009, 44, 2079–2088. [Google Scholar] [CrossRef]
  29. Weidler, N.; Pfaff, C.; Pankrath, T.; Gärtner, F.; Pichler, T.; Fellinger, T.P. X-ray photoelectron spectroscopic investigation of plasma-enhanced chemical vapor deposited NiOx, NiOx(OH)γ, and CoNiOx(OH)γ: Influence of the chemical composition on the catalytic activity for the oxygen evolution reaction. J. Phys. Chem. C 2017, 121, 6455–6463. [Google Scholar] [CrossRef]
  30. Senna, M.; Li, Y.; Wei, Y.; Yuan, Y.; Xu, S.; Zhang, X.; Wang, Y.; Xu, B. Solid-state reduction of silica nanoparticles via oxygen abstraction from SiO4 units by polyolefins under mechanical stressing. RSC Adv. 2018, 8, 36338–36344. [Google Scholar] [CrossRef]
  31. Prieto, M.J.; Wehling, T.; Kuhlenbeck, H.; Freund, H.J.; Wlodarczyk, R.; Sierka, M.; Sauer, J. Plasma functionalization of silica bilayer polymorphs. ACS Appl. Mater. Interfaces 2022, 14, 48609–48618. [Google Scholar] [CrossRef]
  32. Li, T.; Zhang, Y.; Chen, W.; Liu, F.; Sun, Z. Energy efficient catalytic CO2 desorption: Mechanism, technological progress and perspective. Carbon Capture Sci. Technol. 2023, 6, 100099. [Google Scholar] [CrossRef]
  33. Ares, G. Mathematical and Statistical Methods in Food Science and Technology, 1st ed.; Wiley: Hoboken, NJ, USA, 2014. [Google Scholar] [CrossRef]
  34. Al-Fatesh, A.S.; Fakeeha, A.H.; Ibrahim, A.A.; Khan, W.U.; Al-Zahrani, S.A.; Osman, A.I.; Alqahtani, A.S.; Al-Kahtani, A.A. Tailoring strontium-promoted alumina–zirconia supported Ni-catalysts for enhanced CO2 utilization via dry reforming of methane: Sr loading effects and process optimization. J. CO2 Util. 2023, 75, 102578. [Google Scholar] [CrossRef]
  35. Yang, L.; Liu, R.; Zhao, G.; Wang, X.; Zhang, Y. Response surface methodology optimization of ultrasonic-assisted extraction of Acer truncatum leaves for maximal phenolic yield and antioxidant activity. Molecules 2017, 22, 232. [Google Scholar] [CrossRef] [PubMed]
  36. Ahmed, R.; Sasaki, T.; Olea, M. Original method to predict and monitor carbon deposition on Ni-based catalysts during dry reforming of methane. Front. Chem. Eng. 2020, 2, 9. [Google Scholar] [CrossRef]
  37. Puech, P.; Flahaut, E.; Lavin, J.G.; Rols, S.; Monthioux, M. Analyzing the Raman spectra of graphenic carbon materials from kerogens to nanotubes: What type of information can be extracted from defect bands? C 2019, 5, 69. [Google Scholar] [CrossRef]
  38. Owen, R.E.; Hall, J.; Williams, H.; Jones, J.; Chen, R. Visualising coke-induced degradation of catalysts used for CO2-reforming of methane with X-ray nano-computed tomography. Carbon Capture Sci. Technol. 2022, 5, 100068. [Google Scholar] [CrossRef]
  39. Al-Fatesh, A.S.; Khatri, J.; Kumar, R.; Kumar Srivastava, V.; Osman, A.I.; AlGarni, T.S.; Ibrahim, A.A.; Abasaeed, A.E.; Fakeeha, A.H.; Rooney, D.W. Role of Ca, Cr, Ga and Gd Promotor over Lanthana-Zirconia–Supported Ni Catalyst towards H2-Rich Syngas Production through Dry Reforming of Methane. Energy Sci. Eng. 2022, 10, 866–880. [Google Scholar] [CrossRef]
  40. Khatri, J.; Al-Fatesh, A.S.; Fakeeha, A.H.; Ibrahim, A.A.; Abasaeed, A.E.; Kasim, S.O.; Osman, A.I.; Patel, R.; Kumar, R. Ce Promoted Lanthana-Zirconia Supported Ni Catalyst System: A Ternary Redox System for Hydrogen Production. Mol. Catal. 2021, 504, 111498. [Google Scholar] [CrossRef]
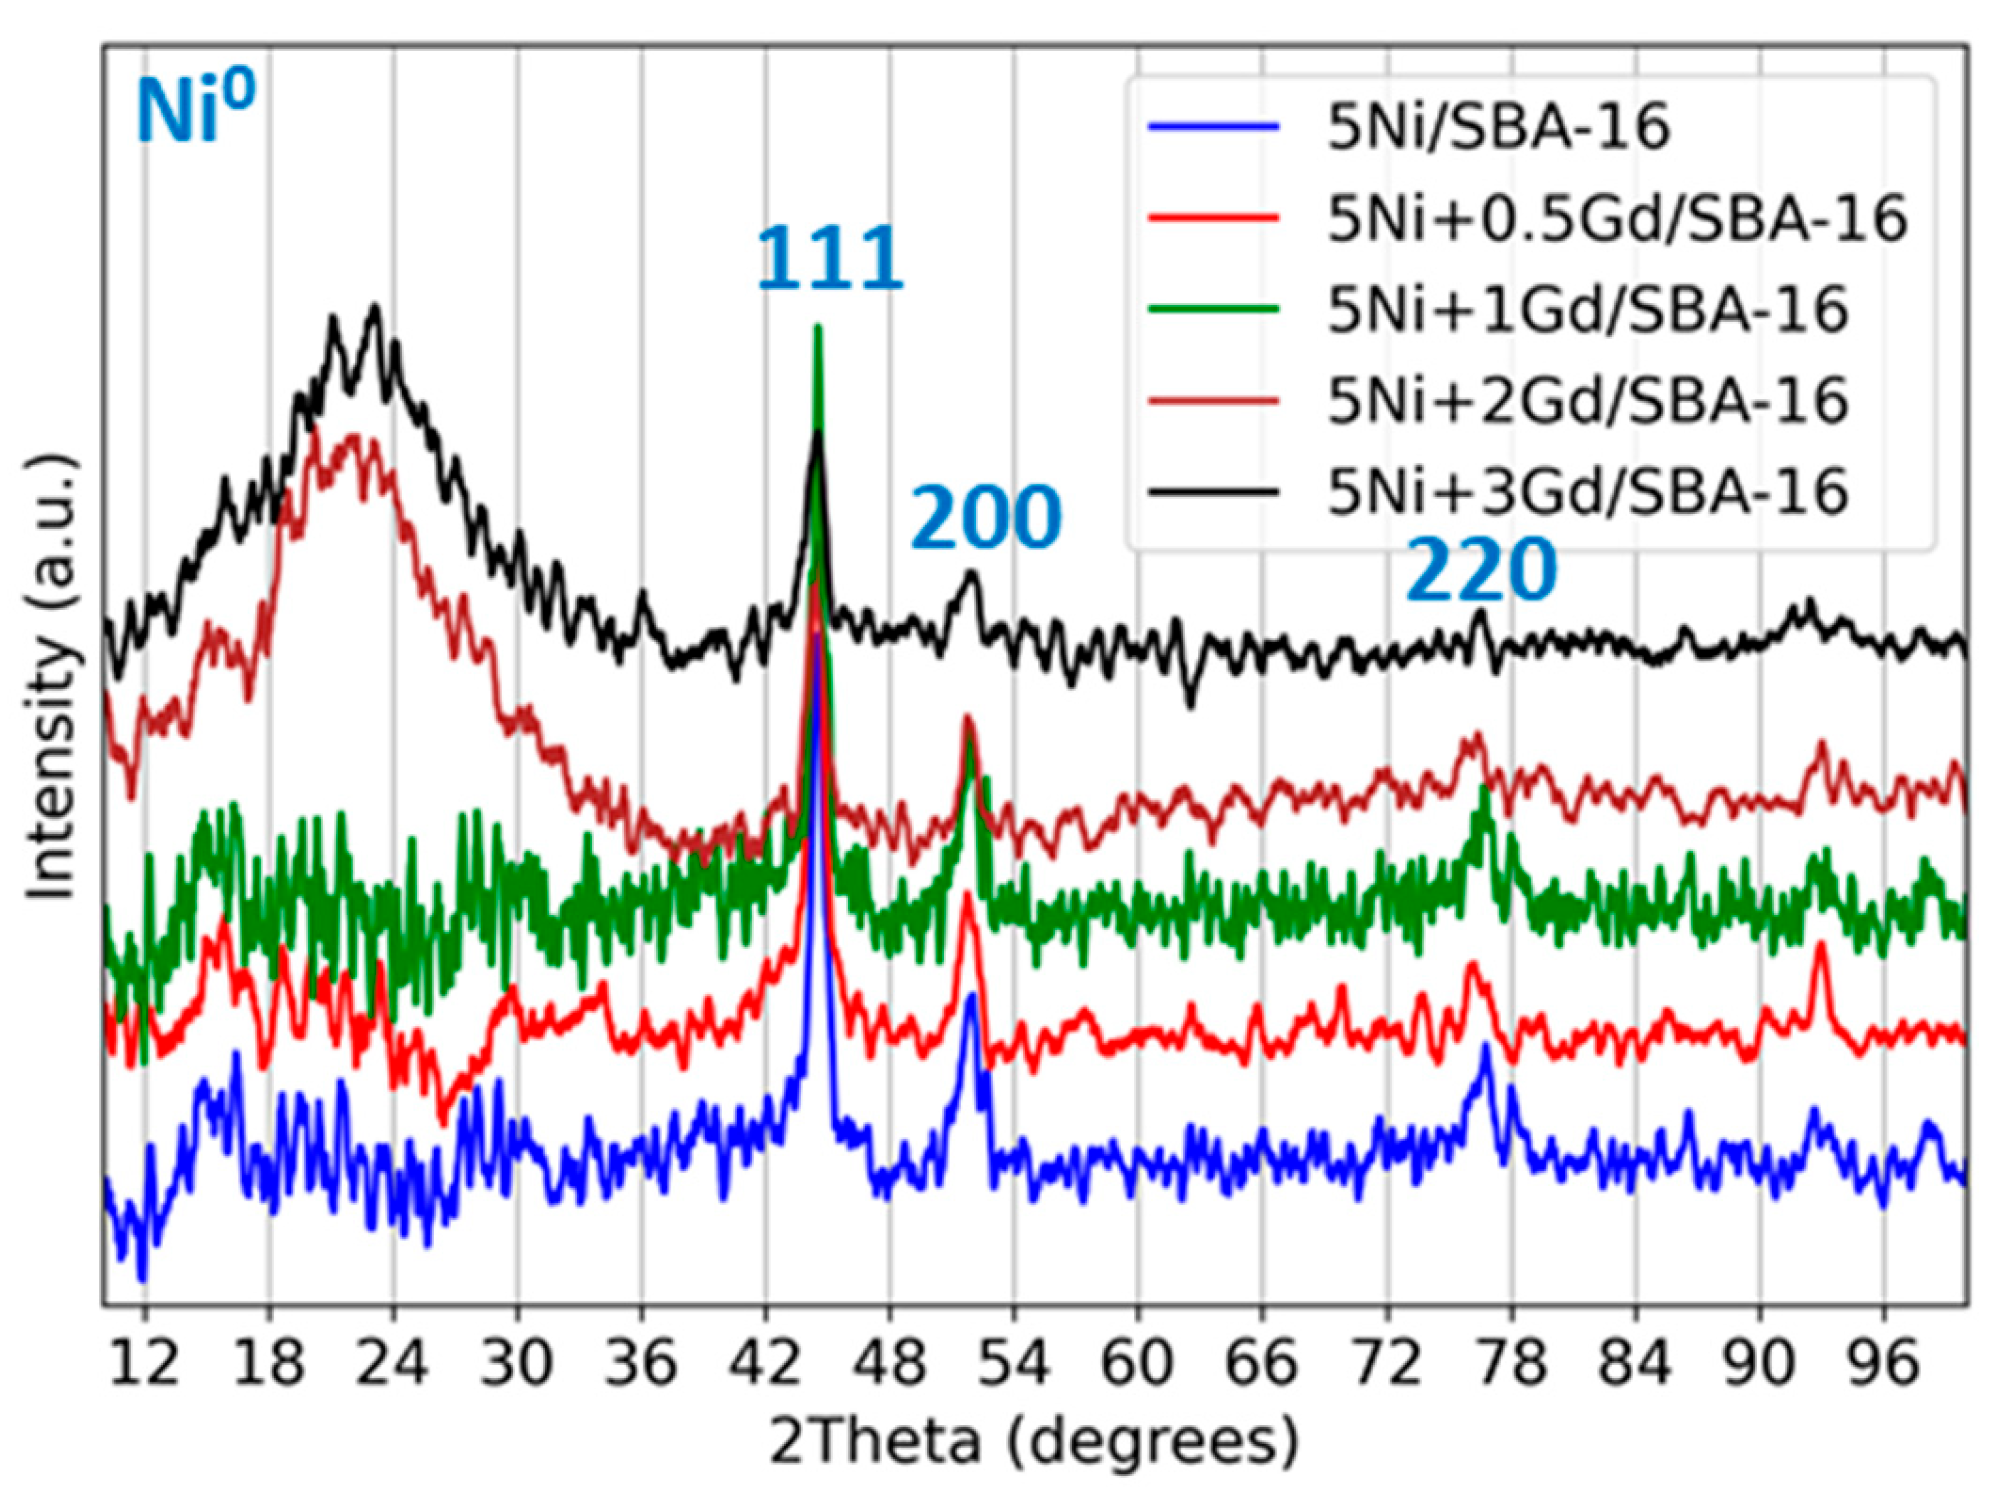
Figure 1. XRD patterns of reduced 5Ni+xGd/SBA-16 catalysts (x = 0, 0.5, 1, 2, 3 wt.%).
Nanomaterials 15 01527 g001
Figure 2. (a) N2 adsorption–desorption isotherms and (b) corresponding pore size distribution curves of the reduced 5Ni+xGd/SBA-16 (x = 0, 0.5, 1, 2, 3 wt.%).
Nanomaterials 15 01527 g002
Figure 3. XPS spectra of the catalysts concerning Si 2p, and O 1s, (a) 5Ni/SBA-16, (b) 5Ni+0.5 Gd/SBA-16, (c) 5Ni+1Gd/SBA-16, (d) 5Ni+2Gd/SBA-16 and (e) 5Ni+3Gd/SBA-16.
Nanomaterials 15 01527 g003
Figure 4. (a) H2–TPR reduction profiles of fresh and (b) post–CO2–TPD H2–TPR profiles for 5Ni +xGd/SBA-16 catalysts (x = 0.5, 1, 2, 3 wt.%).
Nanomaterials 15 01527 g004
Figure 5. Catalytic activity results versus TOS at 800 °C (a) yield of H2, (b) yield of CO, and (c) H2/CO ratio for reduced 5Ni+xGd/SBA-16 (x= 0, 0.5, 1, 2, 3 wt.%).
Nanomaterials 15 01527 g005
Figure 6. Proposed reaction mechanism for DRM over Gd-promoted Ni/SBA-16 catalysts. The Ni active sites (grey circles) facilitate CH4 activation, while Gd promoter species (green circles) enhance CO2 adsorption and oxygen mobility, forming intermediates (H2 + C) and (O* + CO) that yield syngas (2H2 + 2CO). The asterisk (O *) represents active surface oxygen species participating in the DRM reaction.
Nanomaterials 15 01527 g006
Figure 7. RSM-3D surface and contour plots depicting the interactive effects of process variables on H2 and CO yields during DRM (a) H2 yield as a function of temperature and GHSV at a fixed CH4/CO2 ratio of 1, (b) CO yield as a function of temperature and GHSV at a fixed CH4/CO2 ratio of 1, (c) H2 yield as a function of temperature and CH4/CO2 ratio at a fixed GHSV of 35,000 mL g−1 h−1, and (d) CO yield as a function of temperature and CH4/CO2 ratio at a fixed GHSV of 35,000 mL g−1 h−1.
Nanomaterials 15 01527 g007
Table 1. Process parameters for the CCD modeling approach, showing both the actual experimental ranges (temperature, GHSV, and CH4/CO2 ratio) and their corresponding coded values.
Process ParametersLevelsLevels
−1 (Low)+1(High)
GHSV: Gas hourly space velocity (mL g−1 h−1)22,00048,000
T: Temperature (°C)700850
R: CH4/CO20.51.5
Table 2. Central Composite Design (CCD) matrix for three factors (temperature, GHSV, CH4/CO2). The table shows coded values and corresponding experimental runs.
RunT (Coded)SV (Coded)R (Coded)Temperature (°C)GHSV
(mL g−1 h−1)
CH4/CO2
1+1.000−1.000+1.00085022,0001.25
2+1.000−1.000−1.00085022,0000.75
3−1.000−1.000+1.00070022,0001.25
4−1.000−1.000−1.00070022,0000.75
50.000−1.0000.00077522,0001.00
6+1.0000.0000.00085035,0001.00
70.0000.000+1.00077535,0001.25
8−1.0000.0000.00070035,0001.00
90.0000.0000.00077535,0001.00
100.0000.000−1.00077535,0000.75
110.000+1.0000.00077548,0001.00
12+1.000+1.000+1.00085048,0001.25
13+1.000+1.000−1.00085048,0000.75
14−1.000+1.000+1.00070048,0001.25
15−1.000+1.000−1.00070048,0000.75
16+0.333+1.000−1.00080048,0000.75
17+0.3330.0000.00080035,0001.00
Table 3. (a). Si 2p XPS binding energies and relative peak areas for 5Ni+xGd/SBA-16 (x = 0, 0.5, 1, 2, 3 wt.%) catalysts. (b). O 1s XPS binding energies and relative peak areas corresponding to 5Ni+xGd/SBA-16 (x = 0, 0.5, 1, 2, 3 wt.%) catalysts.
(a)
Peak
Assignment
Parameter5Ni/SBA-165Ni+0.5Gd/SBA-165Ni+1Gd/SBA-165Ni+2Gd/SBA-165Ni+3Gd/SBA-16
Si–O–MB.E. (eV)104.1104.4104.7105.0Not observed
% area8.133.418.719.6Not observed
Si–O–SiB.E. (eV)103.3103.6103.8103.7103.8
% area16.119.728.524.137.9
Si–O–HB.E. (eV)102.4102.6102.9102.6102.5
% area42.126.137.030.516.8
SiOx (x < 2)B.E. (eV)100.8100.4100.7101.7101.3
% area33.720.915.825.819.4
(b)
Peak
Assignment
Parameter5Ni/
SBA-16
5Ni+0.5Gd/SBA-165Ni+1Gd/SBA-165Ni+2Gd/SBA-165Ni+3Gd/SBA-16
Si–O–SiB.E. (eV)533.8533.8533.4533.4532.9
% area21.832.326.128.525.3
Si–O–MB.E. (eV)532.9532.7532.4532.1531.9
% area17.623.219.431.316.9
C–O / C=OB.E. (eV)532.0531.7531.4531.4531
% area33.819.735.822.67.6
M–O–MB.E. (eV)530.1530.1529.0530.6529.6
% area26.824.918.617.650.1
Table 4. Peak temperatures and corresponding areas for H2–TPR profiles of fresh and post–CO2-TPD 5Ni + xGd/SBA-16 catalysts (x= 0, 0.5, 1, 2, 3 wt.%).
CatalystPeakTemp. (°C)
Fresh
% Area
Fresh
Temp. (°C)
After CO2-TPD
% Area
After CO2-TPD
5Ni+0.5Gd/SBA-161390.432.3355.010
2435.225.8394.912.7
3486.924.4446.017.8
4580.917.6528.159.5
5Ni+1Gd/SBA-161386.525.7332.311.5
2431.423.7395.210.2
3481.327.5451.920.1
4589.623.1544.458.2
5Ni+2Gd/SBA-161377.77.7343.66.8
2414.036.4390.06.4
3478.625.1456.831.1
4598.030.8565.355.7
5Ni+3Gd/SBA-161393.16.1401.926.9
2434.125.9453.47.1
3509.937.7492.810.9
4638.030.3571.655.1
Table 5. Theoretical optimum and experimental conditions for process optimization, showing the key variables (temperature, GHSV, and CH4/CO2 ratio), their corresponding goals, and the resulting H2 yield.
VariablesGoal
Function
Theoretical OptimumExperimental Validation
Temperature (°C)700–850848.9845
GHSV (mL g−1 h−1)22,000–48,00031,28331,283
CH4/CO2 ratio0.5–150.610.61
H2 yield (%)Maximum96.6496.66
Disclaimer/Publisher’s Note: The statements, opinions and data contained in all publications are solely those of the individual author(s) and contributor(s) and not of MDPI and/or the editor(s). MDPI and/or the editor(s) disclaim responsibility for any injury to people or property resulting from any ideas, methods, instructions or products referred to in the content.