Article

Enhanced Electrochromic Properties of NiOx Films Through Magnesium Doping Strategy

by
Xiaoyu Yao
1,†,
Shuai Ding
1,†,
Xiaoyu Shen
1,
Congkai Guo
1,
Yao Liu
1,
Wenjuan Xia
1,
Guohua Wu
2,3,* and
Yaohong Zhang
1,*
1
School of Physics, Northwest University, Xi’an 710127, China
2
Qingdao Innovation and Development Center of Harbin Engineering University, Harbin Engineering University, Qingdao 266000, China
3
College of Materials Science and Chemical Engineering, Harbin Engineering University, Harbin 150001, China
*
Authors to whom correspondence should be addressed.
These authors contributed equally to this work.
Nanomaterials 2025, 15(16), 1217; https://doi.org/10.3390/nano15161217
Submission received: 13 July 2025 / Revised: 5 August 2025 / Accepted: 6 August 2025 / Published: 8 August 2025
(This article belongs to the Section Nanophotonics Materials and Devices)

Abstract

In order to improve the electrochromic properties of NiOx films, Mg ions were introduced into NiOx films using the sol–gel method and the spin-coating method. The introduction of Mg ions leads to the loose structure of the compact NiOx film, which can provide more channels for the transport of OH. In addition, the introduction of Mg ions increases the oxygen vacancies and oxygen interstitial defects in the NiOx film, which effectively increases the reactive sites and improves the charge transfer efficiency at the interface between the NiOx film and the electrolyte. The electrochemical results further show that the film electrode (NiOx-Mg2) has the largest charge storage capacity when the Mg doping concentration is 10%. Compared with the undoped NiOx film, the doping of Mg improves the transmittance modulation (ΔT) performance of the NiOx film (ΔT up to 55.8%) and shortens the response time (2.39 s/0.63 s for coloring/bleaching). In general, Mg doping is an effective method for improving the electrochromic properties of NiOx films.

1. Introduction

Electrochromic materials refer to materials whose optical properties (such as transmittance, absorbance, reflectance, or emissivity) can change dynamically and reversibly under an externally applied low voltage [1,2]. Therefore, they can effectively absorb or reflect external thermal radiation and internal heat diffusion. With their active control ability and low energy consumption characteristics, they are widely used in many fields such as energy-saving smart windows [3,4,5,6], multicolor displays [7,8,9,10], and military camouflage [11,12,13]. Among many inorganic electrochromic materials, NiOx has been widely studied and applied in electrochromic devices due to its low material cost, high-efficiency performance, and strong anodic coloring optical modulation ability [14,15].
NiOx film can switch between transparent and dark brown states. Its color-changing mechanism mainly stems from the reversible redox reaction of Ni2+ and Ni3+ in an alkaline medium [16,17,18]. Currently, the reversible redox reaction of NiOx is usually represented by Equations (1) and (2) [19]. During the coloring stage, after an external voltage is applied, NiOx reacts with OH in the electrolyte, causing the film to turn dark brown. During the bleaching stage, by changing the applied voltage, OH returns from the film to the electrolyte, and the film then returns to a transparent state. However, pure NiOx films face many challenges in practical applications, such as long response time, poor light modulation performance, and limited charge storage capacity. These problems severely restrict their wide application in the optoelectronic industry. In view of this, modifying electrochromic materials through various means has become one of the important research directions in the current field.
N i O b l e a c h e d + O H N i O O H c o l o r e d + e
N i O H 2 b l e a c h e d + O H N i O O H c o l o r e d + H 2 O + e  
Doping with foreign elements is considered one of the important means to improve the electrochromic performance of NiOx films [20]. So far, some metal elements have been used to prepare doped NiOx films. For example, Wang et al. [21] prepared NiO films with different cerium doping concentrations (0.5%, 1%, 2%) using electron beam evaporation technology. Ce doping significantly increased the charge density of the films. The charge density of the 1% Ce: NiO film increased from 4.86 mC·cm−2 to 8.14 mC·cm−2, an increase of 67.5%. In addition, the 1% Ce: NiO film showed enhanced electrochromic performance. The transmittance modulation (ΔT) at 633 nm increased by 27.4%, the coloration efficiency (CE) was enhanced by 27.1%, and the response time was faster (9.64 s/6.76 s for bleaching/coloring). Dang et al. [22] used hydrothermal technology to prepare V-doped NiO films with a two-dimensional porous framework. The introduction of vanadium significantly expanded the surface area of the film, thereby effectively improving the diffusion kinetics of OH in the electrochromic process. The transmittance modulation was 81.9% at 600 nm, and the response time was improved to 1.2 s/0.9 s (coloring/bleaching time). Zhao et al. [23] introduced Mn into the NiO film to improve its electrochromic performance. The optimized NiO-Mn-3 film (the molar ratio Mn/Ni = 3%) exhibits outstanding electrochromic properties, with particularly significant changes in transmittance modulation (550 nm is 81.8%), fast response time (5.1 s for coloring and 3.5 s for bleaching), and high coloration efficiency (61.09 cm2·C−1), which are considered to be closely related to the increased specific surface area and enhanced ion diffusion coefficient. These studies clearly reveal the significant influence of metal doping on the electrochromic properties of NiOx film. Mg, as a lightweight metal, has an ionic radius (Mg2+: 0.72 Å) similar to that of (Ni2+: 0.69Å) and can introduce defects such as oxygen interstitials or cation vacancies into the NiOx lattice [24,25,26]. Therefore, the Mg doping strategy is expected to significantly improve the electrochromic properties of NiOx by optimizing its ion diffusion mechanism.
In this paper, NiOx films with different Mg doping concentrations (0%, 5%, 10%, 15%) were successfully prepared by the sol–gel method and the spin-coating method, and named NiOx, NiOx-Mg1, NiOx-Mg2, and NiOx-Mg3, respectively. The lattice strain and defect types induced by Mg doping were systematically analyzed by means of X-ray diffraction, Raman spectroscopy, and X-ray photoelectron spectroscopy. Furthermore, the influence rules of Mg doping on the charge storage capacity, optical modulation ability, and cycling stability of NiOx films were revealed through cyclic voltammetry, chronoamperometry, and in situ spectroelectrochemical tests. The results show that the NiOx-Mg2 film electrode exhibits excellent transmittance modulation performance (ΔT reaches 55.4%) and a response time of 2.39 s/0.63 s (coloring/bleaching time), which are greatly improved compared with the transmittance modulation (ΔT is 46.3%) and response time (coloring/bleaching time was 2.59 s/0.85 s, respectively) of the undoped NiOx film electrode. In addition, the NiOx-Mg2 film electrode also shows better charge storage capacity.

2. Materials and Experiment Section

2.1. Materials

Nickel acetate tetrahydrate (Ni(CH3COO)2·4H2O), ethylene glycol methyl ether (CH3OCH2CH2OH), potassium hydroxide (KOH), and ethanol were purchased from Aladdin Chemical Reagent Co., Ltd. (Shanghai, China). Magnesium acetate tetrahydrate (Mg(CH3COO)2·4H2O), toluene, and acetone were purchased from Sinopharm Chemical Reagent Co., Ltd. (Shanghai, China). The ITO-coated glass was produced by OPV Tech Co., Ltd. (Yingkou, China).

2.2. Preparation Method of Precursor

An amount of 0.6221 g of Ni(CH3COO)2·4H2O and 5 mL of ethylene glycol methyl ether were heated at 70 °C with stirring for two hours. Then, the mixture was aged at room temperature for at least 24 h to obtain the NiOx sol precursor. The concentration of the solution was 0.5 mol/L.
The Mg-doped NiOx sol precursor had a similar preparation method to pure NiOx sol. Three groups of Mg-doped NiOx sol were adjusted by changing the addition amount of Mg(CH3COO)2 4H2O with different doping ratios, maintaining a constant total metal ion concentration of 0.5 mol/L. The doping concentrations of Mg were set at 5%, 10%, and 15%, labeled as NiOx-Mg1, NiOx-Mg2, and NiOx-Mg3, respectively.

2.3. Fabrication of Mg-Doped NiOx Films

The ITO substrate (sized 3.0 cm × 1.5 cm) was ultrasonically washed with a foam of deionized water, toluene, acetone, and ethanol. A spin coater was used to coat the substrate surface uniformly with 200 μL NiOx and Mg-doped NiOx sol at a speed of 2400 rpm. Then, the substrate was dried on a heating platform at 100 °C for 10 min. Subsequently, the substrate was removed to a muffle furnace for gradient annealing treatment. The annealing process involved increasing the temperature from room temperature to 300 °C at a rate of 5 °C/min, holding it for 60 min, and then allowing it to cool naturally. The above process was repeated three more times. This resulted in NiOx and Mg-doped NiOx films.

2.4. Characterization

The crystalline phase of the film was characterized by X-ray diffraction (XRD, D8 Advanced, Bruker, Germany) using Cu-k-α radiation. The influence of Mg doping on the crystal structure of NiOx was studied by Raman spectroscopy (DXR2, Thermo Fisher Scientific, America). The microstructure of the NiOx film doped with magnesium was analyzed by scanning electron microscopy (SEM, Apreo S, Thermo Fisher Scientific, Czech Republic). High-precision spectral data were provided for the surface analysis of Mg-doped NiOx crystals by X-ray photoelectron spectroscopy (XPS, ESCALAB Xi+, Thermo Fisher Scientific, America). The optical properties of the film were tested using an optical fiber spectrometer (AvaSpec-ULS2048CL-EVO, Avantes, Netherlands). To determine the electrochemical properties of the film, an electrochemical test was carried out using a three-electrode system with the sample as the working electrode, 1M KOH as the electrolyte, a silver/silver chloride (Ag/AgCl) as the reference electrode, and a platinum sheet as the counter electrode. The electrochemical properties of the film were measured using an electrochemical workstation (Squidstat Plus 1454, Admiral, America). The scanning voltage was −0.6 ~ +0.6 V. Cyclic voltammetry (CV) tests were carried out at different scanning rates and with a set number of cycles. The resistance of the film was measured by electrochemical impedance spectroscopy (EIS), and the electrochemical properties of the film were analyzed.

3. Results and Discussion

3.1. Sample Characterization

The effect of Mg doping on the crystal structure of NiOx films was systematically investigated using X-ray diffraction (XRD) technology. As shown in Figure 1a, the XRD patterns of all samples exhibited similar diffraction peak characteristics, and obvious characteristic peaks were detected at 2θ = 37.2°, 43.2°, 62.9°, 75.4°, and 79.3°, corresponding to the (101), (012), (110), (113), and (202) crystal planes in the PDF#44-1159 card, respectively. Through the analysis of the XRD patterns, it was determined that all samples presented a typical NiOx face-centered cubic structure, and no impurity phase was detected, indicating that Mg doping did not introduce any impurity phases. In addition, compared with undoped NiOx films, the diffraction peaks of Mg-doped films shifted slightly toward small angles (see Figure 1b), indicating that the interplanar spacing of the crystal planes of Mg-doped films increased slightly. This can be attributed to the difference in ionic radius between Ni2+ (0.69 Å) and Mg2+ (0.72 Å) [23]. Furthermore, the Raman spectra of NiOx and its Mg-doped NiOx films were characterized, and the results are shown in Figure 1c. The Raman spectra of the four films exhibit two characteristic peaks located at 514.37 cm−1 and 1090 cm−1, respectively. These two characteristic peaks correspond to the single-phonon longitudinal optical (1LO) mode and the two-phonon longitudinal optical (2LO) mode [27]. In the Raman spectrum of the undoped NiOx film, the broad peak at 514.37 cm−1 is consistent with the reports in the literature regarding the NiOx phase. This peak is due to the Ni-O stretching vibration mode and the single-phonon longitudinal optical mode in NiOx [28]. It is worth noting that the appearance of the broad 1LO peak in the film’s Raman spectrum may be related to nickel vacancies or oxygen interstitial defects, which may disrupt the periodicity of the lattice, causing the LO phonon mode to no longer strictly satisfy momentum conservation, resulting in peak displacement and broadening [29,30]. As the Mg doping concentration gradually increases, the 1LO peak shows an obvious blue shift. When the Mg doping concentrations are 5%, 10%, and 15%, respectively, the 1LO peak blue-shifts to 515.34 cm−1, 520.16 cm−1, and 528.83 cm−1, respectively. In addition, we systematically characterized the intrinsic optical transmittance spectra of NiOx and Mg-doped NiOx films using ordinary slides as the substrate, and accurately calculated their optical band gaps (Eg) based on the Tauc plot. It was found that the Eg of films showed a monotonically increasing trend with the doping concentration gradient. As shown in Figure S1, the optical band gap of the undoped sample is 3.25 eV. As the Mg doping amount gradually increases (NiOx-Mg1, NiOx-Mg2, and NiOx-Mg3), its Eg values correspond to 3.27 eV, 3.30 eV, and 3.34 eV, respectively, showing a significant doping concentration dependence. This phenomenon is attributed to the lattice expansion induced by Mg doping: the substitution of Ni2+ (0.69 Å) by Mg2+ (0.72 Å) causes local lattice distortion, leading to an upward shift in the conduction band minimum (CBM) energy level. At the same time, the formation of oxygen interstitials further expands the energy separation between the valence band maximum (VBM) and the conduction band by enhancing the electron–phonon coupling effect [31], thereby reducing the absorption of the NiOx film in the visible light region and improving its optical transparency in the bleached state.
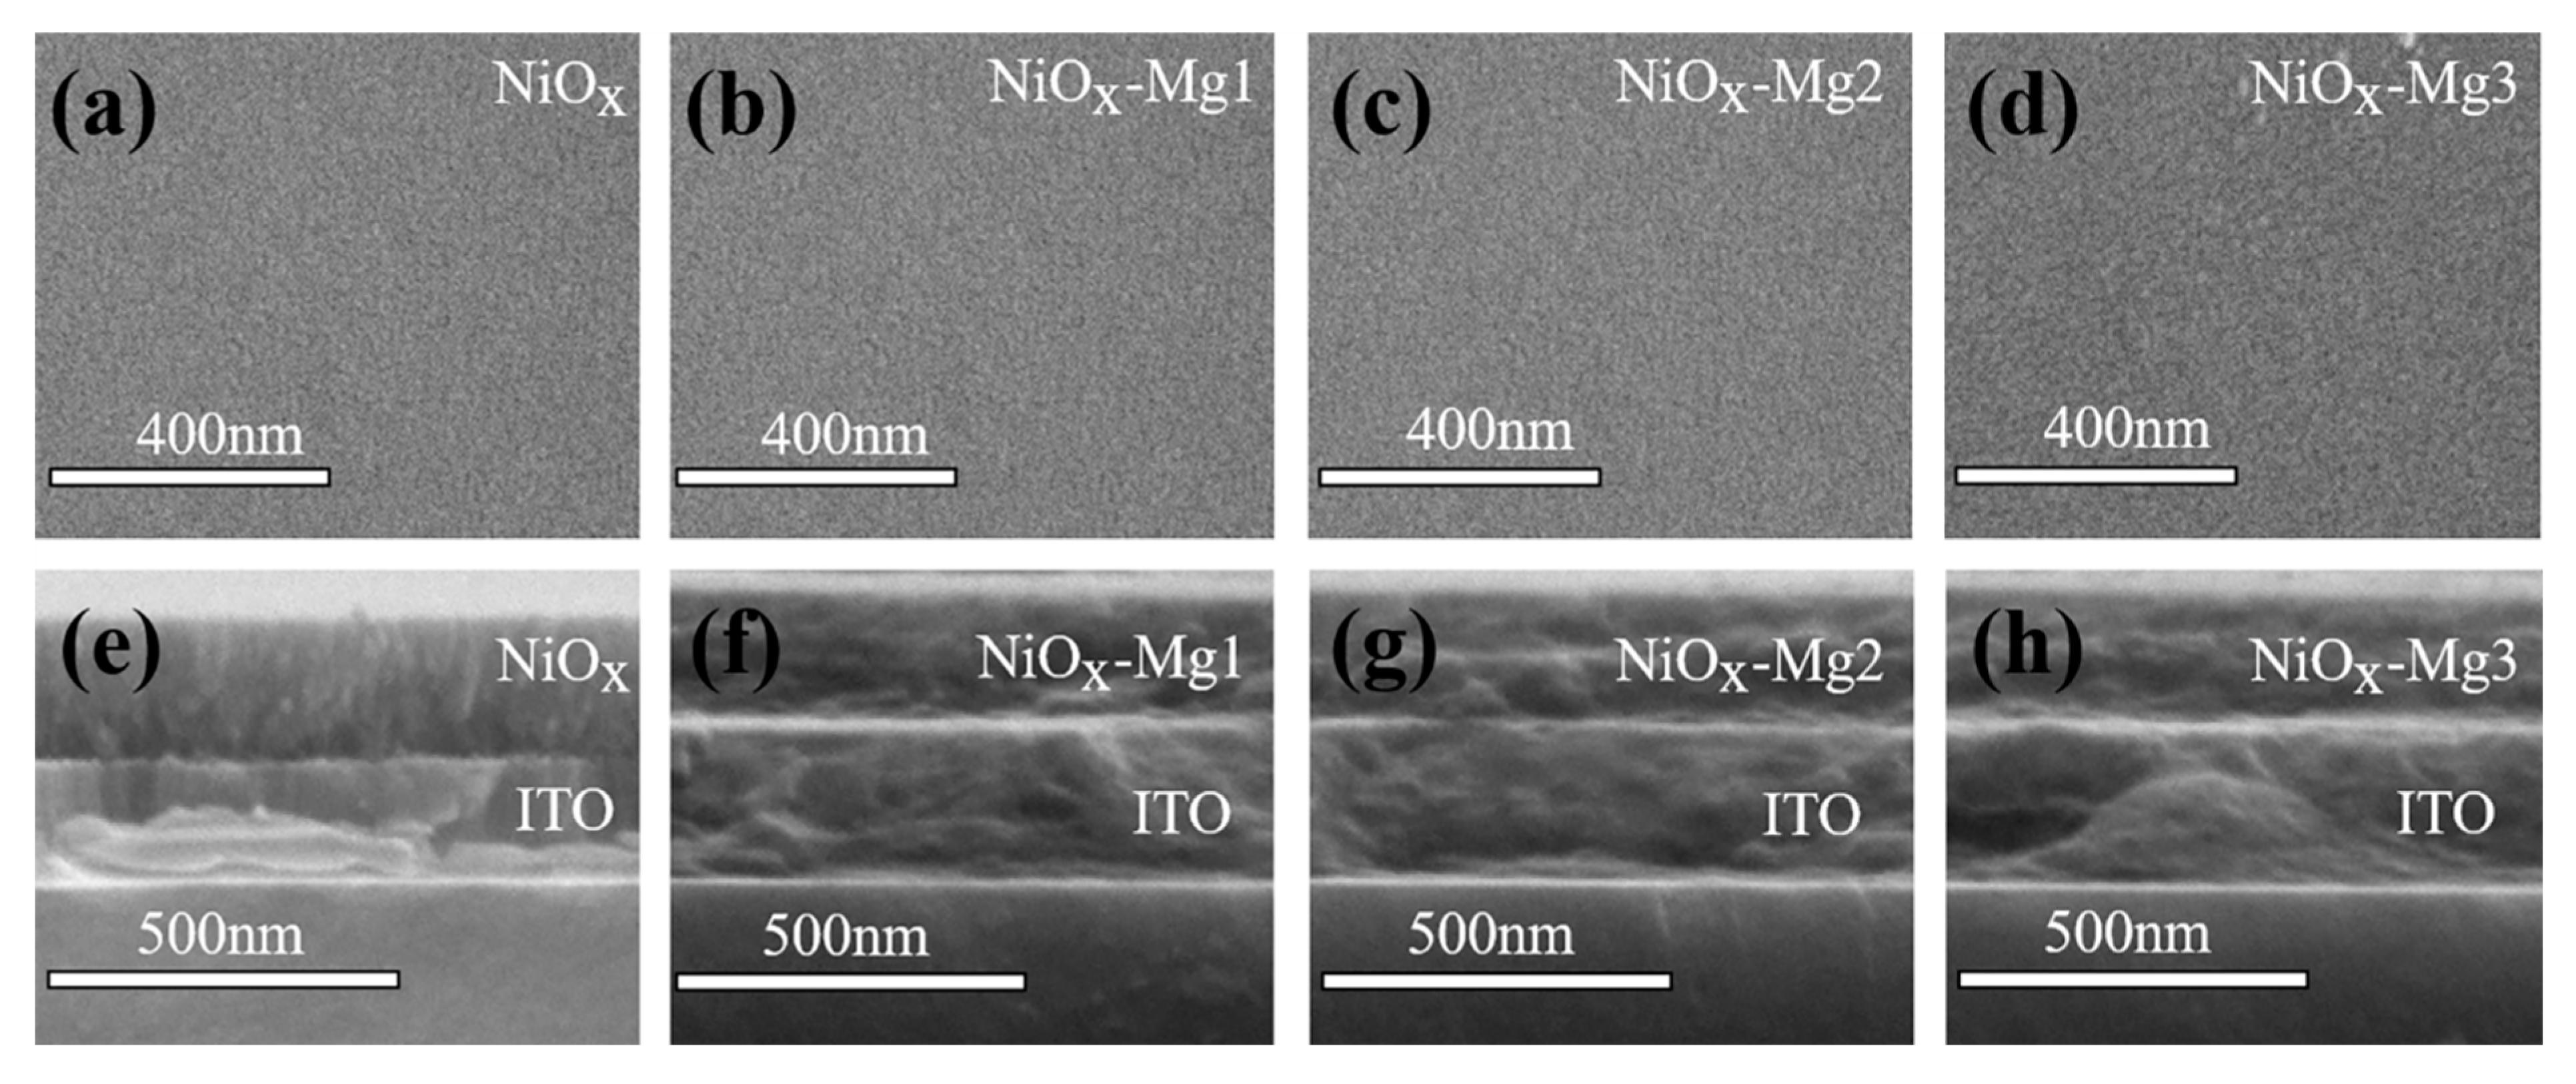
Figure 2a–h show scanning electron microscope (SEM) images of the surface and cross-sectional morphology of undoped and Mg-doped NiOx films. From the surface SEM images in Figure 2a–d, it can be seen that all films exhibit a uniform and flat surface morphology. Further, the cross-sectional morphology of the films was characterized, and the results are shown in Figure 2e,f. The thicknesses of NiOx-Mg1, NiOx-Mg2, and NiOx-Mg3 are 242 nm, 248 nm, and 240 nm, respectively, while the thickness of the undoped NiOx film is 258 nm. In addition, the undoped NiOx film presents a relatively dense microstructure. In contrast, the microstructures of the NiOx-Mg1, NiOx-Mg2, and NiOx-Mg3 films are relatively looser. This relatively loose morphological feature is beneficial to the ion intercalation and deintercalation processes, thus helping to improve the electrochromic performance of the films. The energy-dispersive spectroscopy (EDS) elemental distribution map shows that the Ni, O, and Mg elements are uniformly distributed in NiOx-Mg1, NiOx-Mg2, and NiOx-Mg3 (Figure S2a–d), and the quantitative analysis results of the elemental composition are summarized in Table 1. According to the EDS data, the atomic percentages of Mg elements in NiOx-Mg1, NiOx-Mg2, and NiOx-Mg3 increase successively, being 1.9%, 3.0%, and 4.6%, respectively. This trend fully confirms the effectiveness of the Mg doping concentration gradient design. Further analysis finds that the Mg/(Mg + Ni) ratios of NiOx-Mg1, NiOx-Mg2, and NiOx-Mg3 are 5.4%, 9.6%, and 14.6%, respectively, which are close to the theoretical doping concentrations (5%, 10%, and 15%, respectively) [32]. Compared with undoped NiOx, the nickel content in NiOx-Mg2 and NiOx-Mg3 significantly decreased to 28.1% and 27.0%, while the oxygen content slightly decreased to 68.9% and 68.4%. The decrease in oxygen element is much lower than the loss of nickel, indicating the existence of oxygen interstitial defects during the Mg doping process. In addition, the decrease in oxygen element content also indicates the generation of oxygen vacancy defects. Relevant studies have shown that the introduction of an appropriate amount of oxygen defects helps to enhance the electrochromic performance of the film [33,34].
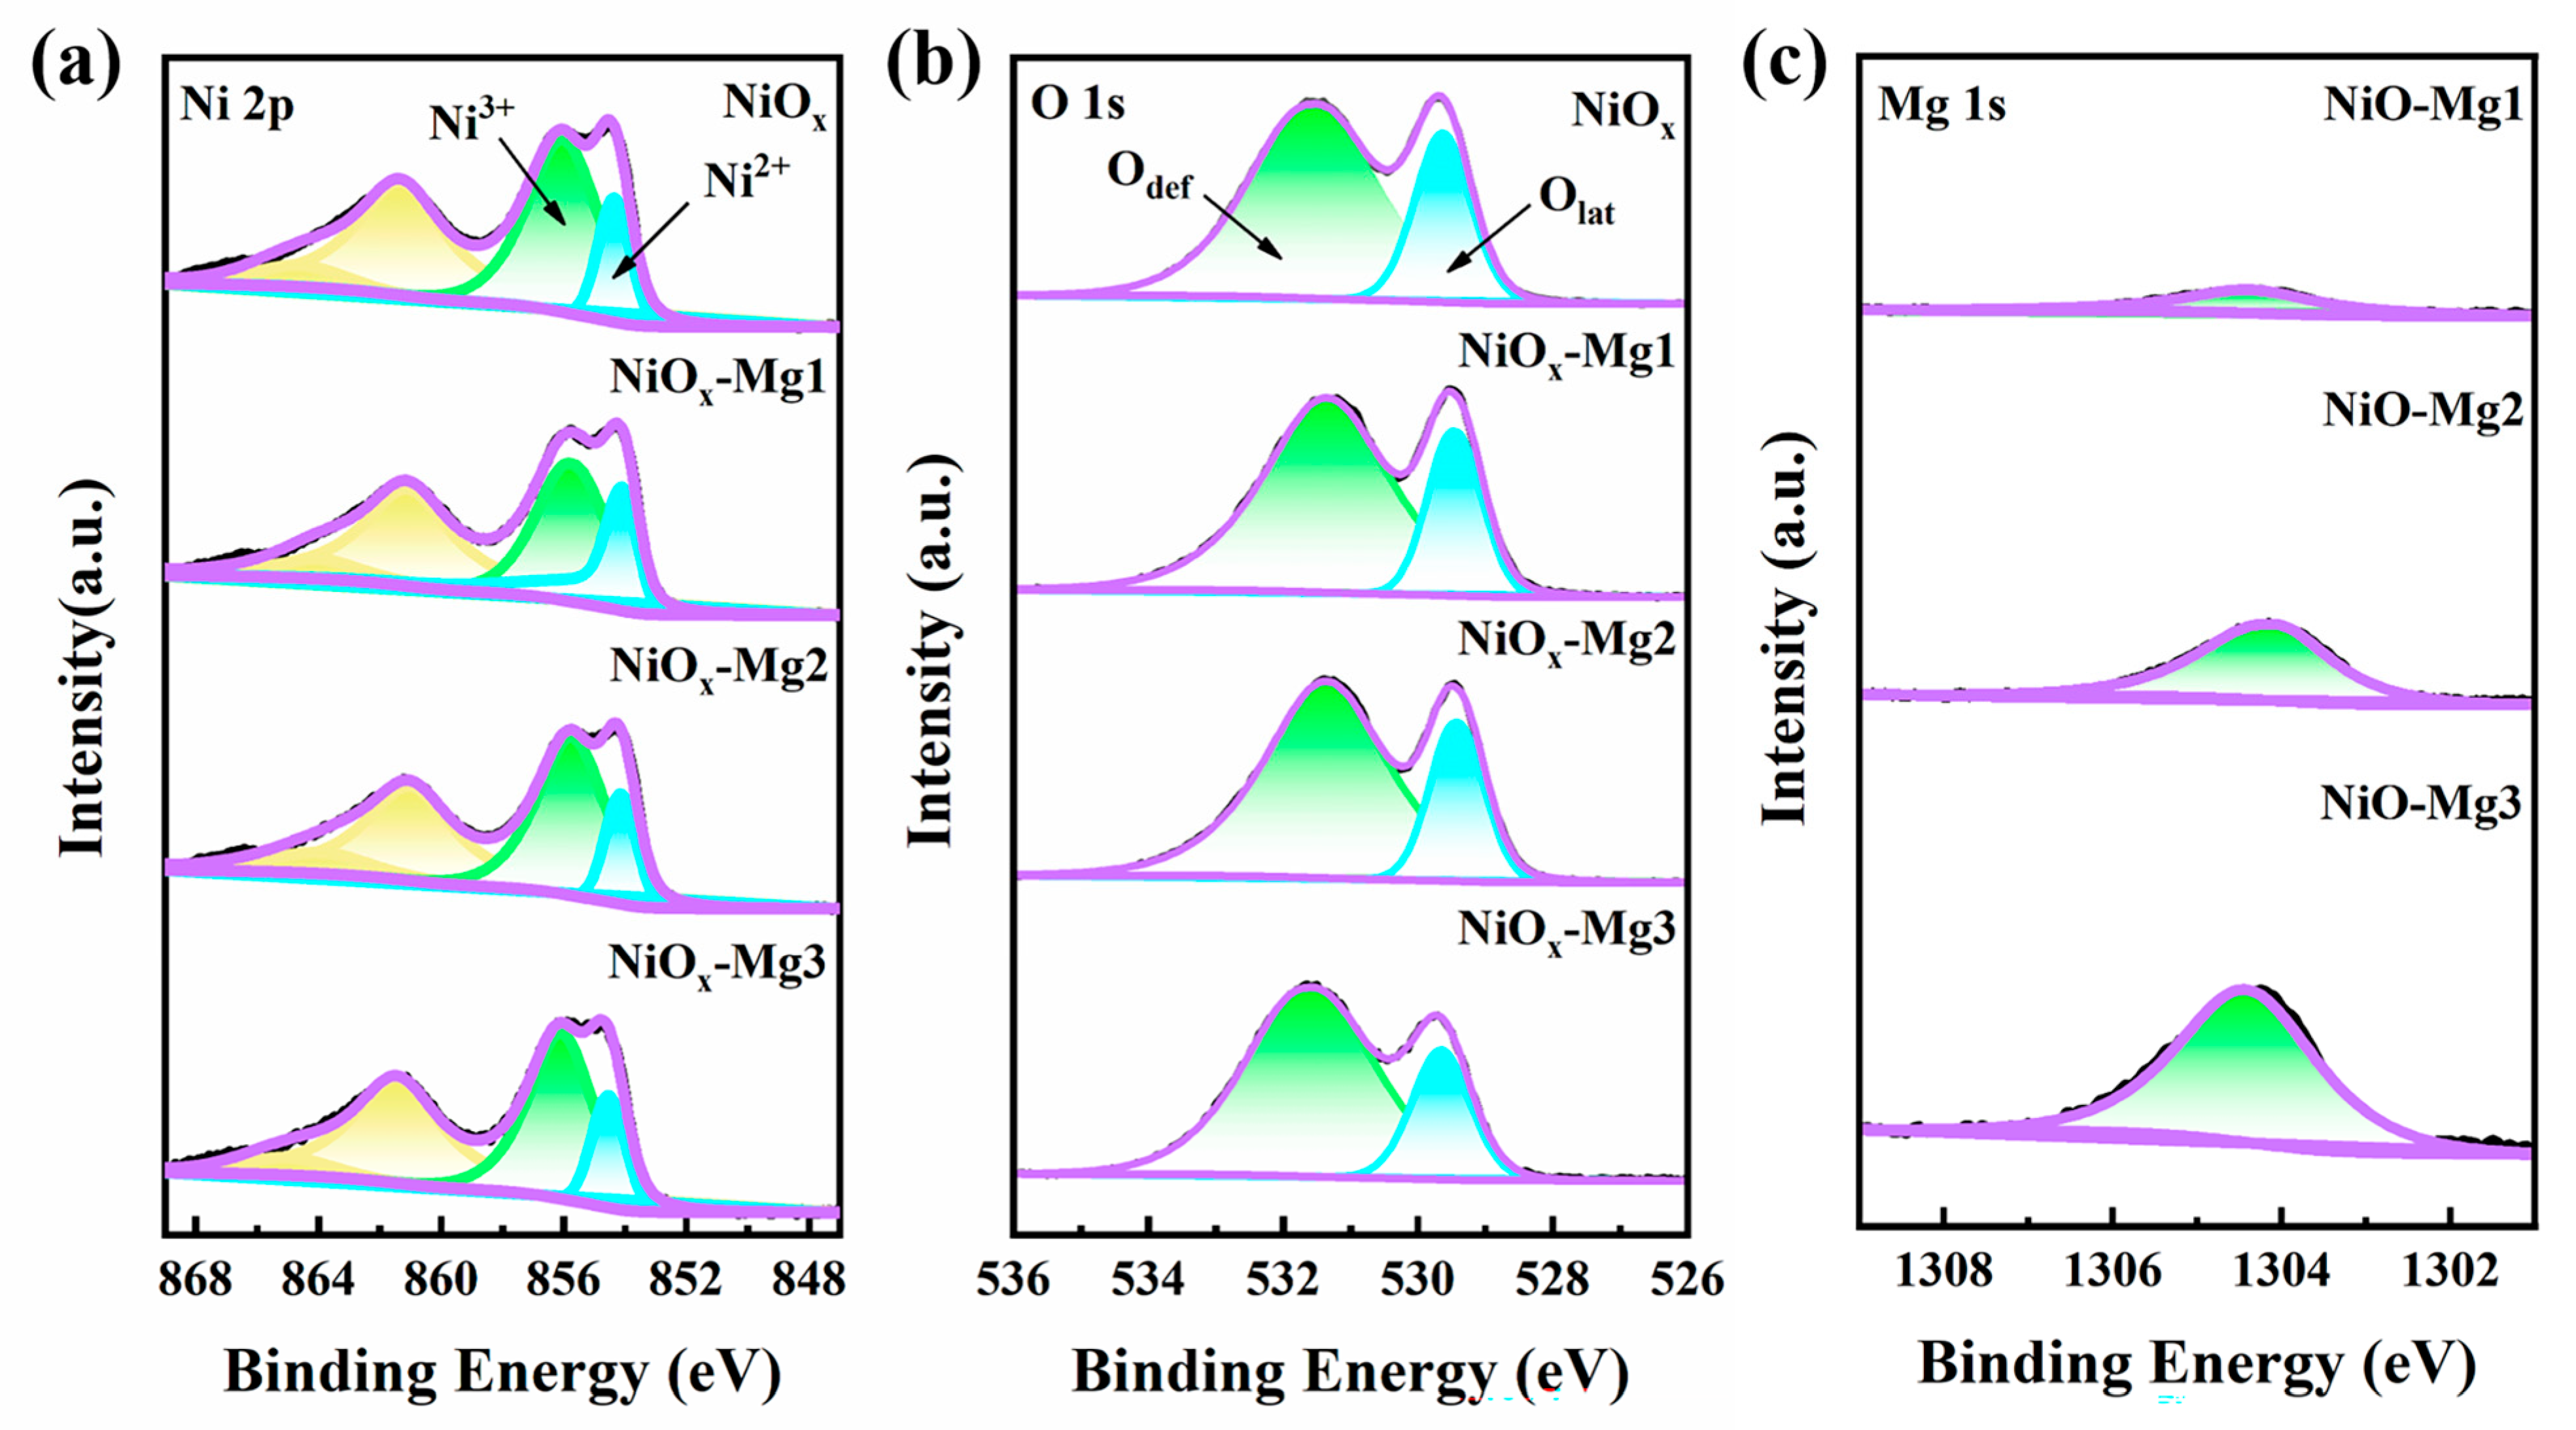
To explore the surface composition and chemical state of the films, XPS measurements were carried out on the original NiOx and Mg-doped NiOx films. As shown in Figure 3, the characteristic satellite peak of Ni 2p appears near 862 eV, confirming that nickel exists in the form of a mixed valence state (Ni2+/Ni3+), which is consistent with the electronic structure characteristics of typical nickel oxides [19]. The results show that the binding energies of Ni2+ and Ni3+ of the intrinsic NiOx are located at 854.35 eV and 856.05 eV, respectively (see Table S1). With the change in the Mg doping concentration gradient, the Ni 2p peak of the low-doping groups (NiOx-Mg1 and NiOx-Mg2) shows a negative shift of 0.2–0.4 eV, while the high-doping group (NiOx-Mg3) shows a positive shift of about 0.3 eV. In addition, as the doping amount of Mg2+ increases, the ratio of Ni3+/Ni2+ shows an upward trend. This might be due to the fact that Mg ions caused some nickel vacancies during the doping process. To maintain charge neutrality, some Ni2+ was oxidized to Ni3+, thereby increasing the relative content of Ni3+ [19,35]. O 1s can be decomposed into two main components: lattice oxygen (Olat) and oxygen defects (Odef) [36]. The peak located at 529.55 eV is attributed to Olat, indicating that O forms a stable oxide structure with Ni; the peak located at 531.50 eV is attributed to Odef (oxygen interstitials and oxygen vacancies), corresponding to the O2− state in the oxygen defect region [37]. By calculating the ratio of Odef/Olat (Table S1), it is found that the ratio of Odef/Olat gradually increases with the increase in the doping ratio, indicating that Mg doping introduced oxygen interstitials and oxygen vacancies in the NiOx film. The Mg 1s peak is located at 1304.5 eV, indicating that Mg ions are successfully doped into the nickel oxide film.

3.2. Electrochemical and Electrochromic Properties

The electrochemical behaviors of the original NiOx and Mg-doped NiOx electrode systems were systematically characterized by cyclic voltammetry (CV). The experiment was carried out in the 1 M KOH electrolyte system, with the potential window set from −0.6 V to 0.6 V (vs. reference electrode) and the scanning rate gradient set at 10–100 mV·s−1. As shown in Figure 4a–d, with the increase in the scanning rate, the integral area of the CV curve showed an upward trend, and the anodic oxidation peak potential shifted positively. This is because at a high scanning rate, the rapid polarization of the electric double layer at the electrode–electrolyte interface causes the mass transfer rate to lag behind the electron transfer rate [38]. Further comparative analysis of CV at the 50 mV·s−1 scanning rate (Figure 4e) revealed that with the increase in the Mg doping concentration, the integral area of the CV curve of the electrode material showed a significant increasing trend, accompanied by the displacement of the redox characteristic peaks. This is because Mg doping induces the formation of oxygen defects, significantly increasing the density of active sites on the surface and leading to an increase in the integral charge.
The regulation mechanisms of the interface transport characteristics and the ion diffusion behavior of NiOx electrode materials doped with different Mg concentrations were thoroughly investigated by electrochemical impedance spectroscopy. Figure 4f shows the built-in equivalent circuit, where Rs represents the ohmic resistance of the electrolyte and Rct corresponds to the charge transfer resistance in the semicircular region; the smaller the radius, the lower the transfer resistance. The linear portion in the low-frequency region is described by the Warburg element W, and an increase in slope indicates faster ion diffusion. The parallel CPE element reflects the double-layer capacitance behavior at the interface [39]. The quantitative analysis of the Nyquist plots in the high-frequency region indicates that all samples exhibit similar capacitive arc characteristics. Among them, the NiOx-Mg2 sample has the smallest semicircle radius, which indicates the lowest charge transfer resistance. However, the NiOx-Mg3 sample may cause lattice distortion due to excessive doping, resulting in a substantial increase in the interface charge transfer resistance. Further analysis of the Warburg impedance behavior in the low-frequency region of Figure 4g reveals that compared with the NiOx electrode, the slope of the NiOx-Mg2 electrode shows an increasing trend, while that of the NiOx-Mg3 electrode shows a decreasing trend. The results show that the NiOx-Mg2 electrode has relatively optimal ion transport efficiency. Moderate Mg doping increases the density of active sites on the electrode surface, thereby enhancing the charge storage and release response rate of the NiOx electrode. In contrast, excessive doping may increase the ion diffusion barrier due to lattice distortion, thereby inhibiting ion transport.
Based on Equation (3), we use CV data to quantitatively analyze the contribution of pseudocapacitance and simulate the reaction kinetics accordingly [40]:
i v = k 1 v + k 2 v 1 / 2
where iv is the anodic peak current, v is the scanning rate, and k1 and k2 are constants. Figure 4h shows the i/v1/2-v1/2 curves of different electrode materials. By calculating k1 and k2, we can distinguish the contribution rates of the capacitive effect (k1v) and diffusion controlled insertion (k2v1/2) at a specific potential. Figure 5a–d show the quantitative analysis results of the capacitance contribution ratio of electrode materials with different doping ratios under the gradient change in voltametric scanning rate. The experimental data show that all samples follow the scanning rate dependence rule: as the scanning rate (10–100 mV⋅s−1) increases, the proportion of rapid redox reactions driven by electrochemical polarization on the electrode surface increases significantly, resulting in a systematic upward trend in the proportion of the interfacial pseudocapacitance effect. It is worth noting that the low-doping systems (NiOx-Mg1, NiOx-Mg2) show a higher proportion of pseudocapacitance contribution than the original NiOx electrode in the entire scanning rate range, while the capacitance contribution value of the high-doping sample (NiOx-Mg3) is lower than that of the undoped system. Further, through the quantitative decomposition at the 50 mV·s−1 scanning rate (Figure 5e–h), it is found that the proportions of pseudocapacitance contribution of the NiOx, NiOx-Mg1, NiOx-Mg2, and NiOx-Mg3 electrodes are 75.8%, 76.3%, 84.1%, and 65.1%, respectively. This data pattern reveals a strong correlation between the doping concentration and the charge storage mechanism: moderate Mg doping (NiOx-Mg1, NiOx-Mg2) significantly enhances the surface-controlled pseudocapacitance behavior by optimizing the density of active sites on the electrode surface, which can enhance the charge storage and release response rate, while excessive doping (NiOx-Mg3) may increase the ion diffusion barrier due to lattice distortion, resulting in a gradual transformation of the charge storage process to the bulk diffusion-controlled mechanism [41].
The transmittance modulation properties of the electrode materials in the colored and bleached states were systematically characterized by ultraviolet–visible–near-infrared spectrophotometry. As shown in Figure 6a–d, the ΔT of the original NiOx electrode is 47.1% at 500 nm (characteristic wavelength). After Mg doping modification, the transmittance modulation properties of NiOx-Mg1, NiOx-Mg2, and NiOx-Mg3 electrodes were significantly improved, and their ΔT values reached 48.3%, 55.4%, and 55.8%, respectively. This improvement in performance is mainly due to the regulatory effect of Mg doping on the energy band structure of the material: the defect states introduced by doping increase the charge injection amount and improve the redox activity during the electrochromic process, thereby improving the light absorption efficiency. It is worth noting that as the doping concentration continues to rise, the transmittance modulation performance shows a trend of rapid improvement first and then saturation, indicating the existence of an optimal doping concentration threshold.
Using the chronoamperometry method combined with ultraviolet–visible–near-infrared spectroscopy technology, the dynamic response characteristics of the electrode materials were systematically studied. As shown in Figure 7a–d, the coloring response time (tc) and bleaching response time (tb) of the original NiOx electrode were 2.59 s and 0.85 s, respectively. After doping modification with Mg, the response times (tc/tb) of the NiOx-Mg1, NiOx-Mg2, and NiOx-Mg3 electrodes were optimized to 2.32 s/0.74 s, 2.39 s/0.63 s, and 2.21 s/0.78 s, respectively, indicating that Mg doping effectively shortened the response time of charge storage and release of the NiOx electrode by optimizing the density of active sites on the electrode surface, thereby significantly improving its response rate. Another key indicator for measuring the electrochromic performance of nickel oxide films is the coloration efficiency (CE). Its physical meaning is the change in optical density (ΔOD) caused by the insertion/extraction of charge per unit area, which can also be understood as the ratio of the optical contrast between the colored and bleached states of the film at a fixed wavelength to the charge density [42]. The formula is as follows:
C E = O D Q = log ( T b / T c ) Q / A
where Q refers to the amount of charge embedded or extracted per unit area and A is the electrode area. Tb and Tc are the transmittances of the film in the bleached state and the colored state, respectively. Based on the test results of response time and optical modulation, the influence law of Mg doping on the CE of NiOx electrode materials was systematically studied, as shown in Figure 7e–h. The experimental results show that the CE value of the original NiOx electrode is 39.91 cm2⋅C−1, while the CE values of the doped samples NiOx-Mg1, NiOx-Mg2, and NiOx-Mg3 are reduced to 38.61 cm2⋅C−1, 35.44 cm2⋅C−1, and 33.59 cm2⋅C−1, respectively, showing an obvious downward trend dependent on the doping concentration. This phenomenon is in sharp contrast to the improvement in the optical modulation performance, revealing the multiple influence mechanisms of doping on the electrochromic performance. The decrease in the CE value may be attributed to the following factors: although the defects introduced by doping enhance the light absorption, they may also increase the carrier scattering and reduce the effective charge utilization rate; doping may alter the energy band structure of the material and affect the reversibility of the redox reaction [43,44]. It is worth emphasizing that although the CE value decreases with the increase in doping, its decrease amplitude (16%) is less than the improvement amplitude of the optical modulation performance (18.5%), indicating that doping still has a positive effect on the overall performance optimization.
A systematic study based on the potentiostatic polarization method was performed to comprehensively evaluate the influence of Mg doping on the cycling stability of NiOx electrode materials. The double-potential step method was used in the experiment (coloring state: +0.6 V vs. Ag/AgCl; bleaching state: −0.6 V vs. Ag/AgCl), and each potential was maintained for 10 s to guarantee that the system reached a steady state. As shown in Figure 8, the pristine NiOx electrode exhibited excellent cycling stability within the test range of 4000 s. Slight performance degradation of the lightly doped samples (NiOx-Mg1, NiOx-Mg2) began to occur around 2000 s, while the heavily doped sample (NiOx-Mg3) showed significant performance degradation from the beginning, and the degradation rate increased with time. The light absorption of all samples in the colored state showed a gradually increasing trend, which might be attributed to the gradual activation of active sites on the electrode surface during the cycling process [45].

4. Conclusions

In this work, we successfully prepared NiOx films with different Mg doping concentrations by the sol–gel method and the spin-coating method, and systematically studied their structure, electrochemical and electrochromic properties. The results show that the surface of the Mg-doped film is uniform and smooth, and the microstructure tends to be loose, which is beneficial to the insertion and extraction of OH. At the same time, we found that Mg doping can introduce oxygen defects in the NiOx lattice, effectively increase the reactive sites of the film electrode, and improve the charge transfer efficiency at the interface between the film electrode and the electrolyte. In addition, the charge storage capacity and electrochromic properties Mg-doped NiOx films can be effectively improved. Among them, the NiOx-Mg2 film electrode exhibits excellent transmittance modulation (ΔT reaches 55.4%) and response time (2.39 s/0.63 s for coloring/bleaching). In general, Mg doping effectively improves the electrochromic properties of NiOx films by optimizing their ion diffusion mechanism. This will provide a reference for the development of efficient energy storage electrochromic devices.

Supplementary Materials

The following supporting information can be downloaded at: https://www.mdpi.com/article/10.3390/nano15161217/s1, Figure S1: The in-situ transmittance curves (a) and Tauc plots (b) of NiOx and Mg-doped NiOx films; Figure S2: The EDS diagram of NiOx (a), NiOx-Mg1 (b), NiOx-Mg2 (c) and NiOx-Mg3 (d) films; Figure S3: Current-time response of (a-d) NiOx and Mg-doped NiOx films. Table S1: The positions of Ni 2p and O 1s and the proportion of oxygen defects in NiOx and Mg-doped NiOx films were investigated.

Author Contributions

X.Y. and S.D. conceived and designed the experiments; X.Y., S.D., X.S., C.G., Y.L. and W.X. performed the experiments; X.Y., S.D., G.W. and Y.Z. analyzed the data; Y.Z. and G.W. contributed reagents/materials/analysis tools; X.Y. and S.D. wrote the paper; Y.Z. and G.W. corrected the paper. X.Y. and S.D. contributed equally to this work. All authors have read and agreed to the published version of the manuscript.

Funding

This research was supported by the Natural Science Basic Research Program of Shanxi (2023-JC-YB-413), the National Natural Science Foundation of China (52103223), the Natural Science Foundation of Heilongjiang Province of China (YQ2023E027), and the Taishan Scholars Program.

Data Availability Statement

The data that support the findings of this study are available from the corresponding author upon reasonable request.

Conflicts of Interest

The authors declare no conflicts of interest.

References

  1. Gu, C.; Jia, A.B.; Zhang, Y.M.; Zhang, S.X.A. Emerging Electrochromic Materials and Devices for Future Displays. Chem. Rev. 2022, 122, 14679–14721. [Google Scholar] [CrossRef] [PubMed]
  2. Zhao, F.; Wang, B.; Zhang, W.; Cao, S.; Liu, L.; Elezzabi, A.Y.; Li, H.; Yu, W.W. Counterbalancing the interplay between electrochromism and energy storage for efficient electrochromic devices. Mater. Today 2023, 66, 431–447. [Google Scholar] [CrossRef]
  3. Su, L.; Lu, Z.; Wei, Y. An all solid-state electrochromic smart window. Chin. Sci. Bull. 1998, 43, 944–947. [Google Scholar] [CrossRef]
  4. Shao, Z.; Huang, A.; Cao, C.; Ji, X.; Hu, W.; Luo, H.; Bell, J.; Jin, P.; Yang, R.; Cao, X. Tri-band electrochromic smart window for energy savings in buildings. Nat. Sustain. 2024, 7, 796–803. [Google Scholar] [CrossRef]
  5. Meng, Q.; Cao, S.; Guo, J.; Wang, Q.; Wang, K.; Yang, T.; Zeng, R.; Zhao, J.; Zou, B. Sol-gel-based porous Ti-doped tungsten oxide films for high-performance dual-band electrochromic smart windows. J. Energy Chem. 2023, 77, 137–143. [Google Scholar] [CrossRef]
  6. Kim, J.; Kim, D.; Jang, H.; Auh, Y.; Kim, B.; Kim, E. Transparent photo-electrochromic capacitive windows with a Bi-dopant redox ionic liquids. Chem. Eng. J. 2022, 450, 138081. [Google Scholar] [CrossRef]
  7. Bechinger, C.; Ferrere, S.; Zaban, A.; Sprague, J.; Gregg, B.A. Photoelectrochromic windows and displays. Nature 1996, 383, 608–610. [Google Scholar] [CrossRef]
  8. Wu, W.; Poh, W.C.; Lv, J.; Chen, S.; Gao, D.; Yu, F.; Wang, H.; Fang, H.; Wang, H.; Lee, P.S. Self-Powered and Light-Adaptable Stretchable Electrochromic Display. Adv. Energy Mater. 2023, 13, 2204103. [Google Scholar] [CrossRef]
  9. Zhang, W.; Li, H.; Yu, W.W.; Elezzabi, A.Y. Transparent inorganic multicolour displays enabled by zinc-based electrochromic devices. Light. Sci. Appl. 2020, 9, 121. [Google Scholar] [CrossRef]
  10. Oh, S.-J.; Choi, S.-E.; Woo, I.; Yoon, J.U.; Bae, J.; Bae, J.W. Stretchable Multicolored Electroluminescent Sound Display for Wearable and Interactive Textiles. Adv. Funct. Mater. 2025. [Google Scholar] [CrossRef]
  11. Lin, K.; Wu, C.; Zhou, Y.; Li, J.; Chen, X.; Wang, Y.; Lu, B. A multicolored polymer for dynamic military camouflage electrochromic devices. Sol. Energy Mater. Sol. Cells 2024, 278, 113180. [Google Scholar] [CrossRef]
  12. Fu, G.; Gong, H.; Xu, J.; Zhuang, B.; Rong, B.; Zhang, Q.; Chen, X.; Liu, J.; Wang, H. Highly integrated all-in-one electrochromic fabrics for unmanned environmental adaptive camouflage. J. Mater. Chem. A 2024, 12, 6351–6358. [Google Scholar] [CrossRef]
  13. An, J.; Cai, W.; Zheng, W.; Zheng, Z.; Ming, X.; Niu, H.; Wang, W. High-contrast electrochromic nano fiber films changing from yellow-green to black based on butterfly monomer for smart windows and self-adaptive camouflage. J. Colloid. Interface Sci. 2025, 693, 137559. [Google Scholar] [CrossRef]
  14. Uplane, M.M.; Mujawar, S.H.; Inamdar, A.I.; Shinde, P.S.; Sonavane, A.C.; Patil, P.S. Structural, optical and electrochromic properties of nickel oxide thin films grown from electrodeposited nickel sulphide. Appl. Surf. Sci. 2007, 253, 9365–9371. [Google Scholar] [CrossRef]
  15. Yuan, Y.F.; Xia, X.H.; Wu, J.B.; Chen, Y.B.; Yang, J.L.; Guo, S.Y. Enhanced electrochromic properties of ordered porous nickel oxide thin film prepared by self-assembled colloidal crystal template-assisted electrodeposition. Electrochim. Acta 2011, 56, 1208–1212. [Google Scholar] [CrossRef]
  16. Yadav, A.A.; Chavan, U.J. Influence of substrate temperature on electrochemical supercapacitive performance of spray deposited nickel oxide thin films. J. Electroanal. Chem. 2016, 782, 36–42. [Google Scholar] [CrossRef]
  17. Gomaa, M.M.; Boshta, M.; Farag, B.S.; Osman, M.B.S. Structural and optical properties of nickel oxide thin films prepared by chemical bath deposition and by spray pyrolysis techniques. J. Mater. Sci. Mater. Electron. 2016, 27, 711–717. [Google Scholar] [CrossRef]
  18. Taskopru, T.; Zor, M.; Turan, E. Structural characterization of nickel oxide/hydroxide nanosheets produced by CBD technique. Mater. Res. Bull. 2015, 70, 633–639. [Google Scholar] [CrossRef]
  19. Zhao, F.; He, H.; Cheng, Z.; Tang, Y.; Li, G.; Xu, G.; Liu, Y.; Han, G. Improving electrochromic performance of porous nickel oxide electrode via Cu doping. Electrochim. Acta 2022, 417, 140332. [Google Scholar] [CrossRef]
  20. Zhao, F.; Chen, T.; Zeng, Y.; Chen, J.; Zheng, J.; Liu, Y.; Han, G. Nickel oxide electrochromic films: Mechanisms, preparation methods, and modification strategies-a review. J. Mater. Chem. C 2024, 12, 7126–7145. [Google Scholar] [CrossRef]
  21. Wang, C.; Cao, Z.; Xiang, S.; Liao, L.; Chen, W.; Zhang, H. Improved transparency and charge matching of electrochromic devices with Ce-doped NiO counter electrode. J. Alloys Compd. 2025, 1010, 177050. [Google Scholar] [CrossRef]
  22. Zhan, X.; Gao, F.; Zhuang, Q.; Zhang, Y.; Dang, J. Two-Dimensional Porous Structure of V-Doped NiO with Enhanced Electrochromic Properties. ACS Omega 2022, 7, 8960–8967. [Google Scholar] [CrossRef] [PubMed]
  23. Zhao, L.; Zhu, Y.; Long, X.; Liao, W.; Hu, B.; Miao, R.; Zhang, G.; Sun, G.; Xie, Y.; Miao, L. Manganese doped nickel oxide thin film with improved electrochromic performance towards smart window application. Ceram. Int. 2024, 50, 12810–12817. [Google Scholar] [CrossRef]
  24. Zargouni, S.; El Whibi, S.; Tessarolo, E.; Rigon, M.; Martucci, A.; Ezzaouia, H. Structural properties and defect related luminescence of Yb-doped NiO sol-gel thin films. Superlattices Microstruct. 2020, 138, 106361. [Google Scholar] [CrossRef]
  25. Abdallah, A.M.; Awad, R. Influence of Ru dopants on the structural, optical, and magnetic properties of nickel oxide nanoparticles. Phys. B Condens. Matter 2022, 629, 413651. [Google Scholar] [CrossRef]
  26. Babu, G.A.; Ravi, G. Quantification of ferromagnetism in metal doped NiO nanostructures. Mater. Lett. 2015, 161, 149–152. [Google Scholar] [CrossRef]
  27. Zhang, J.; Cai, G.; Zhou, D.; Tang, H.; Wang, X.; Gu, C.; Tu, J. Co-doped NiO nanoflake array films with enhanced electrochromic properties. J. Mater. Chem. C 2014, 2, 7013–7021. [Google Scholar] [CrossRef]
  28. Wang, Z.; Zhou, H.; Han, D.; Gu, F. Electron compensation in p-type 3DOM NiO by Sn doping for enhanced formaldehyde sensing performance. J. Mater. Chem. C 2017, 5, 3254–3263. [Google Scholar] [CrossRef]
  29. Cerqueira, M.F.; Viseu, T.; de Campos, J.A.; Rolo, A.G.; de Lacerda-Aroso, T.; Oliveira, F.; Bogdanovic-Radovic, I.; Alves, E.; Vasilevskiy, M.I. Raman study of insulating and conductive ZnO:(Al, Mn) thin films. Phys. Status Solidi A Appl. Mater. Sci. 2015, 212, 2345–2354. [Google Scholar] [CrossRef]
  30. Xiao, Y.; Zhang, X.; Yan, D.; Deng, J.; Chen, M.; Zhang, H.; Sun, W.; Zhao, J.; Li, Y. Defect engineering of W6+-doped NiO for high-performance black smart windows. Nano Res. 2024, 17, 3043–3052. [Google Scholar] [CrossRef]
  31. Lee, N.; Vo, V.K.; Lim, H.-J.; Jin, S.; Dang, T.H.T.; Jang, H.; Choi, D.; Lee, J.-H.; Jeong, B.-S.; Heo, Y.-W. Effect of magnesium doping on NiO hole injection layer in quantum dot light-emitting diodes. Nanophotonics 2024, 13, 4615–4624. [Google Scholar] [CrossRef]
  32. Garrido-García, L.F.; Pérez-Martínez, A.L.; Reyes-Gasga, J.; Aguilar-Del-Valle, M.d.P.; Wong, Y.H.; Rodríguez-Gómez, A. A Simple Methodology to Gain Insights into the Physical and Compositional Features of Ternary and Quaternary Compounds Based on the Weight Percentages of Their Constituent Elements: A Proof of Principle Using Conventional EDX Characterizations. Ceramics 2024, 7, 2571–6131. [Google Scholar] [CrossRef]
  33. Yao, S.; Zhang, Y.; Li, J.; Hong, Y.; Wang, Y.; Cui, J.; Shu, X.; Liu, J.; Tan, H.H.; Wu, Y. Hierarchical crystalline/defective NiO nanoarrays with (111) crystal orientation for effective electrochromic energy storage. Ceram. Int. 2024, 50, 47949–47962. [Google Scholar] [CrossRef]
  34. Usha, K.S.; Lee, S.Y. Fast-switching electrochromic smart windows based on WO3 doped NiO thin films. J. Alloys Compd. 2024, 1009, 176774. [Google Scholar] [CrossRef]
  35. Hou, J.; Gao, L.; Gu, X.; Li, Z.; Huang, M.; Su, G. Improvement of electrochromic performance of nickel oxide porous films by Sn doping. Mater. Chem. Phys. 2023, 306, 128079. [Google Scholar] [CrossRef]
  36. Chen, M.; Zhang, X.; Yan, D.; Deng, J.; Sun, W.; Li, Z.; Xiao, Y.; Ding, Z.; Zhao, J.; Li, Y. Oxygen vacancy modulated amorphous tungsten oxide films for fast-switching and ultra-stable dual-band electrochromic energy storage smart windows. Mater. Horiz. 2023, 10, 2191–2203. [Google Scholar] [CrossRef]
  37. Sahai, A.; Goswami, N. Probing the dominance of interstitial oxygen defects in ZnO nanoparticles through structural and optical characterizations. Ceram. Int. 2014, 40, 14569–14578. [Google Scholar] [CrossRef]
  38. Bouessay, I.; Rougier, A.; Tarascon, J.M. Electrochemically inactive nickel oxide as electrochromic material. J. Electrochem. Soc. 2004, 151, H145–H152. [Google Scholar] [CrossRef]
  39. Gao, L.; Hou, J.; Li, Z.; Gu, X.; Huang, M.; Su, G. Improved electrochromic performance of nickel oxide porous films by regulating their semiconductor type by titanium doping. J. Phys. Chem. Solids 2023, 174, 111168. [Google Scholar] [CrossRef]
  40. Han, Y.; Lu, Y.; Shen, S.; Zhong, Y.; Liu, S.; Xia, X.; Tong, Y.; Lu, X. Enhancing the Capacitive Storage Performance of Carbon Fiber Textile by Surface and Structural Modulation for Advanced Flexible Asymmetric Supercapacitors. Adv. Funct. Mater. 2019, 29, 1806329. [Google Scholar] [CrossRef]
  41. He, X.; Zhu, Y.; Mo, Y. Origin of fast ion diffusion in super-ionic conductors. Nat. Commun. 2017, 8, 15893. [Google Scholar] [CrossRef] [PubMed]
  42. Huang, Q.; Zhang, Q.; Xiao, Y.; He, Y.; Diao, X. Improved electrochromic performance of NiO-based thin films by lithium and tantalum co-doping. J. Alloys Compd. 2018, 747, 416–422. [Google Scholar] [CrossRef]
  43. Braatz, M.-L.; Veith, L.; Koester, J.; Kaiser, U.; Binder, A.; Gradhand, M.; Klaeui, M. Impact of nitrogen doping on the band structure and the charge carrier scattering in monolayer graphene. Phys. Rev. Mater. 2021, 5, 084003. [Google Scholar] [CrossRef]
  44. Zou, J.; Xu, Y.; Miao, X.; Chen, H.; Zhang, R.; Tan, J.; Tang, L.; Cai, Z.; Zhang, C.; Kang, L.; et al. Raman spectroscopy and carrier scattering in 2D tungsten disulfides with vanadium doping. Mater. Chem. Front. 2023, 7, 2059–2067. [Google Scholar] [CrossRef]
  45. Ding, Y.; Wang, M.; Mei, Z.; Liu, L.; Yang, J.; Zhong, X.; Wang, M.; Diao, X. Electrochromic Adaptability of NiOx Films Modified by Substrate Temperature in Aqueous and Non-Aqueous Electrolytes. Adv. Mater. Interfaces 2022, 9, 2102223. [Google Scholar] [CrossRef]
Figure 1. (a) XRD patterns of NiOx, NiOx-Mg1, NiOx-Mg2, and NiOx-Mg3 films. (b) XRD local amplification diagram. (c) Raman spectra of the Mg-doped NiOx films.
Nanomaterials 15 01217 g001
Figure 2. Surface (ad) and cross-sectional SEM images (eh) of NiOx and Mg-doped NiOx films.
Nanomaterials 15 01217 g002
Figure 3. XPS spectra of NiOx and Mg-doped NiOx films: (a) Ni 2p, (b) O 1s, and (c) Mg 1s.
Nanomaterials 15 01217 g003
Figure 4. Cyclic voltammetry (CV) curves of (ad) NiOx and Mg-doped NiOx films at different scan rates. (e) The cyclic voltammetry curves of NiOx and Mg-doped NiOx films at 50 mV·s−1 scan rate were compared. Electrochemical impedance spectroscopy of NiOx and Mg-doped NiOx thin films in the high-frequency region (f) and low-frequency region (g). The illustration in (f) is an equivalent circuit diagram. (h) The i/v1/2-v1/2 curves of NiOx and Mg-doped NiOx films were obtained.
Nanomaterials 15 01217 g004
Figure 5. The capacitance contribution and diffusion contribution of (ad) NiOx and Mg-doped NiOx films at different scan rates. The pseudocapacitance ratio of (eh) NiOx and Mg-doped NiOx films at 50 mV·s−1 scan rate.
Nanomaterials 15 01217 g005
Figure 6. In situ transmission spectra of (a) NiOx and (bd) Mg-doped NiOx films at +0.6 V/−0.6 V potential.
Nanomaterials 15 01217 g006
Figure 7. The transmittance–time response curves of (ad) NiOx and Mg-doped NiOx films at 500 nm are shown. Coloring efficiency of (eh) NiOx and Mg-doped NiOx films.
Nanomaterials 15 01217 g007
Figure 8. The transmittance curves of (a) NiOx and (bd) Mg-doped NiOx films with the number of cycles.
Nanomaterials 15 01217 g008
Table 1. The element proportions of Mg-doped NiOx films.
SampleNi (%)O (%)Mg (%)Mg/(Mg + Ni) (%)
NiOx30.369.700
NiOx-Mg132.965.21.95.4
NiOx-Mg228.168.93.09.6
NiOx-Mg327.068.44.614.6
Disclaimer/Publisher’s Note: The statements, opinions and data contained in all publications are solely those of the individual author(s) and contributor(s) and not of MDPI and/or the editor(s). MDPI and/or the editor(s) disclaim responsibility for any injury to people or property resulting from any ideas, methods, instructions or products referred to in the content.