Article

Efficacy, Kinetics, and Mechanism of Tetracycline Degradation in Water by O3/PMS/FeMoBC Process

1
College of Visual Arts, Changchun Sci-Tech University, Changchun 130600, China
2
Jinjiang Industrial Group, Jinjiang 362261, China
3
Key Laboratory of Songliao Aquatic Environment, Ministry of Education, Jilin Jianzhu University, Changchun 130118, China
*
Author to whom correspondence should be addressed.
Nanomaterials 2025, 15(14), 1108; https://doi.org/10.3390/nano15141108
Submission received: 14 May 2025 / Revised: 7 July 2025 / Accepted: 15 July 2025 / Published: 17 July 2025
(This article belongs to the Section Environmental Nanoscience and Nanotechnology)

Abstract

This study investigated the degradation efficacy, kinetics, and mechanism of the ozone (O3) process and two enhanced O3 processes (O3/peroxymonosulfate (O3/PMS) and O3/peroxymonosulfate/iron molybdates/biochar composite (O3/PMS/FeMoBC)), especially the O3/PMS/FeMoBC process, for the degradation of tetracycline (TC) in water. An FeMoBC sample was synthesized by the impregnation–pyrolysis method. The XRD results showed that the material loaded on BC was an iron molybdates composite, in which Fe2Mo3O8 and FeMoO4 accounted for 26.3% and 73.7% of the composite, respectively. The experiments showed that, for the O3/PMS/FeMoBC process, the optimum conditions were obtained at pH 6.8 ± 0.1, an initial concentration of TC of 0.03 mM, an FeMoBC dosage set at 200 mg/L, a gaseous O3 concentration set at 3.6 mg/L, and a PMS concentration set at 30 μM. Under these reaction conditions, the degradation rate of TC in 8 min and 14 min reached 94.3% and 98.6%, respectively, and the TC could be reduced below the detection limit (10 μg/L) after 20 min of reaction. After recycling for five times, the degradation rate of TC could still reach about 40%. The introduction of FeMoBC into the O3/PMS system significantly improved the TC degradation efficacy and resistance to inorganic anion interference. Meanwhile, it enhanced the generation of hydroxyl radicals (OH) and sulfate radicals (SO4•−), thus improving the oxidizing efficiency of TC in water. Material characterization analysis showed that FeMoBC has a well-developed porous structure and abundant active sites, which is beneficial for the degradation of pollutants. The reaction mechanism of the O3/PMS/FeMoBC system was speculated by the EPR technique and quenching experiments. The results showed that FeMoBC efficiently catalyzed the O3/PMS process to generate a variety of reactive oxygen species, leading to the efficient degradation of TC. There are four active oxidants in O3/PMS/FeMoBC system, namely OH, SO4•−, 1O2, and •O2. The order of their contribution importance was OH, 1O2, SO4•−, and •O2. This study provides an effective technological pathway for the removal of refractory organic matter in the aquatic environment.

1. Introduction

With the development of science and technology and industry, antibiotics are produced in large quantities and widely used, which leads to the detection of antibiotics and their transformants in the water environment of more and more countries and regions [1]. Antibiotics have a low absorption rate in human and animal bodies and are eventually excreted in the form of feces and urine. Antibiotics and their conversion products (conjugated state, oxidation products, hydrolysis products, etc.) are released into surface water and groundwater. Other sources of antibiotics include wastewater discharged from hospitals and pharmaceutical factories. TC is a typical kind of antibiotic. TC and its salts have good hydrophilicity and biological stability, so it is easy to migrate between different environmental media and eventually remain in the environment for a long time, which will pollute the environment to a great extent. According to the survey of antibiotic pollution in dozens of countries around the world, water has become one of the most important enrichment places of antibiotics in the environment. TC is widely used in the world because of its low price. Its types mainly include chlortetracycline, oxytetracycline, tetracycline, and semi–synthetic derivatives such as methotrexate, doxycycline, and minocycline [2]. The solid–liquid partition coefficient (Kd value) of TC antibiotics is 4.2 × 10⁴~1.03 × 10⁵ mg/kg, which is higher than other antibiotics. Therefore, TC antibiotics that enter the environment are more likely to be adsorbed and accumulated in the soil, thus destroying the microbial community in the soil environment, inhibiting the growth of beneficial microorganisms in the soil, and accelerating the spread of resistance genes. This may lead to the large-scale spread of resistance genes in the water environment. Therefore, it is urgent to develop technologies to remove antibiotics from the environment [1,2,3].
The ozone (O3) process has been widely used in the water treatment industry and is commonly used for the removal of organics, odors, and coloration from water [4,5,6]. Although the traditional O3 process has high degradation efficiency, it also has some defects, such as high energy consumption, a low effective conversion rate of ozone (saturated solubility), poor mineralization ability, and a poor anti-interference ability for inorganic ions, resulting in a large number of intermediate products in the secondary effluent of sewage treatment plants [6]. An effective strengthening process for the O3 process is the O3/peroxymonosulfate (O3/PMS) process [7]. In this process, O3 acts as an oxide to activate PMS, so it can produce •OH and SO4•− at the same time, showing the advantages of rapidly degrading organic pollutants and mineralizing them into CO2 and H2O, which has great advantages compared with the traditional advanced oxidation process. SO4•− in the O3/PMS process is mainly provided by PMS. SO4•− has a high redox potential, which is equivalent to •OH (2.5–3.1 eV) under neutral conditions but is slightly higher than •OH (1.9 eV) under acidic conditions. At the same time, it has a long half-life (30–40 μs) and a wide pH application range. Under a normal environment, the decomposition rate of persulfate anions (S2O82−) to produce SO4•− is slow, and the effect of using PMS alone is not good. Therefore, many methods of activating PMS were derived, including thermal decomposition, ultrasonic wave, ultraviolet radiation, alkali activation, laser flash activation, and transition metal catalysis [8].
In order to further enhance the coupling of O3 with PMS and to solve the problems of low O3 utilization, low mineralization, bromate generation, and low resistance to inorganic ions in the O3/PMS process, an iron molybdates/biochar composite (FeMoBC) was prepared to modify the O3/PMS process in this study. Therefore, the zone/peroxymonosulfate/iron molybdates/biochar composite (O3/PMS/FeMoBC) process was introduced. Studies have shown that the iron molybdates composite is environmentally friendly because it contains nutrients such as iron and molybdenum which are necessary for human body and plant growth, and the existence of them can promote redox and make it form multivalent states (Fe valence ranges from 0 to +3, and Mo valence ranges from 0 to +6) [9]. In addition, metal molybdate has attracted wide attention because of its high stability, high electrochemical activity, and special structure, and ferrous molybdate (FeMoO4) is one of the representative materials [10]. Meanwhile, iron and molybdenum have good activation efficiency for O3 and PMS [11]. The existence of bimetals increased the electron transfer rate in the reaction system and further improved the catalytic reaction rate of the system. In order to control the ion leaching of bimetallic substrate in water and keep the metal ions in a low valence state after calcination, BC with a low cost and less energy consumption was used as its carrier. Using typical agricultural wastes (corn stalk) in Northeast China and Fe/Mo mixed salt as raw materials, metal BC composites were prepared by wet impregnation pyrolysis. In this way, bimetallic oxides were loaded on the pores and surfaces of BC, which reduced the leaching of metal ions. Meanwhile, carbon materials can also inhibit the production of bromate in the O3/PMS process. In this process, iron ions and molybdenum ions have good activation efficiency for O3 and PMS, and the existence of bimetal increases the electron transfer rate in the reaction system, which further improves the catalytic reaction rate of the system.
Furthermore, the efficacies of these three process technologies, O3, O3/PMS, and O3/PMS/FeMoBC, for the degradation of TC in water were studied, respectively, by investigating the initial concentration of TC, the O3 concentration, the pH, the initial concentration of PMS, the amount of material dosage, and four common inorganic anions in water (HCO3, NO3, Cl, and SO42−) and humic acid (HA) on the reaction. Meanwhile, the reaction kinetics were calculated and fitted to the specific degradation effect of each single-factor experiment, and the degradation efficacy of the three systems was analyzed by their degradation efficiencies and chemical reaction kinetic rates within 20 min, and then the mechanism of the oxidative degradation of TC in water by the O3/PMS/FeMoBC process was explored. Through this study, we aimed to put forward a strengthening measure of the O3/PMS process to improve its degradation efficiency for TC. Meanwhile, it also can provide a new idea for the removal of refractory organic matter in water and has important practical significance for improving the quality of the water environment.

2. Materials and Methods

2.1. Materials and Reagents

The main reagents used in this experiment are detailed in Table 1.
All solutions in the experiments were prepared by an ultrapure water machine (Molelement elemental type 1820a water system, Molecular scientific instrument limited company, Shanghai, China). Corn stalks were purchased from a farm in Changchun, China. They were washed and dried, crushed into powder by a crusher, and screened by a 100-mesh sieve. Then they were put into a vacuum oven for pyrolysis at 200 °C for 120 min and then packaged in self-sealing bags for later use. The iron and molybdenum sources were iron chloride (FeCl3•6H2O) and sodium molybdate (Na2MoO4•2H2O), respectively. MoBC, FeBC, and FeMoBC samples were synthesized by the impregnation-pyrolysis method. The preparation process of MoBC was as follows: a suitable amount of BC was immersed into 500 mL solution containing Na2MoO4•2H2O solutions with different molar mass ratios (C:Mo = 1:1, 1:1.5, 1:2). The mixture was placed in an 80 °C constant temperature water bath and stirred for 12 h. After cooling, they were centrifuged at 4000× g, separated, and then dried in a 70 °C vacuum drying oven. The materials were then ground into powder. Then the samples were calcined in a muffle furnace at different temperatures (500, 600, and 700 °C) for 60/120 min and then cooled to room temperature and taken out, thus obtaining the MoBC samples. The above samples were crushed, ground, washed with water three times, and finally dried in vacuum at 70 °C. The ground and sieved samples were stored in brown bottles in a well-ventilated, cool place for later use. The preparation processes of FeBC and FeMoBC were similar to those of the above-mentioned MoBC samples, in which C:Fe = 1:1, 1:1.5, 1:2; C: Fe:Mo = 1:1:1, 1: 1.5, 1:1:2. The other preparation conditions remained the same.

2.2. Experimental Flow

This experimental setup is shown in Figure 1. The overall device consists of an O3 generator, a rotor flow meter, an air-drying dish, a magnetic stirrer with a constant temperature water bath, a sampler, and an exhaust gas treatment device. Wherein, a rotor was placed at the bottom of the O3 water tank for stirring (200 r/min). The volume of reaction solution was 1 L. The experimental temperature was controlled at 25 ± 1 °C. When sampling, the rubber stopper was removed, a certain amount of sample was sucked out with a syringe, and then the stopper was covered to avoid O3 leakage. In the tail gas absorption device, two brown gas cylinders were, respectively, filled with 500 mL of 20% potassium iodide solution, which was mainly used to collect excess O3 in preheating and reaction stages to avoid direct exposure to the environment.

2.3. Experimental Steps

(1)
Before the start of the experiment, the pipeline was first connected to the tail gas treatment device, and the O3 generator was opened to the desired gear to run for 15 min to stabilize the O3 concentration in the subsequent reaction. At the same time, the water bath was preheated to 25 °C.
(2)
Then the target reaction solution was added to the reactor, while magnetic stirring was turned on (with the aim of eliminating the dead water zone), and the pipeline valve was switched to the reactor.
(3)
After the experiment started, samples were taken at 2 min intervals, 1 mL of water samples were taken each time, and 100 μL of Na2S2O3 standard solution (reaction terminator) was dropped into the sample bottle after sampling.
(4)
The reaction solution was poured out 30 min after the end of the experiment to avoid the release of O3 from the water into the laboratory.

2.4. Analysis and Detection Methods

In this test, the iodometric method was used to determine the concentration of gaseous O3, following the iodometric method stipulated in Hygienic Requirements for Ozone Sterilizers (GB-28232-2020) [12]. TC detection was performed by high-performance liquid chromatography (HPLC, Agilent 1260 Infinity II, Santa Clara, CA, USA), with an ultraviolet detector and an Agilent zorbax SB-C18 column (4.6 × 150 mm, 5 μm), and the column temperature was controlled at 30 ± 1 °C. The mobile phase ratio was 0.1% formic acid water–methanol = 70:30 (v/v). The flow rate of mobile phase was 1 mL/min, the injection volume of samples was 50 μL, and the detection wavelength was 355 nm.
A TESCAN MIRA LMS scanning electron microscope (Quattro S, Brno, Czech Republic) was used to observe the morphology and energy spectrum of the samples. The analysis conditions were as follows: a small amount of samples were pasted on the conductive adhesive, and then metal spraying was carried out in a Quorum SC7620 sputtering coating instrument (Quorum SC7620, London, UK), with a gold spraying time of 45 s and a gold spraying current of 10 mA. The morphology and energy spectrum of the samples were observed by the TESCAN MIRA LMS scanning electron microscope mentioned above. The accelerating voltage for morphology observation was 3 kV, and the energy spectrum analysis was 15 kV. An SE2 secondary electron detector was used as the detector. The total specific surface area, total pore volume, and pore size data of the materials were determined using a Micromeritics ASAP2460 fully automated specific surface and porosity analyzer (ASAP2460, Norcross, GA, USA). During the determination, the nitrogen adsorption–desorption method was adopted. The degassing time was set to 8 h, and the temperature was kept at 200 °C. The functional groups on the surface of BC were tested using a Thermo Scientific Nicolet iS20 (iS20, Waltham, MA, USA). A proper amount of dried potassium bromide powder and 1/100~1/200 sample (relative to potassium bromide) were added into a mortar, fully ground, and pressed into transparent sheets by a tablet press. The test parameters were as follows: resolution was 4 cm−1; scanning time was 32 times, and test wavelength range was set to 400~4000 cm−1. A Rigaku SmartLab SE (SmartLab SE, Tokyo, Japan) was used to analyze the crystal structure before and after the reaction. A copper target was chosen as the test target. The scanning angle ranged from 5 to 90°, and the scanning speed was 5° min−1. XPS characterization was carried out using a Thermo Scientific K–Alpha XPS (K–Alpha, Waltham, MA, USA) instrument to differentiate the metallic valence states of Fe and Mo on the surface of the material. First, a proper amount of dried samples were taken out and pressed and then were put into the sample room after being stuck on the sample tray. When the pressure in the sample chamber was less than 2.0 × 10⁻⁷ mbar, the samples were sent into the analysis chamber. The spot size was 400 μm, the working voltage was 12 kV, and the filament current was 6 mA. In addition, the full-spectrum scanning pass energy was 150 eV, and the step size was set as 1 eV. The narrow-spectrum scanning pass energy was 50 eV, and the step size was 0.1 eV.

3. Structural Characterization of FeMoBC Material

3.1. SEM–EDS Characterization Analysis

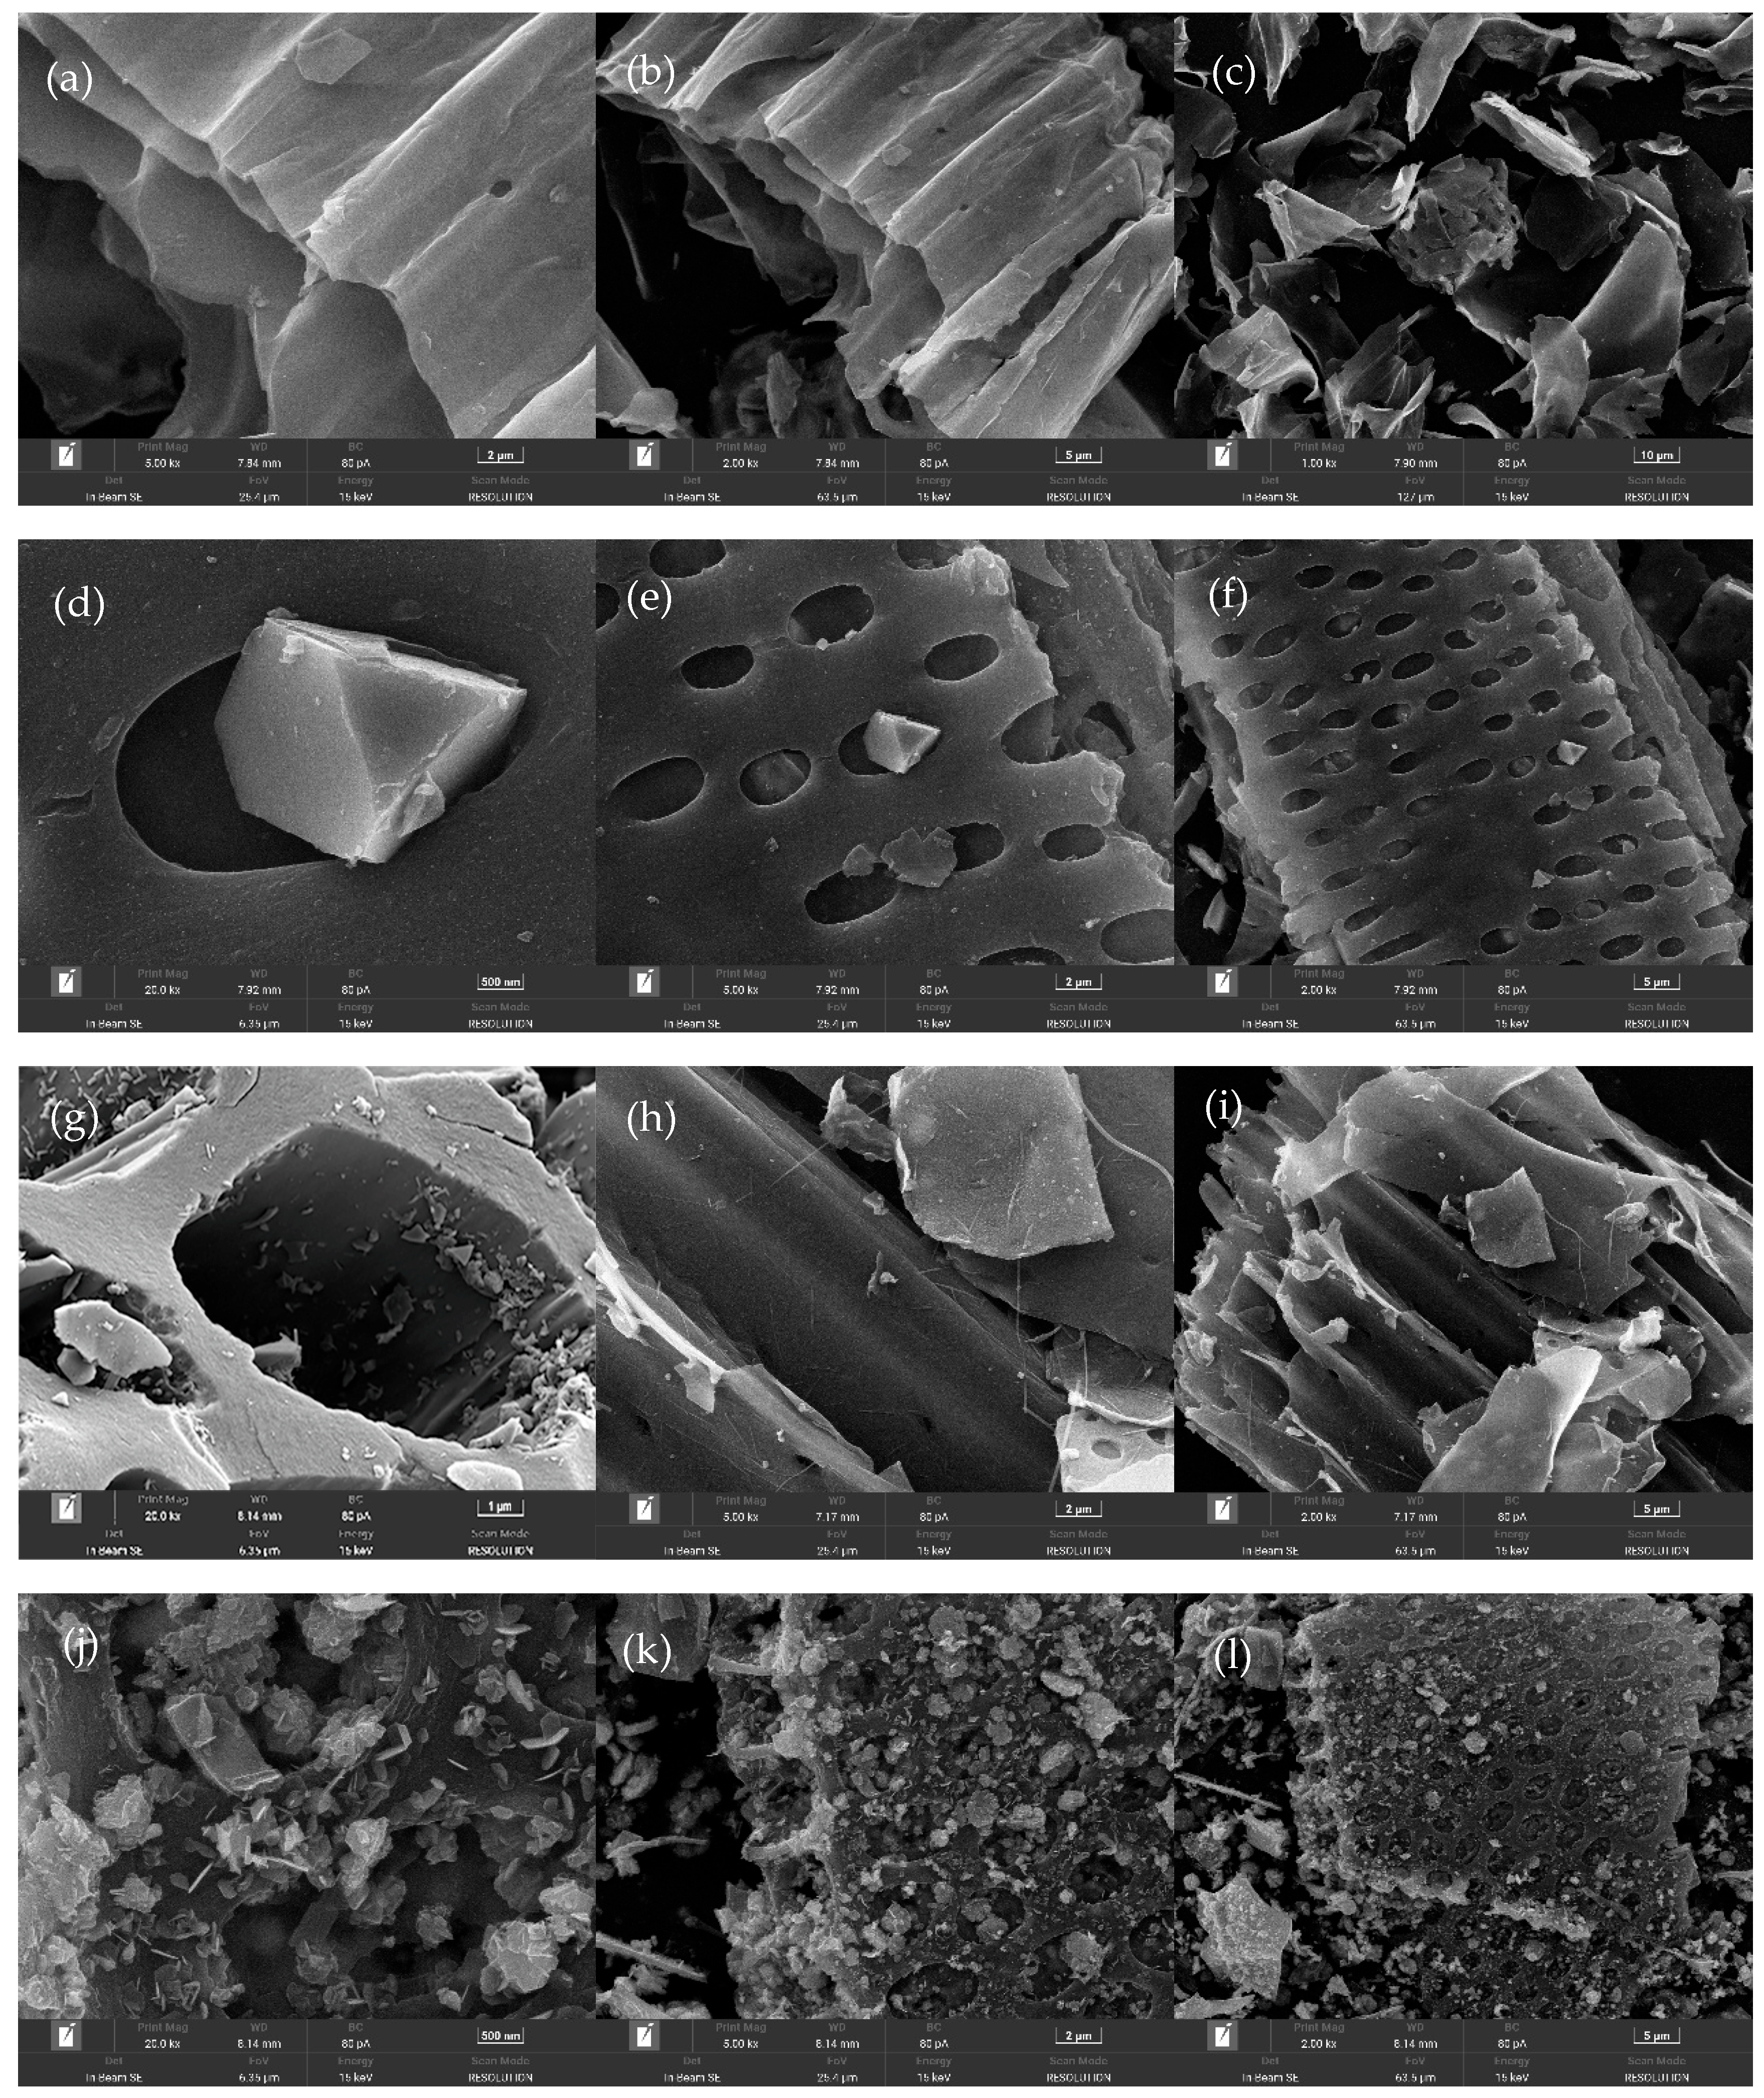
In order to compare the surface characteristics of the prepared BC, FeBC, MoBC, FeMoBC (unused), and FeMoBC (recycled three times), the structure and morphology of the five above-mentioned materials were analyzed by scanning electron microscopy. As shown in Figure 2, the pristine BC (Figure 2a–c) has a lamellar structure with a smooth outer surface, which is consistent with typical carbon structural features. Compared with the pristine BC, the surface of FeBC (Figure 2d–f) presents a porous, multilayered, and rough structure. However, MoBC (Figure 2g–i) only observed partial vanish of carbon structure pores and poor metal loading. However, the SEM image of FeMoBC (new) (Figure 2j–l) shows that the surface of the material was rough and irregular. Various metallic crystals were densely distributed on the surface, and metallic crystals were agglomerated in some places. At the same time, it can be clearly observed that irregular large particles were embedded in the pores, which was presumed to be metallic iron–molybdenum oxide particles produced during high-temperature calcination. Numerous metal particles were uniformly distributed on the surface and in the pores of the BC, and this phenomenon promoted the electron transfer of the catalyst in the oxidation experiments. In addition, compared with FeMoBC (new), the metal particles on the surface of FeMoBC (used) (Figure 2m–o) after the catalytic cycle of three degradation reactions were more uniformly distributed, which on the one hand indicates that a small part of the metal particles were dissolved during the reaction process, and on the other hand, it reflects that the Mo and Fe were stably loaded on the surface of the BC. This change in surface characteristics before and after the reaction confirmed that most of the reactions occurred on the catalyst surface.
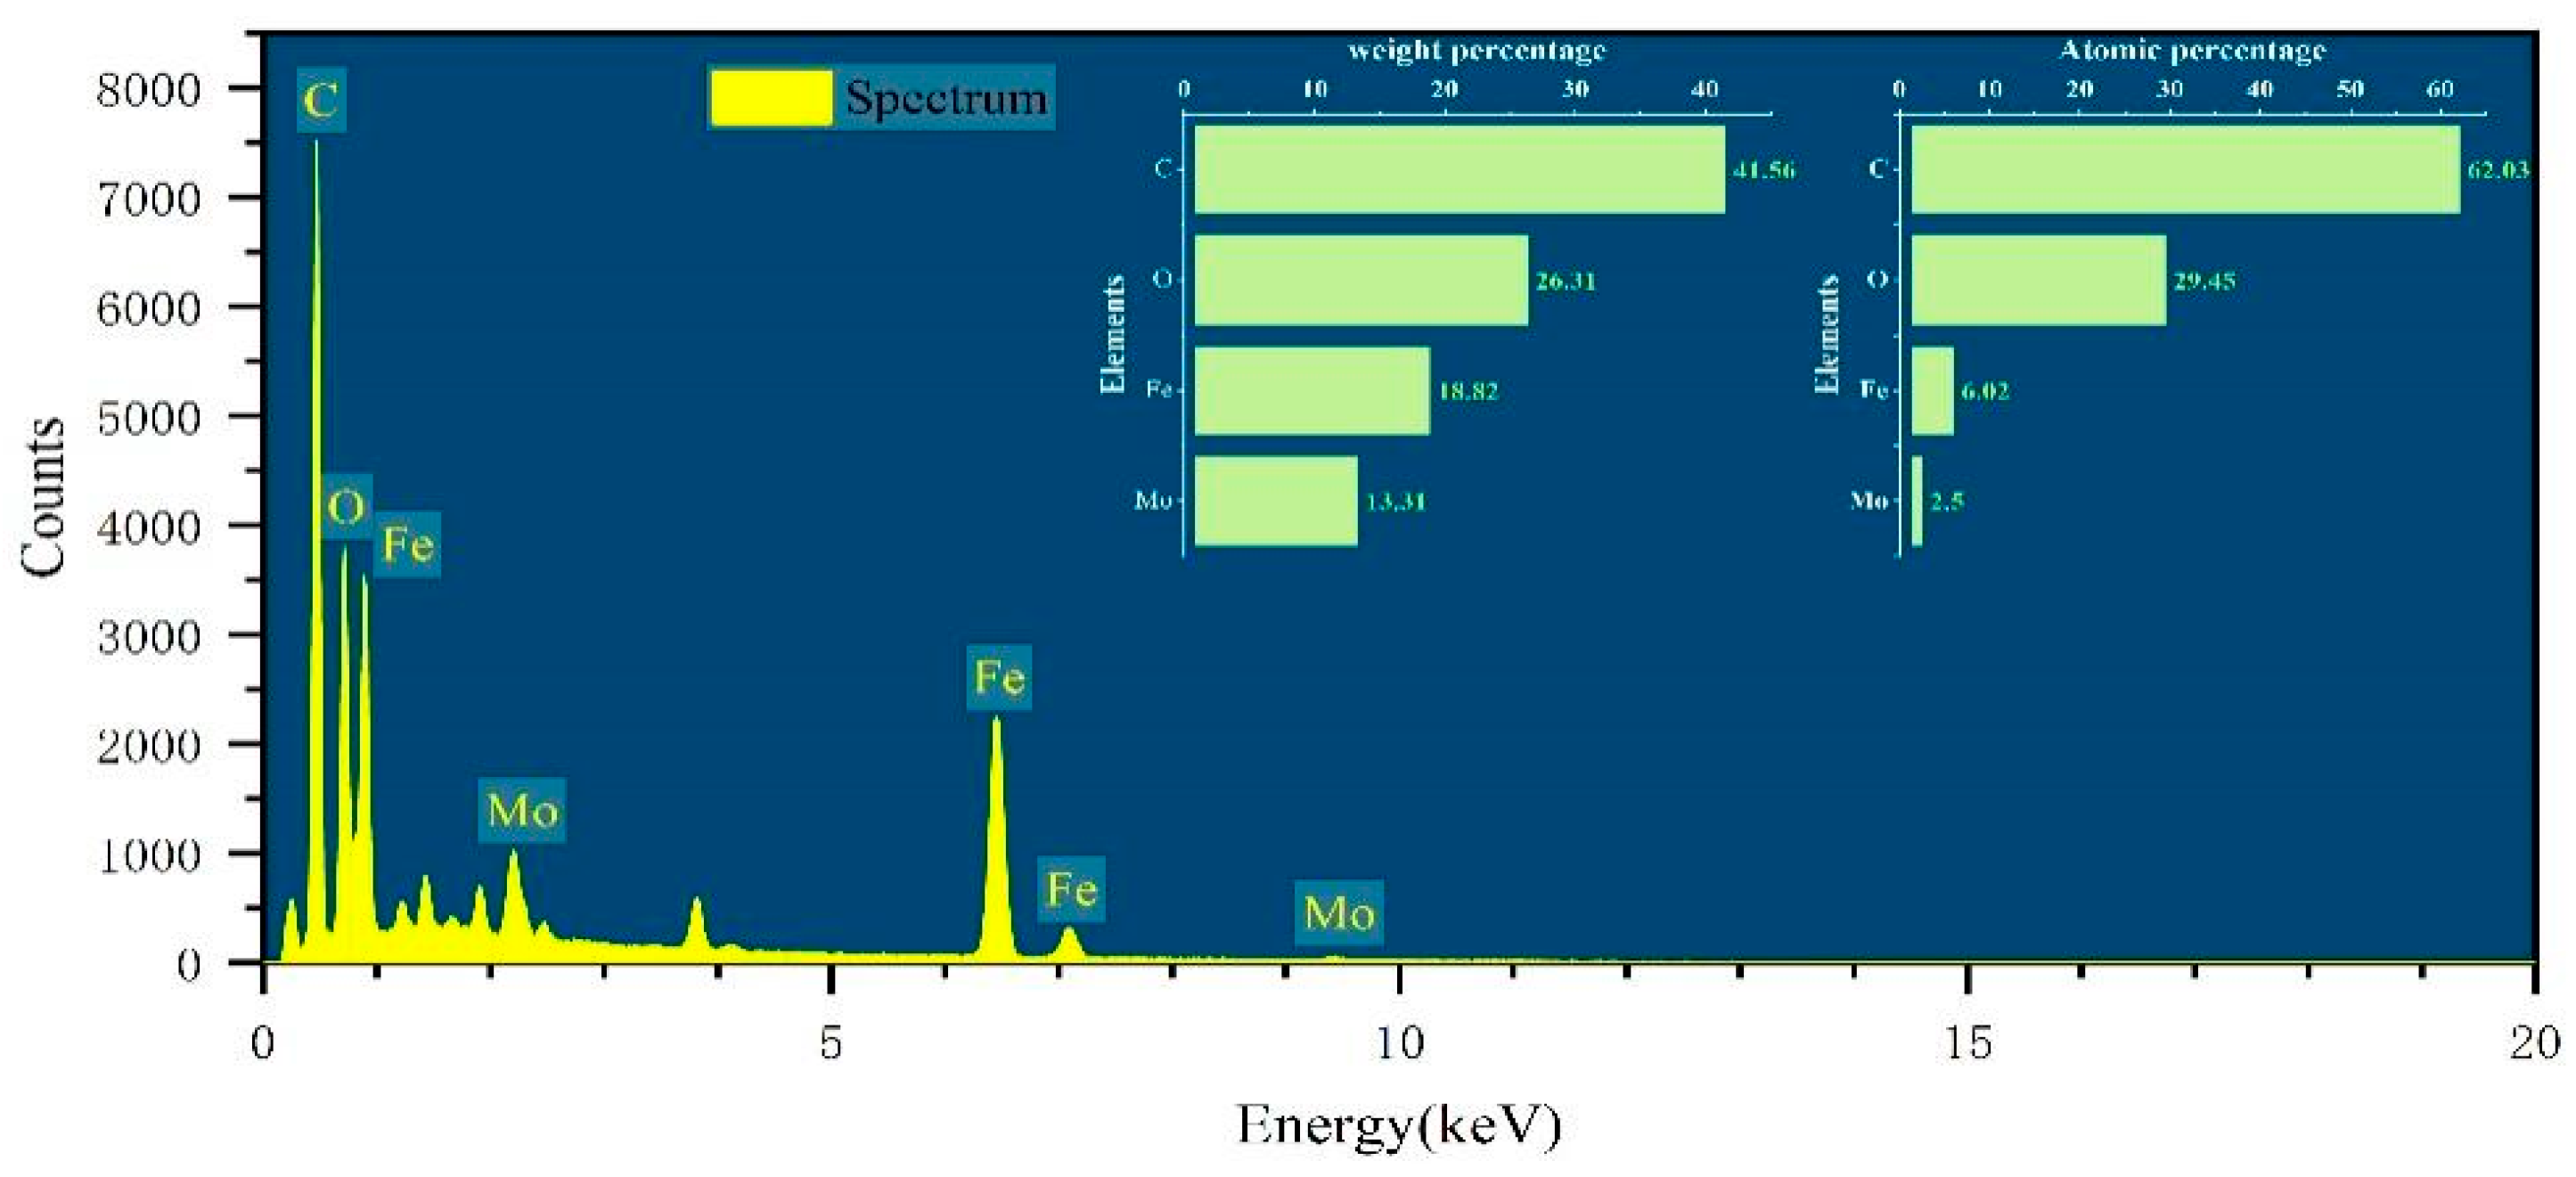
The elemental composition of the FeMoBC material was clarified by EDS analysis. As shown in Figure 3, the elements of carbon, oxygen, iron, and molybdenum were present in the structure of FeMoBC, with mass percentages of 41.56%, 26.31%, 18.82%, and 13.31%, respectively. Meanwhile, their atomic weights were 62.03%, 29.45%, 6.02%, and 2.5%, respectively. This analysis confirmed that both metal Fe and Mo were evenly loaded on the surface and in the pores of the BC.

3.2. FTIR Characterization Analysis

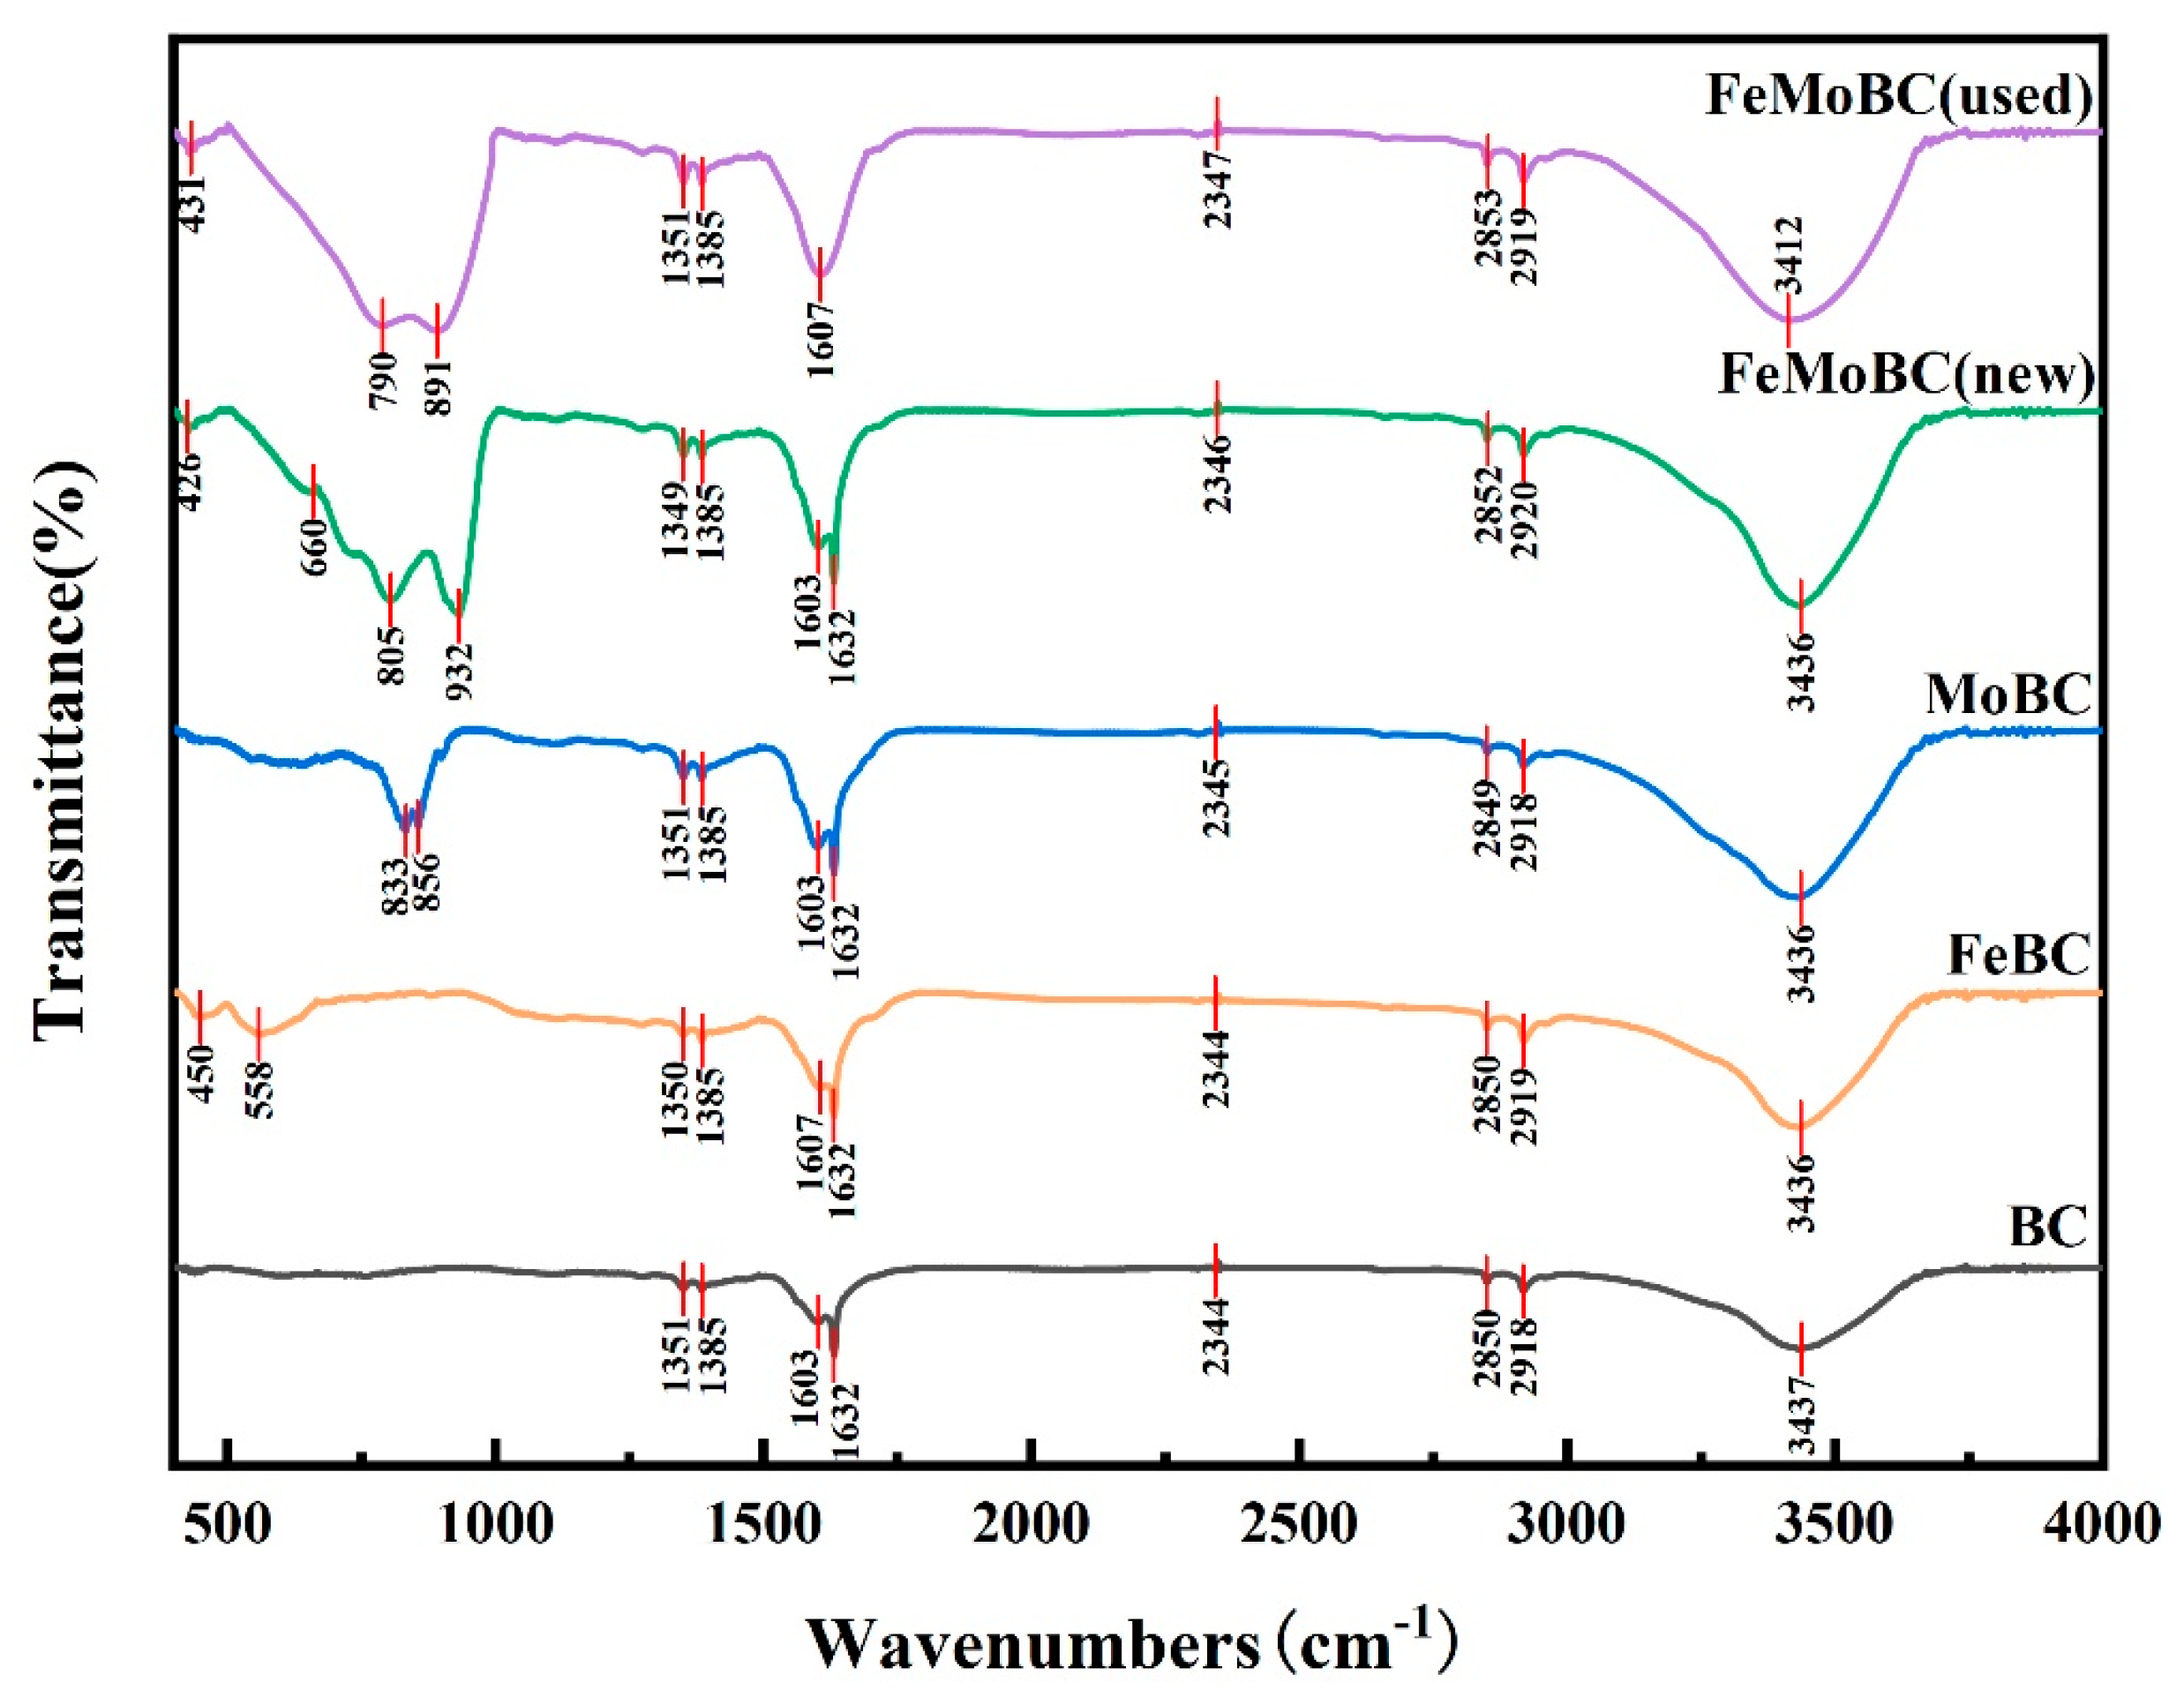
In order to investigate the surface functional groups of BC, FeBC, MoBC, FeMoBC (new), and FeMoBC (used), Fourier Transform Infrared Spectroscopy (FTIR) was applied to analyze them in the characteristic region of 400–4000 cm−1 (Figure 4). The results show that the relatively sharp peaks of BC, FeBC, MoBC, FeMoBC (new), and FeMoBC (used) at 3437, 3436, 3436, and 3412 cm−1, respectively, correspond to the vibration of the hydroxyl (–OH) linker. The vibration peaks around 2850 and 2920 cm−1, respectively, correspond to the bending vibration of alkanes (C-H) [13]. The new peaks in the FTIR spectra of FeBC, MoBC, and FeMoBC were generated, mainly due to the generation of new surface functional groups (Fe-O, Mo-O) after Fe/Mo co–loading. The C=C stretching vibration of the absorption peaks at 1603–1632 cm−1 is gradually enhanced by the modification of the BC material, while the strong absorption peak at 1351 cm−1 corresponds to the characteristic peak vibration of C-O [14]. It is noteworthy that two new absorption bands appear at about 450 cm−1 and 558 cm−1, which are usually considered as Fe-O, while the two new absorption bands at 805 and 932 cm−1 are Mo-O stretching vibration peaks [15]. Compared with FeMoBC (new), the intensity of the FeMoBC (used) part of the peaks is slightly attenuated, indicating that some of the functional groups are consumed in the catalytic reaction, and thus the catalytic reaction is mainly concentrated on the catalyst surface. The above phenomenon indicates that more Mo-and-Fe-containing oxygen functional groups were successfully loaded on FeMoBC.

3.3. BET Characterization Analysis

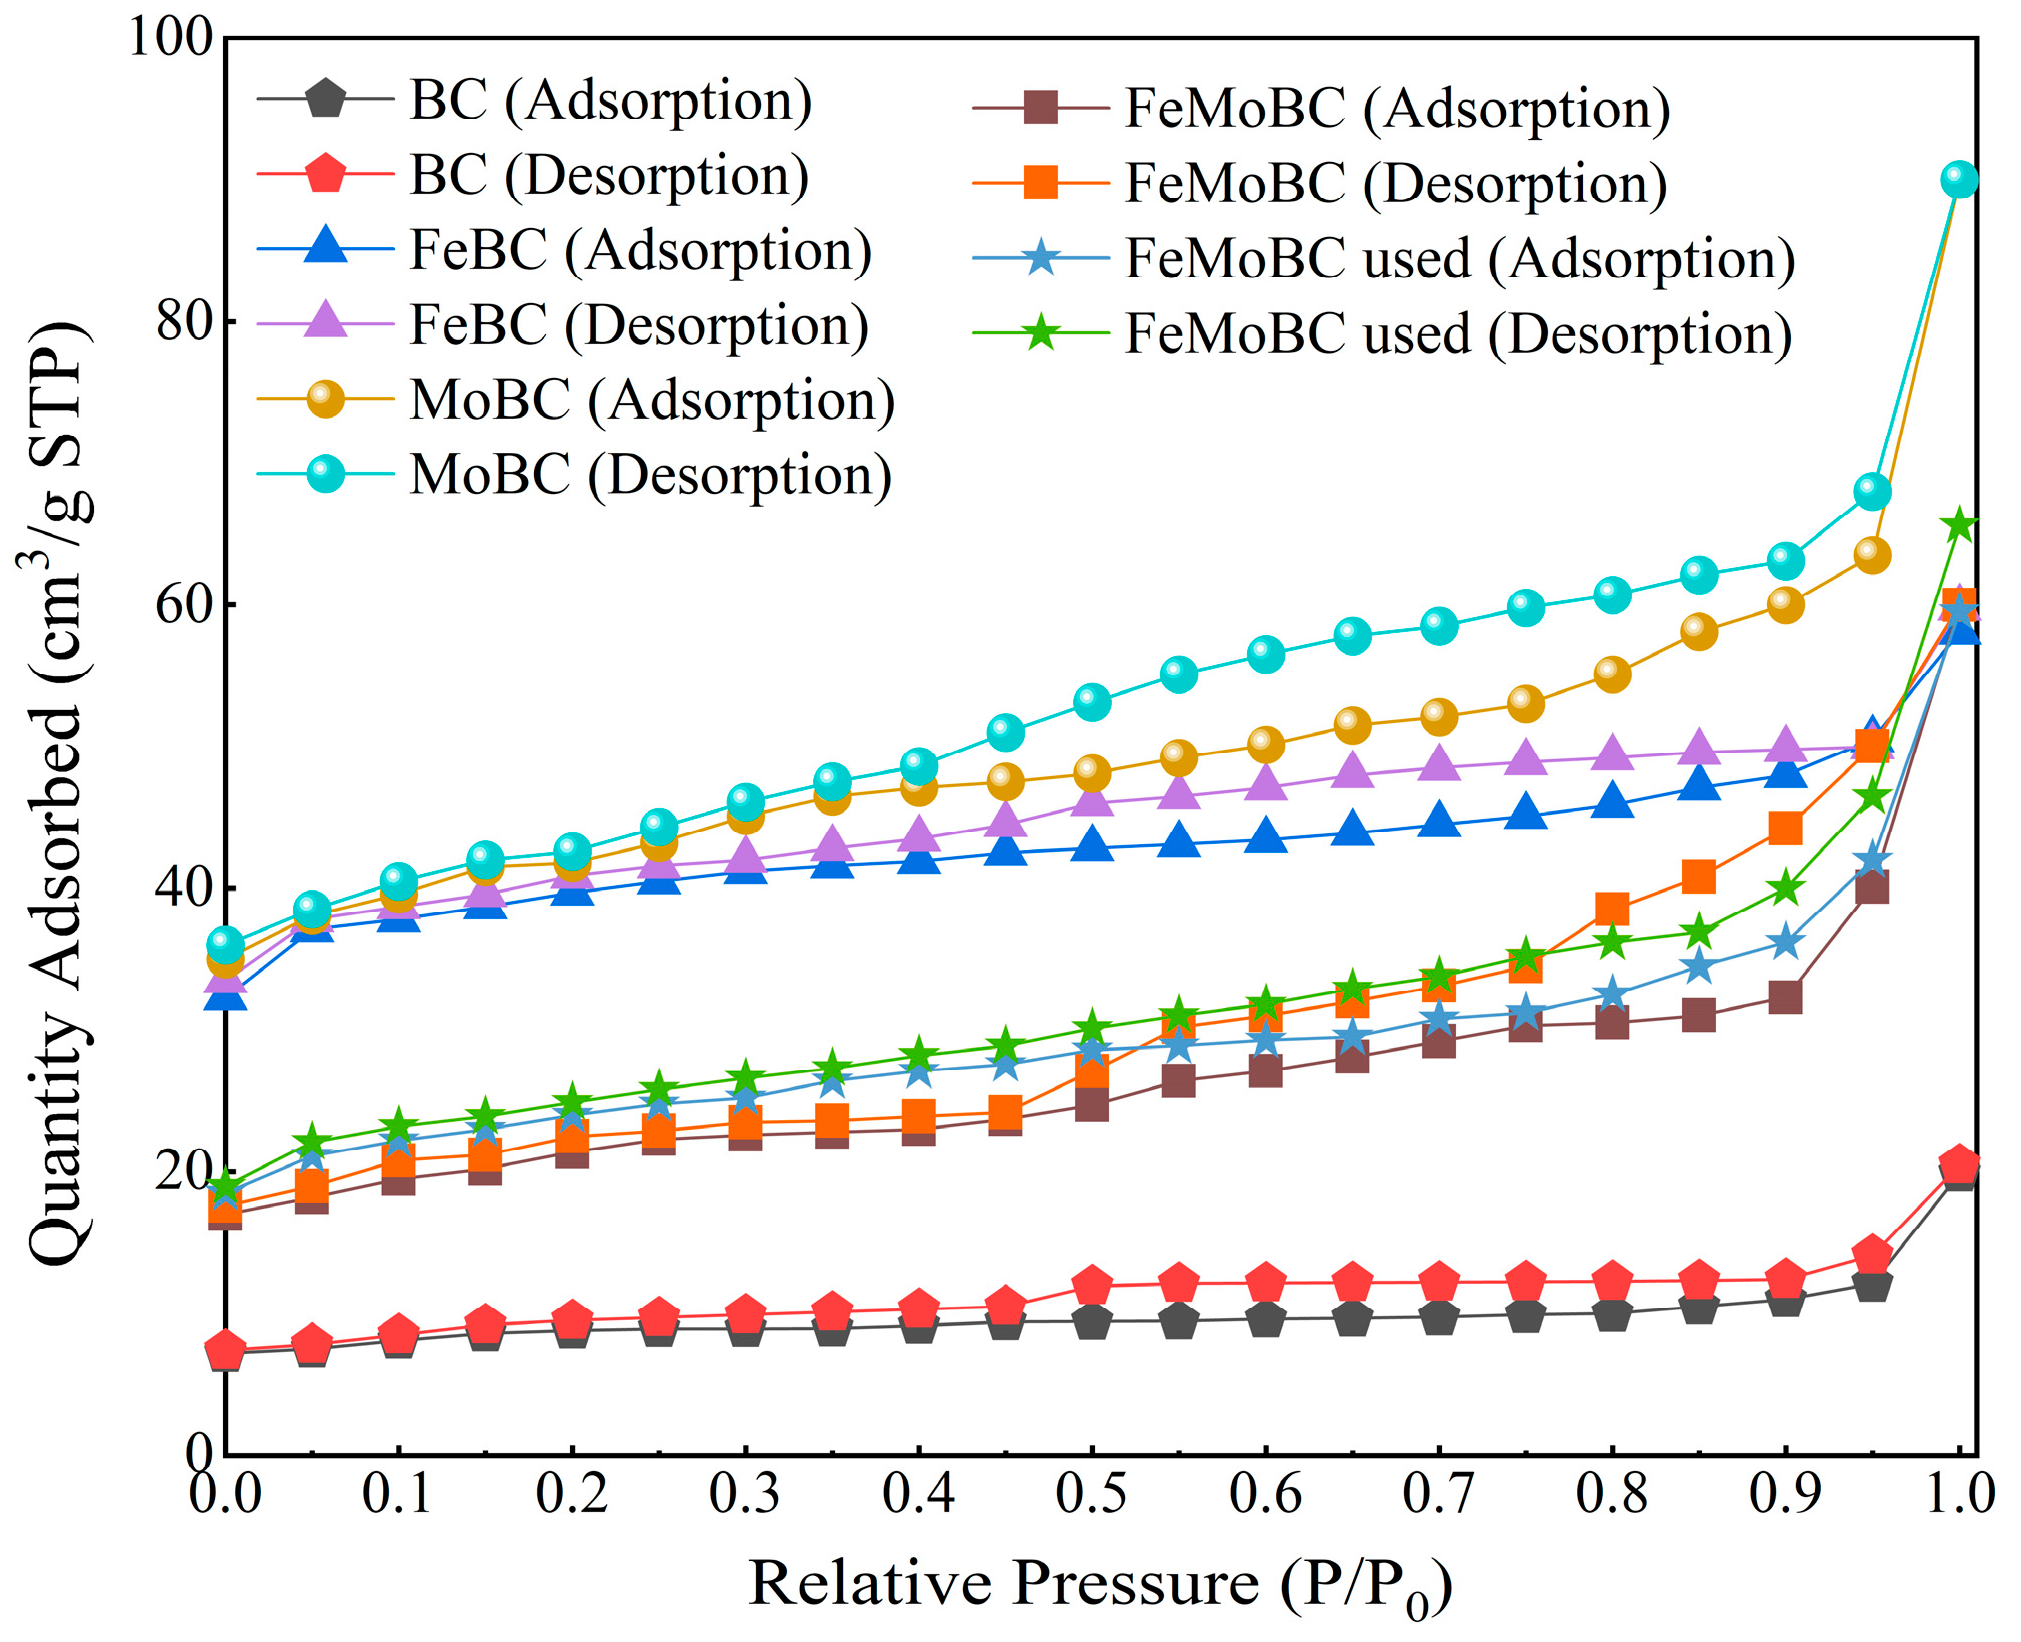
The specific surface area of the catalyst reflects its porosity and general geometry, and the specific surface area, microporous area, and total pore volume of the catalysts are currently determined by N2 adsorption–desorption isotherm measurements. Figure 5 shows the N2 adsorption–desorption isotherm curves of BC, FeBC, MoBC, FeMoBC (new), and FeMoBC (used), which have a slowly increasing trend and belong to the typical type IV hysteresis loop isotherm. This reflects a partial microporous-to-mesoporous transition in the catalysts, indicating that the catalysts have more mesoporous structures with pore sizes predominantly between 2 and 50 nm. The pore properties of BC, FeBC, MoBC, FeMoBC (new), and FeMoBC (used) are shown in Table 2. The above results showed that the specific surface area, total pore volume, and average pore size of Fe/Mo metal-modified FeMoBC increased significantly compared with that of BC, but the specific surface area, total pore volume, and average pore size of FeMoBC were smaller than those of FeBC and MoBC, which may be attributed to localized agglomeration of some of the metal oxides on the surface of the BC and at the pore channels. This phenomenon is caused by the successful loading of Fe/Mo metal nanoparticles on the BC surface. Related studies have shown [16] that these aforementioned properties are sufficient to indicate that the coupling between the prepared composite FeMoBC and O3/PMS system has more positive effects, which are mainly reflected in the ability to enhance the electron transfer between the catalyst and the oxidant and to promote the degradation of pollutants into small molecules.

3.4. XRD Characterization Analysis

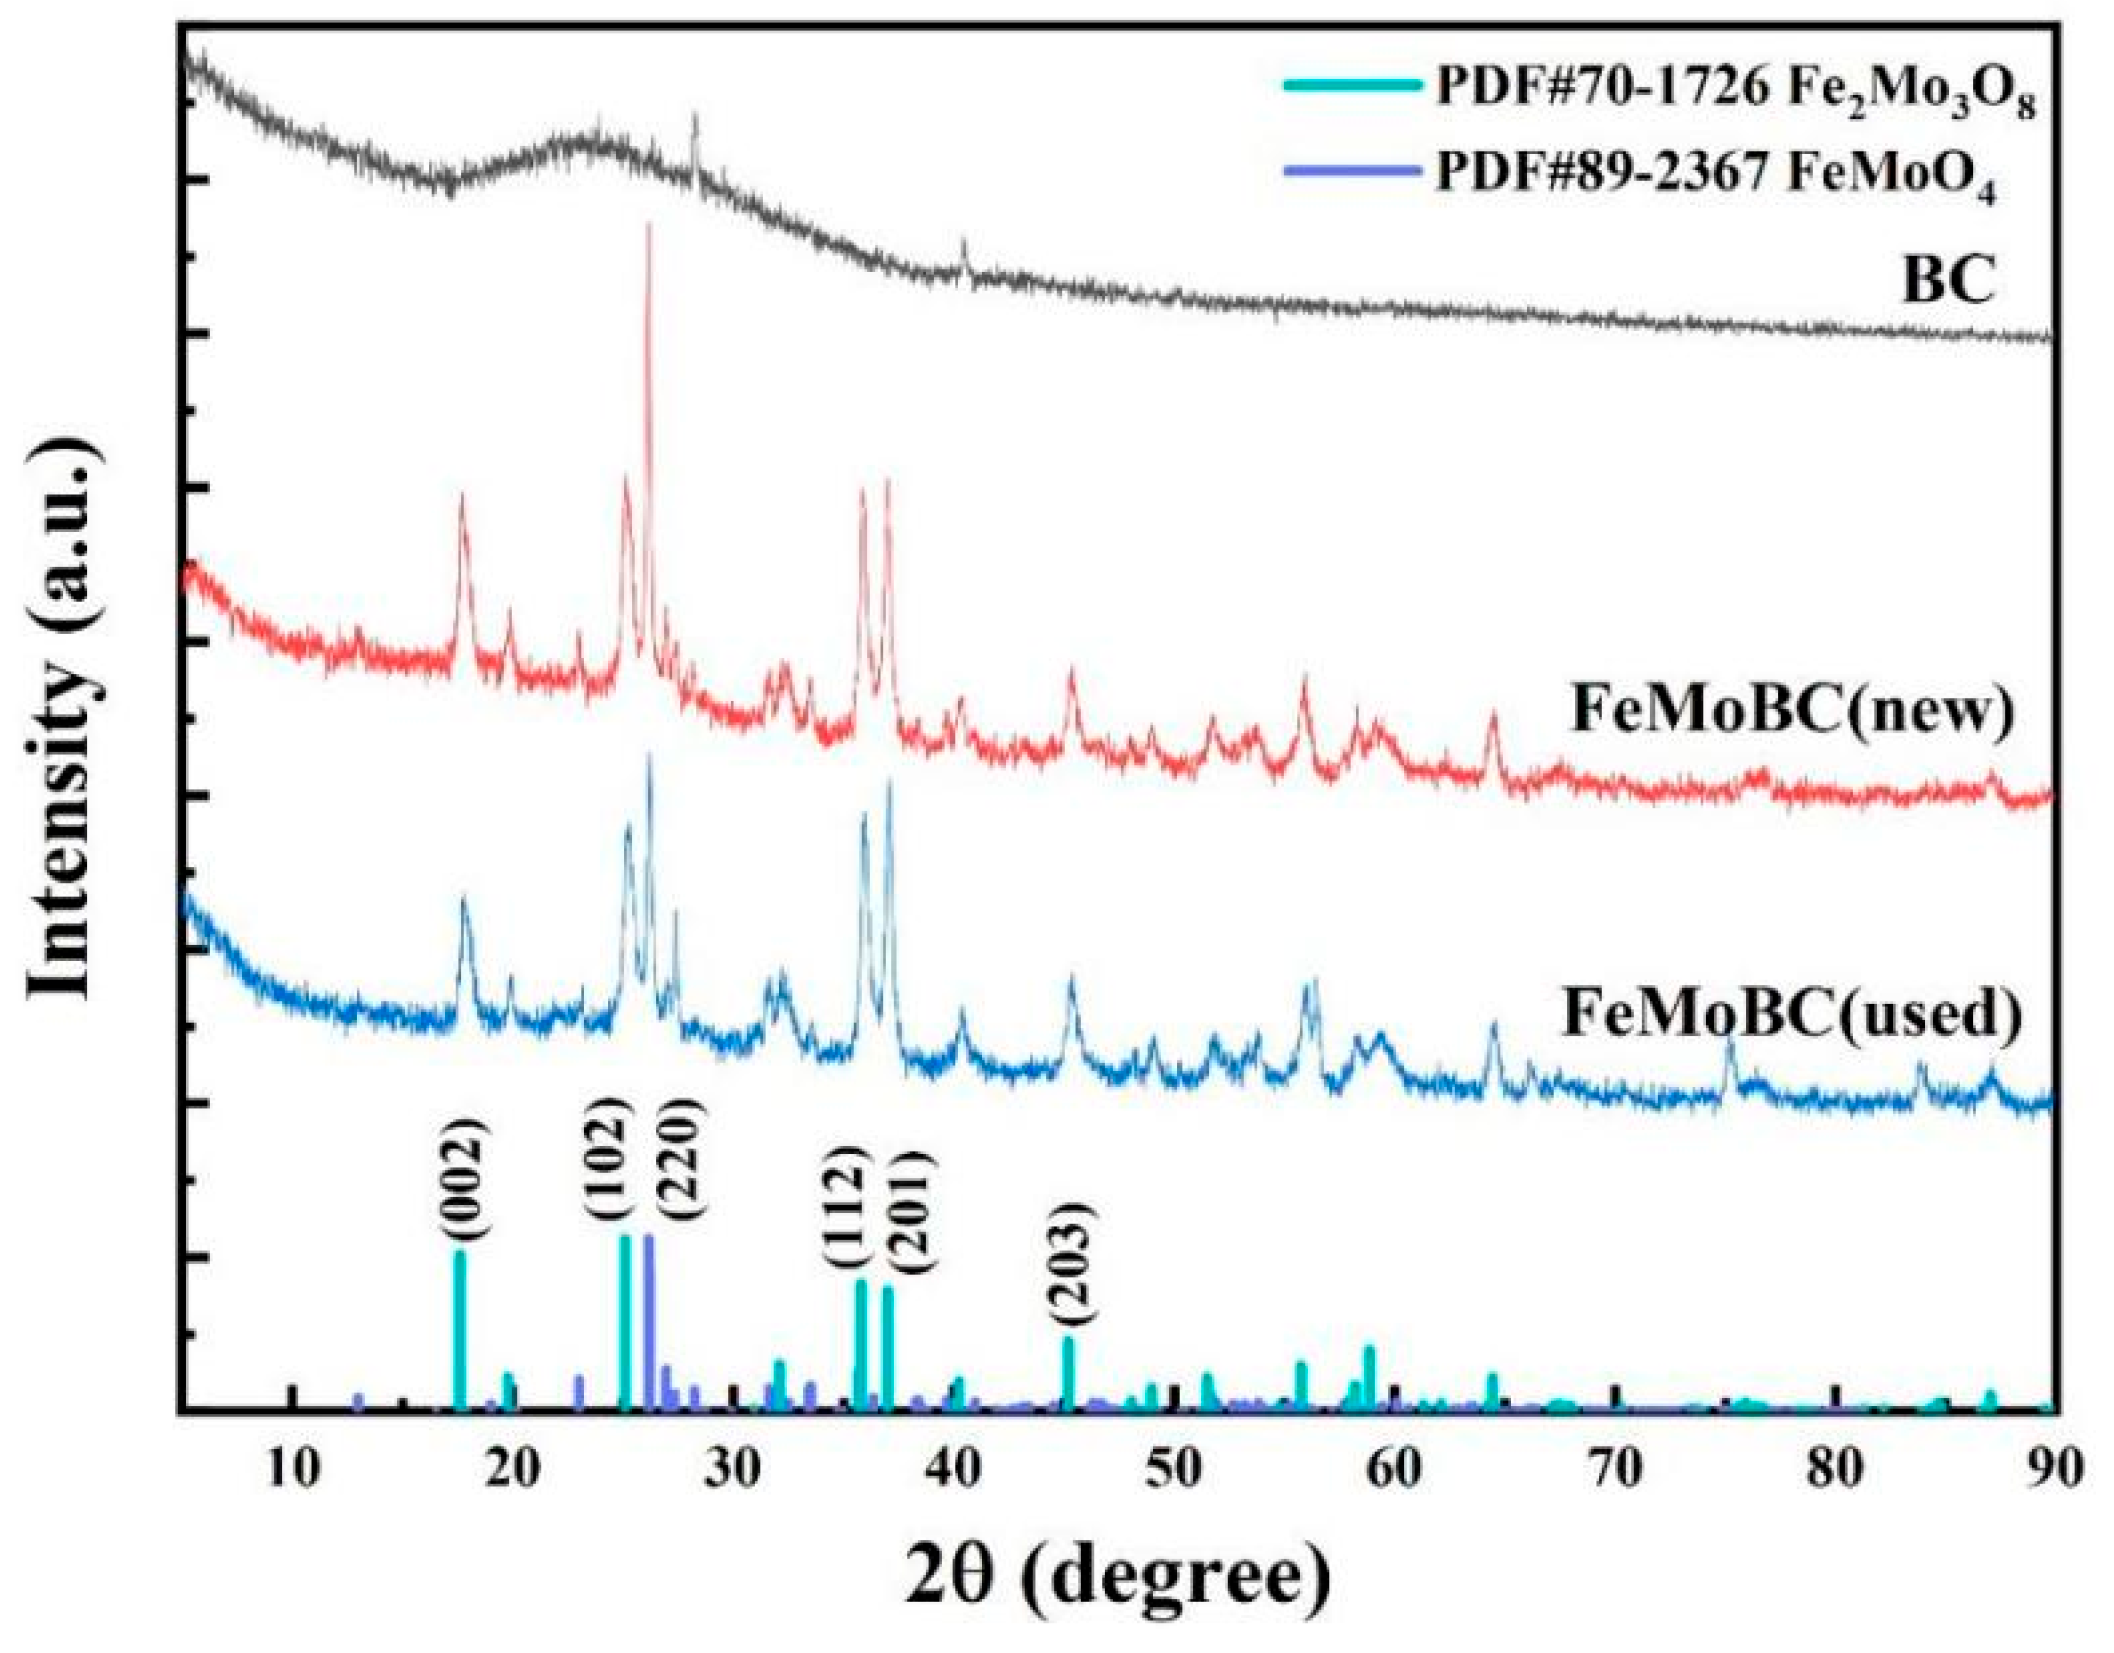
The crystal structure of FeMoBC before and after use was determined by XRD patterns. The XRD patterns of BC, FeMoBC (new), and recycled-three-times-over FeMoBC (used) are shown in Figure 6. The XRD patterns show that BC has a typical planar graphite amorphous carbon structure (JCPDS 41-1487) with diffraction peaks located at 2θ = 24.5°, which usually has strong support properties for metal carriers. The FeMoBC diffraction peak rays are five, located at 2θ values of 17.62°, 25.08°, 35.82°, 37°, and 40.9°, and are highly compatible with (002), (102), (112), (201), and (203) of (Fe2Mo3O8) PDF#70–1726, respectively. The diffraction peak at 26.16° in the XRD diffraction pattern, along with weak peaks at 2θ values of 26.97°, 31.62°, and 33.52°, can be regarded as belonging to FeMoO4 according to the PDF standard card (PDF#89-2367). Compared with the pristine BC, the intensity of the diffraction peaks located at 23.94° was lower for FeMoBC (new) and FeMoBC (used), mainly due to the loading of metal ions that changed their surface morphology characteristics.
In addition, the diffraction peaks of the catalysts before and after the reaction were in the same position, but the peak intensities were slightly reduced, which indicated that the metal particles loaded on their surfaces were involved in the reaction. The analysis of the above two crystalline phases by jade 9.0 software yielded that the percentages of Fe2Mo3O8 and FeMoO4 were 26.3% and 73.7%, respectively. Therefore, the above XRD results indicate that the synthesis of FeMoBC catalyst was successful.

3.5. XPS Characterization

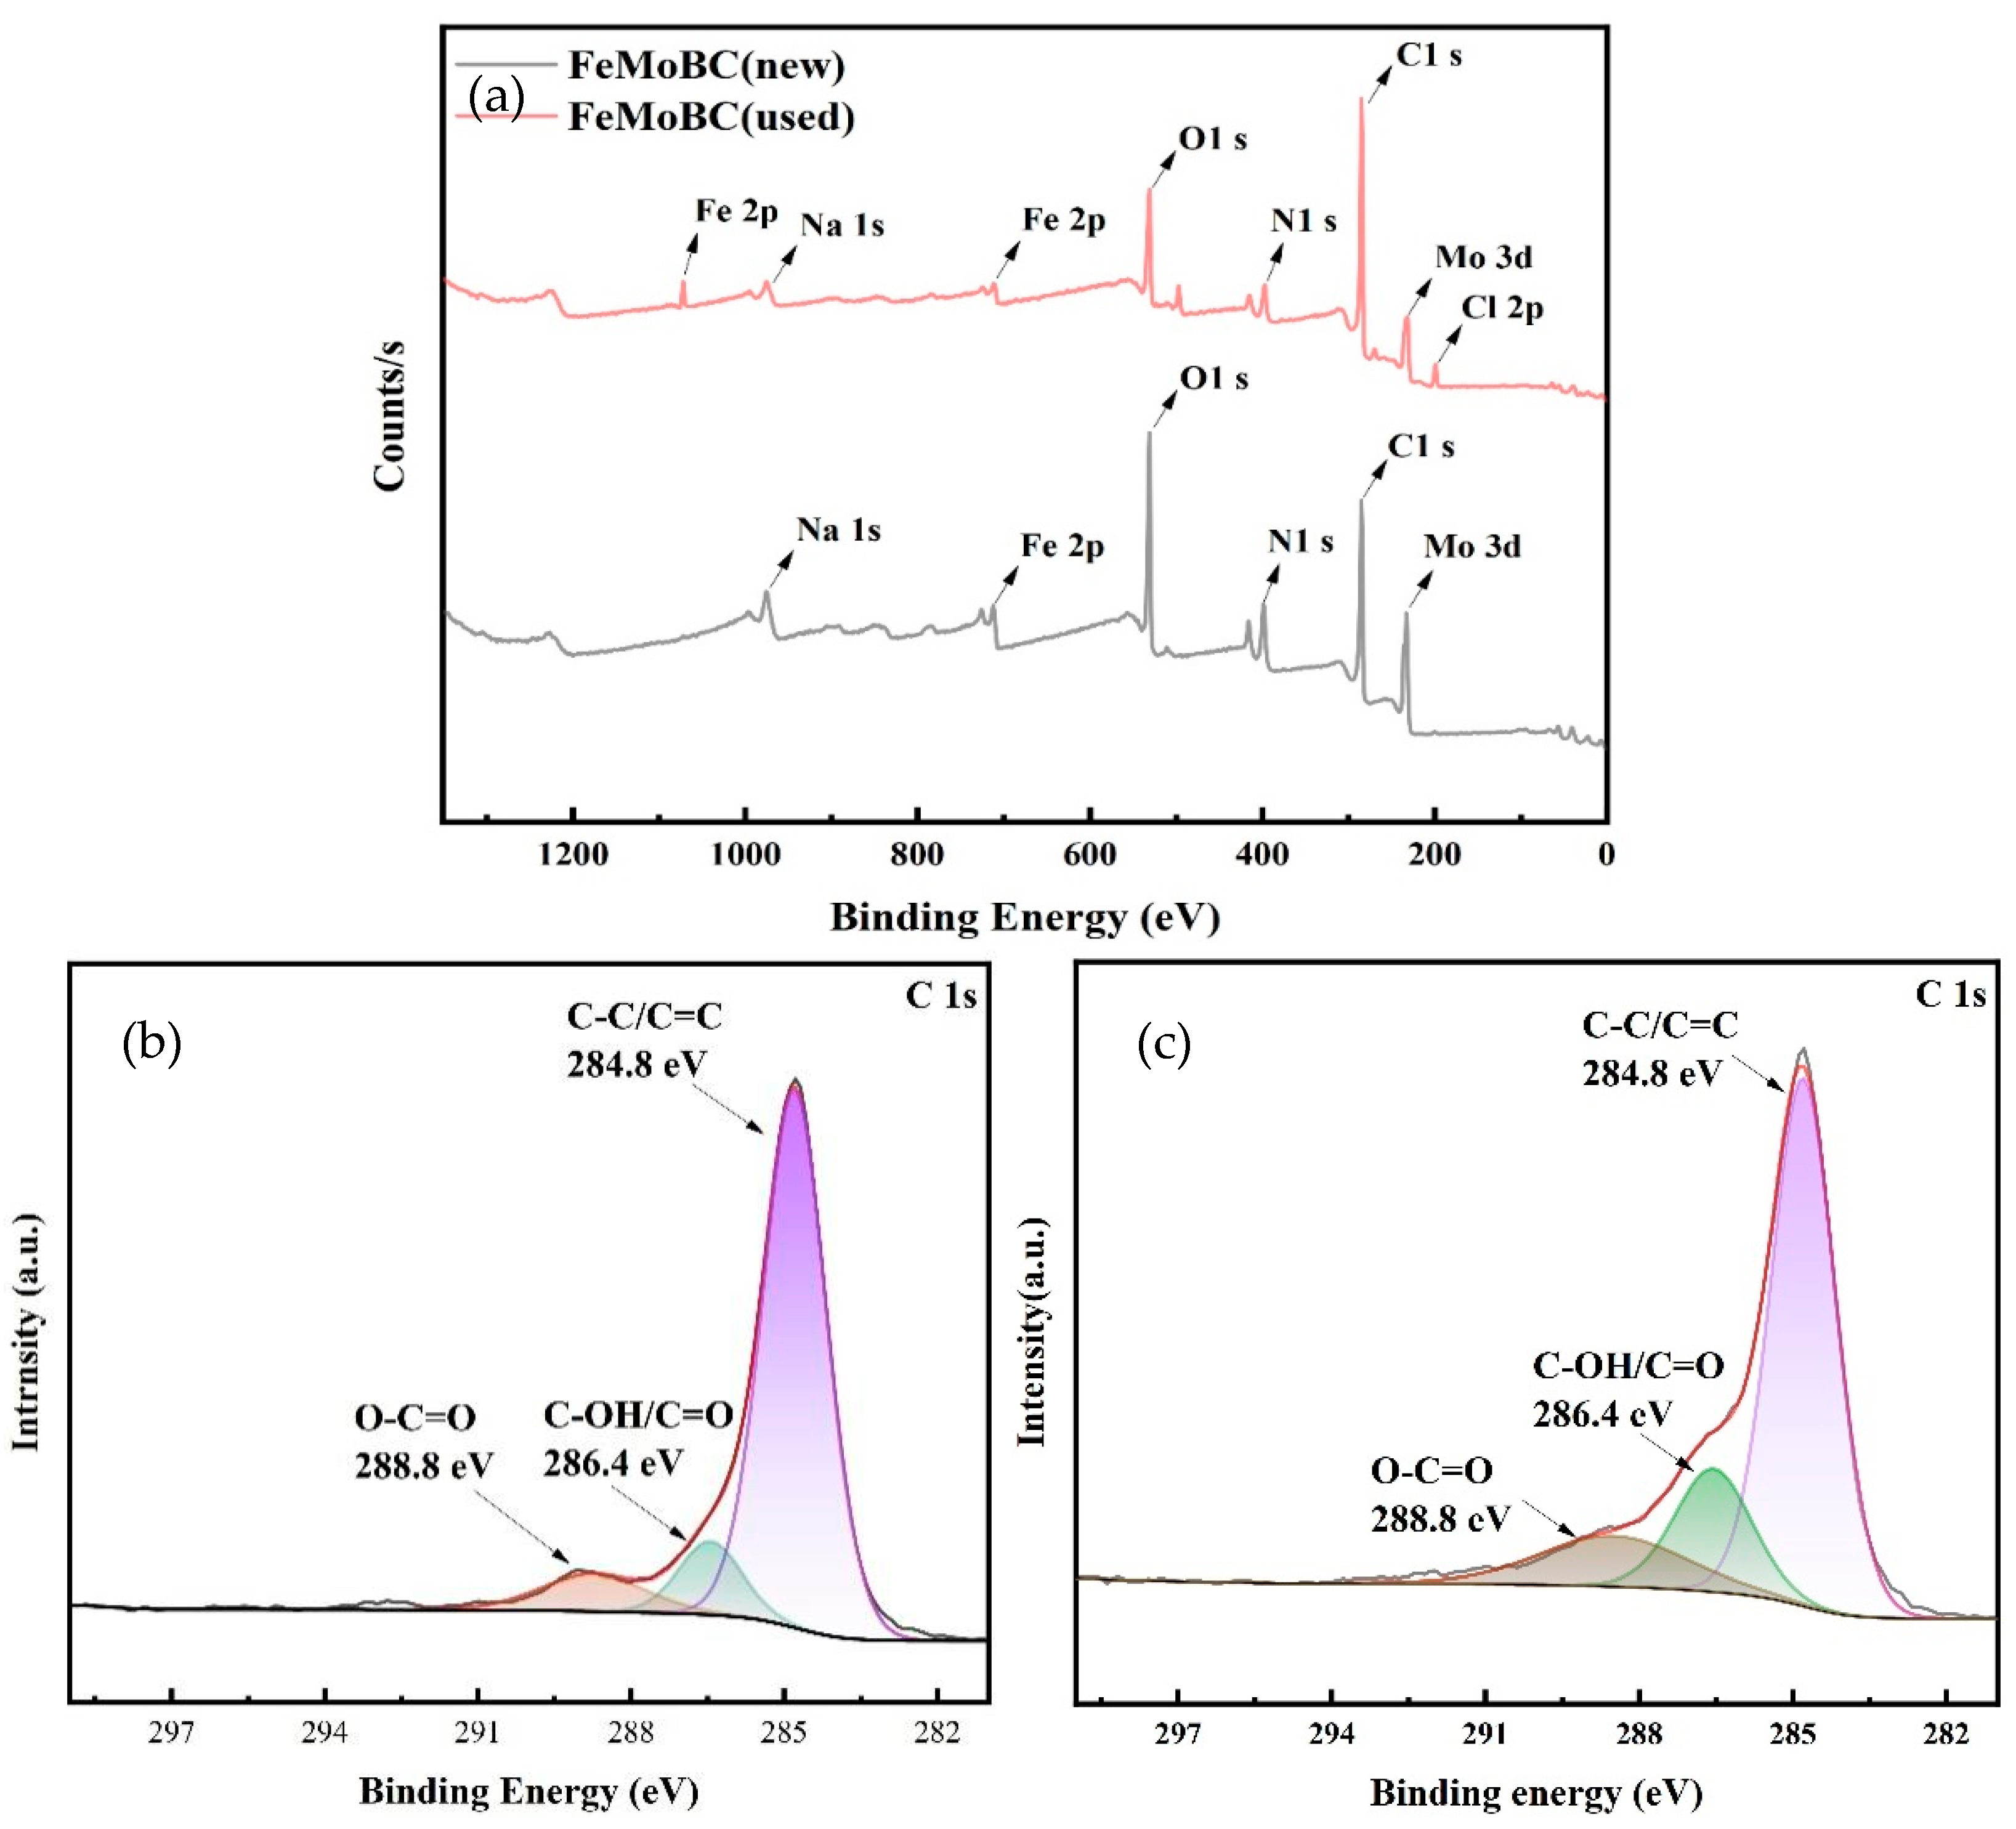
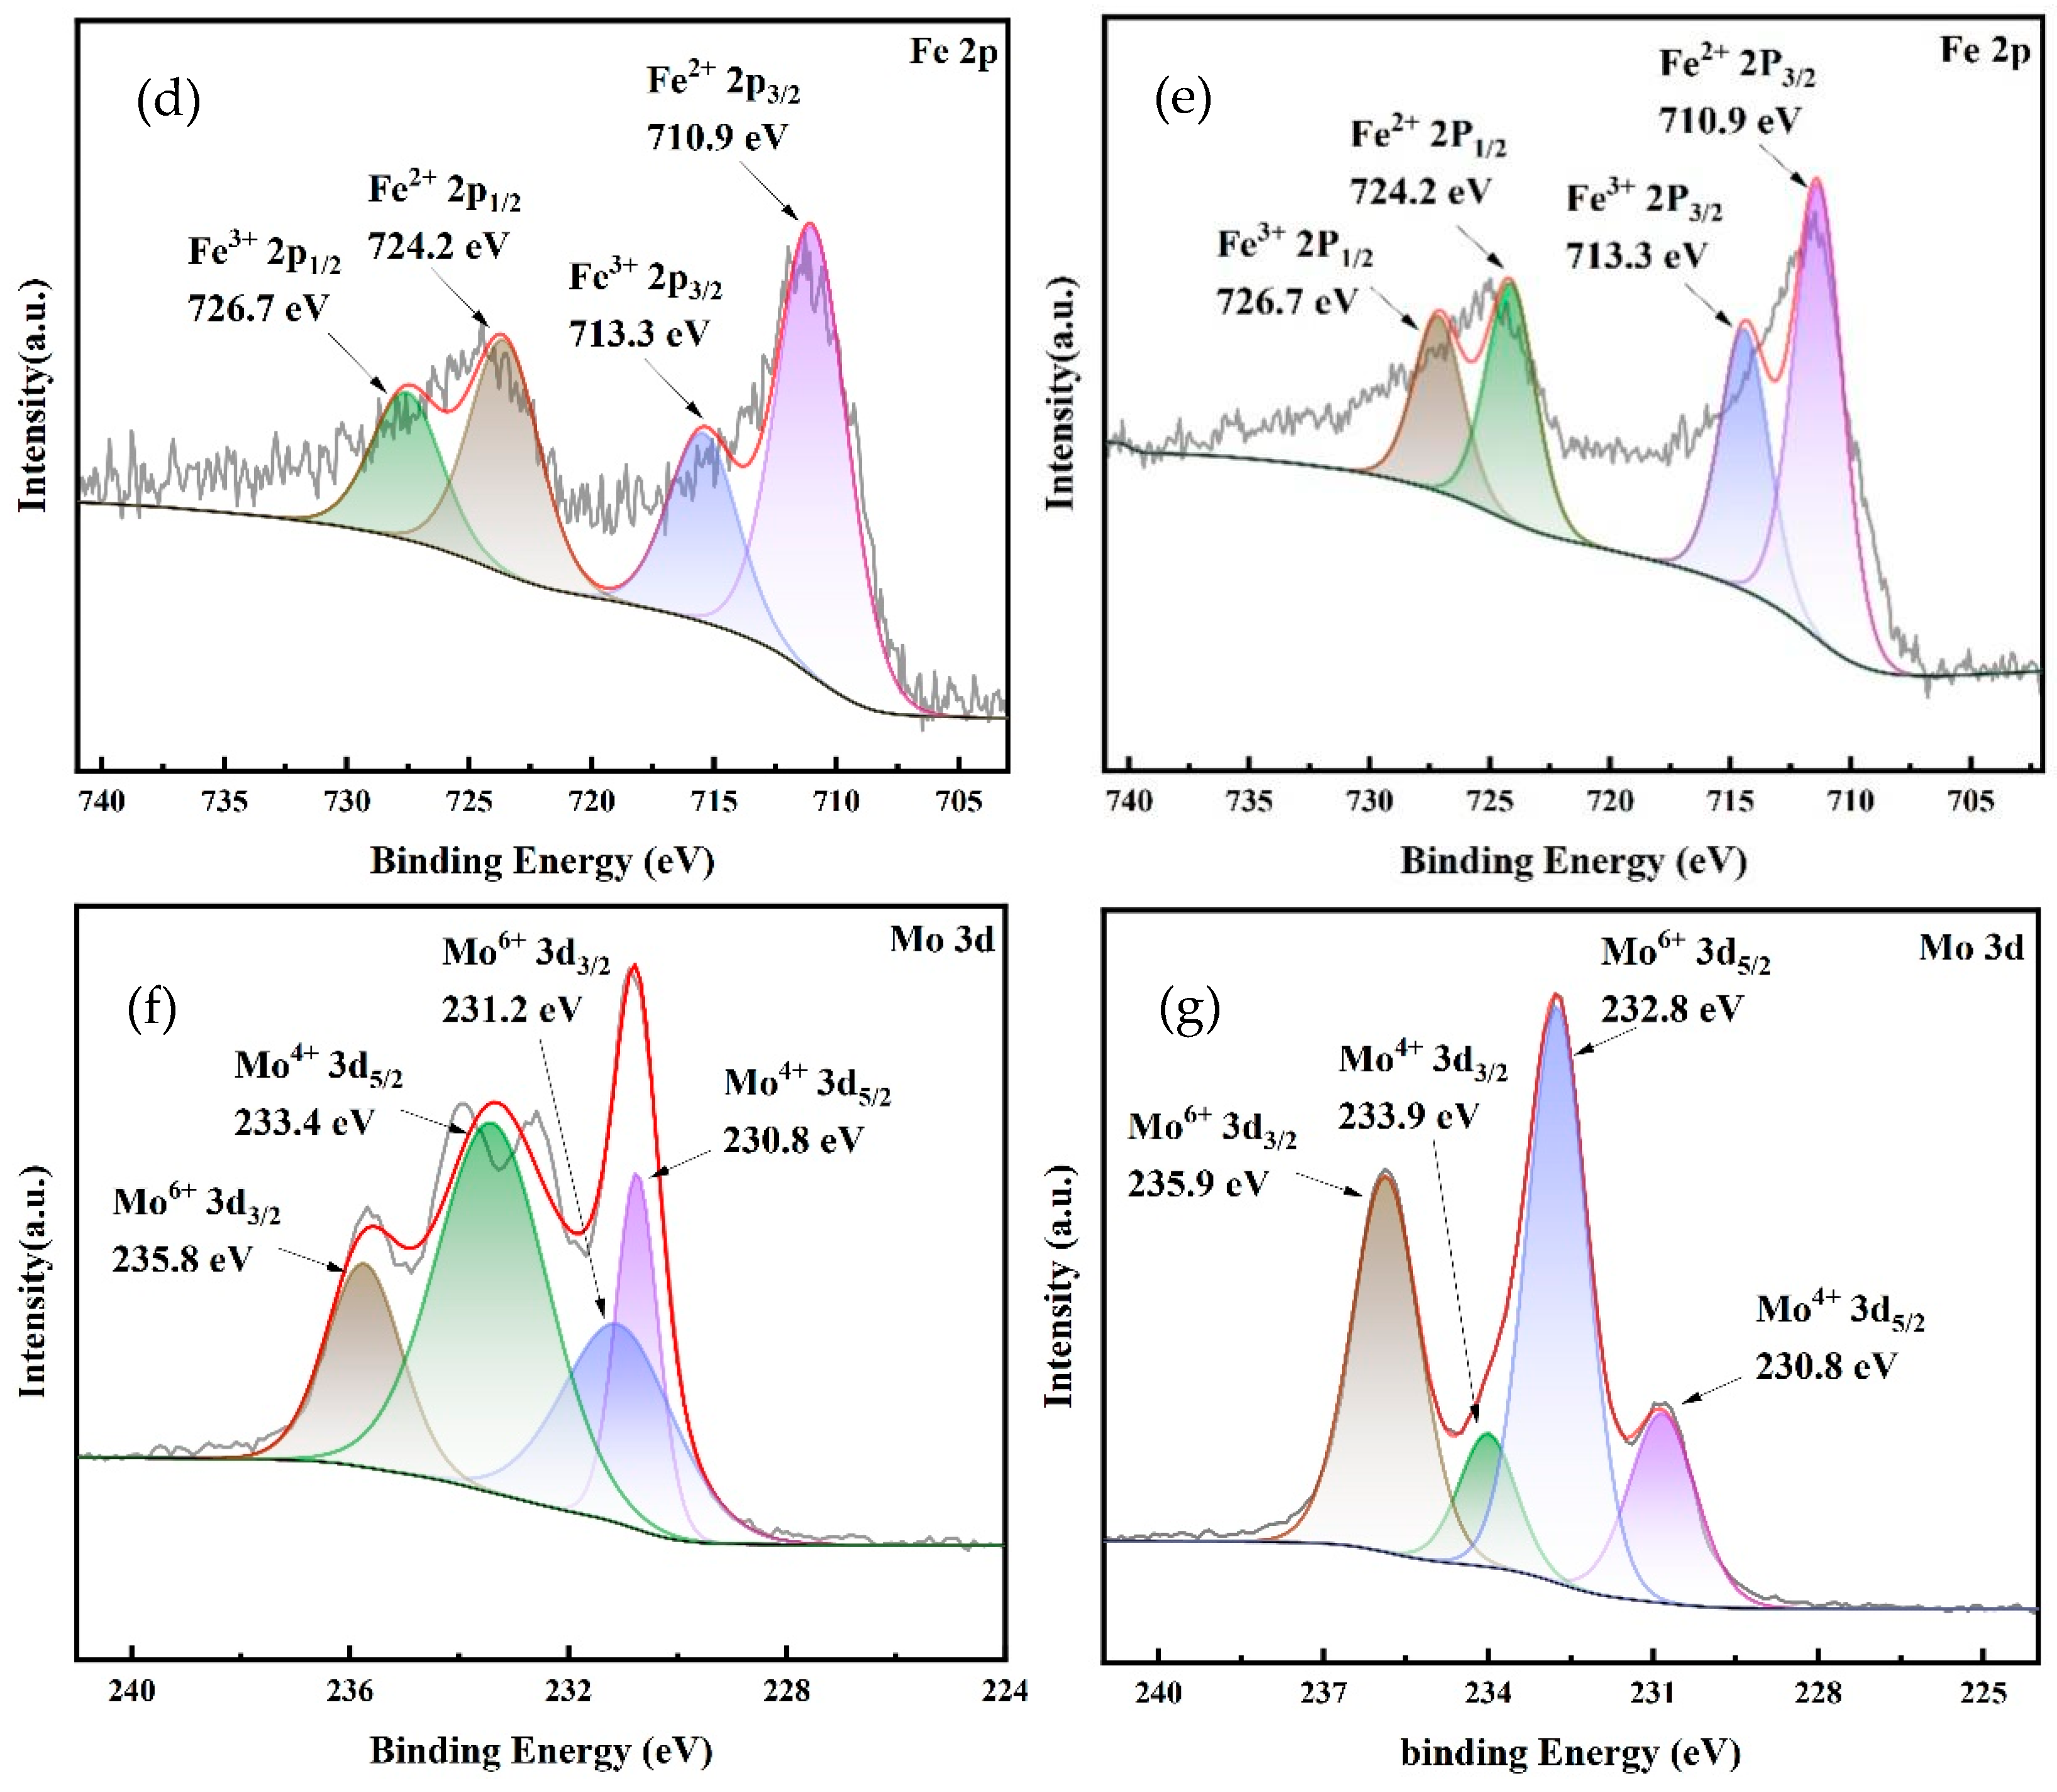
In order to further analyze the changes in the surface activity sites of the catalysts before and after the reaction, FeMoBC (new) and FeMoBC (used) were characterized by XPS spectroscopy, and the results are shown in Figure 7.
As shown in Figure 7a, in the full spectrum of the catalyst, the five peaks located at 285.08, 531.08, 712.08, 398.08, and 233.08 eV are higher, corresponding to C1 s, O1 s, Fe 2P, N1 s, and Mo 3d, respectively. Before and after the reaction, the intensity of peaks for the elements located in different orbitals of C, O, Fe, N, and Mo changed slightly, indicating that these substances were involved in the reaction. The C1 s, Fe 2P, N1 s, and Mo 3d plots show the changes in the surface activity sites and chemical composition of C, Fe, and Mo in FeMoBC catalysts before and after the reaction.
As shown in Figure 7b,c, the C1 s spectrogram has three types of characteristic peaks: a carbon–carbon double bond and carbon single bond (C=C/C-C, 284.8 eV), aldehydes and carbonyls (C-OH/C=O, 286.4 eV), and carboxyls (O-C=O, 288.8 eV). As shown in Figure 7d,e, there are two groups of characteristic peaks in the spectrum of Fe2p, namely Fe 2p3/2 and Fe 2p1/2. Among them, the satellite peaks of Fe 2p3/2 are 710.9 eV and 717.3 eV, and the satellite peaks of Fe 2p1/2 are 724.2 eV and 726.7 eV. Two peaks at 710.9 eV and 724.2 eV belonged to Fe (II), and 717.3 eV and 726.7 eV belong to Fe (III) [17,18,19]. The Fe (II, III) ion cycling is essential for the generation of OH in the Fenton-like system. The Fe2p spectra reflect that Fe (II, III) ion cycling occurs before and after the reaction. The peaks of the two sets of characteristic peaks in the Mo 3d spectra shown in Figure 7d,e correspond to Mo 3d3/2 and Mo 3d5/2. The Mo 3d3/2 and Mo 3d5/2 peaks at 230.8 and 233.4 eV, respectively, are attributed to Mo (IV), whereas the peaks at 231.2 and 235.88 eV are attributed to Mo (VI) and satellite peaks [20]. The peaks of Mo (IV) and Mo (VI) produce changes before and after the reaction, confirming the existence of a certain degree of electron transfer in Mo. Compared with FeMoBC (new), the peaks of FeMoBC (used) all had different degrees of attenuation after the cyclic reaction, suggesting that Fe and Mo were jointly involved in the reaction. The core of the decrease in Mo (IV) intensity was the reduction in the surface valence state induced by a reductive catalytic environment (such as Mo5+→Mo4+), supplemented by the influence of surface covering, ligand reconstruction, or bulk diffusion. It is also possible that surface passivation layer formation and competitive adsorption occurred. XPS characterization showed that multiple valence states of FeOx and MoOx were doped on the surface of the BC [21,22], which was in agreement with the results of the XRD detections and further illustrated the success of the FeMoBC synthesis.

3.6. Effect of Catalyst on TC Adsorption

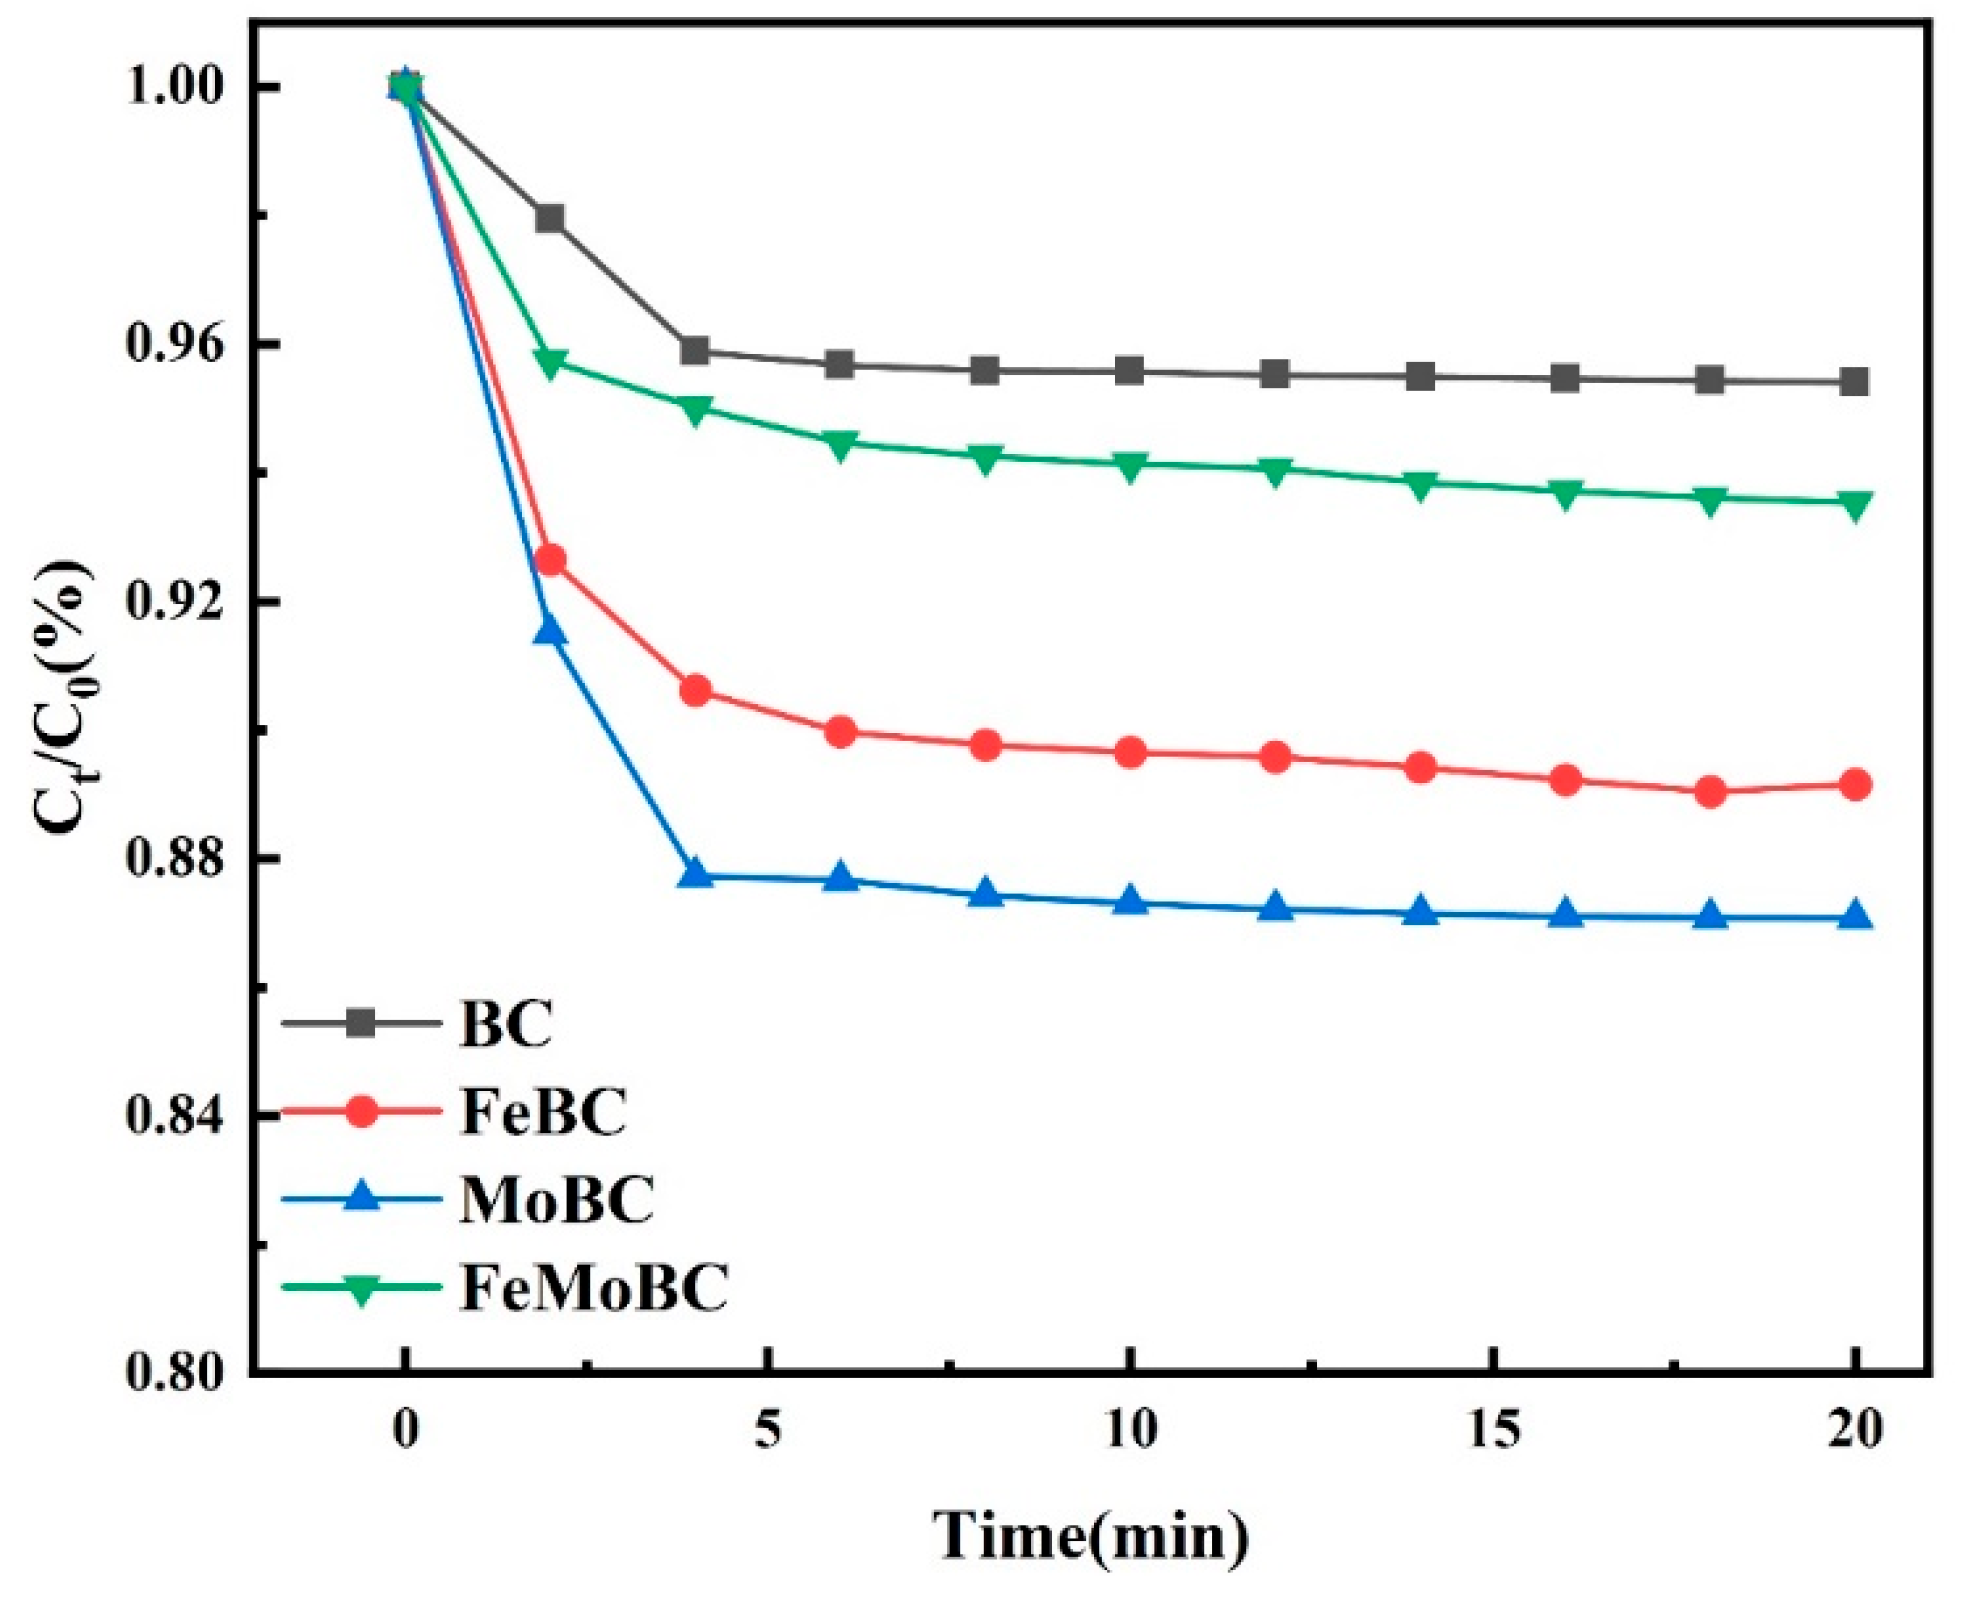
Under the conditions of reaction temperature 25 ± 1 °C, material dosage 200 mg/L, rotor speed 200 r/min, initial TC concentration 0.03 mM, and solution pH 6.8 ± 0.1, the adsorption properties of BC, FeBC, MoBC, and FeMoBC for TC in water were investigated. As shown in Figure 8, the adsorption rates of TC by BC, FeBC, MoBC, and FeMoBC were 4.6%, 10.9%, 12.9%, and 6.47%, respectively, within 20 min. For FeMoBC, its adsorption capacity was lower than that of FeBC and MoBC, which might be due to the dense oxide crystals formed by bimetals in the pores of biochar materials. The previous characterization analysis also confirmed this result.

4. Efficacy of O3, O3/PMS, and O3/PMS/FeMoBC Processes for TC Degradation in Single-Factor Test

The above characterization results showed that Fe2Mo3O8 and FeMoO4 were the main components of iron molybdate composites. Therefore, in order to investigate the catalytic performance of the composite materials, the degradation efficiency of TC by O3, O3/PMS, and O3/PMS/FeMoBC was compared and analyzed in the experiment, and it was evaluated by 20 min degradation rate and pseudo first-order degradation kinetics (kobs value).

4.1. Effect of Gaseous O3 Concentration on Degradation Efficacy

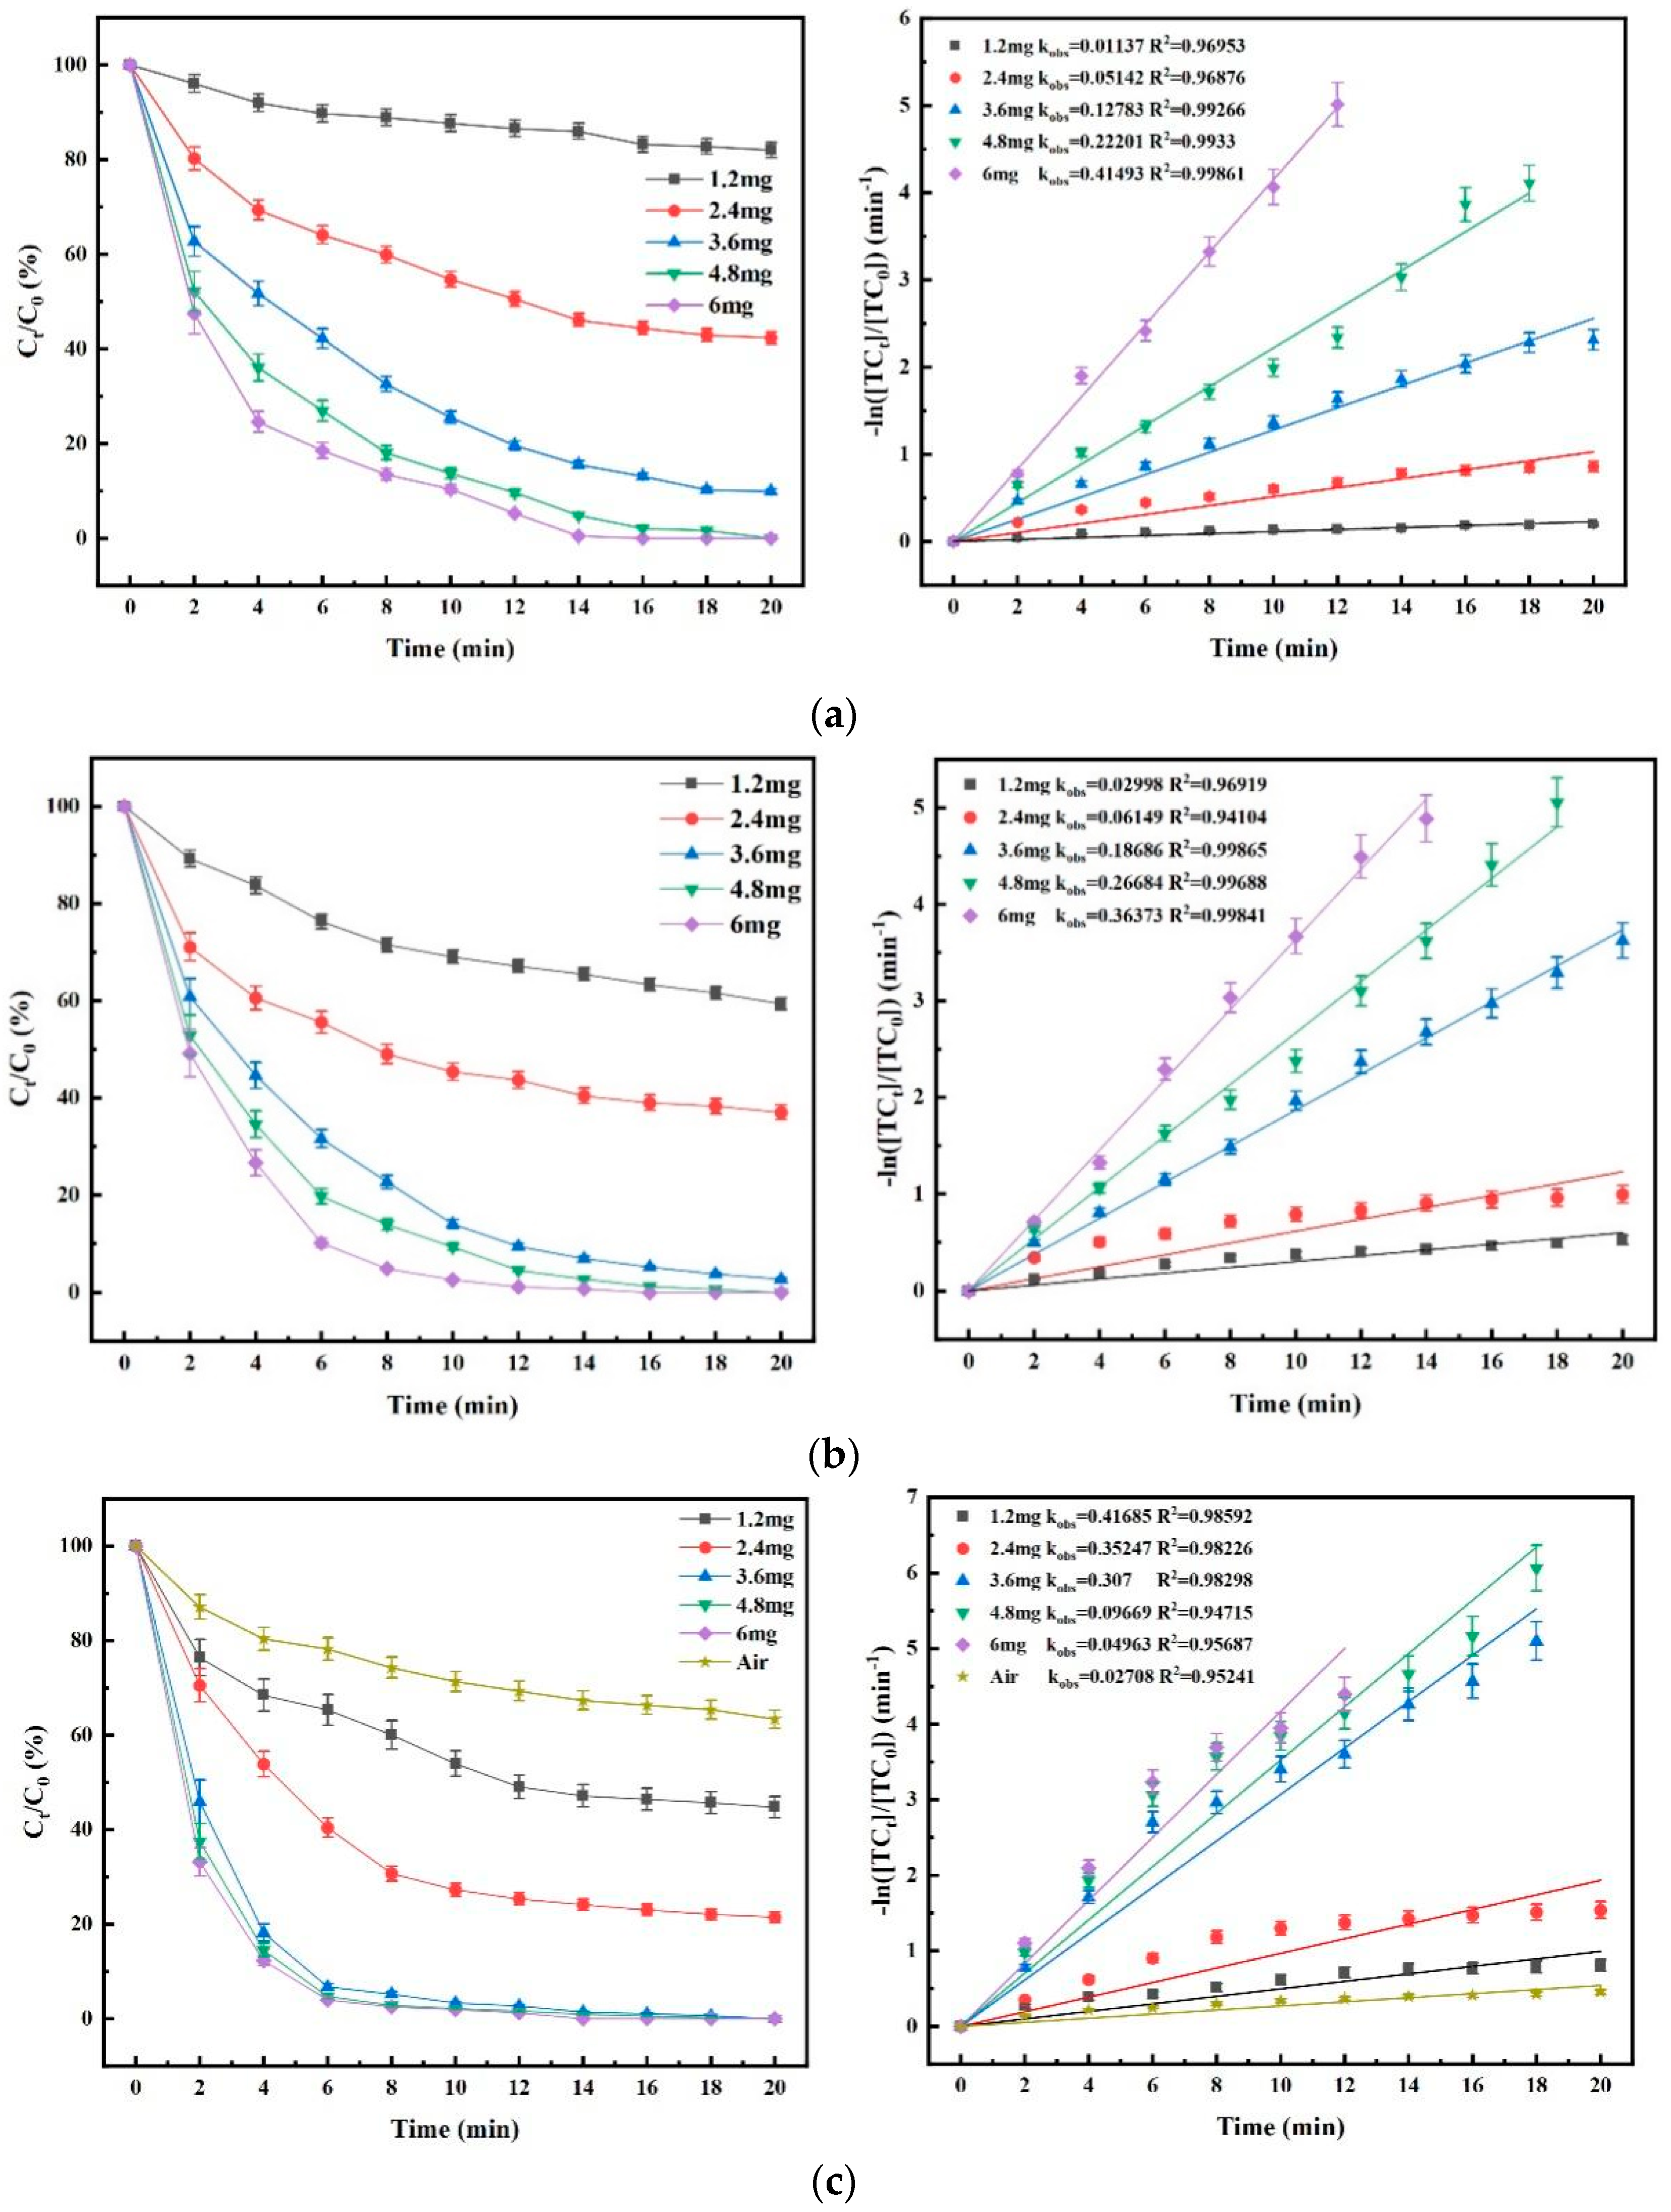
As shown in Figure 9a, the degradation rate of TC decreases with the increase in O3 concentration in the O3 process within 20 min time. As shown in Figure 9b, in the O3/PMS process, the degradation rate of TC increases rapidly along with the degradation rate at the same time when the O3 concentration gradually increases, and the kobs value also increases gradually. When the gaseous O3 concentration was 6 mg/L, the O3/PMS process was able to achieve a degradation rate of 92.5% in 10 min, which was a significant improvement compared with the O3 process and further indicated that part of the O3 and OH might be involved in the generation of SO4•− at this time, thus avoiding the self-burst phenomenon caused by high OH concentration. See Equations (1)–(5) in Table 3.
In addition, the process was able to completely oxidize and remove TC from water within a 12 min reaction time period. As can be seen from Figure 9c, the effect of gaseous O3 concentration on the degradation efficacy in the O3/PMS/FeMoBC process was similar to that of the O3 and O3/PMS processes, and the kobs of the reaction system increased along with the increase in the O3 concentration. The main reason was the shorter half-life of OH, and the self–quenching and radical competition phenomena were less frequent [4,6]. Compared with O3 and O3/PMS, the addition of FeMoBC resulted in a larger increase in the kobs value, confirming the efficient catalytic efficacy of FeMoBC. In addition, the key role of O3 in O3/PMS/FeMoBC was further clarified in the Air group. Due to the low solubility in water and the fast escape rate of O3 from water, if the gaseous O3 concentration is set too high, this will result in wasted O3 and thus higher operating costs. Therefore, in order to reduce energy consumption and examine the coupling efficiency of O3 with other substances, the gaseous O3 concentration was set to 3.6 mg/L in this experiment while considering other influencing factors.

4.2. Effect of Initial TC Concentration on Degradation Efficiency

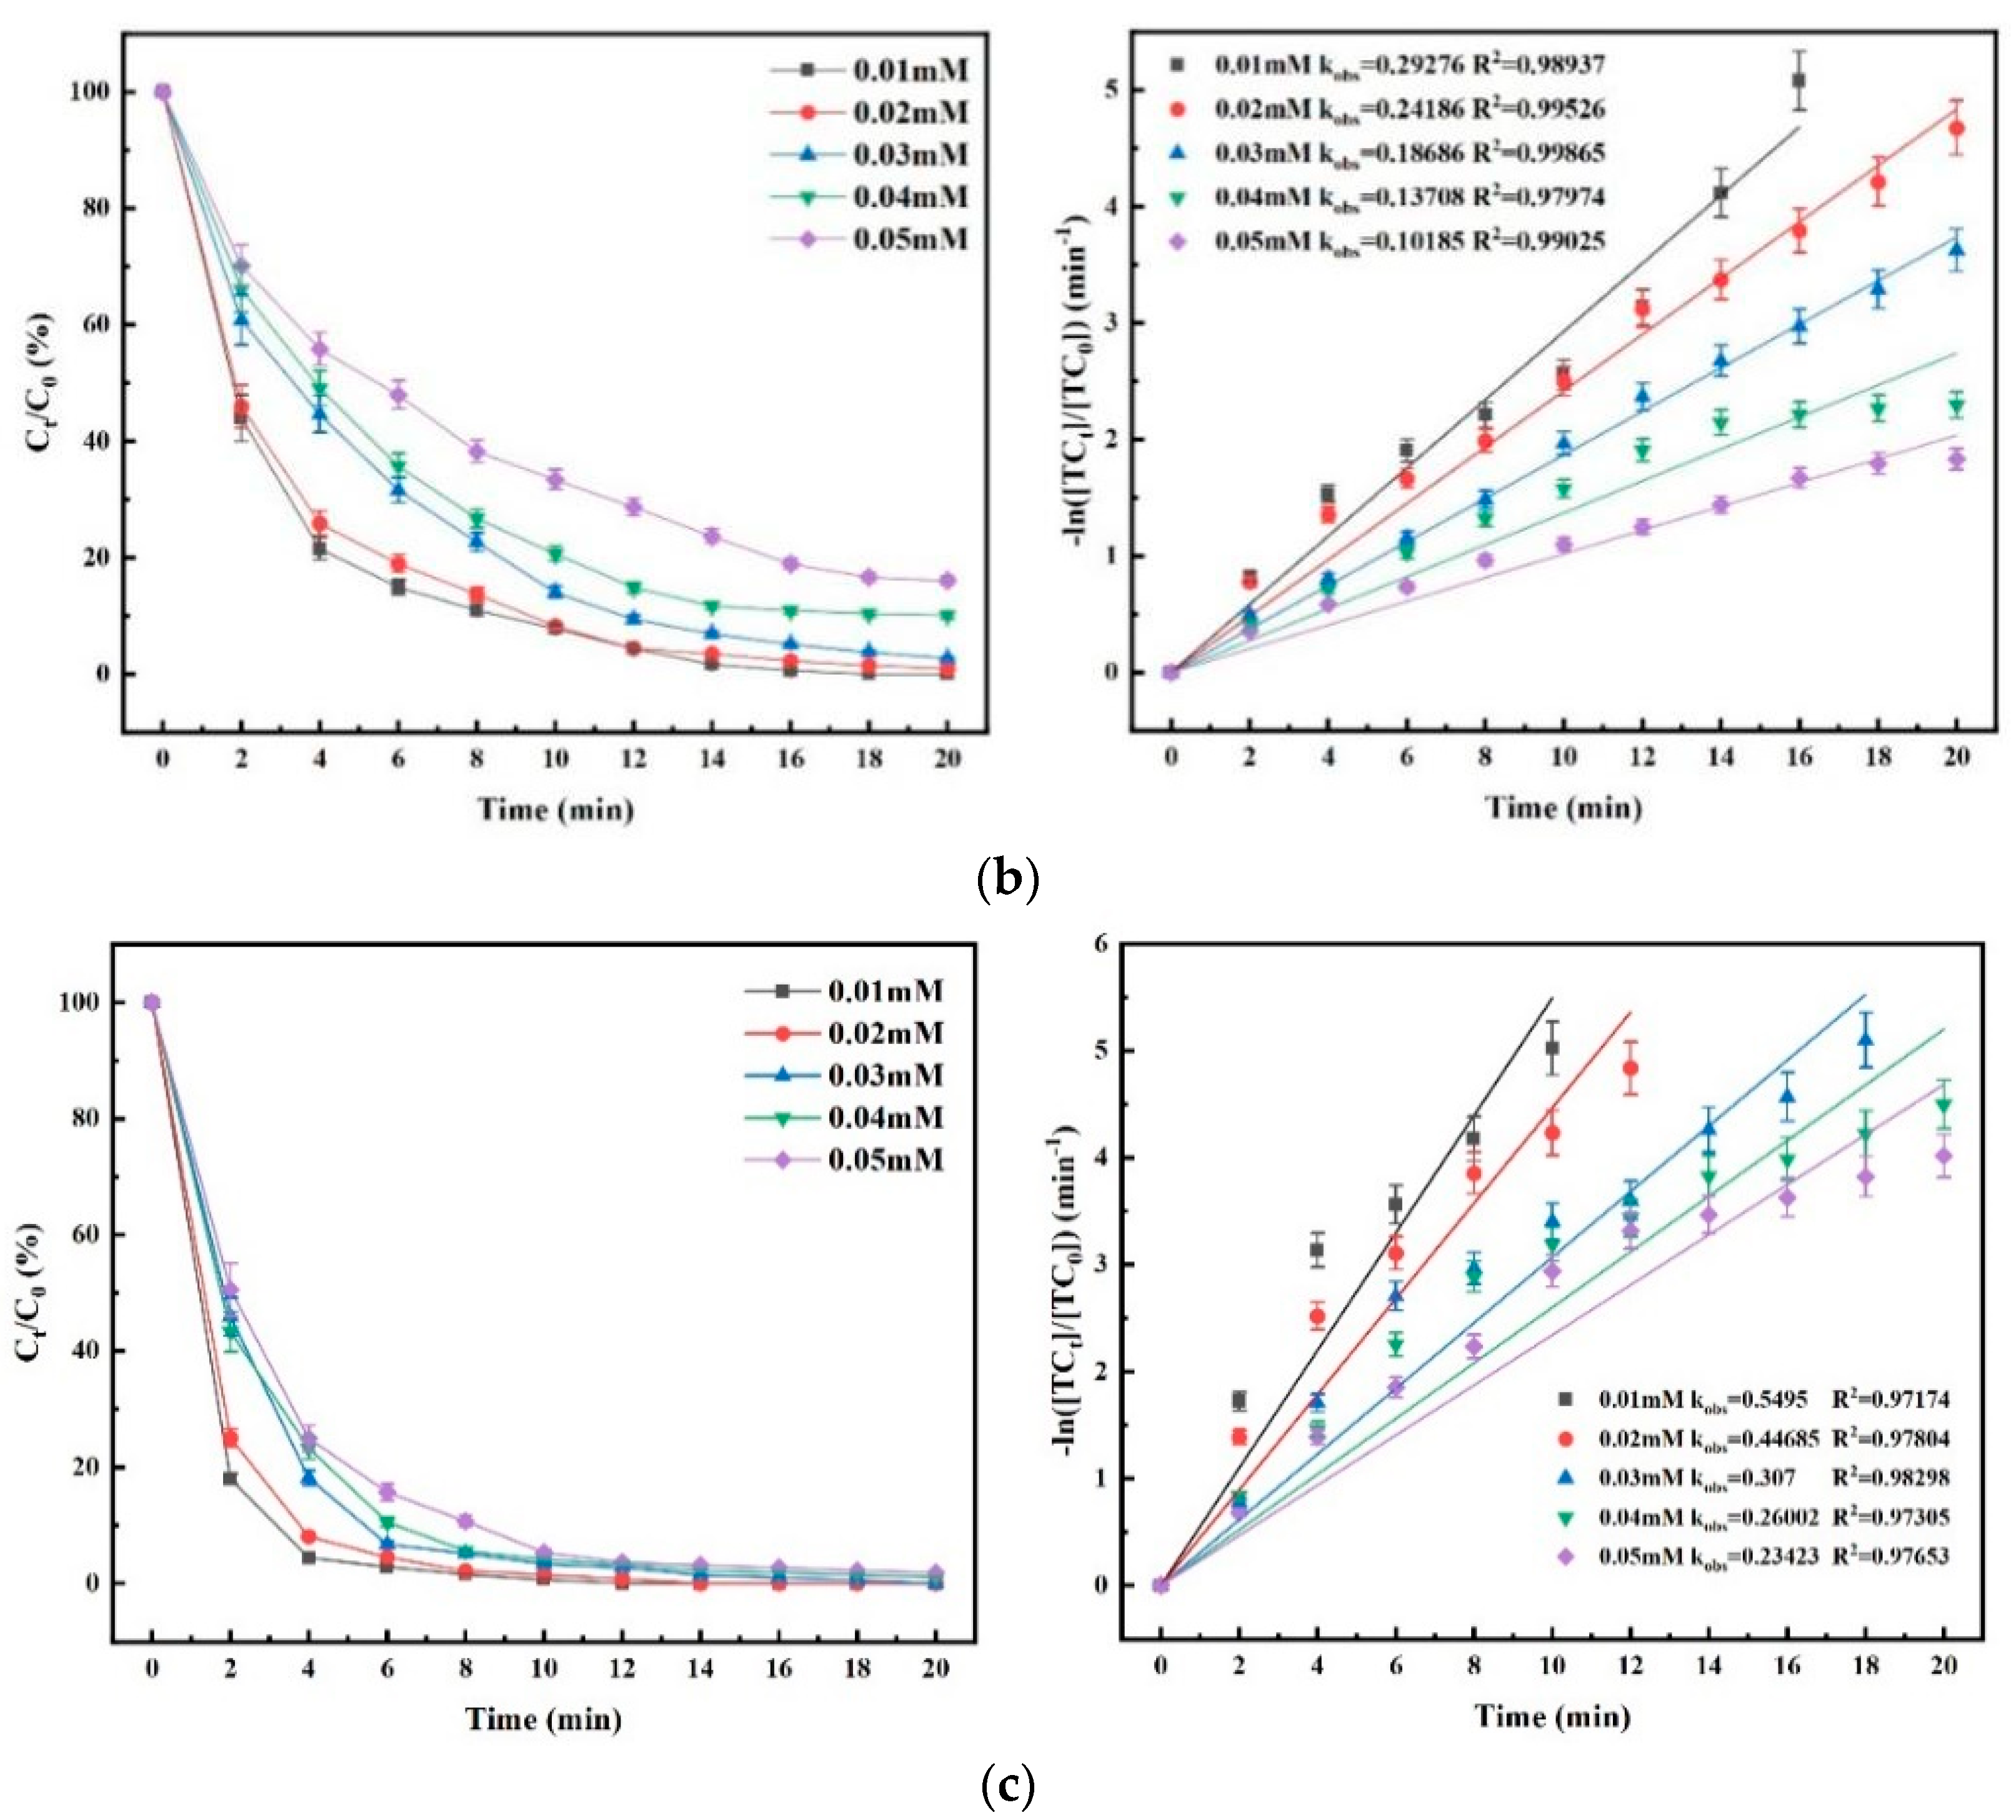
The experiments were carried out to investigate the effects of different initial TC concentrations on the degradation efficacy of the three processes. The experimental results are shown in Figure 10.
As shown in Figure 10, the degradation rate of TC decreased with the increase in its initial concentration in the three processes. When other reaction conditions were the same, the order of TC degradation rate in the three systems from high to low was O3/PMS/FeMoBC > O3/PMS > O3. The main reason for the decline in the degradation rate of the three processes was that the amount of O3 introduced per unit time is certain, but with the increase in the concentration of target pollutants, more active oxidizing substances were needed to be consumed per unit volume, resulting in insufficient active substances, which led to the decline in the kobs value. As can be seen in Figure 10c, the degradation rate of the O3/PMS/FeMoBC system is higher than that of both O3 alone and O3/PMS, and the reaction rate decreases with the increase in TC concentration. At a TC concentration of 0.03 mM, the kobs = 0.307 min−1, which is 141.7% and 65.05% higher than the O3 and O3/PMS processes, respectively. Even at a TC concentration of 0.05 mM, the degradation rate of this process was still as high as 99% within 20 min.
As a result, the increase in the initial concentration of TC had a negative impact on the degradation efficacy of these three kinds of O3 processes. Therefore, in order to both facilitate the study and approximate the concentration in actual TC wastewater, the initial concentration of TC for subsequent studies was set to 0.03 mM.

4.3. Effect of PMS Concentration on Degradation Efficiency

Figure 11 shows the effects of different PMS concentrations on the degradation efficacies of TC for the three processes (no PMS was added in the O3 process).
As shown in Figure 11, the influence trend of PMS concentration on the degradation efficiency of TC in O3/PMS and O3/PMS/FeMoBC systems was basically the same. That is to say, the increase in the PMS concentration had a positive effect on the improvement of TC degradation efficiency in a certain range; however, when PMS concentration increased to a critical value, the degradation rate of TC decreased. It is assumed that the main reason is that with the increase in the PMS concentration, the SO4•− content in the reaction system increased and produced the self-quenching phenomenon [26,27]. The self-quenching formula and the reaction rate are shown in Table 4, Equations (16)–(18). This indicated that the increase in the PMS concentration was positively correlated with the catalytic efficiency of FeMoBC within a certain concentration range. However, at this time, the mutual quenching effect of free radicals that may occur when the PMS concentration was too high must be considered. Therefore, in order to fully investigate the efficacy of other single-factor experiments and to save costs, the PMS concentration was set at 30 μM in this experiment when other influencing factors were considered.

4.4. Effect of Material Dosage on Degradation Efficacy

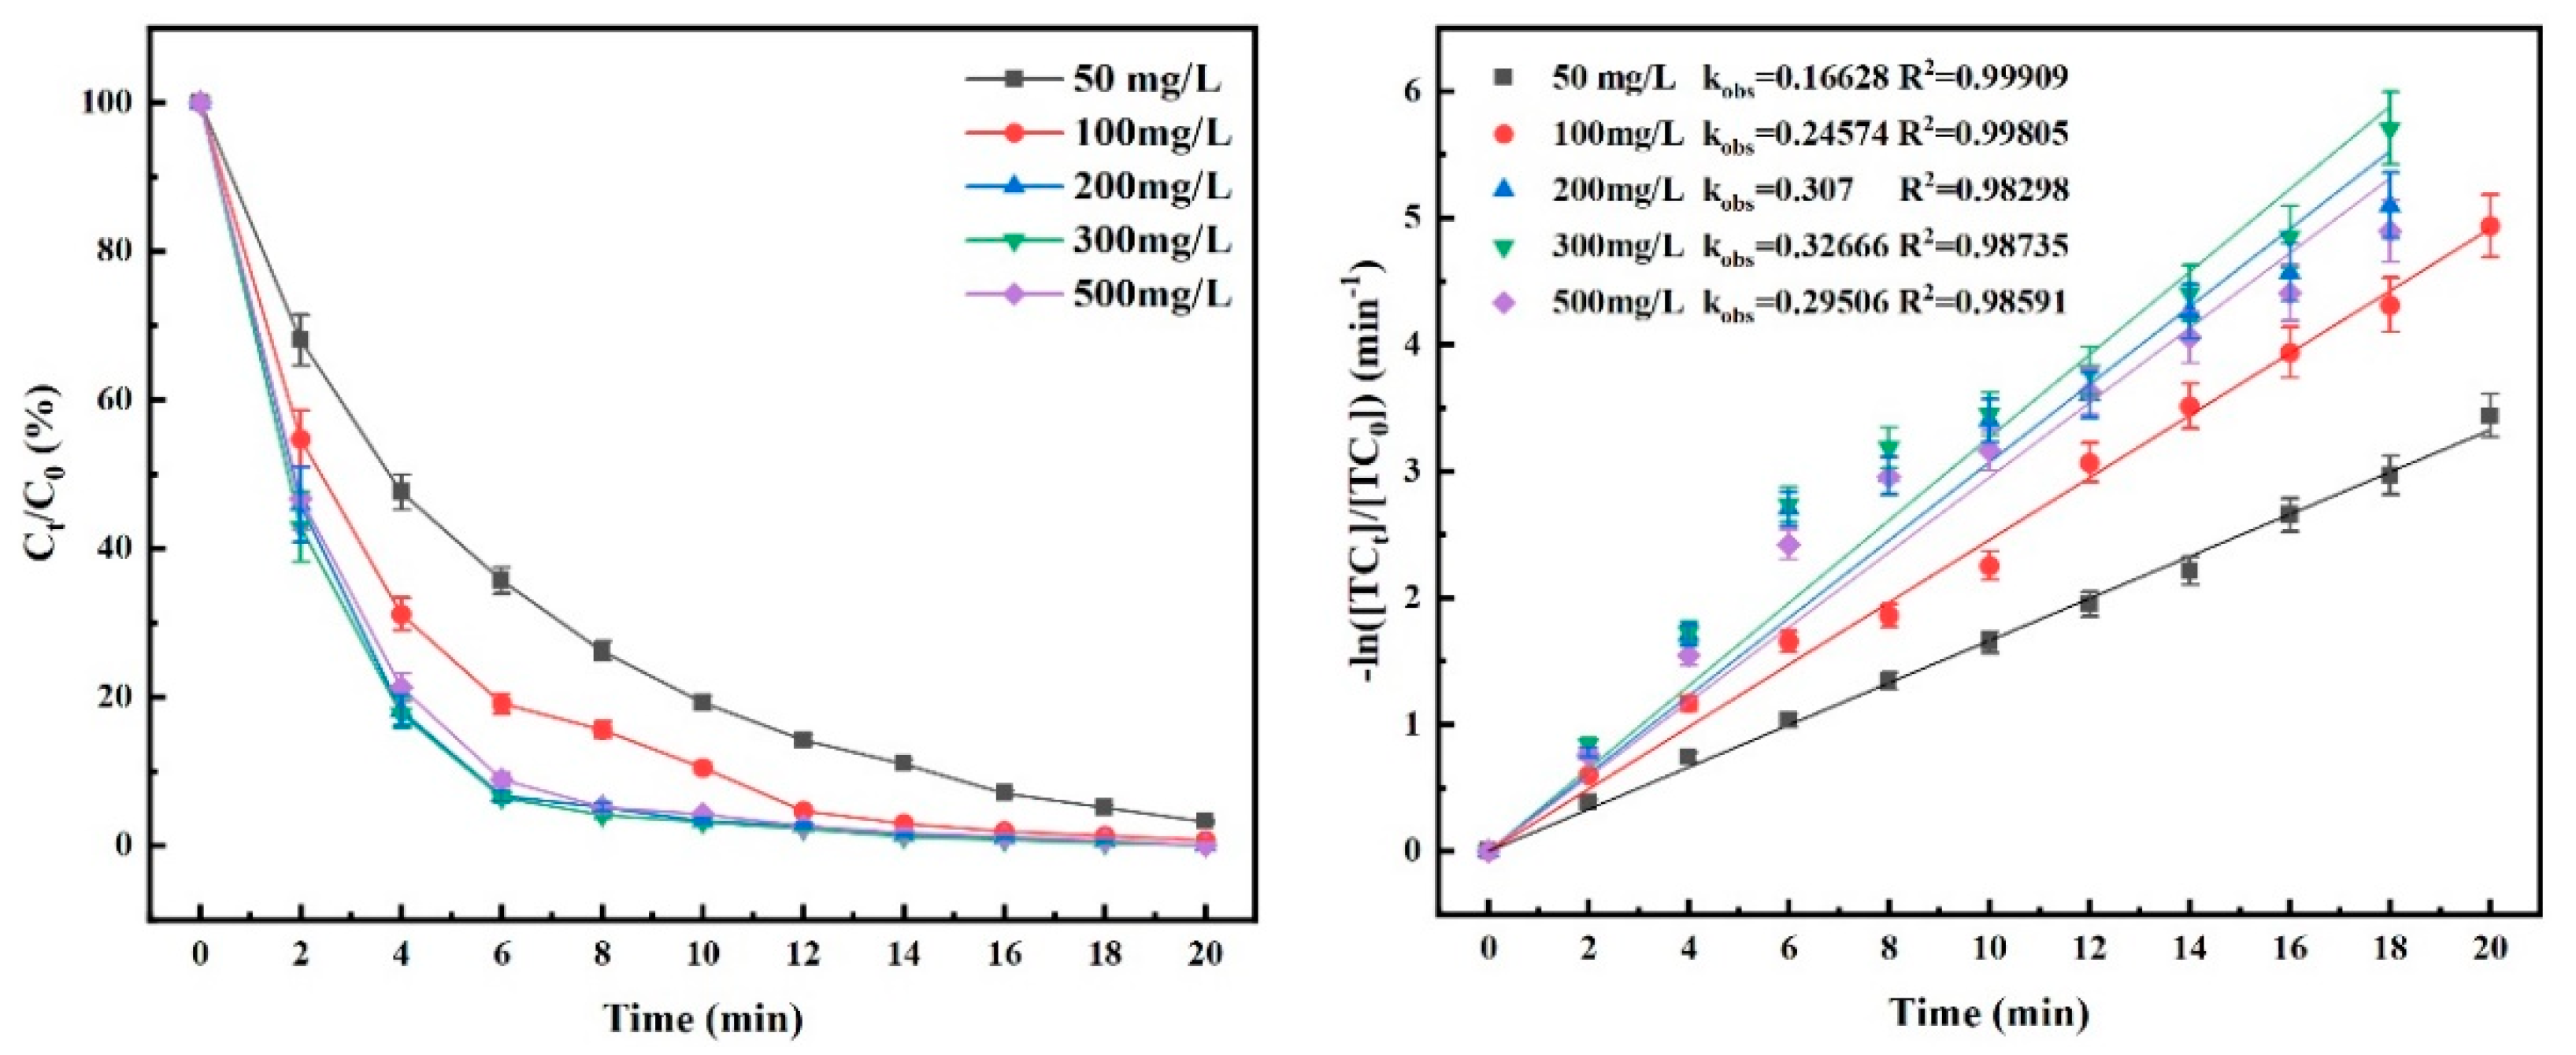
The effect of the different dosages on TC degradation efficiency of the O3/PMS/FeMoBC process was investigated. The experimental results are shown in Figure 12.
As can be seen from Figure 12, the reaction rate of the O3/PMS/FeMoBC system was significantly enhanced compared to O3 and O3/PMS. From the figure, it can be seen that the addition of catalyst had a greater enhancement on the kobs value, and the value of O3/PMS/FeMoBC was higher than the single O3 and O3/PMS processes under the same conditions. However, when the dosage was increased from 200 mg/L to 500 mg/L, the increase in the degradation efficiency was very small. The possible reason for this was that the rotor speed in the experimental setup was constant, and the amount of material dosed was too large, which resulted in some of the dosed material not diffusing uniformly into the reactor, leading to a slow increase in its degradation efficiency. Therefore, in order to remove the TC from the water and save costs at the same time, the material dosage was set at 200 mg/L when other influencing factors were considered in the experiment.

4.5. Influence of Aqueous Environment pH on TC Degradation Efficacy

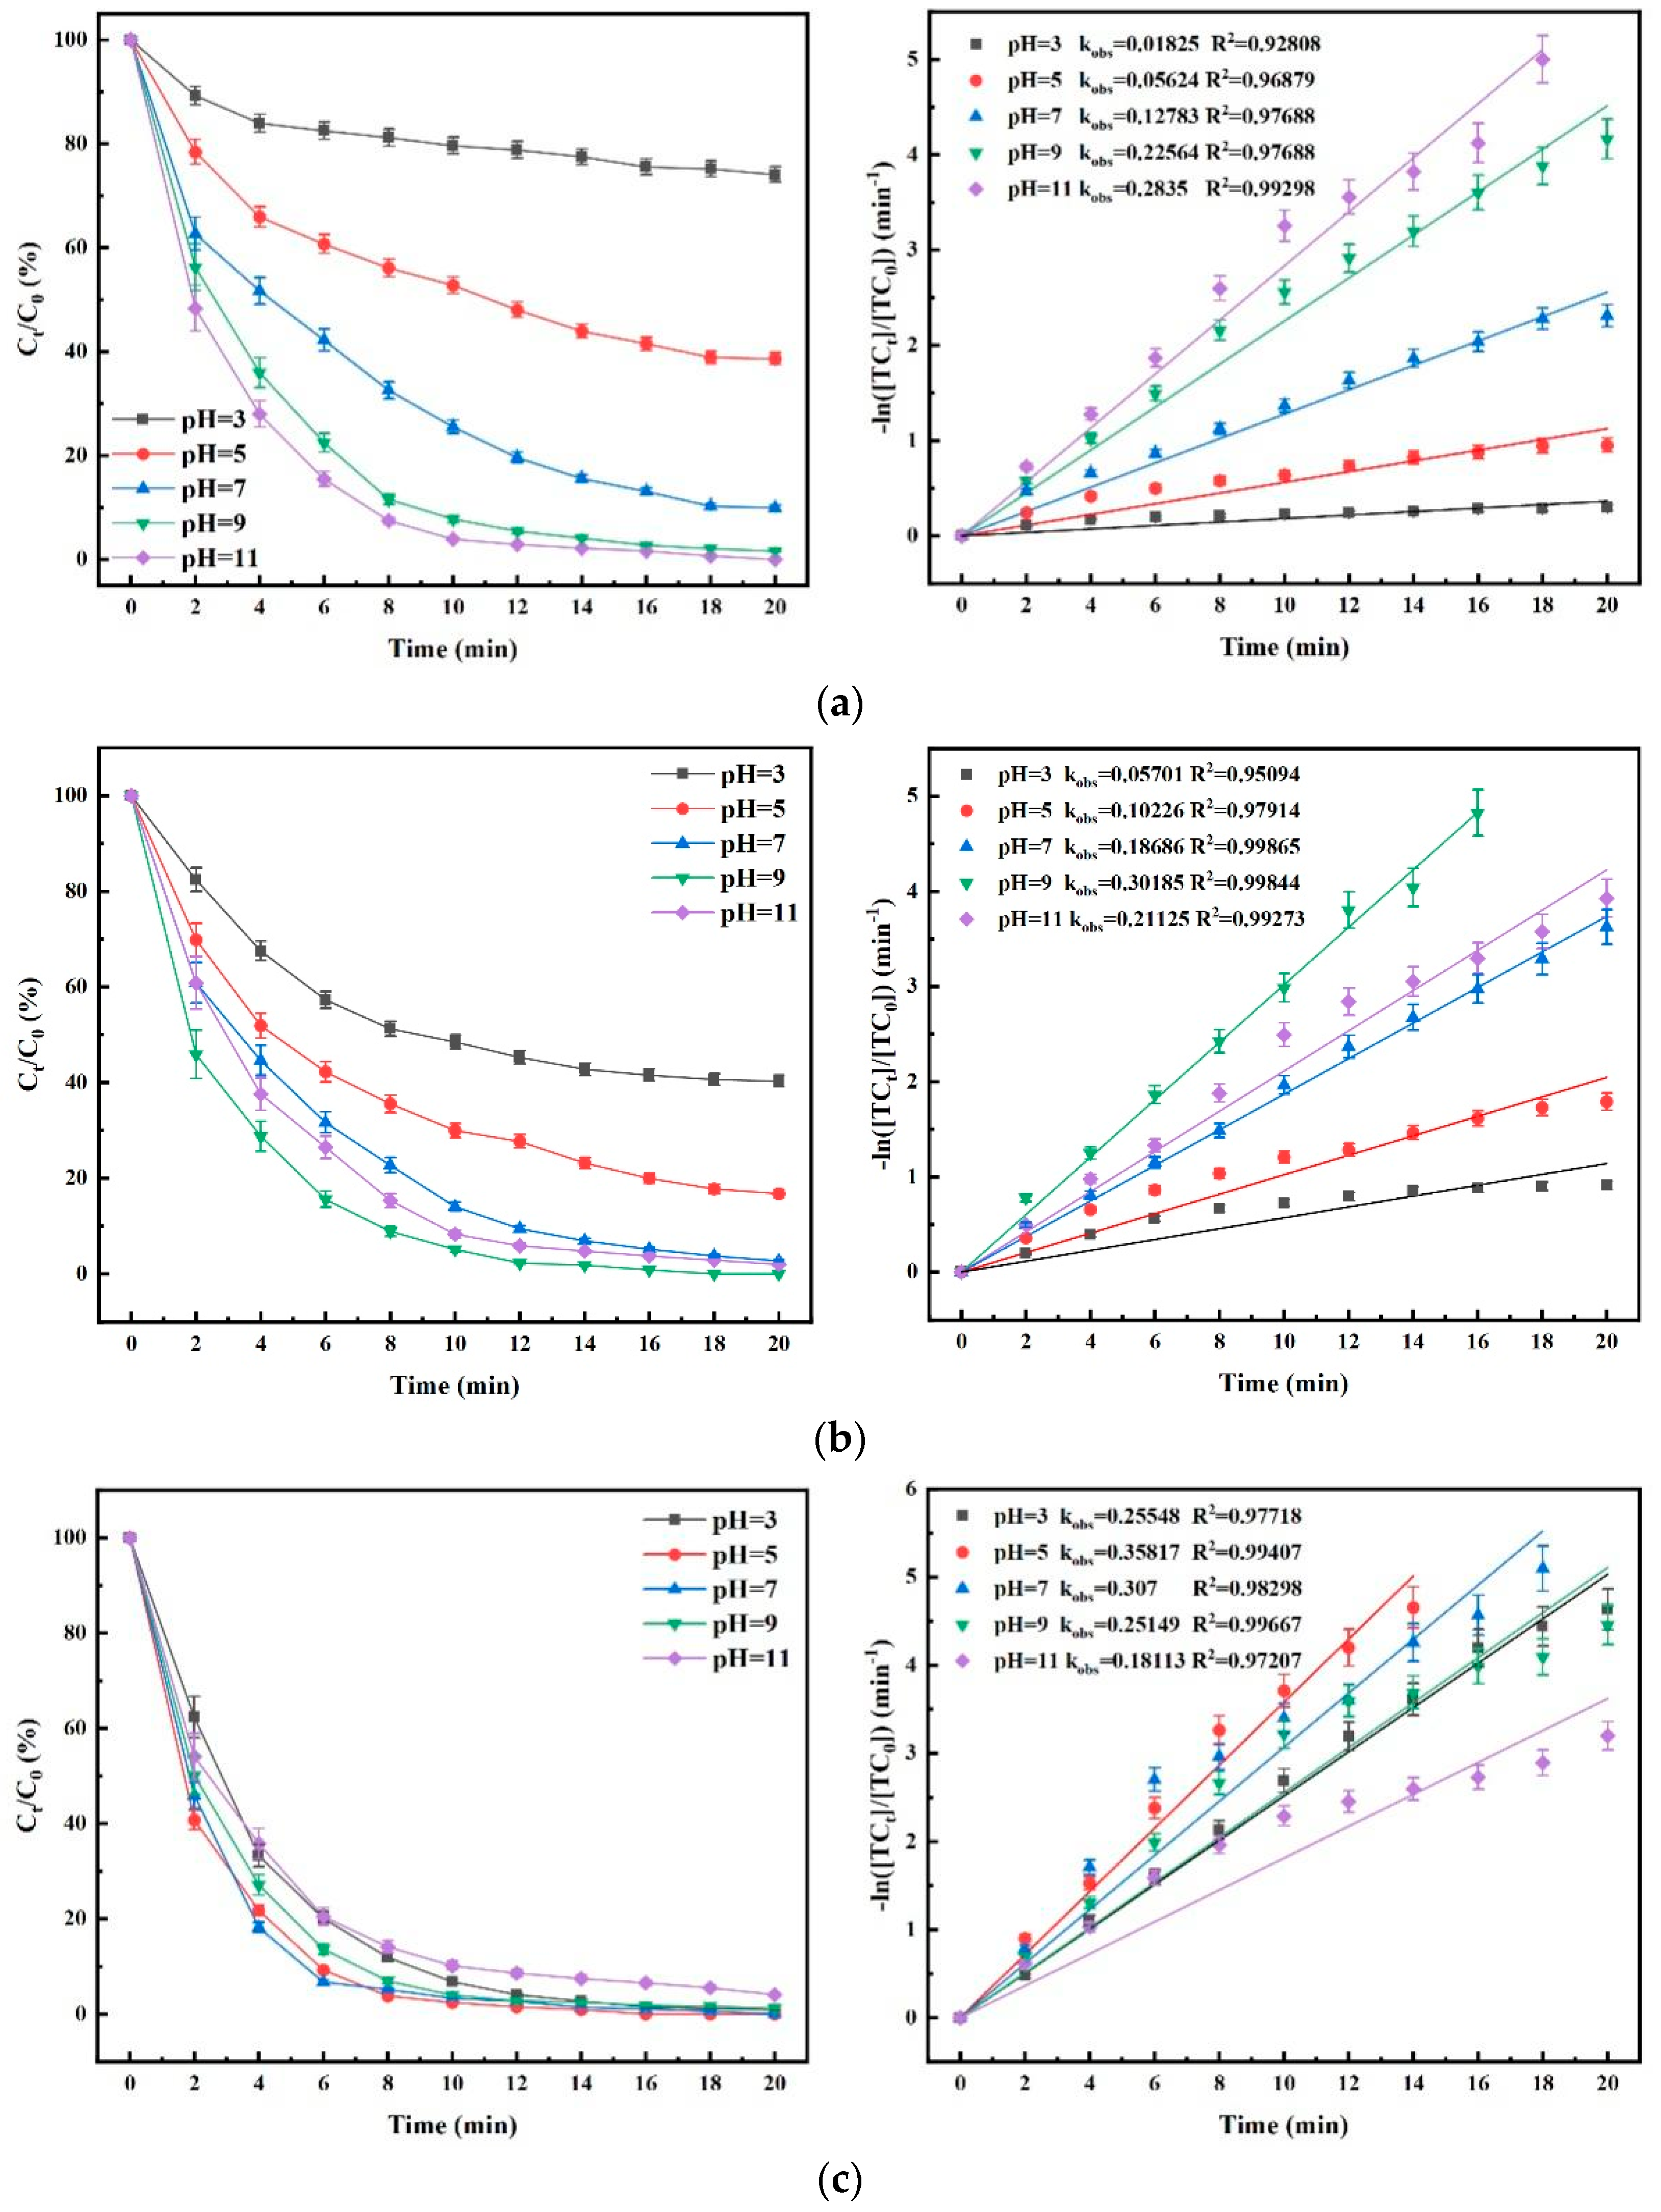
To investigate the effects of the different pH values of the water environment on the TC degradation efficacy of the three processes, the experiment was carried out, and the results are shown in Figure 13. As shown in Figure 13a, the pH value of the solution had a significant effect on the TC degradation rate. The reason for the above phenomenon is mainly due to the different oxide species reacting with TC in solutions of different pH. Under low-pH conditions, the decomposition of O3 is very slow due to the lack of OH, which enables the accumulation of more O3 molecules in solution. Then the target pollutants are mainly oxidized directly by O3 molecules. However, when the pH of the solution increases, the concentration of OH increases accordingly. Then the OH in the system promotes the further decomposition of O3 molecules to generate OH which has a higher oxidizing capacity than O3 molecules. That is why the O3 process operates more efficiently under alkaline conditions.
Figure 13b shows that, in the O3/PMS process, the degradation of TC was optimal in weakly alkaline environments (in which the optimum was reached at pH 9.0). The literature also reported that the degradation of O3/PMS was optimized at pH = 9.4 [28]. The OH had the highest contribution to the degradation of TC within this system when the pH was increased from 5.0 to 7.0 but showed a decreasing trend. The degradation rate in the system gradually increased when the pH was increased from 7.0 to 9.0. This may be attributed to two phenomena: (1) the increase in hydroxyl concentration further increases the rate of O3 decomposition to OH, and (2) the nature of PMS-catalyzed O3 is the reaction with deprotonated PMS (SO52−): H 2 O 2 + 2 O 3 3 O 2 + 2 OH .
The secondary dissociation constant for the dissociation of PMS to SO52− is 9.4. Therefore, in the pH range studied, the closer the pH is to 9.4, the higher the concentration of deprotonated PMS and the faster the catalytic decomposition of O3. When the pH increased above 9.4, the degradation rate tended to decrease slowly. The main reason is that PMS decomposes in a non-radical manner; therefore, the rate of SO4•− generation decreases, and too high a pH concentration causes the radicals in the system to lose their reactivity. It has also been suggested by some scholars that under strong alkaline conditions, the high concentration of OH promotes the generation of more OH, and its excess quenches SO4•− in turn, thus affecting the alkali activation efficiency of persulfate (Equations (17) and (18)) [29,30]. The OH generated from O3 decomposition can react with PMS to form SO4•−, thus pH elevation promotes the generation of OH, which in turn causes an increase in SO4•− generation [31]. In this way, the free radical content in the system was elevated, and the TC removal effect was significantly enhanced. However, when the pH was greater than 9.0, the amount of O3 decomposition increased, and the direct oxidation effect decreased, while the content of free radicals increased, and the mutual burst made the degradation rate of TC decrease.
As shown in Figure 13c, the degradation of TC by O3/PMS/FeMoBC increases and then decreases as the pH in the reaction system changes from acidic to neutral and then to weakly alkaline. The degradation rate reaches a maximum at pH = 5. This suggests that new reactive substances have been produced within the system, thereby favoring the cycling of iron ions although the acidic conditions are not conducive to the production of hydroxyl groups. Meanwhile, the better stability of O3 molecules will improve the efficiency of oxidative decomposition. In addition, the pH adaptation range of O3/PMS/FeMoBC is wider than that of the O3 and O3/PMS processes. Thus, even in the worst case of pH = 11.0 (kobs = 0.18113 min−1), the fluctuation range is still smaller than that of the O3 and O3/PMS processes as seen from its kinetic fitting diagram. In the experiments, some of the CO2 in the air was dissolved in the deionized water due to the rotor stirring process. Therefore, in order to approximate the neutral pH conditions of the natural water environment, the pH settings of subsequent experiments were therefore set to 6.8 ± 0.1.

4.6. Effect of Common Inorganic Anions in Water on Degradation Efficacy

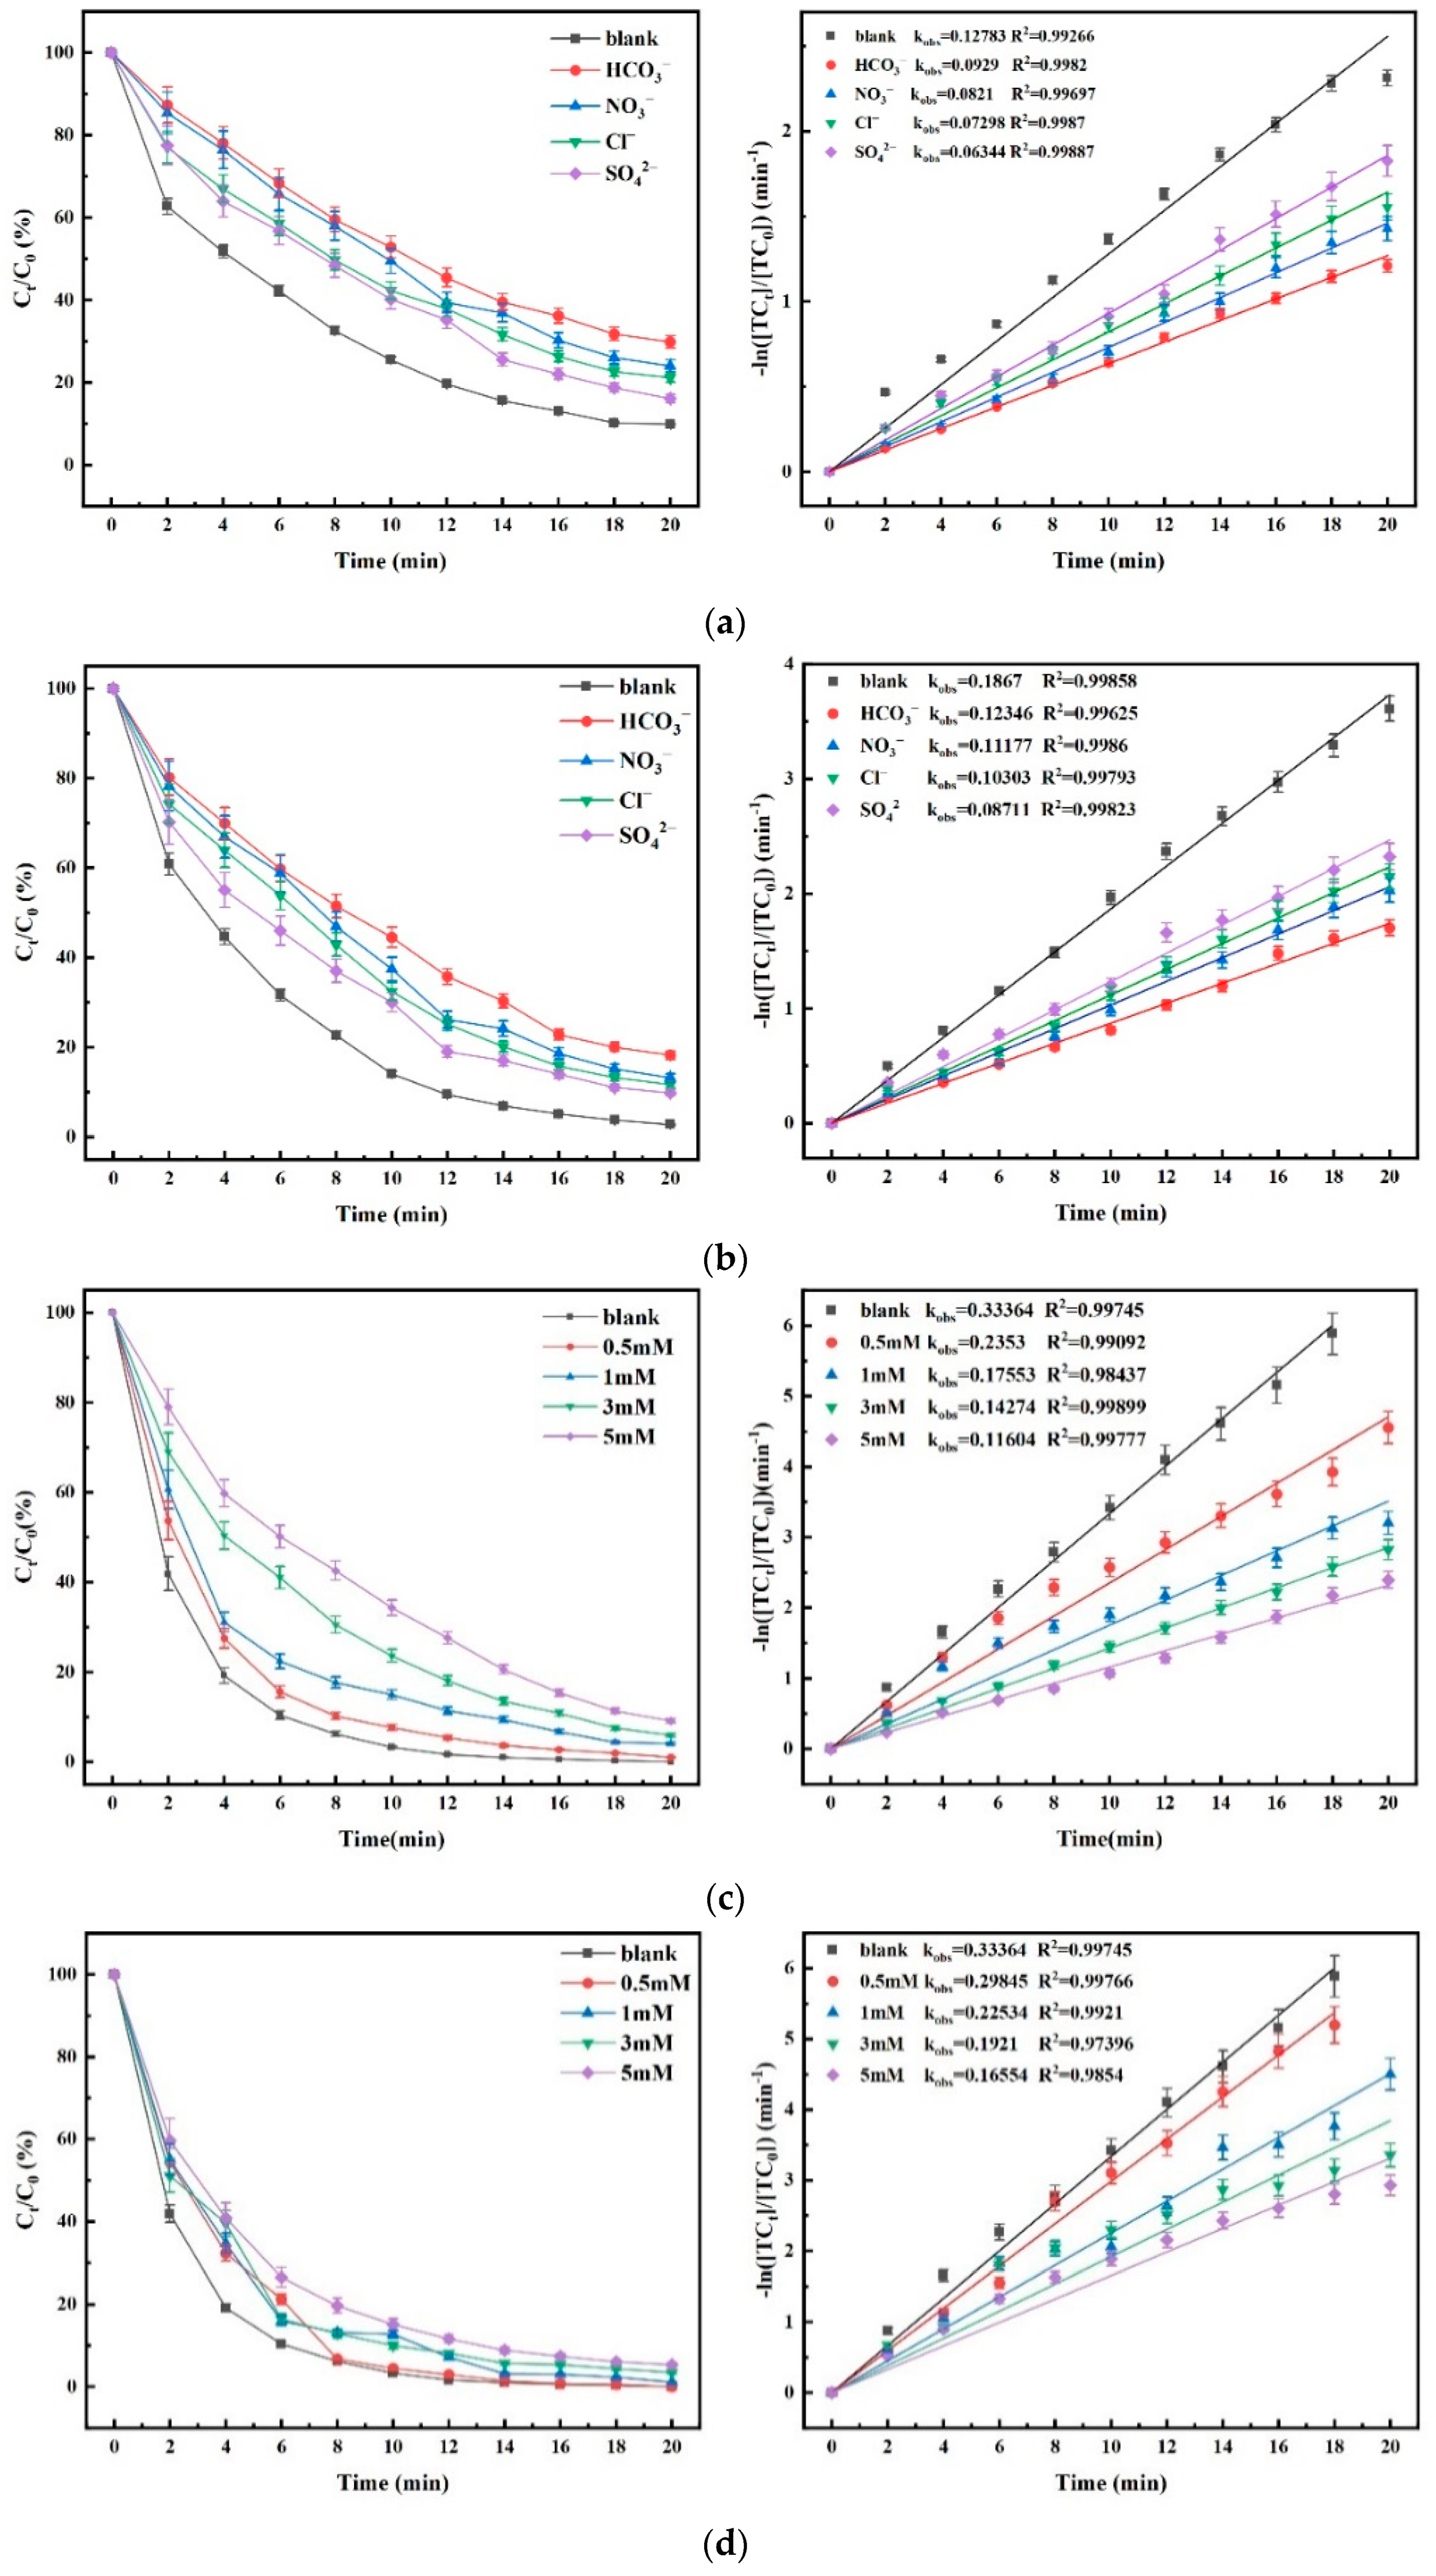
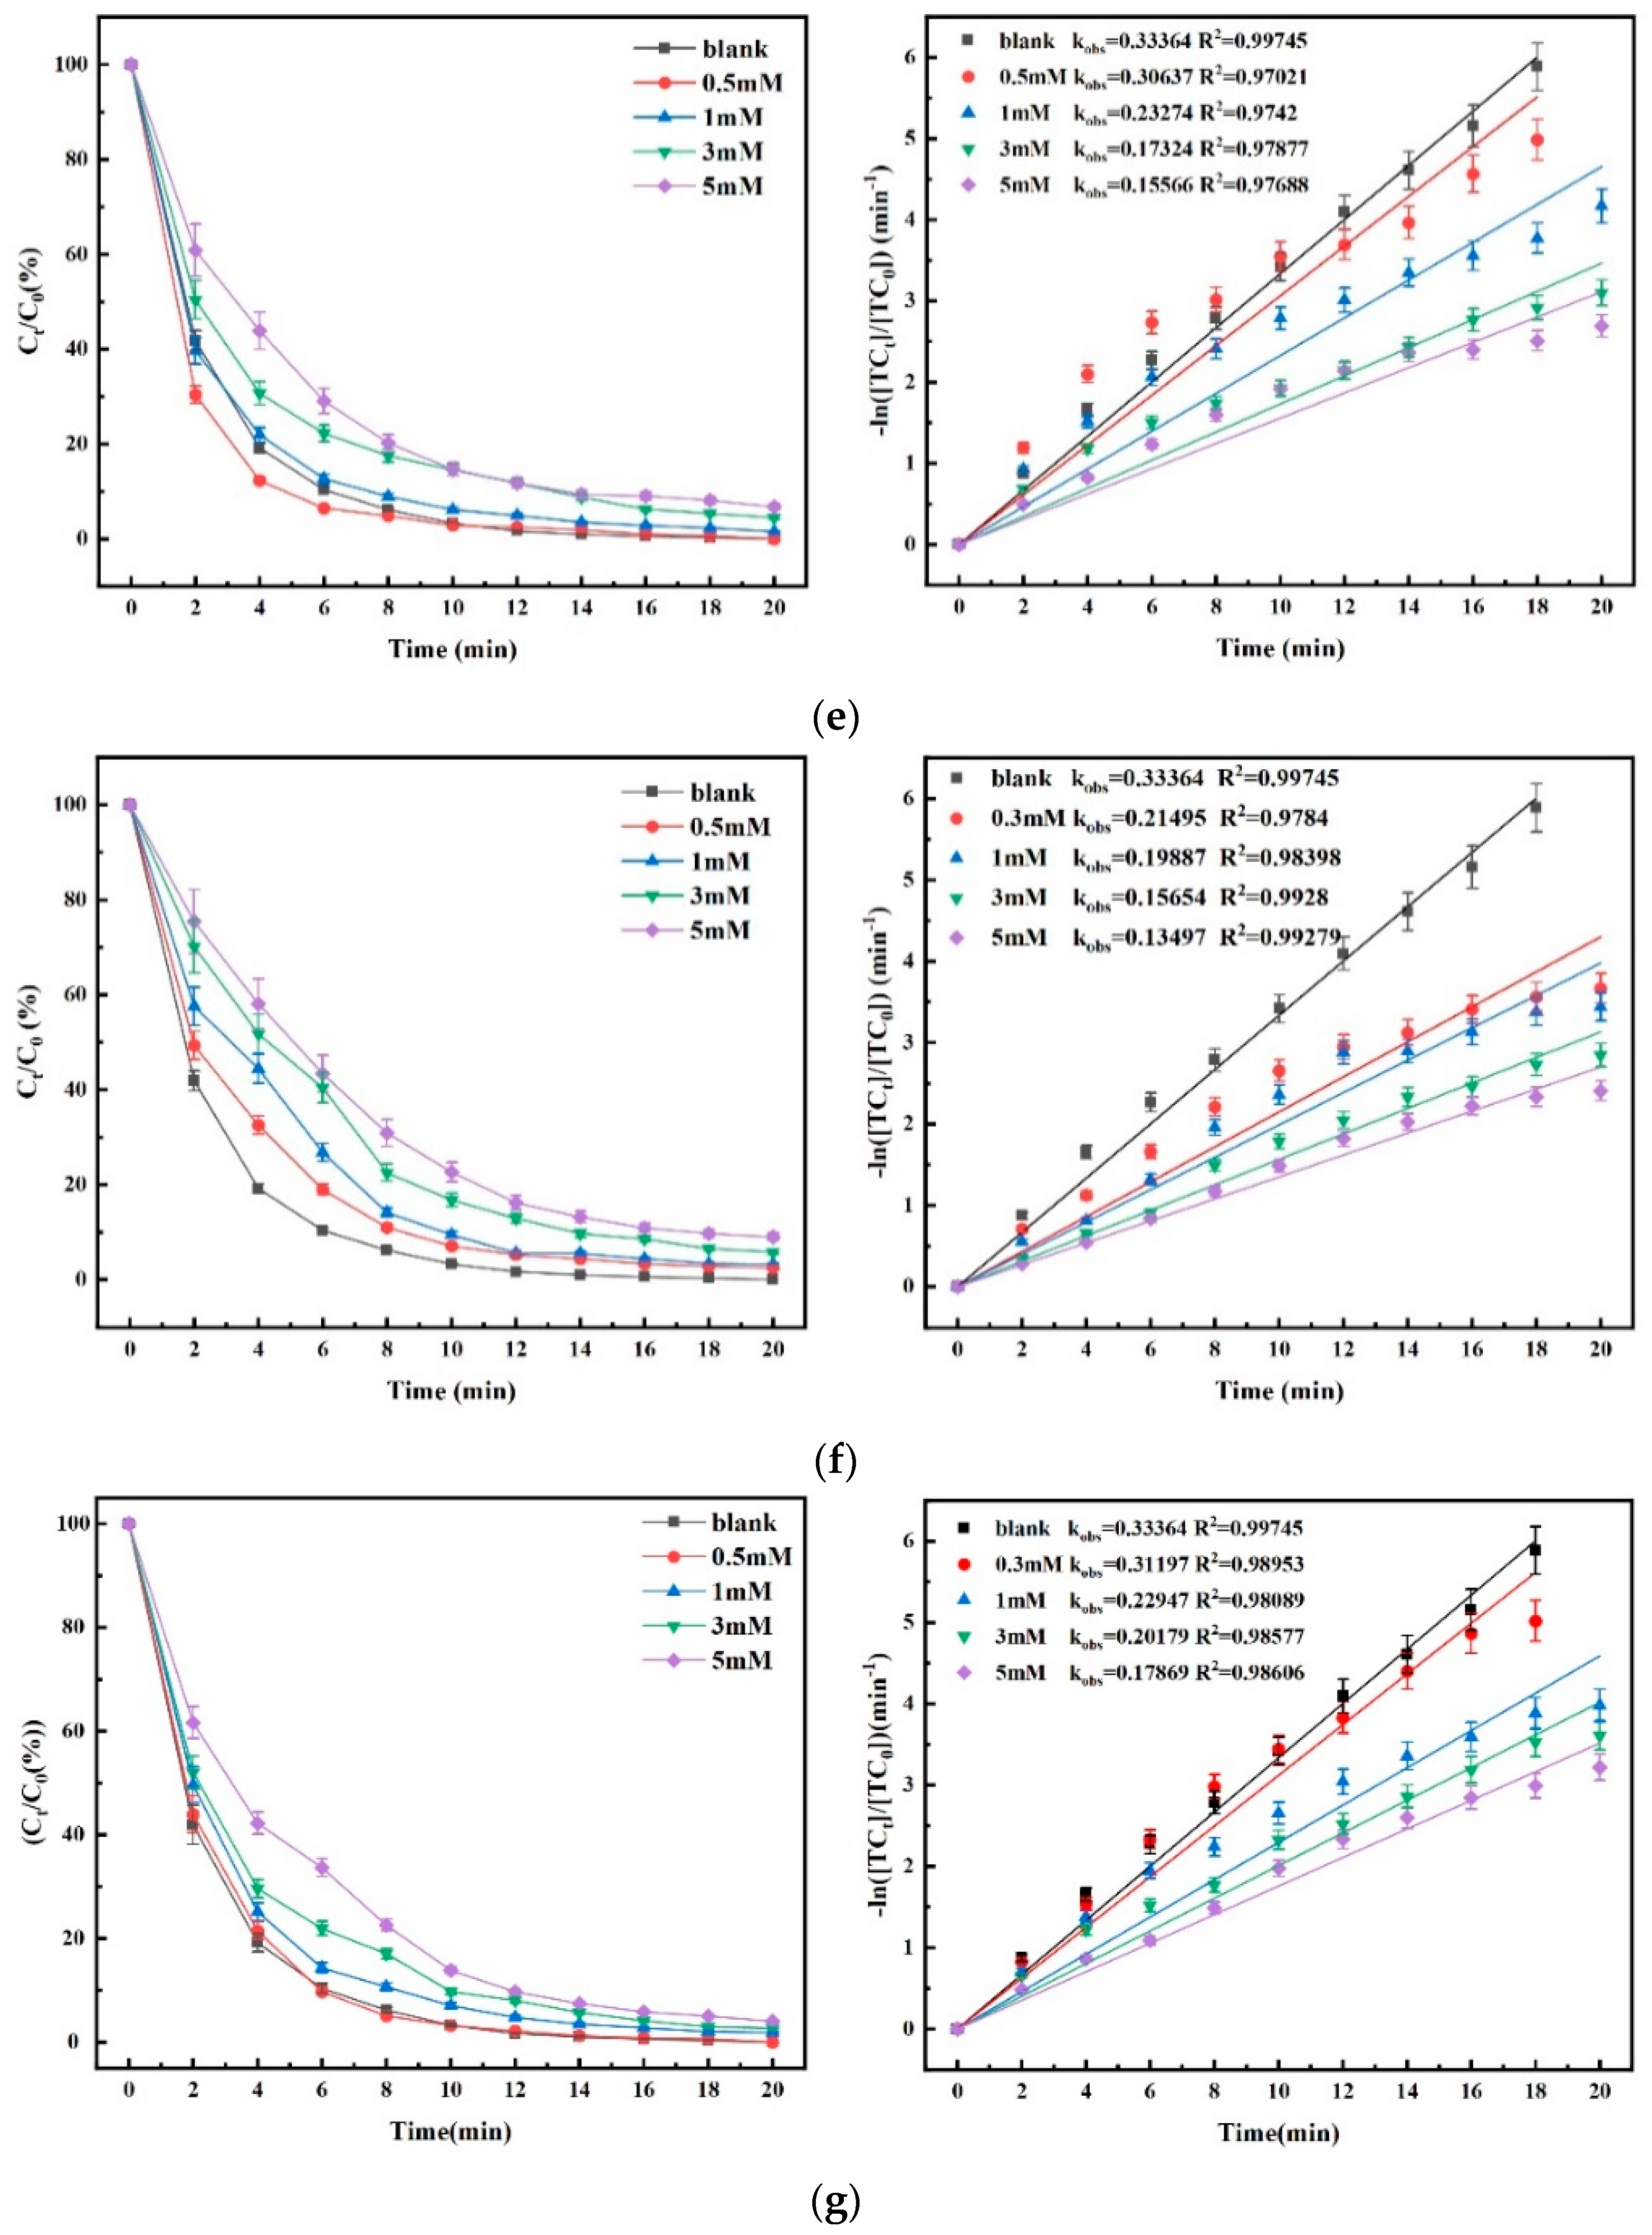
The experiments were carried out under the control of aqueous phase temperature of 25 ± 1 °C, a pH of 6.8 ± 0.1, [PMS]0 = 30 μM, an O3 concentration of 3.6 mg/L, [TC]0 = 0.03 mM, and a FeMoBC material dosage of 200 mg/L. The reaction time was 20 min, and the sampling interval was 2 min. The anions are HCO3, NO3, Cl, SO42−, and humic acid (HA). In order to approximate the actual water anion concentration and to maximally test the anti-interference ability of the O3 and O3/PMS systems, the concentration of each anion was controlled to be 5 mM [32]. The anion concentrations of the O3/PMS/FeMoBC process were controlled to be 0.5 mM, 1 mM, 3 mM, and 5 mM, respectively. The blank group was under the same conditions, except that no anion was injected. The experimental results are shown in Figure 14.
As shown in Figure 14a,b, for different inorganic ions, the O3 and O3/PMS systems showed the same influence trend. Compared with the blank control group, all four inorganic ions brought some negative effects on the oxidative degradation ability of the systems, which were HCO3, NO3, Cl, and SO42− in descending order. The negative effects of the other three inorganic ions decreased to different degrees, except for SO42−, which was not significantly different from that of the single O3 system, indicating that the stability of the O3/PMS process was improved compared with that of the single O3 system. The active oxidants in the O3/PMS system were still dominated by OH, but the SO4•− in this system enhances its anti-interference ability against various inorganic ions. For anions such as HCO3, NO3, and Cl, which are the main interfering agents for OH and O3 molecules, their negative effects on the O3/PMS process decreased.
However, for SO42−, the O3 and O3/PMS systems did not show significant differences, and it was speculated that the self-quenching phenomenon might have occurred after the SO4•− concentration reached a certain level. The most obvious inhibitory effect of HCO3 is due to the fact that HCO3 intervenes to increase the pH of the system, and then the system changes to a weakly alkaline environment. Then the increase in OH concentration leads to the decomposition of more O3 molecules to produce OH. However, HCO3 is a typical inhibitor of OH [33], so the decrease in O3 molecule concentration is accompanied by the depletion of OH, which reduces the overall oxidative capacity of the system [34], leading to a decrease in the TC degradation rate. The entry of NO3 may lead to the generation of various types of NOX (nitrogen oxides) in the system, which depletes part of the O3. Cl and SO42−, on the other hand, may react with OH and O3 molecules to form the free radicals Cl, Cl2•−, and SO4•−, of which Cl and Cl2•− have a selective oxidizing effect on N–H bonds. However, there are only two N–H bonds in the TC, so the excess Cl and Cl2•− are likely to react with OH [35]. Meanwhile, the more stable nature of sulfate leads to the consumption of too much OH and the production of relatively little SO4•−, reducing the system’s overall oxidizing capacity.
As shown in Figure 14c–g. For the O3/PMS/FeMoBC system, except for chloride ion, the other common ions and HA show the trend of more and more obvious negative effects as the concentration goes from higher to lower. For Cl, the kobs value shows a tendency of increasing and then decreasing as the concentration increases. The principle is that when the concentration of Cl is low, the Cl produced in the system selectively breaks the N–H bond. However, when the concentration of chloride ions is increased, the substances in the aqueous phase that can be selectively oxidized by it (the N–H bond) are rapidly consumed. Then the excess Cl competes with the other reactive substances, resulting in a mutual quenching effect [36].
Table 4 shows the possible reaction formulae and reaction rates of common inorganic ions in the system. The results shows that the bursting effect of Cl on OH only works under strong acidity, so Cl only bursts SO4•− in the reaction system under the conditions of this experiment (Equations (13) and (14) does not occur) [37,38,39,40]. NO3 interferes with the degradation efficiency of TC by direct consumption of free radicals [41,42]. However, the inhibition degree of SO42− is higher than that in O3 and O3/PMS, so it is speculated that the self-quenching reaction of SO4•− is stronger than that in the first two processes [43]. All of the above phenomena can indicate the production of new reactive substances or a greater increase in the yield of free radicals in the system.
Table 4. Reaction and reaction rate of common inorganic ions in O3/PMS/FeMoBC process.
No.Equation of a Chemical ReactionReaction Rate (M−1·s−1)Reference
HCO3(6) HCO 3 + OH CO 3 + H 2 O 8.6 × 10⁶[33]
(7) HCO 3 + SO 4 CO 3 + SO 4 2 + H + 3.9 × 10⁸[37]
NO3(8) 2 NO 3 + OH NO 2 + H 2 O None[35]
(9) NO 2 + OH NO 2 + OH None[35]
(10) NO 2 + SO 4 NO 2 + SO 4 2 None[35]
(11) NO 2 + HSO 5 NO 3 + HSO 4 None[36]
(12) NO 2 + O 3 NO 3 + O 2 None[36]
Cl(13) OH + Cl ClOH 4.3 × 10⁹[38]
(14) ClOH OH + Cl 6.1 × 10⁹[38]
(15) SO 4 + Cl SO 4 2 + Cl 3.0 × 10⁸[39]
(16) SO 4 2 + Cl SO 4 + Cl 2.5 × 10⁸[39]
(17) Cl + Cl Cl 2 8.5 × 10⁹[39]
(18) Cl 2 Cl + Cl 6.0 × 10⁴[40]
(19) ClOH + H + Cl + H 2 O 2.1 × 10¹⁰[37]
(20) Cl 2 + OH HOCl + Cl 1.0 × 10⁹[40]
SO42−(21) SO 4 + SO 4 S 2 O 8 2 None[39]
(22) SO 4 + OH H S O 4 + 1 / 2 O 2 None[39]
(23) SO 4 + S 2 O 8 2 S O 4 2 + S 2 O 8 None[39]

5. O3/PMS/FeMoBC Reaction Mechanism Speculation

The above analysis on the degradation efficiency of the O3/PMS/FeMoBC system for TC was similar to the existing experimental studies. For example, the research showed that 95% of orange G could be removed by the FeMoO4/PS system after 40 min. OH and SO4•− existed in the system at the same time, and SO4•− was the main active substance in the oxidation process [44]. In addition, Fe2(MoO4)3 also maintained good catalytic performance for activating persulfate in Fenton reaction system [45,46]. Although OH and SO4•− have been proved to be the main reactive oxygen species (ROS) in iron-based molybdate/PS system, recent reports also showed the potential of coexistence of non-radical mechanisms in an iron-based activated PMS or PS system. For instance, Zhang et al. reported that singlet oxygen (1O2) played a key role in the removal of acetaminophen in the Fe2+/MoS2/PMS system [47]. Yang et al. reported that in an Mn-Fe carbon oxide/PMS system, 1O2 could be used as a secondary driving force to promote the generation of OH and SO4•−, thus accelerating the oxidation process [48]. Although iron molybdate has been reported in the literature, the specific catalytic activation mechanism remains to be discussed, especially the contribution of non-free radicals in an iron-based molybdate/PMS system is not clear. Therefore, the degradation mechanism of TC in O3/PMS/FeMoBC system was speculated by EPR technology and a quenching experiment.

5.1. Free Radical Burst Experiments for O3, O3/PMS, and O3/PMS/FeMoBC

In this study, the types and contribution of active oxidants of these three processes were explored by free radical burst experiments. Tert–butanol (TBA), ethanol (EtOH), L–histidine, and p–benzoquinone (p–BQ) were used for OH, SO4•−, single linear oxygen (1O2), and superoxide radicals (•O2), respectively. Among them, the reaction rate constants of TBA with OH were 3.8–7.6 × 10⁸ M−1s−1 for quenching, and those of EtOH with OH and SO4•− were 1.2–2.8 × 10⁹ M−1s−1 and 1.6~7.7 × 10⁷ M−1s−1, with high kobs values for both OH and SO4•−, which can quench both radicals simultaneously; L–histidine has a reaction rate constant of 3.2 × 10⁸ M−1s−1 with 1O2 [49], and p–BQ has a reaction rate constant of 1.1 × 10⁹ M−1s−1 with •O2 [50], which can be used as quenchers of 1O2 and •O2, respectively.
For the O3/PMS process, on the basis of the quenching of OH by TBA, the quenching experiment of SO4•− by EtOH was added. While for the O3/PMS/FeMoBC process, according to the experimental phenomenon above, it may produce other active substances; so on the basis of using TBA and EtOH, L–histidine and p–BQ were added to identify the presence of 1O2 and •O2, respectively.
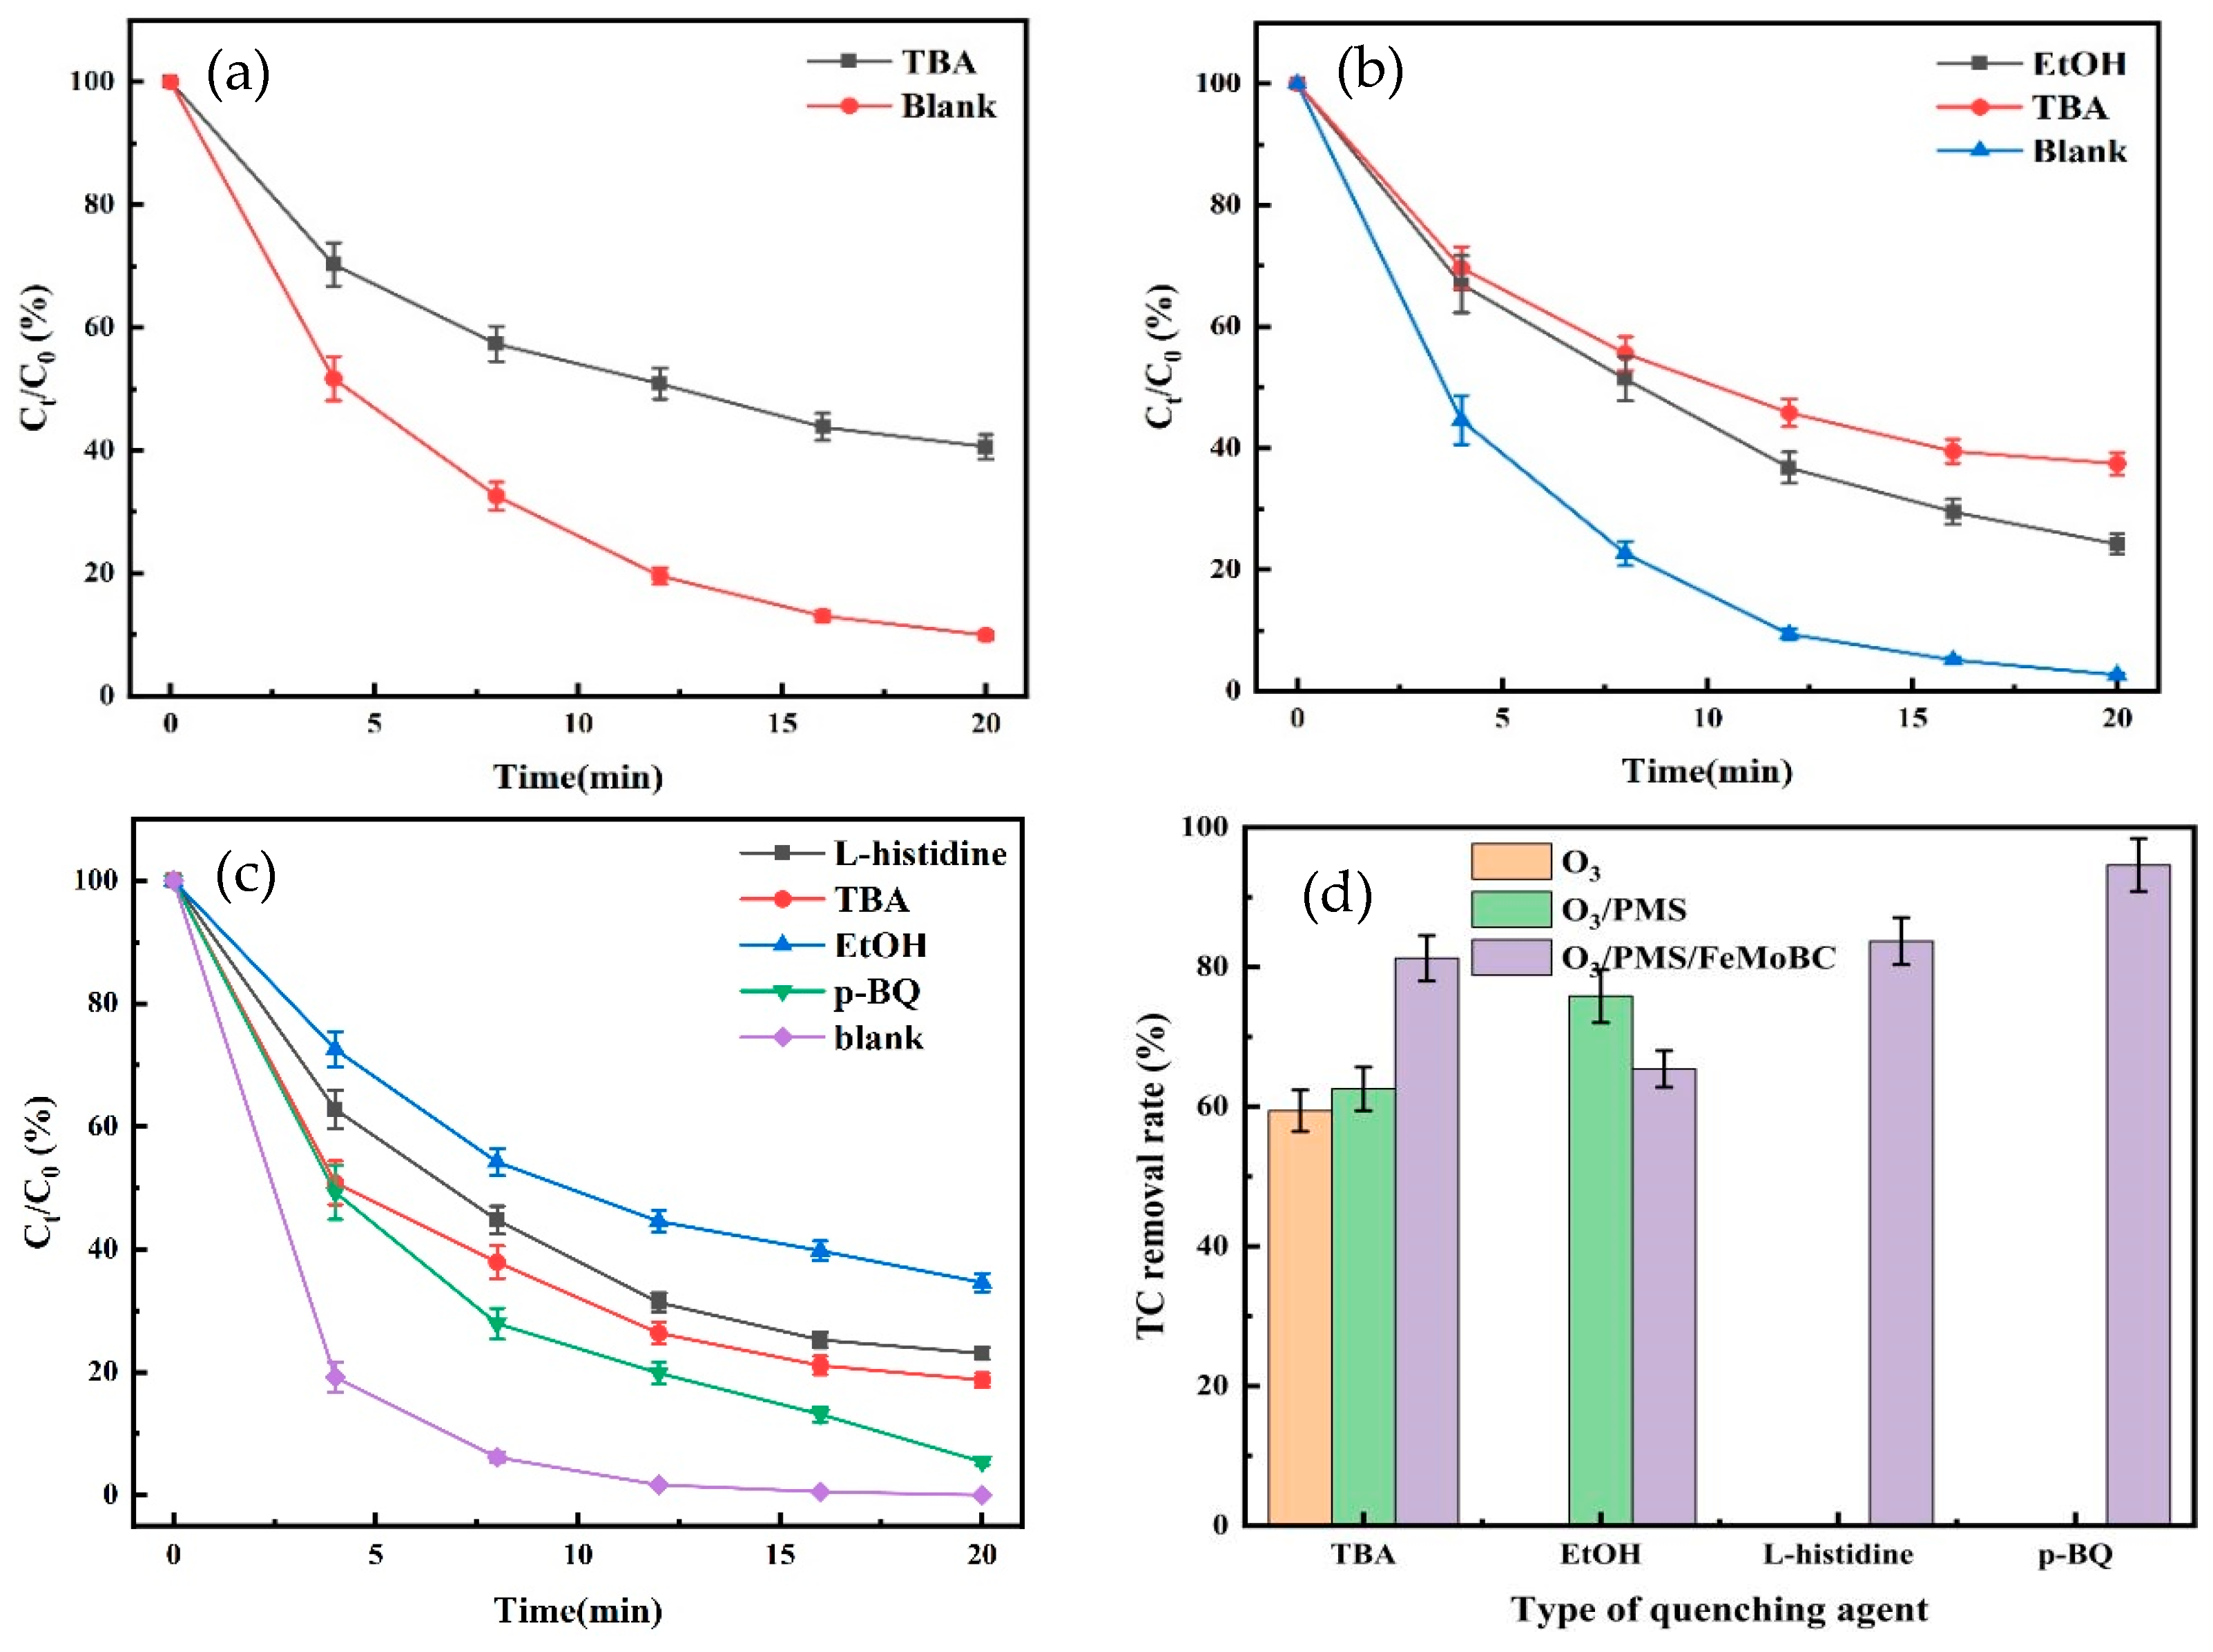
The reaction conditions for the quenching experiments were as follows: reaction temperature of 25 ± 1 °C, gaseous O3 concentration of 3.6 mg/L, initial concentration of TC of 0.03 mM, solution pH of 6.8 ± 0.1, PMS concentration of 30 μM for the O3/PMS and O3/PMS/FeMoBC processes, and a dosage of FeMoBC material of 200 mg/L for the O3/PMS/FeMoBC process. The dosage of all quenching agents was 100 mM. The quenching experiments of O3, O3/PMS, and O3/PMS/FeMoBC processes on various types of radicals were investigated under the above conditions. The experimental results are shown in Figure 15.
Figure 15a shows that the degradation rate of TC by O3 process decreased to 59.4% within 20 min with the input of excess TBA, indicating that OH does not play a major role in the single O3 process, but it is the O3 molecules that play a major role in oxidation. Figure 15b shows that the degradation rate of TC by O3/PMS decreased from 97.3% to 62.5% and 75.8%, respectively, after the addition of TBA and EtOH. The rate constants for the reaction of TBA with OH and SO4•− were 3.8–7.6 × 10⁸ M−1s−1 and 4.0~9.1 × 10⁵ M−1s−1, respectively, and OH was preferentially burst in the presence of OH. At this time, part of the OH in the system was used to convert SO4•−, so the effect of TBA on the OH was lower than that of single O3. However, EtOH had a quenching effect on both OH and SO4•−, so it had a greater effect on the degradation efficiency of the O3/PMS process.
For the O3/PMS/FeMoBC process, the experiments result above showed that it may produce other active substances, so the L–histidine and p–BQ were added to the experiment to identify the possible 1O2 and •O2, respectively. As shown in Figure 15c, the degradation of TC by the O3/PMS/FeMoBC process decreased from 100% to 81.3%, 65.4%, 76.9%, and 94.6%, respectively, after the addition of TBA, EtOH, L–histidine, and p–BQ. Among them, EtOH brought the most negative effect to the O3/PMS/FeMoBC process, indicating that the main active substances in the reaction system were still OH and SO4•−. Meanwhile, L–histidine and p–BQ decreased the TC degradation efficiency by 23.1% and 5.4%, respectively, suggesting that single linear oxygen (1O2) and superoxide radicals (•O2) may have been generated in the O3/PMS/FeMoBC process. To further investigate the presence of 1O2 and •O2 in the system, it is necessary to identify them by EPR detection. Figure 15d shows the TC removal rates of the O3, O3/PMS, and O3/PMS/FeMoBC systems in the presence of each quencher background. In the TBA item, the O3 process was the least affected, followed by O3/PMS, and O3/PMS/FeMoBC was the most affected, which confirms that O3/PMS/FeMoBC has a stronger OH yield. The same trend was shown in the EtOH quenching test, and the quenching experiments of L–histidine and p–BQ indicated the possible presence of 1O2 and •O2 in the O3/PMS/FeMoBC process.

5.2. Analysis of Free Radical Species for TC Degradation by O3/PMS/FeMoBC

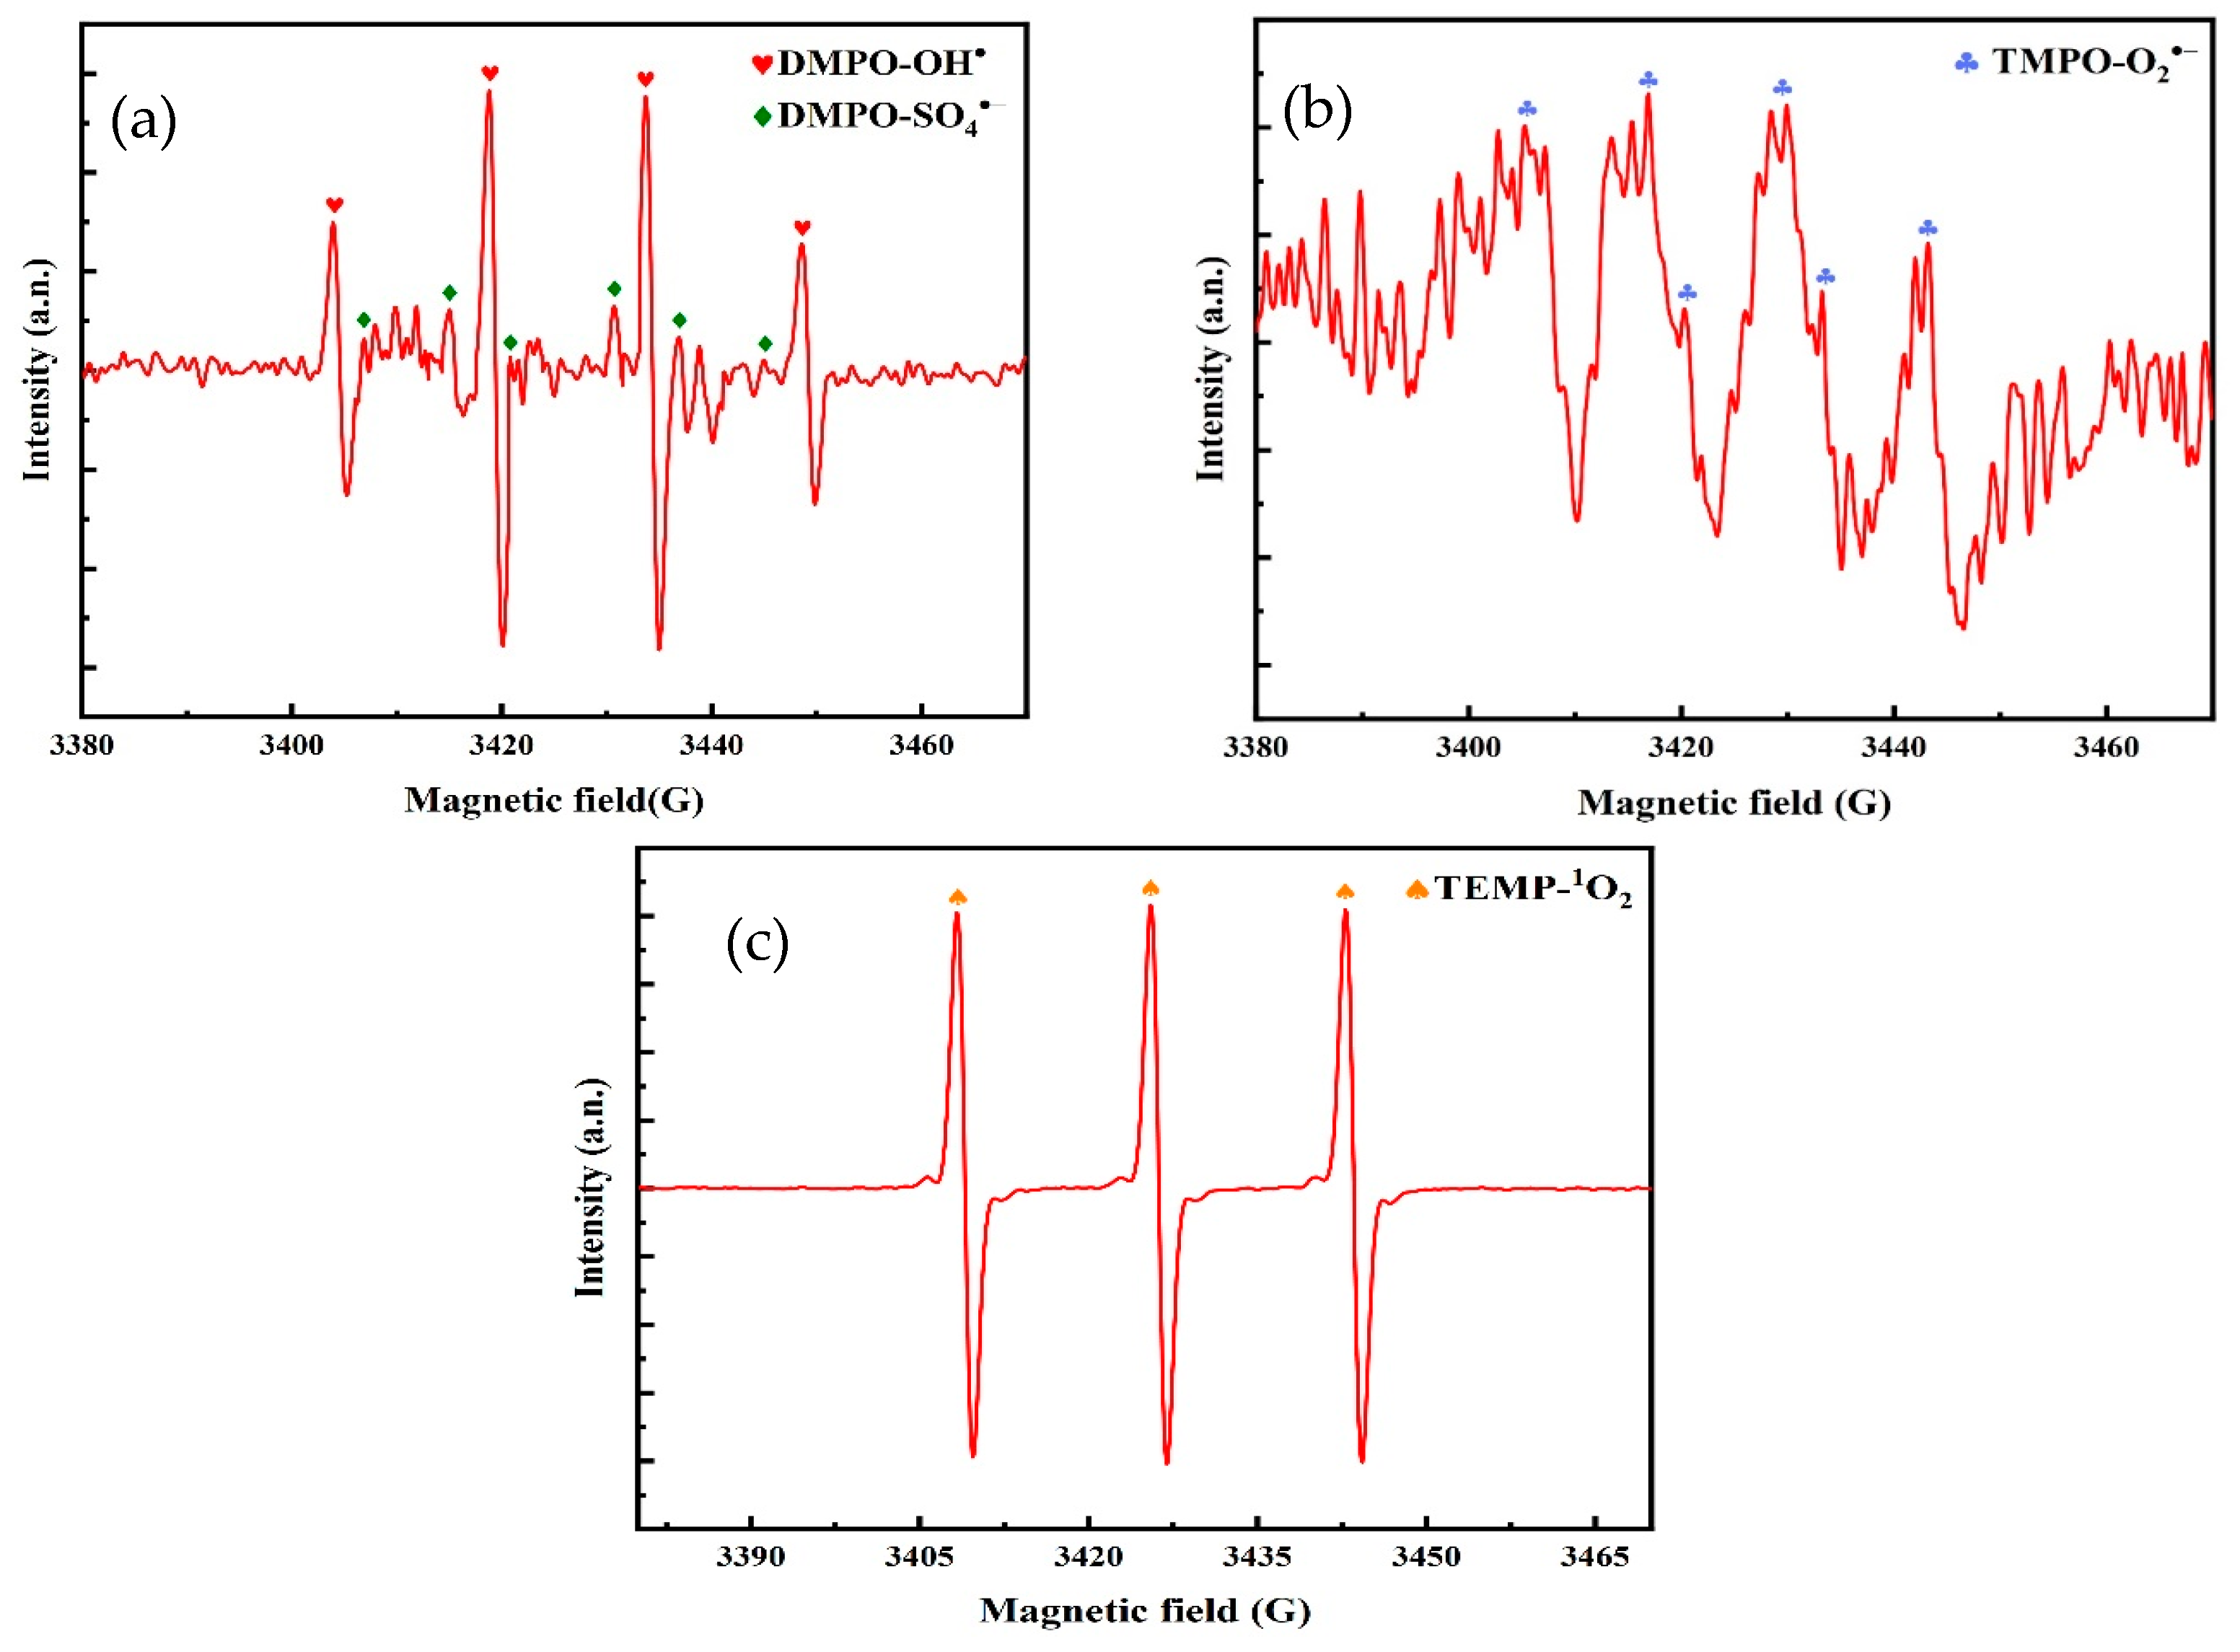
In order to verify the generation of reactive species in the O3/PMS/FeMoBC system, 5,5–dimethyl–1–pyrroline–N–oxide (DMPO) and 2,2,6,6–tetramethylpiperidinium–N–oxide (TEMPO) were employed as spin trapping agents in this study, and these reactive species were characterized by the electron paramagnetic resonance (EPR) technique. DMPO, as a multifunctional trapping agent, was able to react with OH, SO4•−, and •O2 to form characteristic DMPO–OH, DMPO–SO4•−, and DMPO–•O2 adducts, respectively. TEMPO, on the other hand, is specifically designed for the detection of single–linear state oxygen, with which it reacts to form TEMPO–1O2 adducts. In this study, DMPO–•OH and DMPO–SO4•− adducts in the ratio of 1:2:2:1 and 1:1:1:1:1:1:1:1 were observed in the O3/PMS/FeMoBC system by EPR analysis (shown in Figure 16), and this result indicate that the system indeed produces both OH and SO4•− radicals. At the same time, a weak DMPO–•O2 signal (1:1:1:1:1 ratio) and a 1:1:1 ratio TEMPO–1O2 adduct signal were captured. The above conclusions indicate that not only the three free radicals OH, SO4•−, and •O2 but also the non–radical form of 1O2 exists in the O3/PMS/FeMoBC system. This result is in agreement with the data from the free radical burst experiments in the previous section.
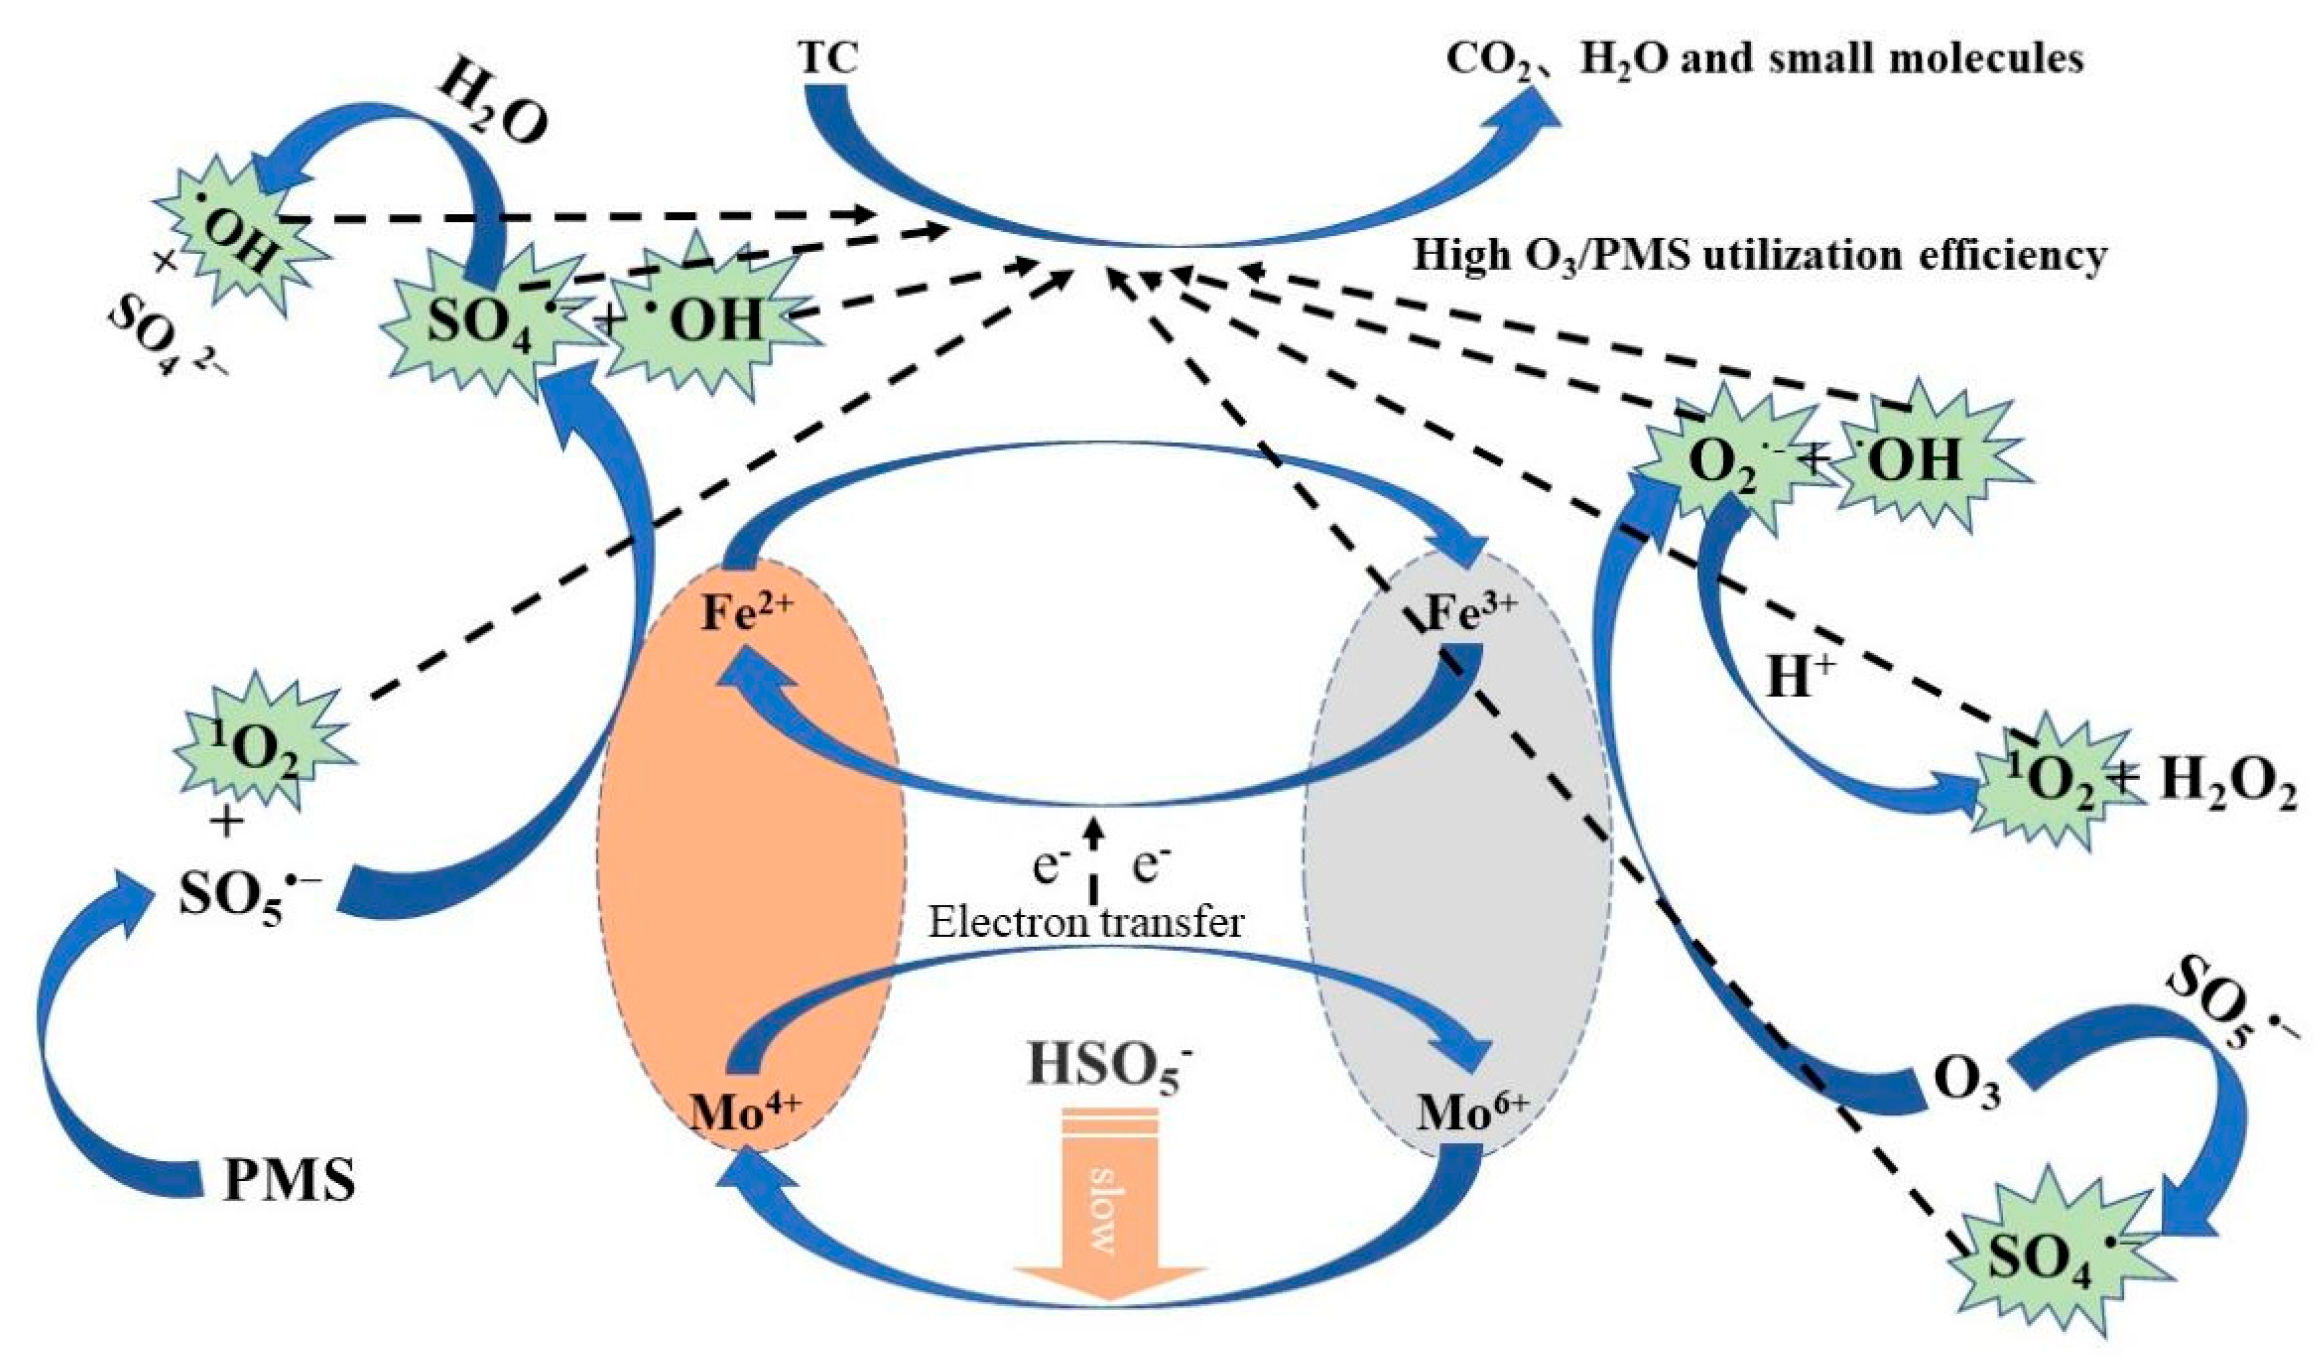
Based on the quenching experiments and EPR radical identification, the reaction mechanism of the O3/PMS/FeMoBC process can be deduced. That is, in the O3/PMS/FeMoBC reaction system, O3 can accept electrons from Fe2+ and in this way generates OH radicals and •O2 radicals (Equations (24)~(26)) [51]. Ferrous ions in solution subsequently react with –•O2 to form H2O2, which reacts with Fe2+ in a Fenton-like reaction to produce more hydroxyl radicals (Equations (27)~(29)) [52]. PMS hydrolyses to HSO5 and SO5 and further produces 1O2 (Equation (30)). Accompanying the gradual progress of the reaction, Mo4+ exposed on the catalyst surface reacts with Fe3+ (Equation (31)), accelerating the regeneration of Fe2+, which in turn undergoes a series of redox reactions with PMS to generate free radicals (Equation (32)) [46]. Meanwhile, HSO5 produced by PMS hydrolysis can undergo reduction reactions with a portion of Fe3+ and Mo6+ (Equations (33) and (34)) [51]. Hydrogen ions in solution can lead to the protonation of Mo6+ to produce Mo (VI) peroxo–complexes MoO (OH)(O2)2 and further production of singlet oxygen (Equations (35) and (36)) [53]. The reactions that may be involved in the O3/PMS system for FeMoBC are shown in Table 5, and the reaction flow diagram is shown in Figure 17.
For bimetallic catalysts dominated by elemental iron, the electronic and geometrical structures differ from those of the corresponding monometallic catalysts. However, the correlation between reactivity and structural factors is still unknown, and some researchers believe [45] that another metallic element acts as an electron donor, and the main reaction is realized by the coupling of iron to the oxidant (Fenton and Fenton-like). However, the doping of the element may bring about new electronic structures and geometrical changes (e.g., oxygen vacancies). In most reactions, bimetallic catalysts exhibit enhanced catalytic performance (higher activity or selectivity) [55]. However, the reason why bimetallic catalysts are able to provide better or different performance than the corresponding monometallic catalysts is still unclear.

6. Conclusions

In this study, compared with O3 and O3/PMS processes, the efficiency, degradation kinetics, and mechanism of O3/PMS/FeMoBC process for removing TC from water were analyzed. The following conclusions are drawn:
(1)
SEM–EDS, FTIR, BET, XRD, XPS, and other analysis results showed that Mo and Fe were stably loaded on the surface and pores of BC during the preparation of iron molybdate composite, forming more oxygen-containing functional groups of Mo and Fe. The main components of the composite catalytic material were Fe2Mo3O8 and FeMoO4, accounting for 26.3% and 73.7%, respectively. In addition, the catalytic reaction was mainly concentrated on the catalyst surface.
(2)
O3, O3/PMS, and O3/PMS/FeMoBC processes all could effectively remove TC from water, among which the O3/PMS/FeMoBC process had the best effect. The results of single factor experiments show that in the O3/PMS/FeMoBC process, the degradation rate of TC decreased with the increase in its initial concentration and increased with the increase in O3 concentration. The best pH condition is weak acidity. Too high of an oxidant concentration would reduce the degradation effect of TC, which was consistent with the trend of the other two methods. However, the O3/PMS/FeMoBC system showed stronger anti-interference ability.
(3)
Quenching experiments were carried out using TBA, EtOH, L–histidine, and p–BQ to quench the free radicals generated in the O3, O3/PMS, and O3/PMS/FeMoBC systems, respectively. The results showed that the O3 molecule played the main oxidizing role in the O3 system alone, and both OH and SO4•− reactive substances were present in the O3/PMS system. For the O3/PMS/FeMoBC system, EtOH had the greatest effect on it, suggesting that OH and SO4•− were the main reactive substances in the system. L–histidine and p–BQ decreased the degradation efficiency during the chemical actions, suggesting that 1O2 and •O2 may be generated in this system. Combined with the above free radical quenching experiments and the analysis results of EPR technique, it could be concluded that four active oxidants, OH, SO4•−, 1O2, and •O2, were present in the O3/PMS/FeMoBC system, and their contributions were, in descending order, OH, 1O2, SO4•−, and •O2.

Author Contributions

Conceptualization, X.L.; methodology, B.Y.; software, B.Y.; validation, Q.L.; formal analysis, X.C.; investigation, Q.L.; resources, H.D.; data curation, H.D.; writing—original draft preparation, X.L.; writing—review and editing, X.C. and S.L.; visualization, X.C.; supervision, H.L.; project administration, H.L.; funding acquisition, H.L. All authors have read and agreed to the published version of the manuscript.

Funding

This work was supported by the National Natural Science Foundation of China (No. 52070087) and the Education Department of Jilin Province (No. JJKH20250991KJ).

Data Availability Statement

Data are contained within the article.

Conflicts of Interest

Author Qingpo Li was employed by the company Jinjiang Industrial Group. The remaining authors declare that the research was conducted in the absence of any commercial or financial relationships that could be construed as potential conflicts of interest.

References

  1. Morin–Crini, N.; Lichtfouse, E.; Liu, G.; Balaram, V.; Ribeiro, A.R.L.; Lu, Z.; Stock, F.; Carmona, E.; Teixeira, M.R.; Picos-Corrales, L.A. Worldwide cases of water pollution by emerging contaminants: A review. Environ. Chem. Lett. 2022, 20, 2311–2338. [Google Scholar] [CrossRef]
  2. Hussain, I.; Zhang, Y.; Huang, S.; Du, X. Degradation of p-chloroaniline by persulfate activated with zero-valent iron. Chem. Eng. J. 2012, 203, 269–276. [Google Scholar] [CrossRef]
  3. Lai, C.; Huang, F.; Zeng, G.; Huang, D.; Qin, L.; Cheng, M.; Zhang, C.; Li, B.; Yi, H.; Liu, S. Fabrication of novel magnetic MnFe2O4/bio–char composite and heterogeneous photo–Fenton degradation of tetracycline in near neutral pH. Chemosphere 2019, 224, 910–921. [Google Scholar] [CrossRef] [PubMed]
  4. Hoigne, J.; Bader, H. Rate constants of reactions of ozone with organic and inorganic compounds in water. Water Res. 1983, 17, 173–183. [Google Scholar] [CrossRef]
  5. Anipsitakis, G.P.; Dionysiou, D.D. Radical generation by the interaction of transition metals with common oxidants. Environ. Sci. Technol. 2004, 38, 3705–3712. [Google Scholar] [CrossRef] [PubMed]
  6. Ge, D.; Zeng, Z.; Arowo, M.; Zou, H.; Chen, J.; Shao, L. Degradation of methyl orange by ozone in the presence of ferrous and persulfate ions in a rotating packed bed. Chemosphere 2016, 146, 413–418. [Google Scholar] [CrossRef] [PubMed]
  7. Yang, Y.; Jiang, J.; Lu, X.; Ma, J.; Liu, Y. Production of Sulfate Radical and Hydroxyl Radical by Reaction of Ozone with Peroxymonosulfate: A Novel Advanced Oxidation Process. Environ. Sci. Technol. 2015, 49, 7330–7339. [Google Scholar] [CrossRef] [PubMed]
  8. Peyton, G.R. The free–radical chemistry of persulfate–based total organic carbon analyzers. Mar. Chem. 1993, 41, 91–103. [Google Scholar] [CrossRef]
  9. Du, W.; Liu, L.; Zhou, K.; Ma, X.; Hao, Y.; Qian, X. Black lead molybdate nanoparticles: Facile synthesis and photocatalytic properties responding to visible light. Appl. Surf. Sci. 2015, 328, 428–435. [Google Scholar] [CrossRef]
  10. Cleophas, T.J.M. An Alternative Analysis for Crossover Studies that Accounts for Between-Group Disparities in Drug Response. Clin. Chem. Lab. Med. 1998, 36, 981–982. [Google Scholar] [CrossRef] [PubMed]
  11. Jia, J.; Guo, X.; Zhang, T.; Zha, F. Design of micro-nano spherical β-NiOOH/FeMo04 composite with enhanced photo-Fenton performance. Appl. Catal. A Gen. 2022, 630, 118427. [Google Scholar] [CrossRef]
  12. GB-28232-2020; Hygienic Requirements for Ozone Disinfector. Standards Press of China: Beijing, China, 2020.
  13. Wei, J.; Liu, Y.; Li, J.; Zhu, Y.; Yu, H.; Zhen, Y. Adsorption and co-adsorption of tetracycline and doxycycline by one-step synthesized iron loaded sludge biochar. Chemosphere 2019, 236, 124254. [Google Scholar] [CrossRef] [PubMed]
  14. Chen, Y.; Yang, G. Study on the degradation of N-methylpyrrolidone by iron–molybdenum modified biochar activated persulfuric acid. Appl. Chem. Ind. 2024, 53, 40–44. [Google Scholar]
  15. Khan, Z.H.; Gao, M.; Wu, J.; Bin, R.; Mehmood, C.T.; Song, Z. Mechanism of As(III) removal properties of biochar-supported molybdenum-disulfide/iron-oxide system. Environ. Pollut. 2021, 287, 117600. [Google Scholar] [CrossRef] [PubMed]
  16. Hwang, Y.K.; Hong, D.Y.; Chang, J.S.; Jhung, S.H.; Seo, Y.K.; Kim, J.; Vimont, A.; Daturi, M.; Sere, C.; Ferey, G. Amine Grafting on Coordinatively Unsaturated Metal Centers of MOFs: Consequences for Catalysis and Metal Encapsulation. Angew. Chem. 2008, 120, 4212–4216. [Google Scholar] [CrossRef]
  17. Ahmad, S.; Liu, L.; Zhang, S.; Tang, J. Nitrogen–doped biochar (N-doped BC) and iron/nitrogen co–doped biochar (Fe/N co-doped BC) for removal of refractory organic pollutants. J. Hazard. Mater. 2023, 446, 130727. [Google Scholar] [CrossRef] [PubMed]
  18. Xiao, L.; Qin, Y.; Jia, Y.; Li, Y.; Zhao, Y.; Pan, Y.; Sun, J. Preparation and application of Fe/biochar (Fe-BC) catalysts in wastewater treatment: A review. Chemosphere 2021, 274, 129766. [Google Scholar]
  19. Manna, I.; Dutta Majumdar, J.; Ramesh, C.B.; Nayak, S.; Dahotre, N.B. Laser surface cladding of Fe-B-C, Fe-B-Si and Fe-BC-Si-Al-C on plain carbon steel. Surf. Coat. Tech. 2006, 201, 434–440. [Google Scholar] [CrossRef]
  20. Han, X.; Gerke, C.S.; Banerjee, S.; Zubair, M.; Jiang, J.; Bedford, N.M.; Miller, E.M.; Thoi, V.S. Strategic Design of MoO2 Nanoparticles Supported by Carbon Nanowires for Enhanced Electrocatalytic Nitrogen Reduction. ACS Energy Lett. 2020, 5, 3237–3243. [Google Scholar] [CrossRef]
  21. Fan, X.; Wu, Y.; Sun, Y.; Tu, R.; Ren, Z.; Liang, K.; Jiang, E.; Ren, Y.; Xu, X. Functional groups anchoring–induced Ni/MoOx-Ov interface on rice husk char for hydrodeoxygenation of bio-guaiacol to BTX at ambient-pressure. Renew. Energy 2022, 200, 579–591. [Google Scholar] [CrossRef]
  22. Yin, Q.; Yang, H.; Liang, Y.; Jiang, Z.; Wang, H.; Nian, Y. Activation of persulfate by blue algae biochar supported FeOX particles for tetracycline degradation: Performance and mechanism. Sep. Purif. Technol. 2023, 319, 124005. [Google Scholar] [CrossRef]
  23. Zhang, N.; Li, M.; Liu, X. Distribution and migration of antibiotic resistance genes in soil. China Environ. Sci. 2018, 38, 2609–2617. [Google Scholar]
  24. Yuan, Z.; Sui, M.; Yuan, B.; Li, P.; Wang, J.; Qin, J.; Xu, G. Degradation of ibuprofen using ozone combined with peroxymonosulfate. Environ. Sci.: Water Res. Technol. 2017, 3, 960–969. [Google Scholar] [CrossRef]
  25. Neta, P.; Huie, R.E.; Ross, A.B. Rate Constants for Reactions of Inorganic Radicals in Aqueous Solution. J. Phys. Chem. Ref. Data 1988, 17, 1027–1284. [Google Scholar] [CrossRef]
  26. Li, S.; Huang, J.; Li, X.; Li, L. The relation of interface electron transfer and PMS activation by the H-bonding interaction between composite metal and MCM-48 during sulfamethazine ozonation. Chem. Eng. J. 2020, 398, 125529. [Google Scholar] [CrossRef]
  27. Mao, Y.; Dong, H.; Liu, S.; Zhang, L.; Qiang, Z. Accelerated oxidation of iopamidol by ozone/peroxymonosulfate (O3/PMS) process: Kinetics, mechanism, and simultaneous reduction of iodinated disinfection by–product formation potential. Water Res. 2020, 173, 115615. [Google Scholar] [CrossRef] [PubMed]
  28. Yan, B.; Li, Q.; Chen, X.; Deng, H.; Feng, W.; Lu, H. Application of O3/PMS Advanced Oxidation Technology in the Treatment of Organic Pollutants in Highly Concentrated Organic Wastewater: A Review. Separations 2022, 9, 444. [Google Scholar] [CrossRef]
  29. Yang, N.; Cui, J.; Zhang, L.; Xiao, W.; Alshawabkeh, A.N.; Mao, X. Iron electrolysis-assisted peroxymonosulfate chemical oxidation for the remediation of chlorophenol-contaminated groundwater. J. Chem. Technol. Biotechnol. 2016, 91, 938–947. [Google Scholar] [CrossRef] [PubMed]
  30. Deniere, E.; Hulle, S.V.; Langenhove, H.V.; Demeestere, K. Advanced oxidation of pharmaceuticals by the ozone-activated peroxymonosulfate process: The role of different oxidative species. J. Hazard. Mater. 2018, 360, 204–213. [Google Scholar] [CrossRef] [PubMed]
  31. Chen, Q.; Ji, F.; Liu, T.; Yan, P.; Guan, W.; Xu, X. Synergistic effect of bifunctional Co-TiO2 catalyst on degradation of Rhodamine B: Fenton-photo hybrid process. Chem. Eng. J. 2013, 229, 57–65. [Google Scholar] [CrossRef]
  32. Wang, J.L.; Wang, S.Z. Effect of inorganic anions on the performance of advanced oxidation processes for degradation of organic contaminants. Chem. Eng. J. 2021, 411, 128392. [Google Scholar] [CrossRef]
  33. Liao, C.H.; Kang, S.F.; Wu, F.A. Hydroxyl radical scavenging role of chloride and bicarbonate ions in the H2O2/UV process. Chemosphere 2001, 44, 1193–1200. [Google Scholar] [CrossRef] [PubMed]
  34. Lutze, H.V.; Kerlin, N.; Schmidt, T.C. Sulfate radical–based water treatment in presence of chloride: Formation of chlorate, inter–conversion of sulfate radicals into hydroxyl radicals and influence of bicarbonate. Water Res. 2015, 72, 349–360. [Google Scholar] [CrossRef] [PubMed]
  35. Lei, Y.; Lei, X.; Westerhoff, P.; Zhang, X.; Yang, X. Reactivity of Chlorine Radicals (Cl and Cl2•−) with Dissolved Organic Matter and the Formation of Chlorinated Byproducts. Environ. Sci. Technol. 2021, 55, 689–699. [Google Scholar] [CrossRef] [PubMed]
  36. Shields, B.J.; Doyle, A.G. Direct C(sp3)-H Cross Coupling Enabled by Catalytic Generation of Chlorine Radicals. J. Am. Chem. Soc. 2016, 138, 12719–12722. [Google Scholar] [CrossRef] [PubMed]
  37. Huie, R.E.; Clifton, C.L. Temperature dependence of the rate constants for reactions of the sulfate radical, SO4, with anions. J. Am. Chem. Soc. 1990, 94, 8561–8567. [Google Scholar] [CrossRef]
  38. Jayson, G.G.; Parsons, B.J.; Swallow, A.J. Some simple, highly reactive, inorganic chlorine derivatives in aqueous solution. Their formation using pulses of radiation and their role in the mechanism of the Fricke dosimeter. J. Chem. Soc. Faraday Trans. 1 Phys. Chem. Condens. Phases 1973, 69, 1597–1607. [Google Scholar] [CrossRef]
  39. DAS, T.N. Reactivity and Role of SO5•− Radical in Aqueous Medium Chain Oxidation of Sulfite to Sulfate and Atmospheric Sulfuric Acid Generation. J. Phys. Chem. A. 2001, 105, 9142–9155. [Google Scholar] [CrossRef]
  40. Yu, X.Y.; Barker, J.R. Hydrogen Peroxide Photolysis in Acidic Aqueous Solutions Containing Chloride Ions I. Chemical Mechanism. J. Phys. Chem. A 2003, 107, 1313–1324. [Google Scholar] [CrossRef]
  41. Jaafarzaden, N.; Ghanbari, F.; Ahmadi, M. Efficient degradation of 2,4-dichlorophenoxyacetic acid by peroxymonosulfate/magnetic copper ferrite nanoparticles/ozone: A novel combination of advanced oxidation processes. Chem. Eng. J. 2017, 320, 436–447. [Google Scholar] [CrossRef]
  42. Naumov, S.; Mark, G.; Jarocki, A.; Sonntag, C.V. The Reactions of Nitrite Ion with Ozone in Aqueous Solution—New Experimental Data and Quantum-Chemical Considerations. Ozone: Sci. Eng. 2010, 32, 430–434. [Google Scholar] [CrossRef]
  43. Wu, D.; Wong, D.; Di Bartolo, B. Evolution of Cl2 in aqueous NaCl solutions. J. Photochem. 1980, 14, 303–310. [Google Scholar] [CrossRef]
  44. Lin, X.; Ma, Y.; Wan, J.; Wang, Y.; Li, Y. Efficient degradation of Orange G with persulfate activated by recyclable FeMoO4. Chemosphere 2019, 214, 642–650. [Google Scholar] [CrossRef] [PubMed]
  45. Tian, S.H.; Tu, Y.T.; Chen, D.S.; Chen, X.; Xiong, Y. Degradation of Acid Orange II at neutral pH using Fe2(MoO4)3 as a heterogeneous Fenton-like catalyst. Chem. Eng. J. 2011, 169, 31–37. [Google Scholar] [CrossRef]
  46. Lu, Y.S.; Wang, Z.; Xu, Y.F.; Liu, Q.; Qian, G.R. Fe2(MoO4)3 as a novel heterogeneous catalyst to activate persulfate for Rhodamine B degradation. Desalin. Water Treat. 2015, 57, 7898–7909. [Google Scholar] [CrossRef]
  47. Zhang, Y.; Niu, J.; Xu, J. Fe (II)-promoted activation of peroxymonosulfate bymolybdenum disulfide for effective degradation of acetaminophen. Chem. Eng. J. 2020, 381, 122718. [Google Scholar] [CrossRef]
  48. Yang, J.C.E.; Lin, Y.; Peng, H.H.; Yuan, B.; Dionysiou, D.D.; Huang, X.D.; Zhang, D.D.; Fu, M.L. Novel magnetic rod-like n-Fe oxycarbide toward peroxymonosulfate activation for efficient oxidation of butyl paraben: Radical oxidation versus singlet oxygenation. Appl. Catal. B–Environ. Energy 2020, 268, 118549. [Google Scholar] [CrossRef]
  49. Wei, C.; Song, B.; Yuan, J.; Feng, Z.; Jia, G.; Li, C. Luminescence and Raman spectroscopic studies on the damage of tryptophan, histidine and carnosine by singlet oxygen. J. Photochem. Photobiol. A Chem. 2007, 189, 39–45. [Google Scholar] [CrossRef]
  50. Zhu, M.; Lu, J.; Hu, Y.; Liu, Y.; Hu, S.; Zhu, C. Photochemical reactions between 1,4–benzoquinone and O2•−. Environ. Sci. Pollut. Res. 2020, 27, 31289–31299. [Google Scholar] [CrossRef] [PubMed]
  51. Wang, H.; Xiao, W.; Zhang, C.; Sun, Y.; Wang, Y.; Gong, Z.; Zhan, M.; Fu, Y.; Liu, K. Effective removal of refractory organic contaminants from reverse osmosis concentrated leachate using PFS–nZVI/PMS/O3 process. Waste Manag. 2021, 128, 55–63. [Google Scholar] [CrossRef] [PubMed]
  52. Xie, X.; Cao, J.; Xiang, Y.; Xie, R.; Suo, Z.; Ao, Z.; Yang, X.; Huang, H. Accelerated iron cycle inducing molecular oxygen activation for deep oxidation of aromatic VOCs in MoS2 co-catalytic Fe3+/PMS system. Appl. Catal. B Environ. 2022, 309, 121235. [Google Scholar] [CrossRef]
  53. Yu, X.; Wang, Y.; Long, X.; Song, J.; Chen, Y.; Zhang, I.Y.; Wang, A.; Huang, R. Effective degradation of recalcitrant naphthenic acids by the Fe(III)/peroxymonosulfate oxidation enhanced by molybdenum disulfide: Degradation performance and mechanisms. J. Environ. Chem. Eng. 2024, 12, 112842. [Google Scholar] [CrossRef]
  54. Fu, W.; Yi, J.; Cheng, M.; Liu, Y.; Zhang, G.; Li, L.; Du, L.; Li, B.; Wang, G.; Yang, X. When bimetallic oxides and their complexes meet Fenton-like process. J. Hazard. Mater. 2022, 424, 127419. [Google Scholar] [CrossRef] [PubMed]
  55. Liu, L.; Corma, A. Bimetallic Sites for Catalysis: From Binuclear Metal Sites to Bimetallic Nanoclusters and Nanoparticles. Chem. Rev. 2023, 123, 4855–4933. [Google Scholar] [CrossRef] [PubMed]
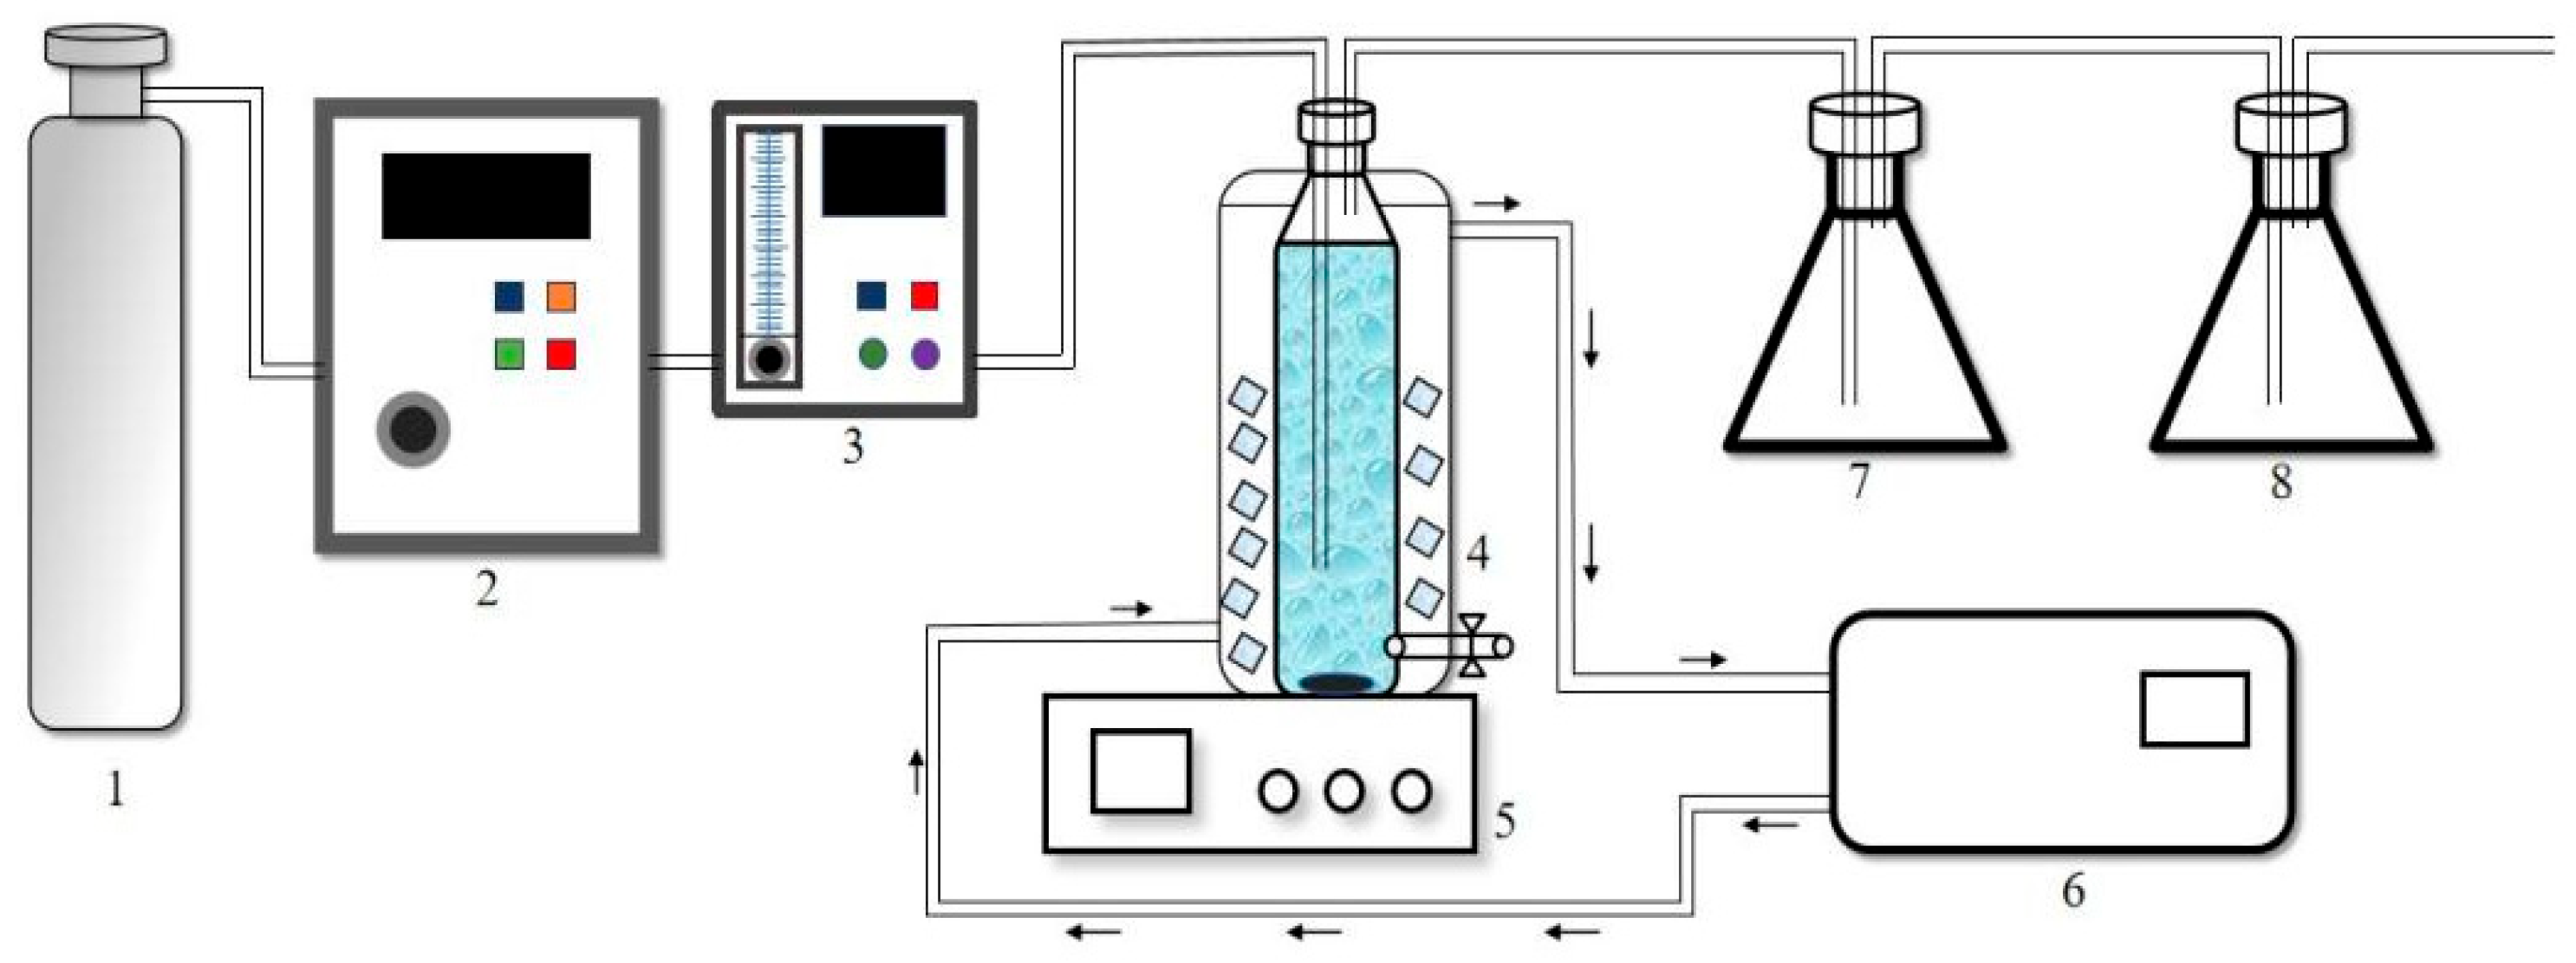
Figure 1. Reaction device diagram. (1)—O3 bottle; (2)—Ozonalor; (3)—rotameter, (4)—O3 water tank; (5)—magnetic stirrer; (6)—constant temperature system; (7)—Kl tail gas absorber; (8)—KI tail gas absorber.
Nanomaterials 15 01108 g001
Figure 2. The SEM images at different multiples and scales. BC samples (ac); FeBC sample (df); MoBC samples (gi); FeMoBC (new) sample (jl); FeMoBC (used) sample (mo).
Nanomaterials 15 01108 g002aNanomaterials 15 01108 g002b
Figure 3. EDS spectra of FeMoBC.
Nanomaterials 15 01108 g003
Figure 4. FTIR spectra of BC, FeBC, MoBC, FeMoBC (new), and FeMoBC (used) materials.
Nanomaterials 15 01108 g004
Figure 5. N2 adsorption–desorption isotherm diagram of BC, FeBC, MoBC, FeMoBC (new), and FeMoBC (used) materials.
Nanomaterials 15 01108 g005
Figure 6. XRD spectra of BC, FeMoBC (new), and FeMoBC (used) materials.
Nanomaterials 15 01108 g006
Figure 7. XPS of FeMoBC (new) and FeMoBC (used). (a) Full spectrum; (b) FeMoBC (new) C1s; (c) FeMoBC (used) C1s; (d) FeMoBC (new) Fe 2p; (e) FeMoBC (used) Fe 2p; (f) FeMoBC (new) Mo 3d; (g) FeMoBC (used) Mo 3d.
Nanomaterials 15 01108 g007aNanomaterials 15 01108 g007b
Figure 8. Adsorption properties of different materials for tetracycline.
Nanomaterials 15 01108 g008
Figure 9. Effect of gaseous O3 concentration on degradation of TC and kinetic fitting. (a) O3 process; (b) O3/PMS process; (c) O3/PMS/FeMoBC process. Aqueous phase temperature: 25 ± 1 °C, FeMoBC material dosage: 200 mg/L, [TC]0 = 30 μM, [PMS]0 = 30 μM, pH = 6.8 ± 0.1, Gaseous O3 concentration: 1.2 mg/L, 2.4 mg/L, 3.6 mg/L, 4.8 mg/L, 6 mg/L, and Air.
Nanomaterials 15 01108 g009
Figure 10. Effect of initial TC concentration on degradation rate and kinetic fitting. (a) O3 process; (b) O3/PMS process; (c) O3/PMS/FeMoBC process. Reaction conditions: aqueous phase temperature of 25 ± 1 °C, gaseous O3 concentration of 3.6 mg/L, FeMoBC material dosing of 200 mg/L, [PMS]0 = 30 μM, and solution pH of 6.8 ± 0.1. The initial TC concentrations were controlled to be 0.01 mM, 0.02 mM, 0.03 mM, 0.04 mM, and 0.05 mM.
Nanomaterials 15 01108 g010aNanomaterials 15 01108 g010b
Figure 11. Effect of initial concentration of PMS on degradation of TC by O3 enhancement process and kinetic fitting. (a) O3/PMS process; (b) O3/PMS/FeMoBC process. Reaction conditions: aqueous phase temperature of 25 ± 1 °C, gaseous O3 concentration of 3.6 mg/L, FeMoBC material dosage of 200 mg/L, [TC]0 = 30 μM, and solution pH of 6.8 ± 0.1. The PMS concentration was controlled to be 5 μM, 10 μM, 30 μM, 50 μM, and 80 μM, respectively.
Nanomaterials 15 01108 g011
Figure 12. Effect of FeMoBC dosage on TC degradation by O3/PMS/FeMoBC and the kinetic fitting. Reaction conditions: aqueous phase temperature of 25 ± 1 °C, [PMS]0 = 30 μM, gaseous O3 concentration of 3.6 mg/L, [TC]0 = 0.03 mM, and solution pH of 6.8 ± 0.1; the material dosage was controlled to be 50, 100, 200, 300, and 500 mg/L.
Nanomaterials 15 01108 g012
Figure 13. Effect of pH value of water environment on degradation of TC and kinetic fitting. (a) O3 process; (b) O3/PMS process; (c) O3/PMS/FeMoBC process. Reaction conditions: aqueous phase temperature: 25 ± 1 °C, [PMS]0 = 30 μM, gaseous O3 concentration of: mg/L, FeMoBC material dosage: 200 mg/L, [TC]0 = 0.03 mM, pH values of the solutions: 3.0, 5.0, 7.0, 9.0, and 11.0.
Nanomaterials 15 01108 g013
Figure 14. The influence of common anions on the degradation of TC and its kinetic fitting. (a) O3 process; (b) O3/PMS process; O3/PMS/FeMoBC process (c) HCO3; (d) NO3; (e) Cl; (f) SO42−; (g) HA. Reaction conditions: aqueous phase temperature of 25 ± 1 °C, pH of 6.8 ± 0.1, [PMS]0 = 30 μM, O3 concentration of 3.6 mg/L, [TC]0 = 0.03 mM, and FeMoBC material dosage of 200 mg/L. The reaction time was 20 min, and the sampling interval was 2 min.
Nanomaterials 15 01108 g014aNanomaterials 15 01108 g014b
Figure 15. O3, O3/PMS, and O3/PMS/FeMoBC quenching experiment. (a) O3 quenching experiment; (b) O3/PMS quenching experiment; (c) O3/PMS/FeMoBC quenching experiment; (d) influence of each system on the degradation of TC under the quenching agent.
Nanomaterials 15 01108 g015
Figure 16. EPR map of active species in O3/PMS/FeMoBC system. (a) DMPO–OH, DMPO–SO4•−; (b) DMPO–•O2; (c) TEMP–1O2.
Nanomaterials 15 01108 g016
Figure 17. O3/PMS/FeMoBC system reaction flowchart.
Nanomaterials 15 01108 g017
Table 1. Experimental reagents in the experiment.
ReagentChemical FormulaPurenessManufacturer
Tetracycline hydrochlorideC22H24N2O8•HCl≥99%Shanghai McLean Biochemical Technology Co. (Shanghai, China)
Sodium hyposulfideNa2S2O3ARSinopharm Chemical Reagent Co. (Shanghai, China)
Ferric chloride hexahydrateFecl3•6H2O2ARSinopharm Chemical Reagent Co. (Shanghai, China)
Sodium chlorideNaClARSinopharm Chemical Reagent Co. (Shanghai, China)
Methanoic acidHCOOH≥99%Shanghai McLean Biochemical Technology Co. (Shanghai, China)
Sodium nitrateNaNO3ARSinopharm Chemical Reagent Co. (Shanghai, China)
Tertiary butyl alcoholC4H10OARSinopharm Chemical Reagent Co. (Shanghai, China)
Sodium bicarbonateNaHCO3ARSinopharm Chemical Reagent Co. (Shanghai, China)
L–HistidineC6H9N3O2≥99%Shanghai McLean Biochemical Technology Co. (Shanghai, China)
Potassium peroxymonosulfateKHSO5ARSigma–Aldrich Ltd. (St. Louis, MO, USA)
Methyl alcoholCH3OHSuperior PureSigma–Aldrich Ltd. (St. Louis, MO, USA)
Sodium molybdateNa2MoO4ARSinopharm Chemical Reagent Co. (Shanghai, China)
P–benzoquinoneC6H4O2≥99%Shanghai McLean Biochemical Technology Co. (Shanghai, China)
Table 2. Pore properties of BC, FeBC, MoBC, FeMoBC (new), and FeMoBC (used).
SampleSBET (m2g−1)Smicro (m2g−1)Vtotal pore (cm3g−1)Daver (nm)
BC28.877118.02320.0316854.3890
FeBC151.4387110.05700.0914652.4159
MoBC160.495794.47860.1394213.4748
FeMoBC (new)80.344544.52640.0944984.7046
FeMoBC (used)82.759958.69660.1023544.9470
Table 3. Equations of OH formation promoted by PMS and SO4•−.
No.Equation of a Chemical ReactionReferences
(1) HSO 5 + H 2 O H SO 4 + H 2 O 2 [23]
(2) SO 5 2 + H 2 O SO 4 2 + H 2 O 2 [24]
(3) H 2 O 2 + 2 O 3 3 O 2 + 2 O H [24]
(4) SO 4 + O H SO 4 2 + OH [25,26]
(5) SO 4 + H 2 O H + + SO 4 2 + O H [27]
Table 5. Possible reactions involved in the O3/PMS/FeMoBC system.
No.Equation of a Chemical ReactionReference
(24) F e 2 + + O 3 + H + F e 3 + + O H + O 2 [51]
(25) F e 2 + + O 3 F e O 2 + + O 2 [51]
(26) F e 2 + + O 3 F e 3 + + O 2 [51]
(27) F e 2 + + O 2 + 2 H + F e 3 + + H 2 O 2 [52]
(28) F e 2 + + H 2 O 2 F e 3 + + O H + O H [52]
(29) F e O 2 + + H 2 O O H + F e 3 + + O H [52]
(30) HSO 5 + SO 5 2 + O H O 2 1 + SO 5 2 + H 2 O [46]
(31) M o 4 + + F e 3 + M o 6 + + F e 2 + [53]
(32) F e 2 + + HSO 5 F e 3 + + SO 4 + O H [46]
(33) F e 3 + + HSO 5 F e 2 + + SO 5 + H + [51]
(34) M o 6 + + HSO 5 M o 4 + + SO 5 + H + [51]
(35) M o O 3 + H + H M o O 3 + [54]
(36) H M o O 3 + + HSO 5 M o O ( O H ) ( O 2 ) 2 + SO 4 2 + H 2 O [54]
(37) M o O ( O H ) ( O 2 ) 2 + H 2 O M o O 4 2 + O 2 1 + H + [54]
Disclaimer/Publisher’s Note: The statements, opinions and data contained in all publications are solely those of the individual author(s) and contributor(s) and not of MDPI and/or the editor(s). MDPI and/or the editor(s) disclaim responsibility for any injury to people or property resulting from any ideas, methods, instructions or products referred to in the content.