4.2. Infiltration Process
The fabrication of the nanocomposites is achieved by infiltrating buckypapers with a polymer matrix. This process begins with precise control of both temperature and pressure inside the autoclave. At a temperature of approximately 80 °C, the viscosity of the pre-cured resin within the prepreg plies is sufficiently reduced, enabling it to flow. Simultaneously, an overpressure of 6.5 bar compresses the plies, promoting not only their consolidation but also the diffusion of the low-viscosity resin into the buckypapers. A vacuum of 0.2 bar is applied in the vacuum bag to prevent any residual air inclusions in the material. Once the infiltration is complete, the epoxy resin is fully cured at 180 °C. The effect of the number and positioning of the buckypapers in the laminate on this process will be explained in detail in the following section.
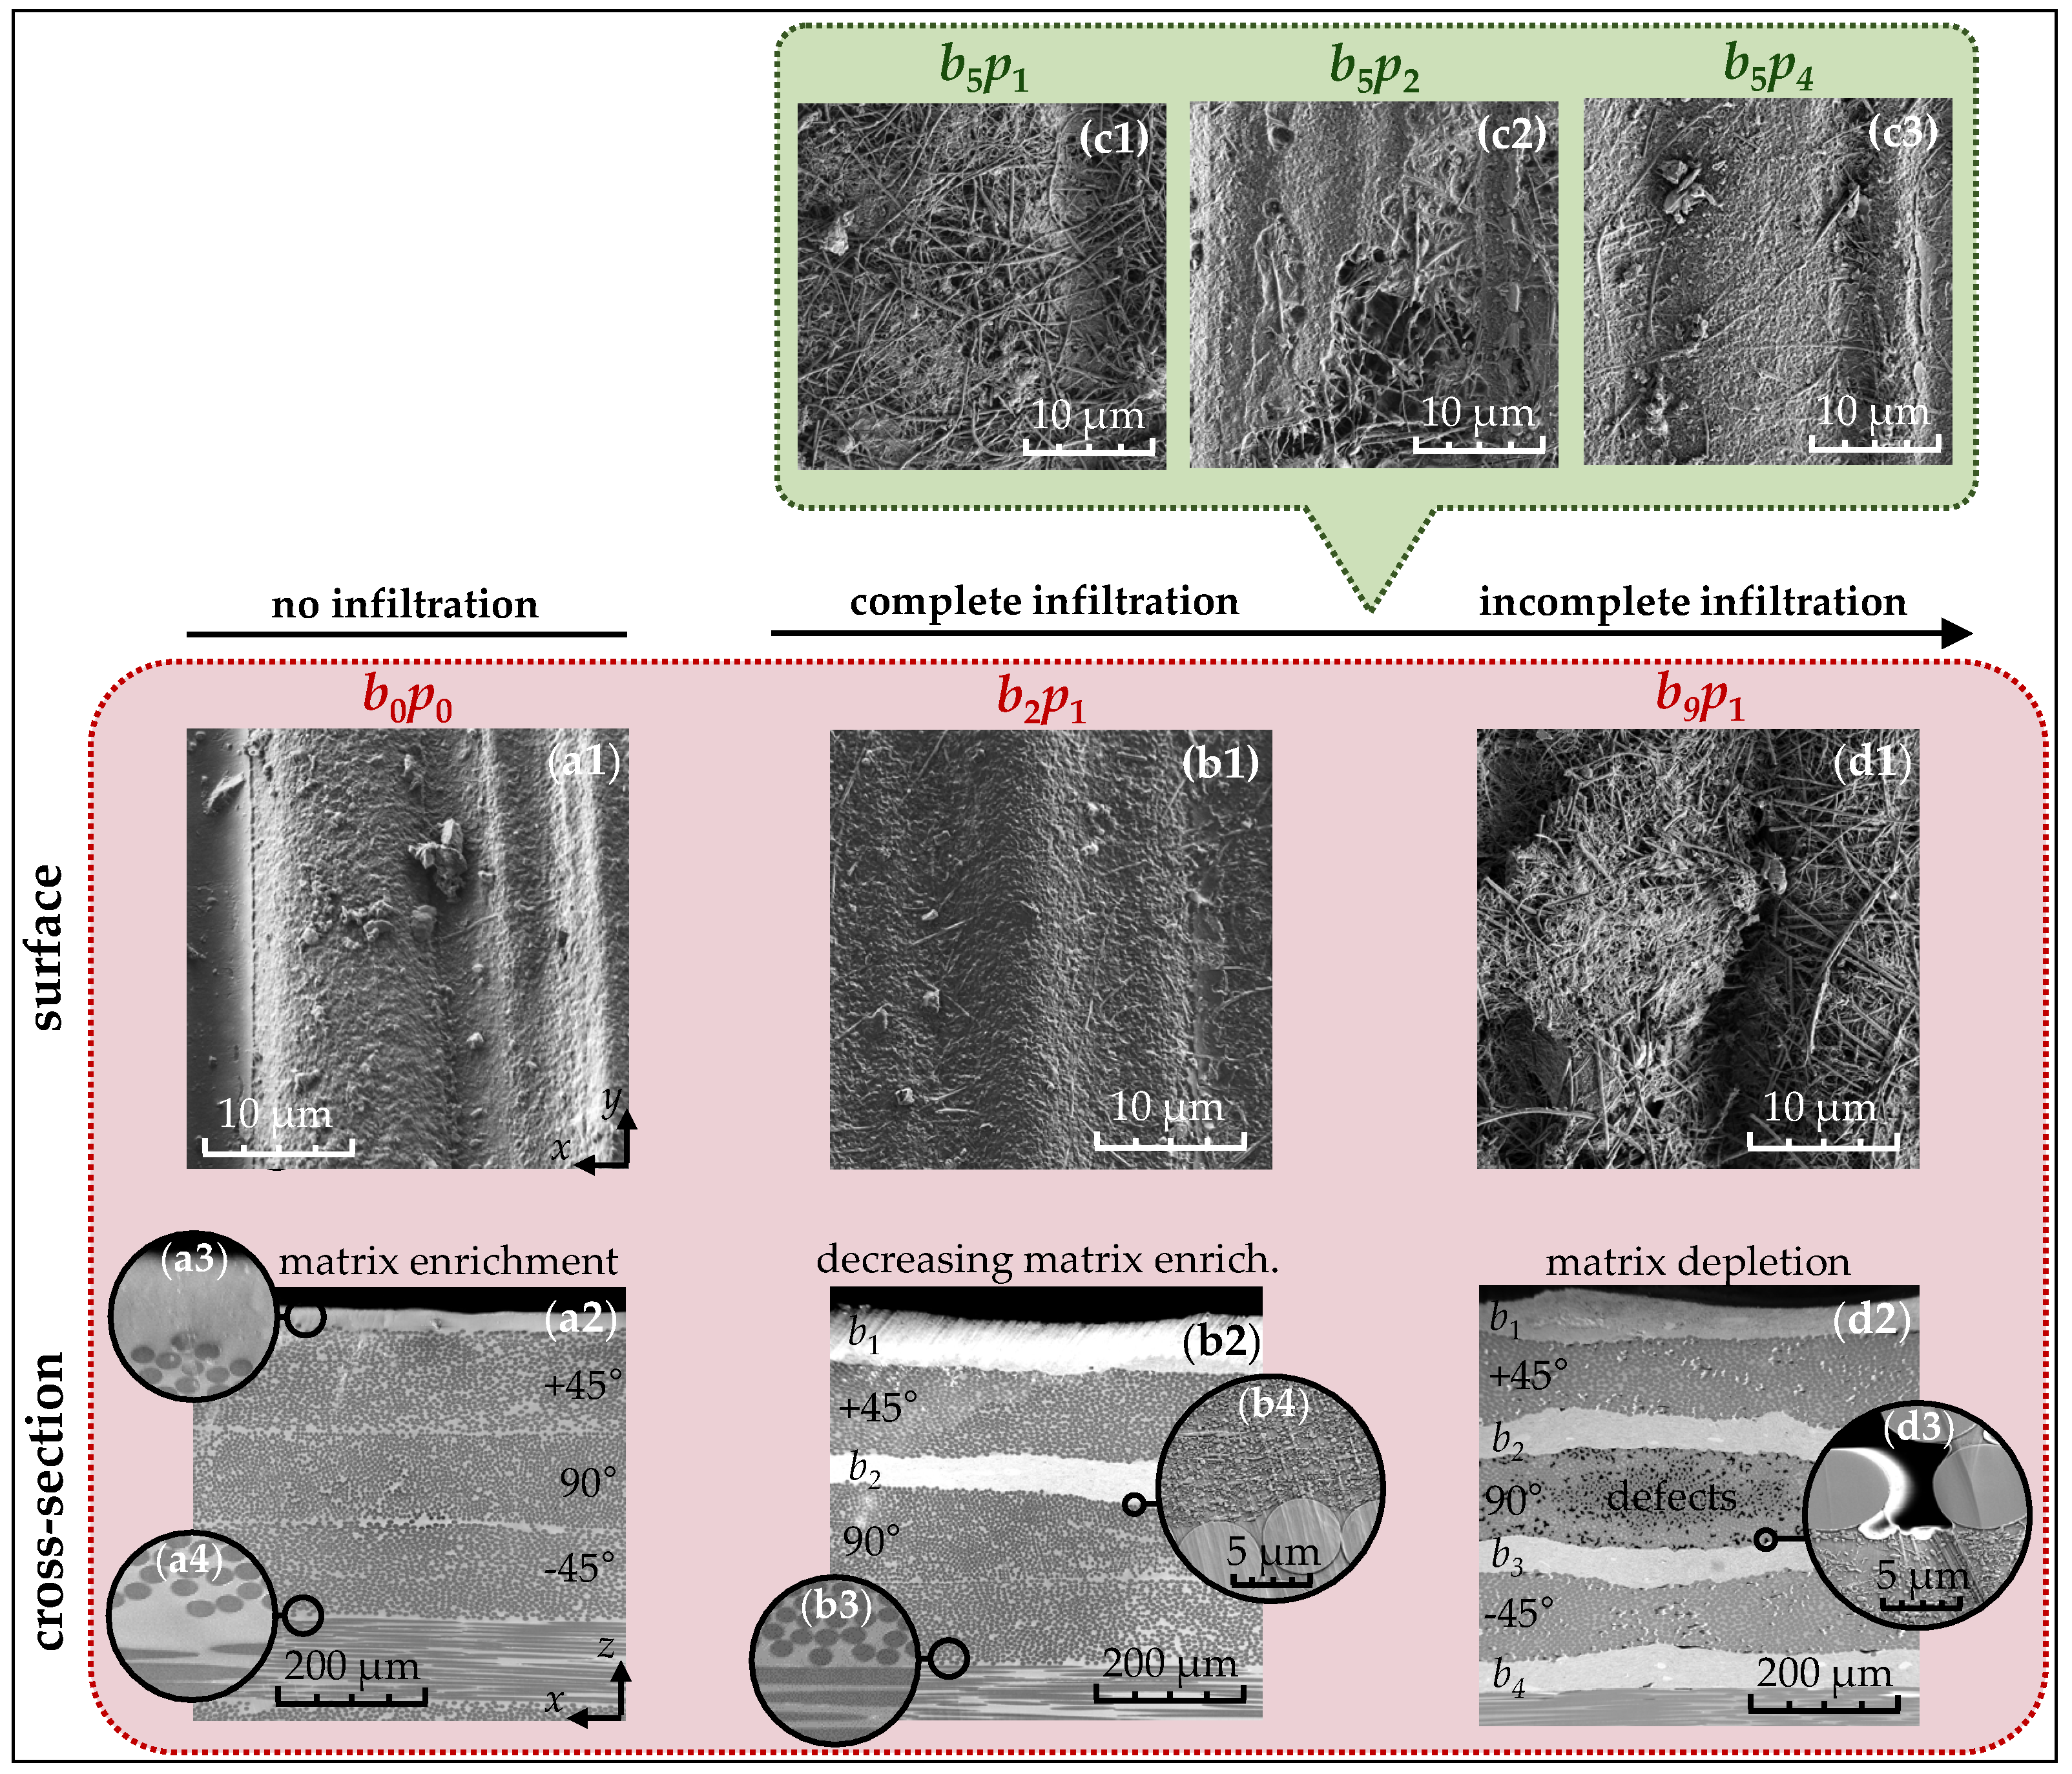
For the qualitative evaluation of the infiltration process, SEM images from the surface and cross-section of the laminates are presented in
Figure 3. In the unmodified reference material
(a1), a wavy polymer structure is visible on the surface, resulting from the imprint of the peel ply used during the laminate curing process in the autoclave. Along the cross-section (a2), the first four prepreg plies (+45°/90°/−45°/0°), with a nominal cured thickness of approximately 115 ± 5
m, are clearly distinguishable. These plies feature a prominent matrix layer of about 20 ± 5
m on the surface (a3), while thinner layers of approximately 2 ± 1
m are observed at their interfaces (a4). Consequently, the 8552/IM7 system demonstrates a moderate matrix excess that can be utilized for the infiltration of the buckypapers.
When integrating up to two buckypapers with an intermediate prepreg ply
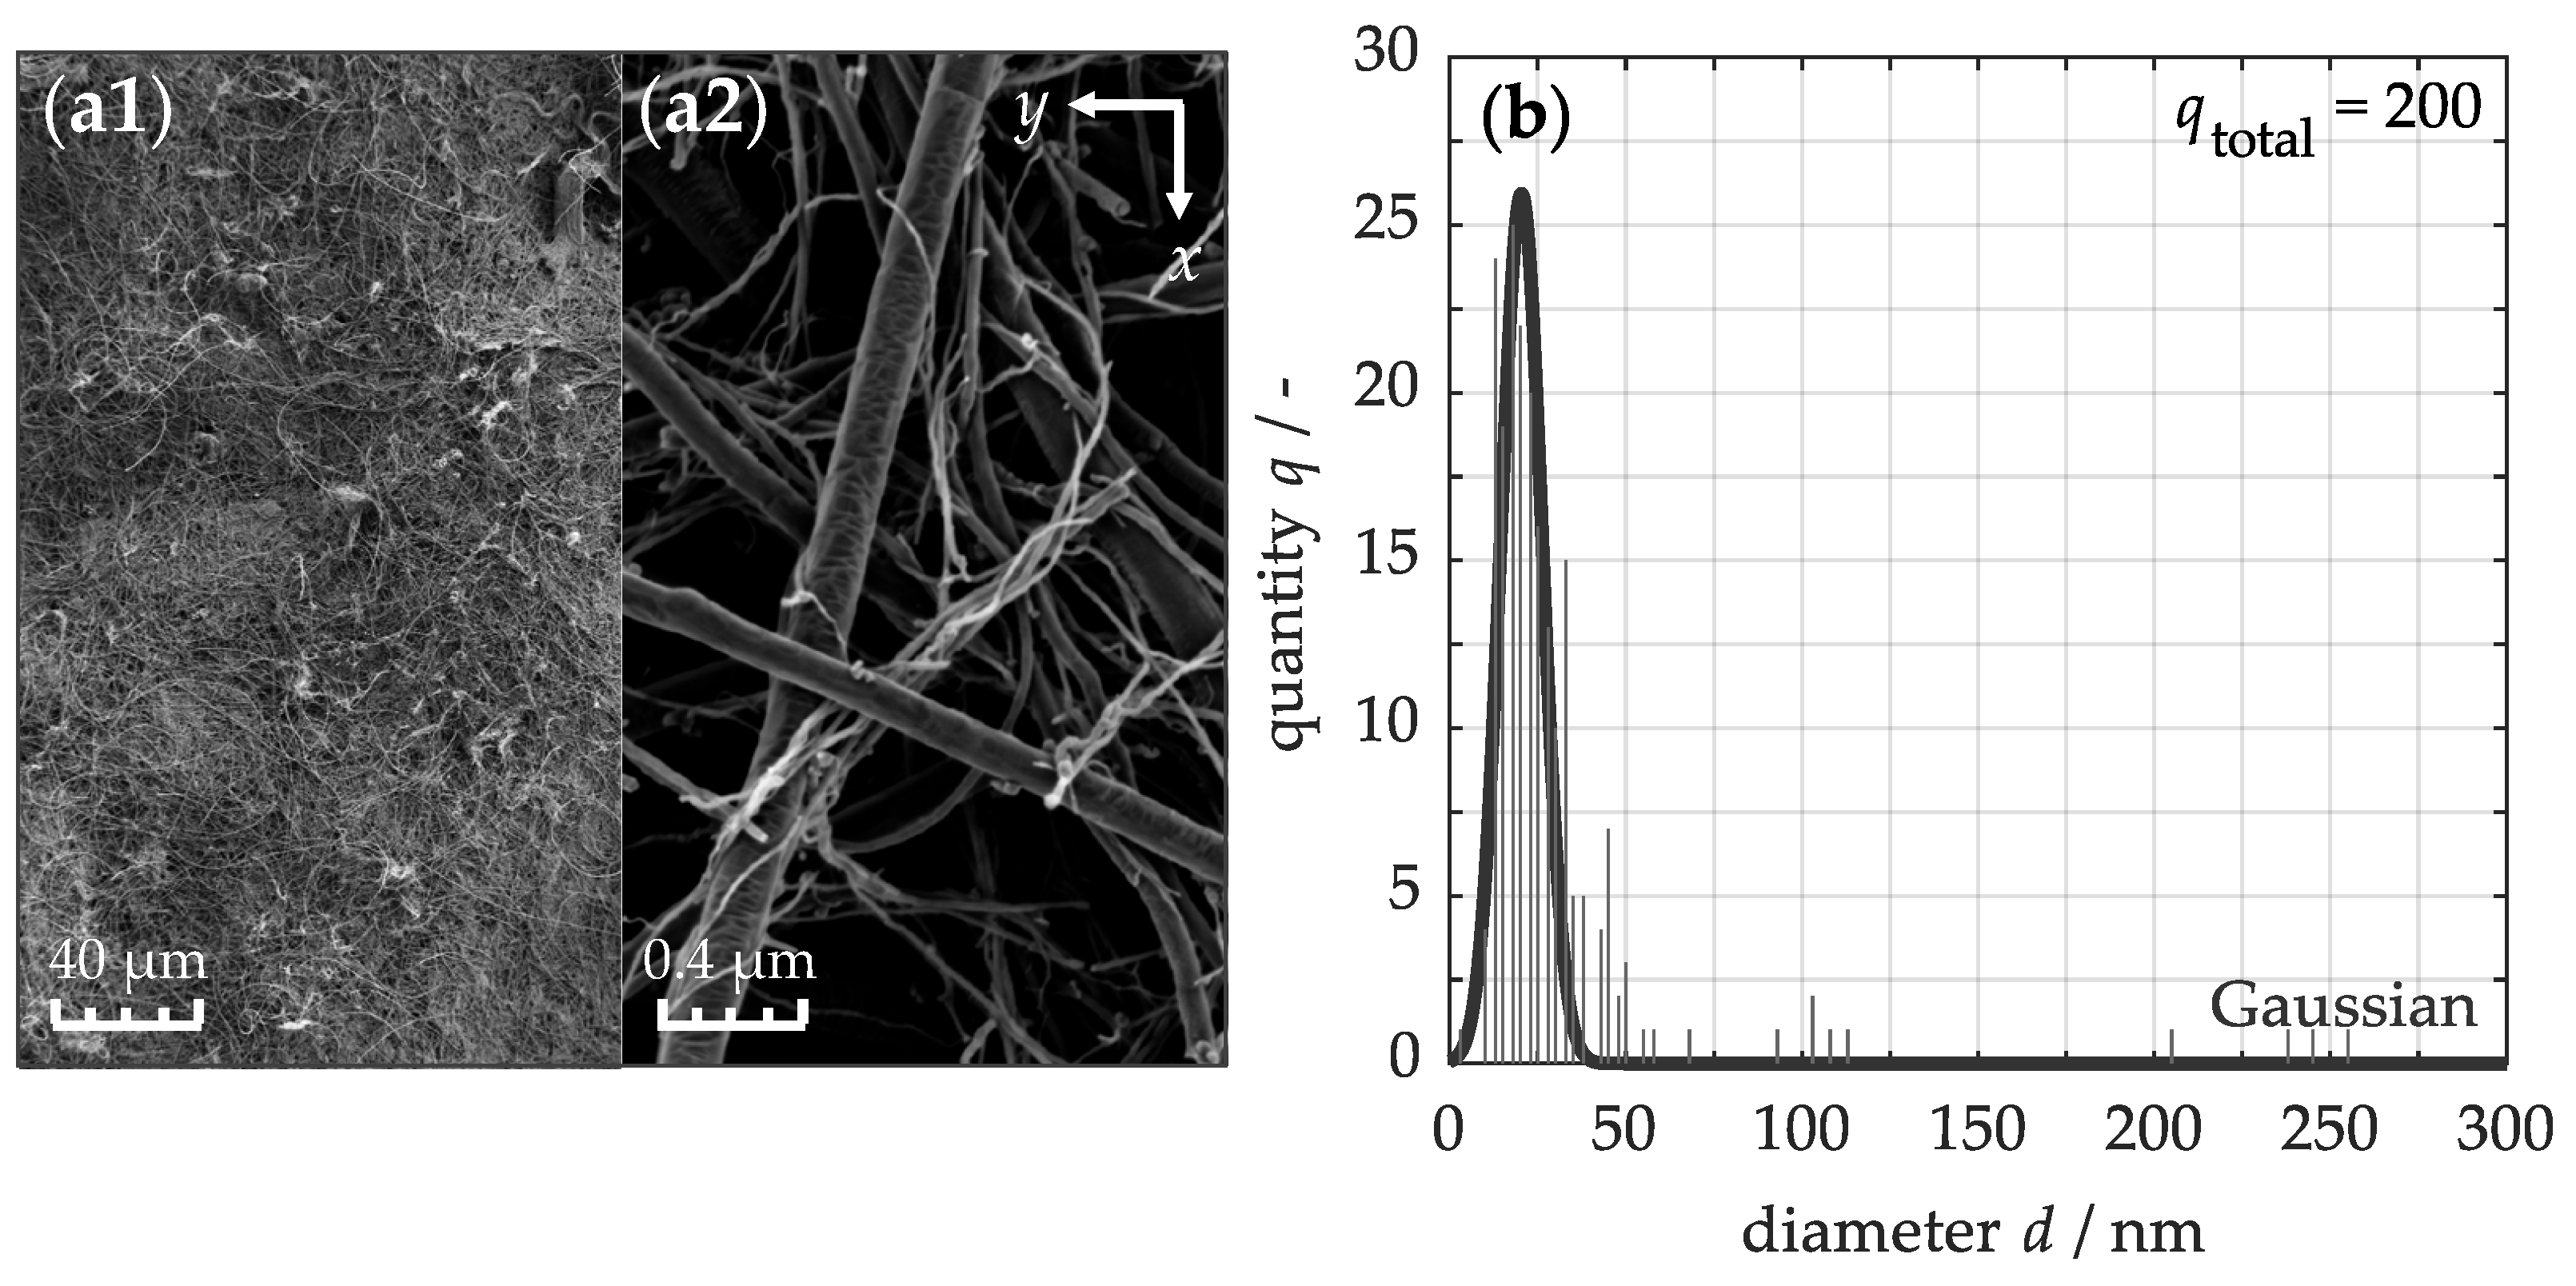
(b1), the matrix-bound carbon nanotube structure becomes visible on the surface. These nanotubes predominantly retain their random planar alignment, similar to the unprocessed buckypaper shown in
Figure 2a, indicating that the infiltration process does not significantly affect their surface orientation. To investigate the internal effects, further analysis was conducted along the vertical direction (b2). Here, the buckypapers
and
appear a lighter gray shade than the polymer matrix and carbon fibers due to their lower electron density, leading to increased scattering of the electron beams. Along the cross-section, it becomes apparent that individual prepreg plies in the modified region merge (b3), while the nanotubes within the buckypapers are fully surrounded by the matrix (b4). This suggests that the excess matrix material effectively diffuses into the buckypapers during infiltration. Therefore, the nanotubes (b4) are uniformly and highly concentrated, establishing close contact both with each other and with the carbon fibers. Consequently, a thermal conductivity network forms in this region. Unlike melt processing [
24], the carbon nanotube network does not penetrate the prepreg plies, as the nanotubes remain fixed in the buckypaper due to strong attractive forces and mechanical entanglements.
When integrating up to nine buckypapers in the sample (d1), carbon nanotubes that are no longer fully infiltrated by the polymer matrix become visible on the surface. Macroscopically, this is reflected in the transition from a glossy to a matte-black surface. In the cross-sectional view (d2), along with the first four buckypapers , , , and , structural defects such as pores, delaminations, or cracks become visible, caused by matrix depletion. These defects (d3) typically contain air, which disrupts the contact between the carbon fibers and the polymer matrix, weakening the fiber–matrix bonds and thereby compromising the mechanical properties.
However, the infiltration process can be deliberately influenced by the periodic arrangement of the prepreg plies. In the sample (c1), where five buckypapers are each separated by a single ply, the entire surface is incompletely covered with the matrix. With the same number of papers but with two intermediate plies in (c2), the surface is partially infiltrated, and with four plies in (c3), it is completely covered. Thus, the more prepreg plies are placed between the buckypapers, the fewer structural defects arise, as more of the polymer matrix becomes available for infiltration.
The prepreg plies of the 8552/IM7 system are basically designed to achieve a high-fiber and a low-matrix-volume content of approximately 42% [
15], ensuring excellent specific strengths. Consequently, only a limited amount of matrix material is available for infiltrating the buckypapers, which restricts the number of papers that can be integrated into the material. To determine this manufacturing limit, the samples were analyzed using micro-computed tomography.
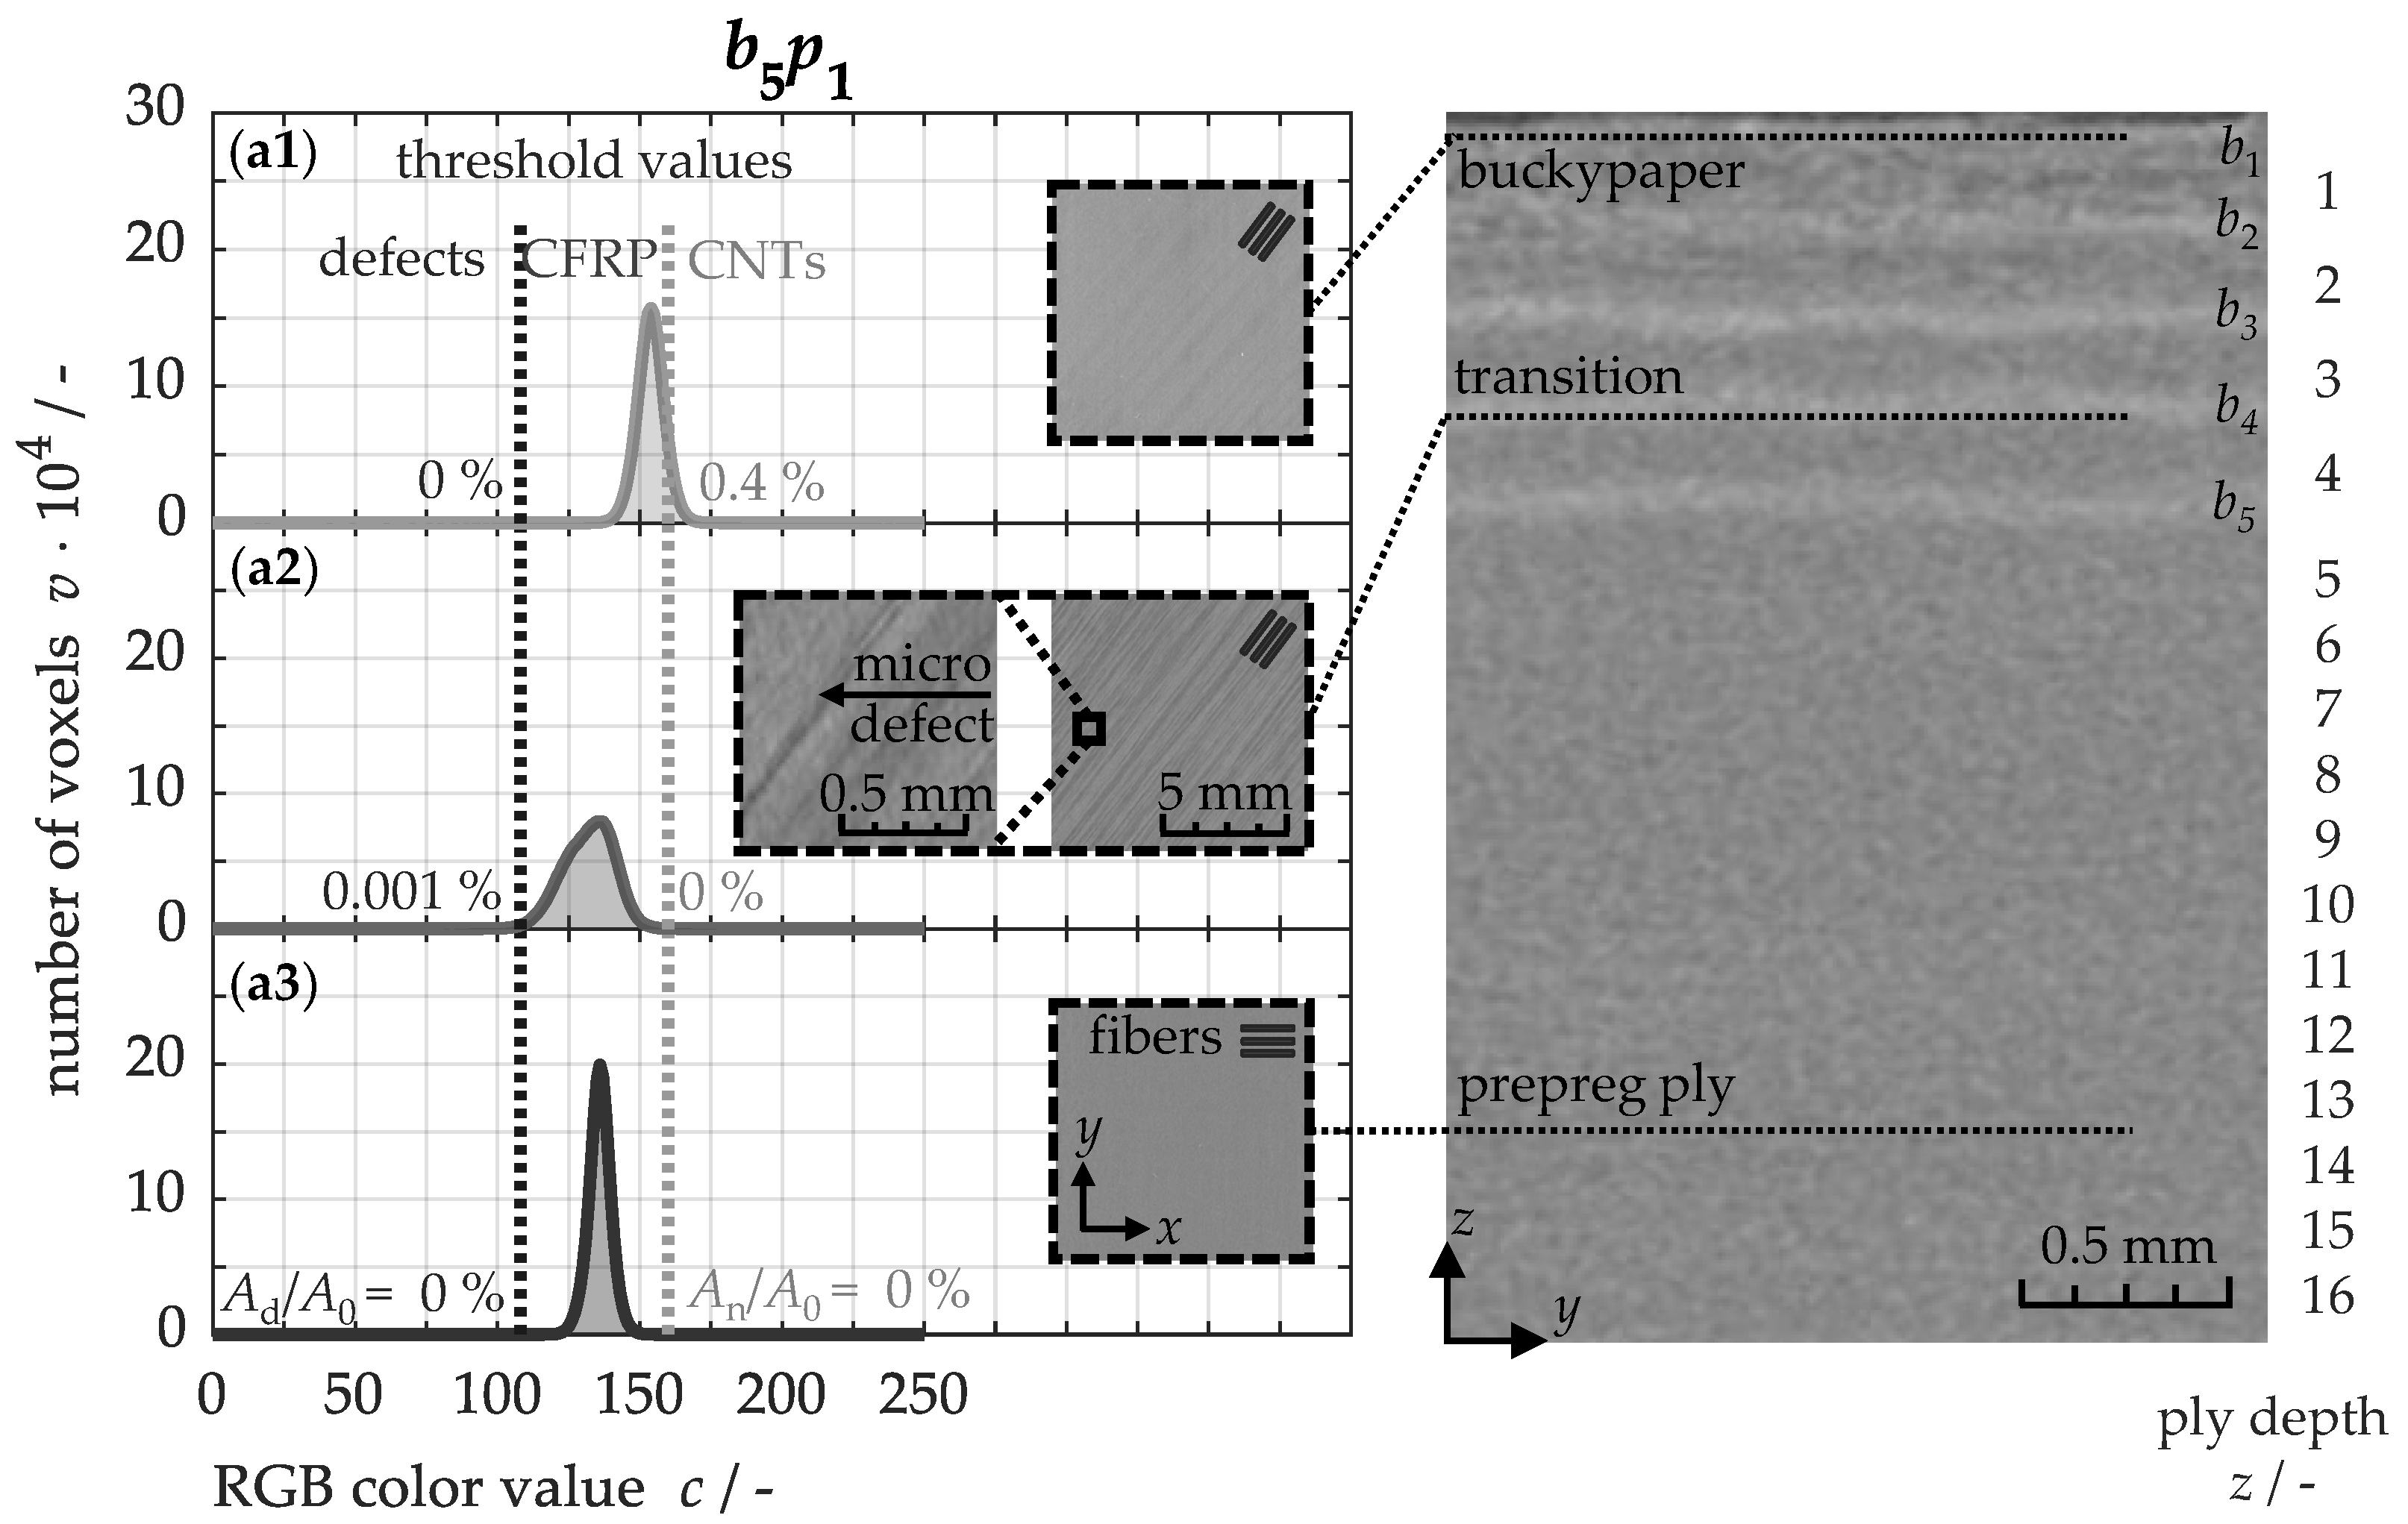
Figure 4 illustrates, on the right side, a
yz-tomogram of the
sample along its cross-section.
The five buckypapers are clearly discernible as lighter gray regions compared to the surrounding prepreg plies. This difference arises from the higher density of carbon nanotubes, which results in greater X-ray absorption and thus lower transmittance. Conversely, structural microdefects, prominently visible in the transition zone within the xy-tomogram (a2), are represented in a darker gray tone. These matrix-depletion-induced defects typically contain air inclusions with low density, leading to reduced X-ray absorption. This contrast enables a clear distinction between the composite material, the brighter nanotubes, and the darker defect regions.
To quantify the proportion of individual regions within the composite material, a grayscale analysis can be performed, as exemplified in
Figure 4 on the left. This involves counting the number of pixels and analyzing their corresponding color values. In the RGB color space, grayscale values range linearly from black (red = 0, green = 0, blue = 0) to white (255, 255, 255), allowing the three color channels to be combined into a single value,
c. Subsequently, the different regions can be differentiated by introducing two color threshold values: pixels with grayscale values
c ≤ 108 are assigned to structural defects, while values
c ≥ 160 correspond to the carbon nanotubes in the buckypapers. Pixels with color values between these thresholds represent the composite material. Consequently, the prepreg plies (a3) consist exclusively of pixels within this middle range. Microdefects in the transition areas (a2) result in a few pixels with values below the lower threshold, while the presence of nanotubes in the buckypapers (a1) leads to pixels with values above the upper threshold. To quantify the defect area
Ad and the nanotube area
An, the respective areas are normalized by the total composite area
A0.
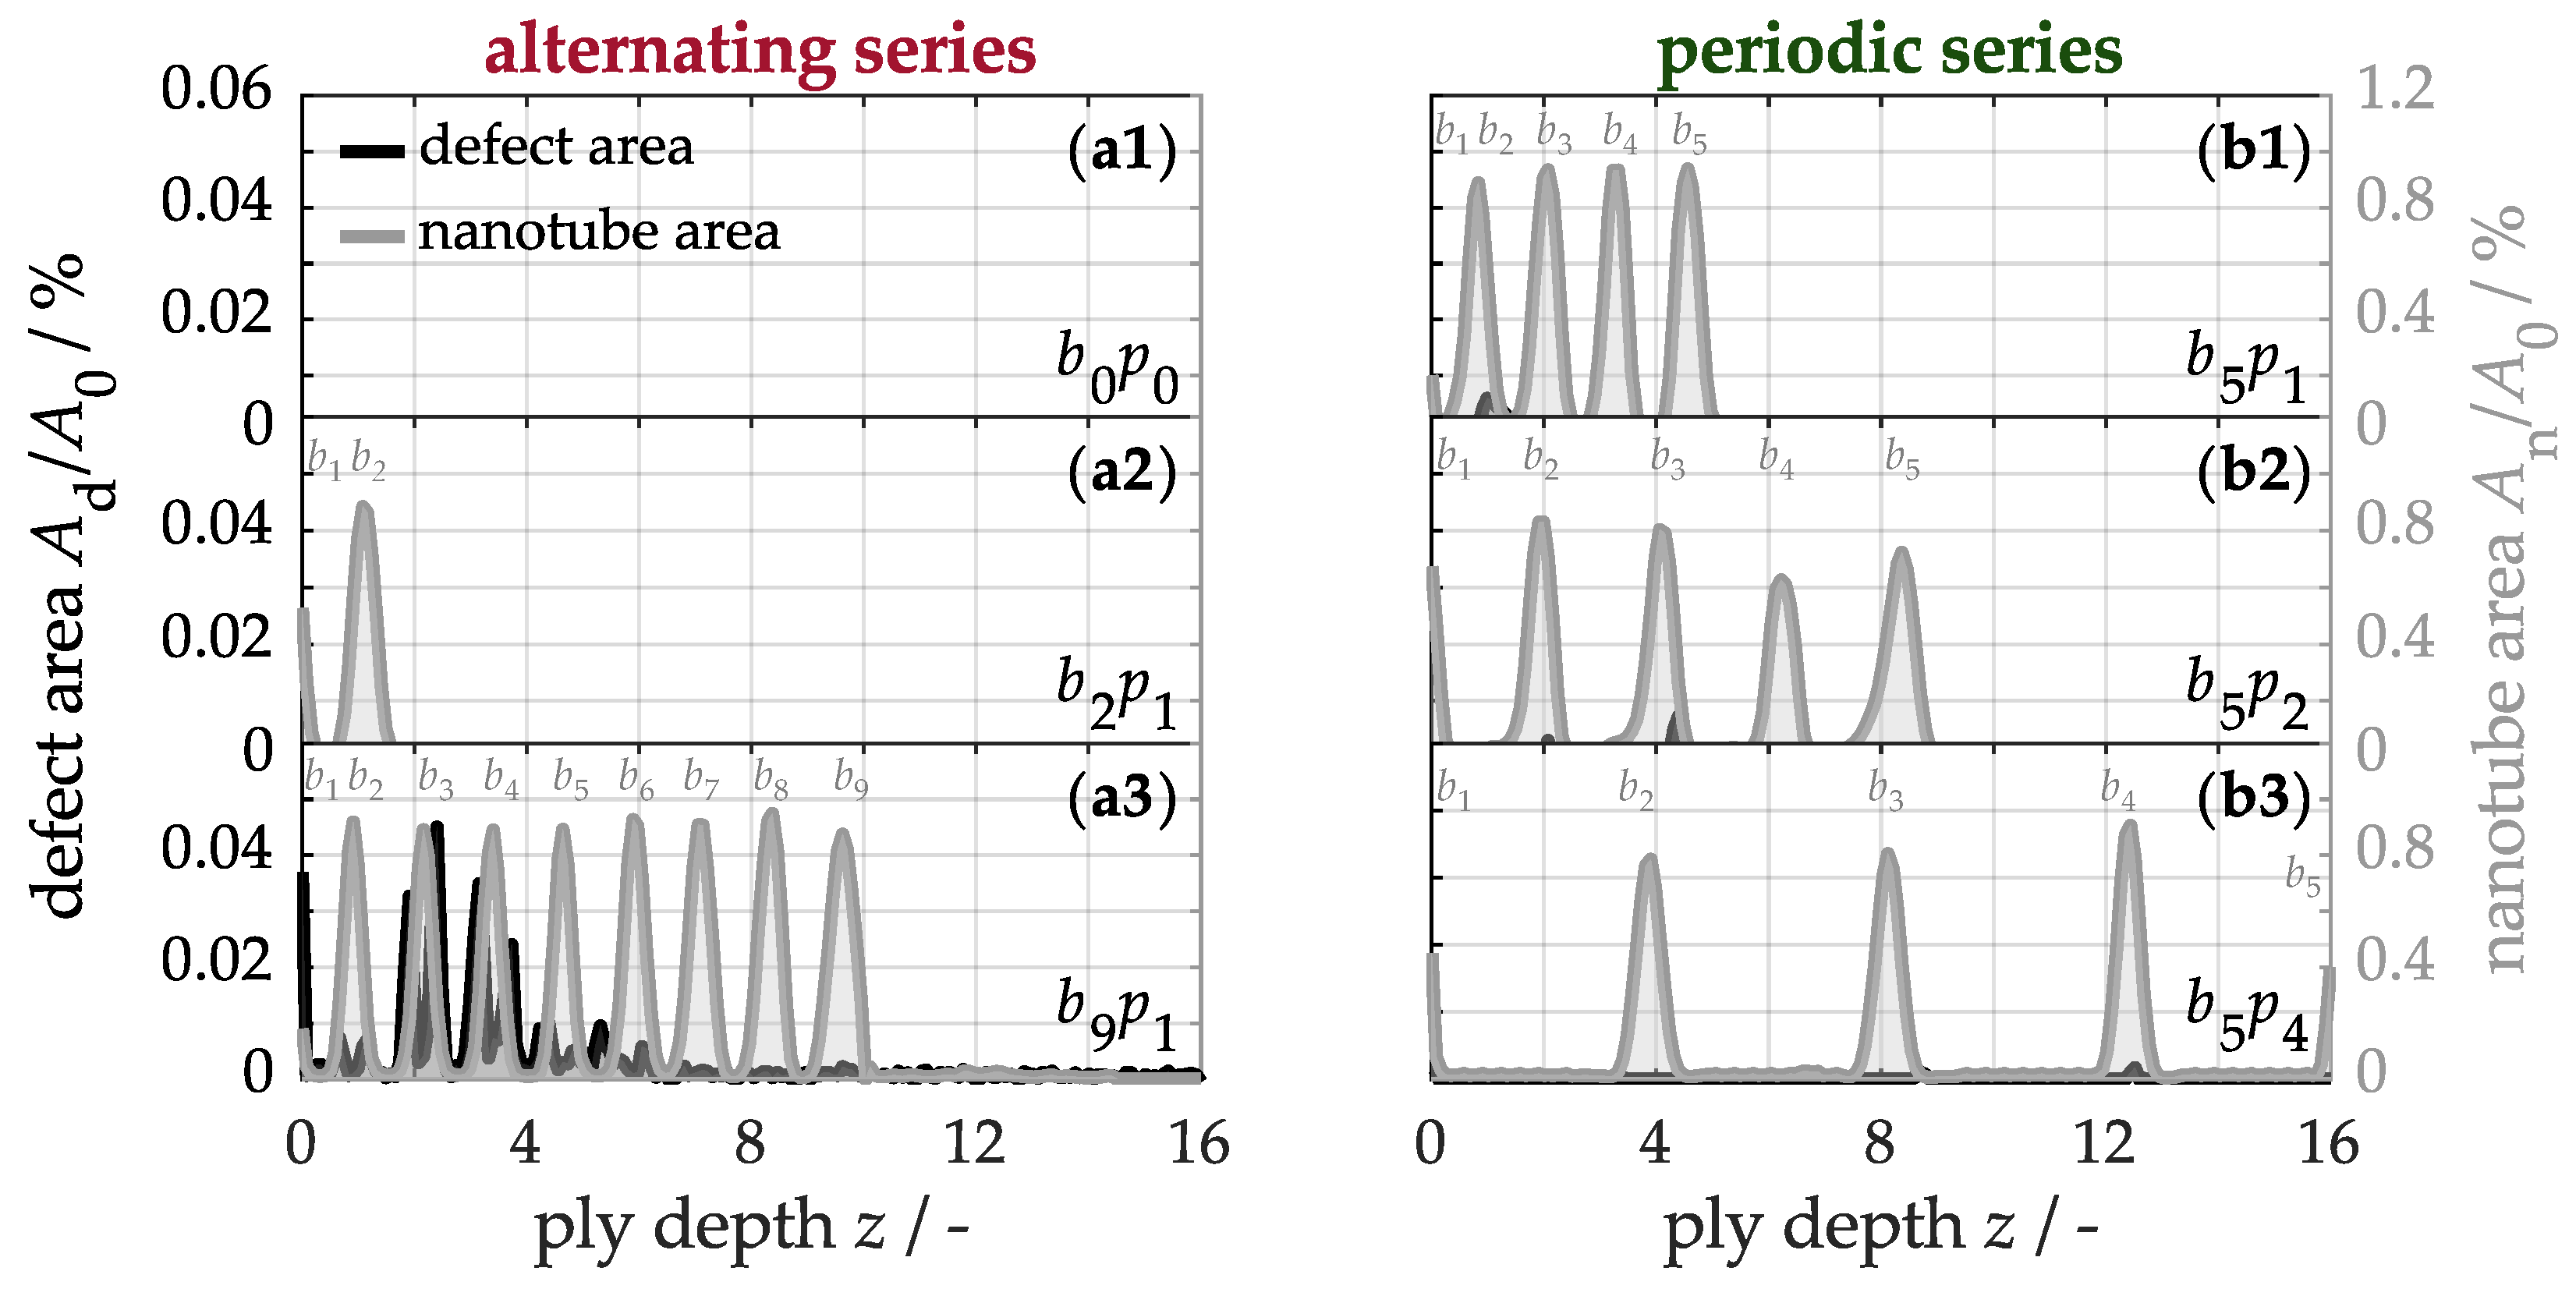
Figure 5 shows the quantified defect areas on the left axis and the carbon nanotube areas on the right axis as a function of ply depth. In the unmodified material
(a1) neither nanotubes nor defects are detectable over the cross-section. In alternating series, the
laminate (a2) reveals two nanotube peaks near the front surface, corresponding to the two buckypapers. Similarly, the
sample (a3) exhibits nine peaks, as expected. However, the modified region near the buckypaper is overlaid by structural microdefects amounting to a total of
Ad/
A0 = 0.7%, which, as discussed in detail, can be attributed to the insufficient amount of matrix available during the infiltration process.
To reduce the defect fraction, additional prepreg plies can be periodically inserted between the buckypapers to increase the available polymer matrix for infiltration. For instance, with five buckypapers and one prepreg ply between each, the defect fraction, as shown in
Figure 5(b1), is approximately 0.04%, while it decreases to 0.03% with two prepreg plies (b2) and to barely detectable 0.01% with four prepreg plies (b3). Nevertheless, minor defects remain in these configurations, indicating that the matrix capacity in the 16-ply material is fully utilized during the infiltration of five buckypapers. Although adding more buckypapers causes an accumulation of defects due to matrix depletion, it simultaneously increases the fraction of carbon nanotubes.
This dual effect underscores the challenge of balancing the number of buckypapers with the available matrix, aiming to reduce defects while increasing the nanotube fraction. For a deeper analysis,
Figure 6a shows the mass fraction of carbon nanotubes in both the cured laminate and polymer matrix as a function of the number of buckypapers. It is evident that the nanotube proportion increases approximately linearly with the number of buckypapers. Specifically, for each buckypaper, the fraction increases by 0.5 wt.% with respect to the laminate and by 1.6 wt.% relative to the matrix. With a total of five buckypapers, a maximum fraction of 8 wt.% can be incorporated into the matrix without significantly negatively affecting the structural properties. Compared to melt processing [
24], up to four times higher proportions can thus be precisely integrated into the material.
However, the integration of buckypapers also affects the laminate’s cross-sectional structure, as illustrated in
Figure 6b. For example, the unmodified material has a thickness of approximately 2.02 ± 0.02 mm. For each additional buckypaper, the cross-section increases approximately linearly by 20 μm. This change is relatively modest, as the unprocessed buckypaper, originally 130 μm thick [
53], experiences substantial compression during the autoclave curing process. Accordingly, the incorporation of five buckypapers results in an increase of around 100 μm, representing only 5% of the total thickness of the unmodified laminate. This modification thus only marginally impacts the cross-sectional area, which is crucial for preserving the laminate’s mechanical integrity.
In comparison to the previously investigated alternating series of buckypapers within the material, a periodic or symmetric arrangement similarly affects the mass fraction of the nanotubes and the laminate thickness. Consequently, these material properties are primarily determined by the number of buckypapers, while their arrangement plays a crucial role in the proportion of structural defects and, therefore, the material quality, as observed in
Figure 5.
Overall, the systems with five buckypapers offer a well-balanced combination of a high fraction of carbon nanotubes and a nearly irrelevant proportion of structural defects within the material volume. It is therefore expected that these modifications provide the greatest potential for enhancing thermal properties while maintaining mechanical integrity.
4.3. Material Performance
To validate these expectations, the pathway of heat conduction within the network of carbon nanotubes in the matrix-infiltrated buckypapers must first be examined. This can be indirectly assessed through charge transport, as it follows the path of least resistance.
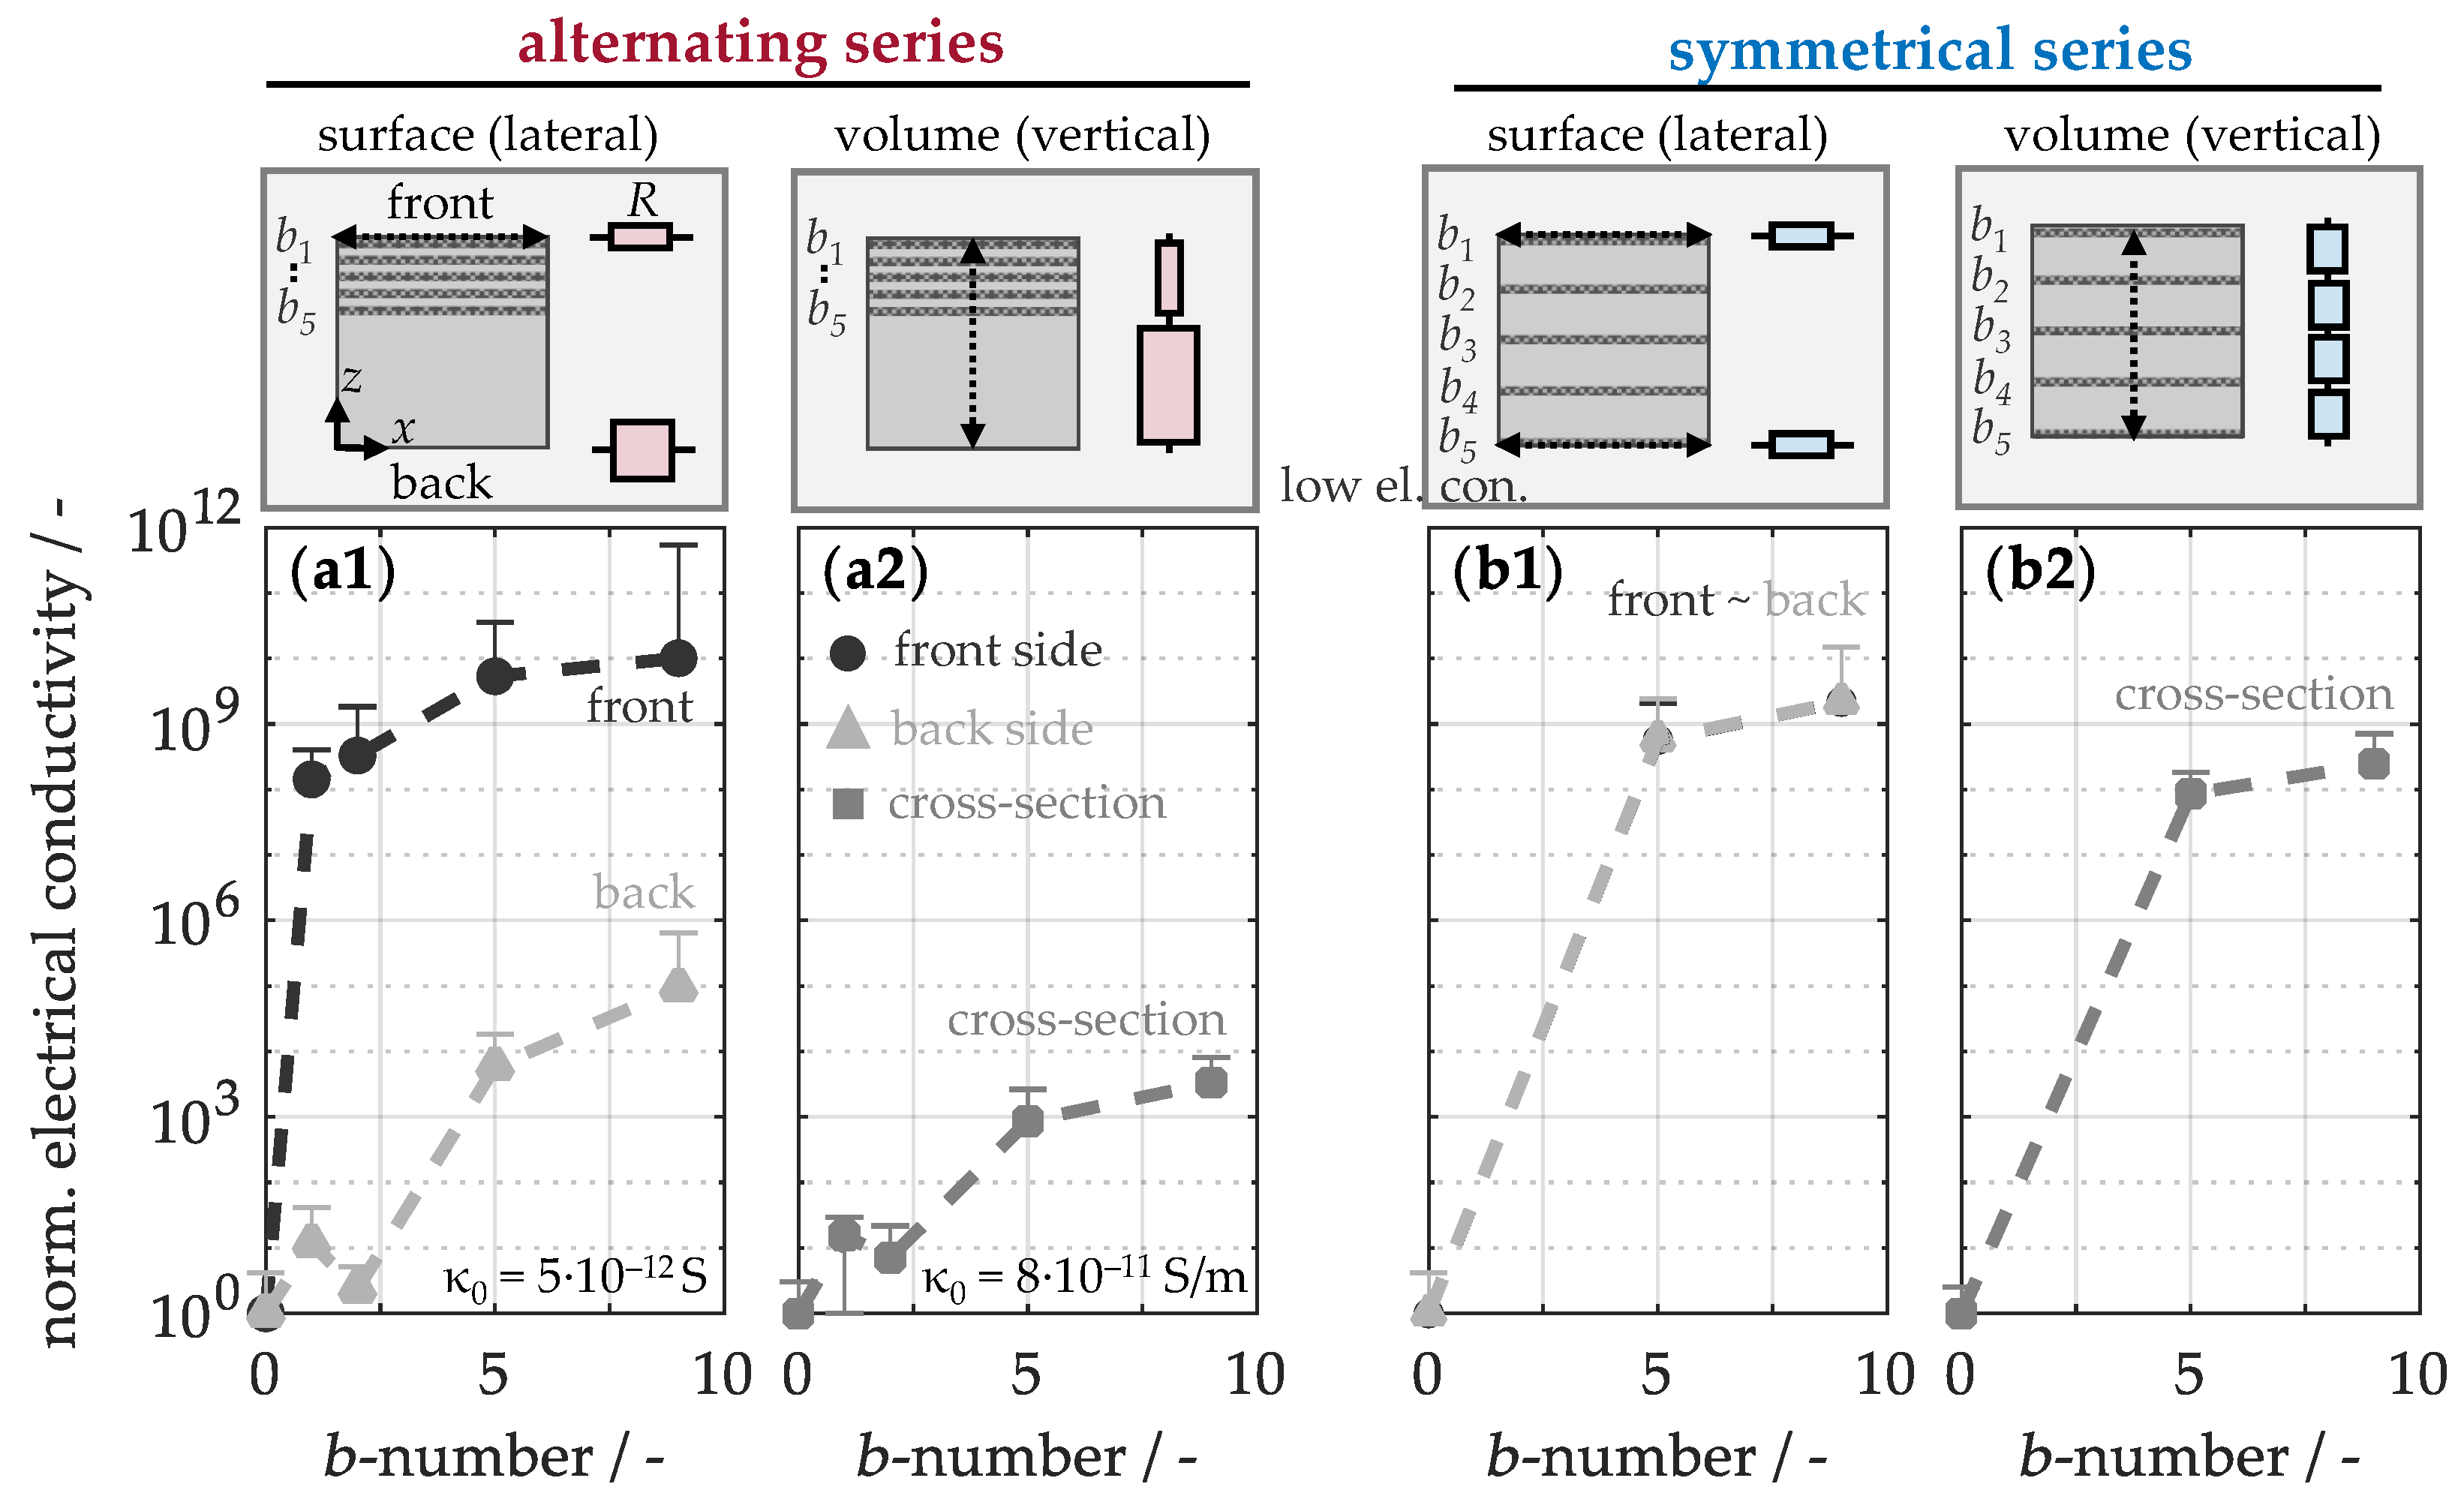
Figure 7 therefore illustrates the normalized electrical conductivity both on the surfaces and in the volume. It is evident that the unmodified material (a1) exhibits a surface conductivity of only 10
−12 S, primarily due to the insulating effect of the pronounced matrix enrichment. The addition of a single buckypaper on the front side leads to a significant conductivity increase by a factor of 10
8, as a conductive network is formed in the lateral direction. Further incorporation of additional papers with interleaved prepreg plies brings the conductivity closer to that of untreated buckypaper, at 10
−2 S, since progressively less polymer matrix is available for infiltration. Simultaneously, the conductivity on the back side increases by a factor of 10
5, despite the absence of carbon nanotubes. This enhancement can be attributed to the redistribution of excess matrix during the autoclave process, resulting in a locally higher fiber content on the back. In the bulk (a2), the unmodified material demonstrates a specific conductivity of just 10
−11 S/m. However, the introduction of several buckypapers also only results in a modest improvement by a factor of 10
3. This suggests that in alternating configurations, the conductive network in the modified region is well-formed, while the non-modified regions remain largely influenced by the surrounding matrix. In contrast, a homogeneous arrangement of buckypapers significantly boosts conductivity by a factor of 10
9 on the surfaces (b1) and by 10
8 in the volume (b2). This symmetrical configuration thus drastically enhances electron transport in both lateral and vertical directions, confirming the establishment of a fully integrated conductive network in the material.
To gain a deeper understanding of the transport mechanism, the material is schematically divided into electrical resistances
R in
Figure 7. Modified regions (a1, b1) generally exhibit lower resistances, as enhanced electron transport occurs through the conductive nanotube network in the buckypaper. Therefore, electron transitions between adjacent CNTs can occur via tunneling, allowing electrons to overcome the energy barrier between nanotubes without passing through the insulating matrix [
64]. Within the CNTs, electron transport is facilitated by delocalized
-electrons, which move freely along the carbon bonds in the tubular structure [
55]. In contrast, regions with enriched electrically insulating matrix materials exhibit higher resistances due to hindered electron transport. Consequently, at the surface, the total resistance is directly influenced by the material’s structural characteristics. Along the cross-section (a2, b2), the total resistance results from the sum of individual resistances connected in series. In an alternating configuration (a2), the total resistance is a combination of low and high individual resistances, as a result of the separation between modified and unmodified regions. This configuration leads to only a minor reduction in overall resistance compared to the original material. In contrast, a symmetrical arrangement (b2) results in a total resistance determined by the repeated individual resistances of uniform sections. These resistances, which lie between the alternating individual resistances, lead to a significantly lower total resistance, indicating the overall better electrical transport properties. Similarly, these regions can be interpreted as thermal resistances, providing a basis for drawing parallels to the thermal behavior of the modified materials.
Building on this perspective, the effects of the integrated buckypapers on the thermal properties of the materials are now examined. For this purpose,
Figure 8 illustrates the thermal conductivity (a1, a2) along the sample cross-section. The unmodified sample shows a thermal conductivity of just 0.772 ± 0.010 W/(m·K) at room temperature, emphasizing its insulating behavior, primarily due to the polymer matrix. As expected, the integration of buckypapers improves the thermal conductivity by creating more efficient conductive pathways. For example, the conductivity increases by approximately 13% (a1) with five buckypapers arranged alternately, while it rises by 20% (a2) in a symmetric arrangement. In comparison, a significantly better thermal performance is observed when the buckypapers are uniformly arranged within the laminate, as this configuration establishes a continuous and efficient network for heat transfer.
An even higher thermal conductivity is expected exclusively in the longitudinal direction of the sample, owing to the anisotropic structure of the carbon fibers and nanotubes. In this direction, a highly ordered, graphitic crystal structure with covalent bonds facilitates particularly efficient heat transport along direct pathways. However, unlike electrical conductivity, thermal conductivity does not exhibit a sharp increase. This is because heat transfer occurs not through electrons, but via quantized lattice vibrations of phonons. Since the nanotubes are only weakly bonded through van der Waals forces, a significant thermal contact resistance arises at their interfaces, leading to phonon scattering and thus disrupting the heat conduction within the network [
24,
29]. As a result, the improvement in heat transport is more modest compared to electron transport.
The specific heat capacity (b1, b2) of the unmodified material is approximately 0.908 ± 0.004 J/(g·K) under ambient conditions. Integrating buckypapers into the composite material increases their specific heat capacity, as the nanotubes contribute to enhanced thermal storage. For instance, the incorporation of five papers results in a similar capacity boost of around 5% for the alternating arrangement (b1) and 7% for the symmetric distribution (b2) over the cross-section. The placement of the buckypapers within the material thus has a negligible effect on the specific heat capacity. Therefore, it is primarily the concentration of carbon nanotubes that drives the moderate improvement in thermal energy storage.
The density of the non-modified material (c1, c2) is 1.621 ± 0.001 g/cm3 under standard conditions. The introduction of buckypapers leads to an unexpected decrease in material density. Specifically, with five buckypapers, the density drops by approximately 1.3% for the alternating arrangement (c1) and 0.1% for the symmetric series (c2). This decrease can be attributed to several factors: First, the incorporation of buckypapers increases the total volume more significantly than the total mass, owing to the lightweight nature of the nanotubes. Second, at higher paper numbers, incomplete infiltration of the polymer matrix may result in microdefects, trapping air pockets with a lower density than the material itself. Despite these factors, the reduction in density remains minimal compared to the original material. Consequently, the modification offers a slight improvement in thermal properties without negatively affecting the material’s specific weight.
Finally, the mechanical behavior is examined to assess the impact of the buckypaper modification on the material’s structural integrity. To this end,
Figure 9(a1,a2) illustrates the thermo-mechanical properties obtained from dynamic mechanical analysis. During the heating process, the non-modified material transitions from a rigid, glassy state to a soft, viscous state at a glass transition temperature of approximately 230.7 ± 1.0 °C. The incorporation of buckypapers in an alternating arrangement within the material (a1) leads to a slight temperature increase of up to 233.9 ± 1.4 °C. This delayed softening of the material could be attributed to various structural and chemical changes; the carbon nanotubes in the buckypapers may act as nanoscale fillers, restricting the mobility of the polymer molecular chains. Additionally, the nanotubes’ large specific surface area could enhance interactions with the polymer matrix. This, in turn, could increase the crosslinking density within the material, contributing to the higher glass transition temperature. However, since a symmetrical arrangement of the buckypapers (a2) leads to a similar temperature change, the concentration of nanotubes integrated into the material primarily influences a slightly higher resistance to thermal and mechanical stresses.
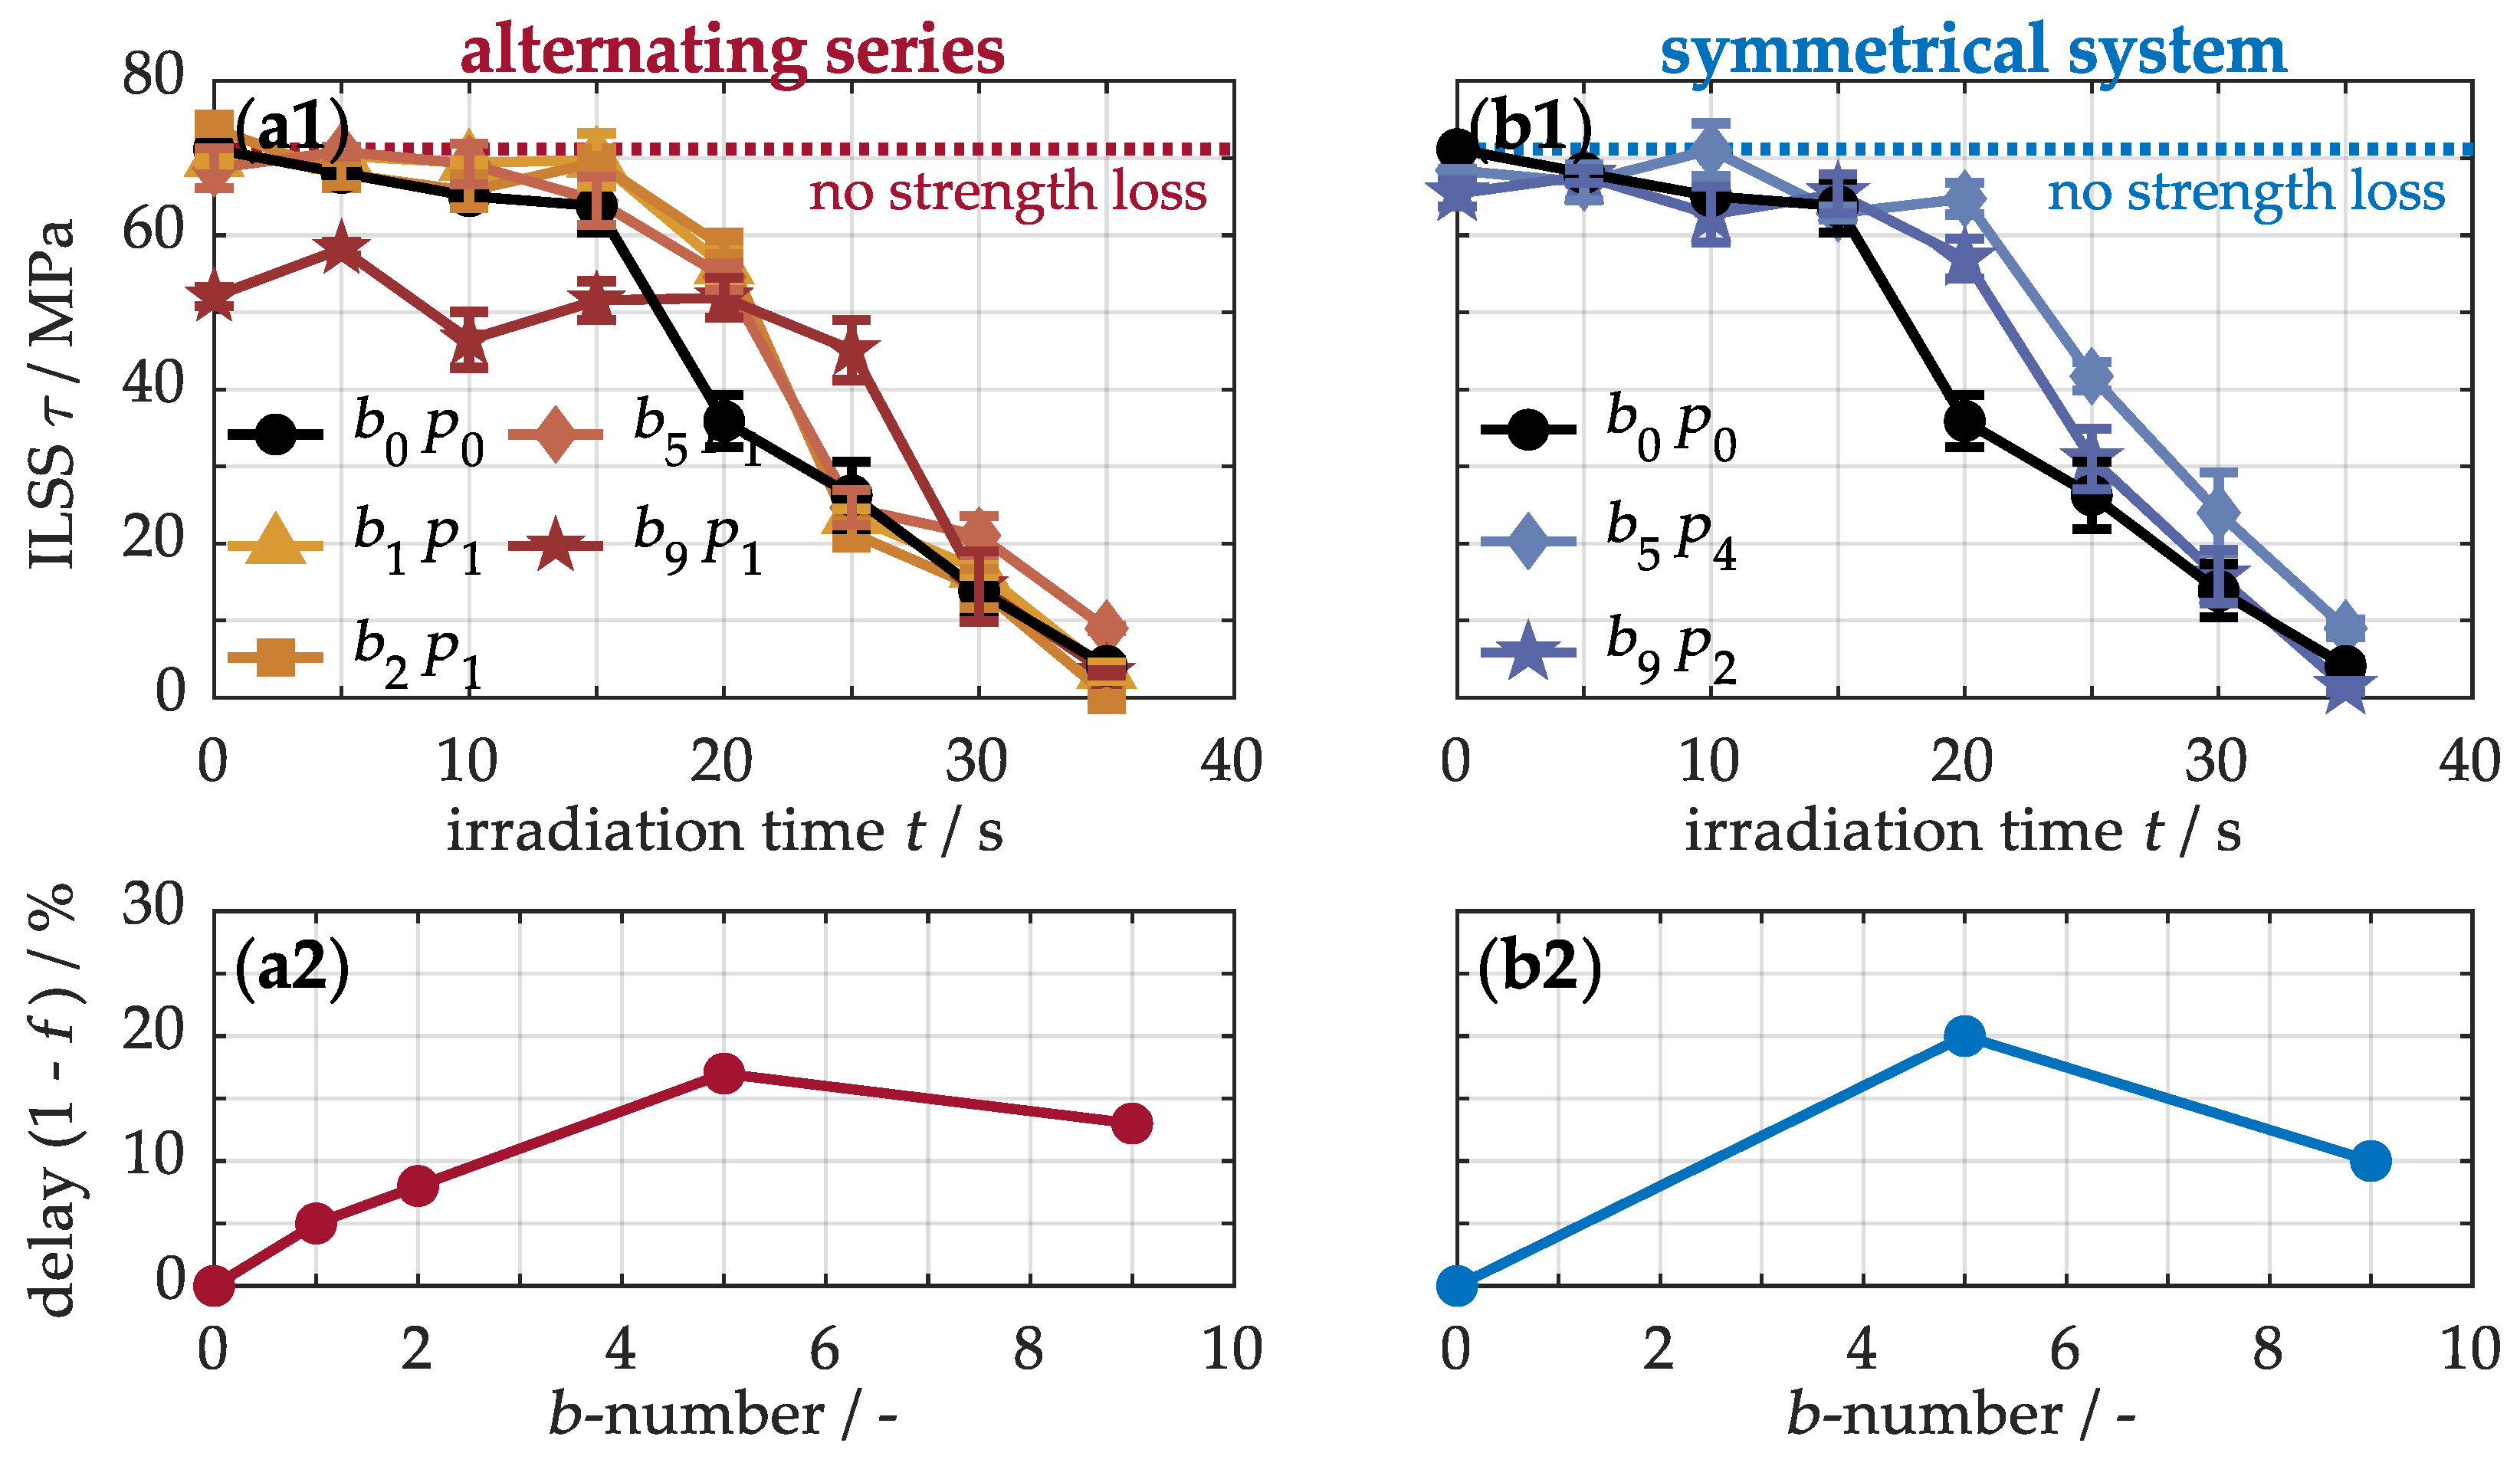
For a comprehensive analysis,
Figure 9(b1,b2) also illustrates the normalized strengths for varying numbers of buckypapers in the composite material. The unmodified sample has an interlaminar shear strength of 71.2 ± 0.1 MPa, a compressive strength of 746 ± 32 MPa, a bending strength of 633 ± 4 MPa, and a tensile strength of 890 ± 19 MPa. The integration of buckypapers leads to a noticeable reduction in strength, indicating that carbon nanotubes do not reinforce the nanocomposite. Upon closer inspection, when up to five papers are alternately arranged (b1), a slight strength reduction of about 10% is observed. This decline can primarily be attributed to the increased cross-sectional area of the nanocomposites, as these samples absorb forces comparable to those of the base material during mechanical loading. Only with a higher number of papers does the strength drop to 63% of its original value. This behavior is linked to the formation of microdefects, caused by the limited matrix availability. As a result, force transfer from the matrix to the carbon fibers is hindered due to weak fiber–matrix bonding. However, the mechanical properties can be significantly influenced by the arrangement of the buckypapers. In a symmetrical arrangement (b2) with five buckypapers, the impact on strength is minimal compared to the alternating series, as these samples contain only a few defects. With nine buckypapers, this effect improves by about 24%. Nevertheless, the strength still only reaches 87% of the original value and is thus no longer within the acceptable range for high-performance materials. Thus, the systems with five buckypapers represent, as expected, the best combination of thermal properties without significantly compromising mechanical integrity.
4.4. Simulation of Thermal Properties
The thermal properties determine the ability of heat conduction and storage in advanced materials. To describe this thermal behavior, Bibinger et al. [
24] recently published an innovative yet simple model. In this approach, the thermal conductivity of a composite material
is calculated using the rule of mixtures, as outlined in Equation (
1):
where
denotes the nanotube mass fraction within the laminate,
represents the experimentally determined thermal conductivity of the unmodified laminate, and
indicates the effective thermal conductivity of the carbon nanotubes embedded in the polymer matrix. Unlike the theoretical assumptions in conventional serial or parallel models [
29,
65], this approach focuses on the actual heat conduction behavior of the nanoparticles when integrated as a filler in composite materials. To this end, both the regions with lower thermal resistances within the tubular structure and those with higher resistances between adjacent nanotubes are considered. These regions together form the total thermal resistance, which can be indirectly captured through its inverse relationship with the effective thermal conductivity. To determine the effective thermal conductivity,
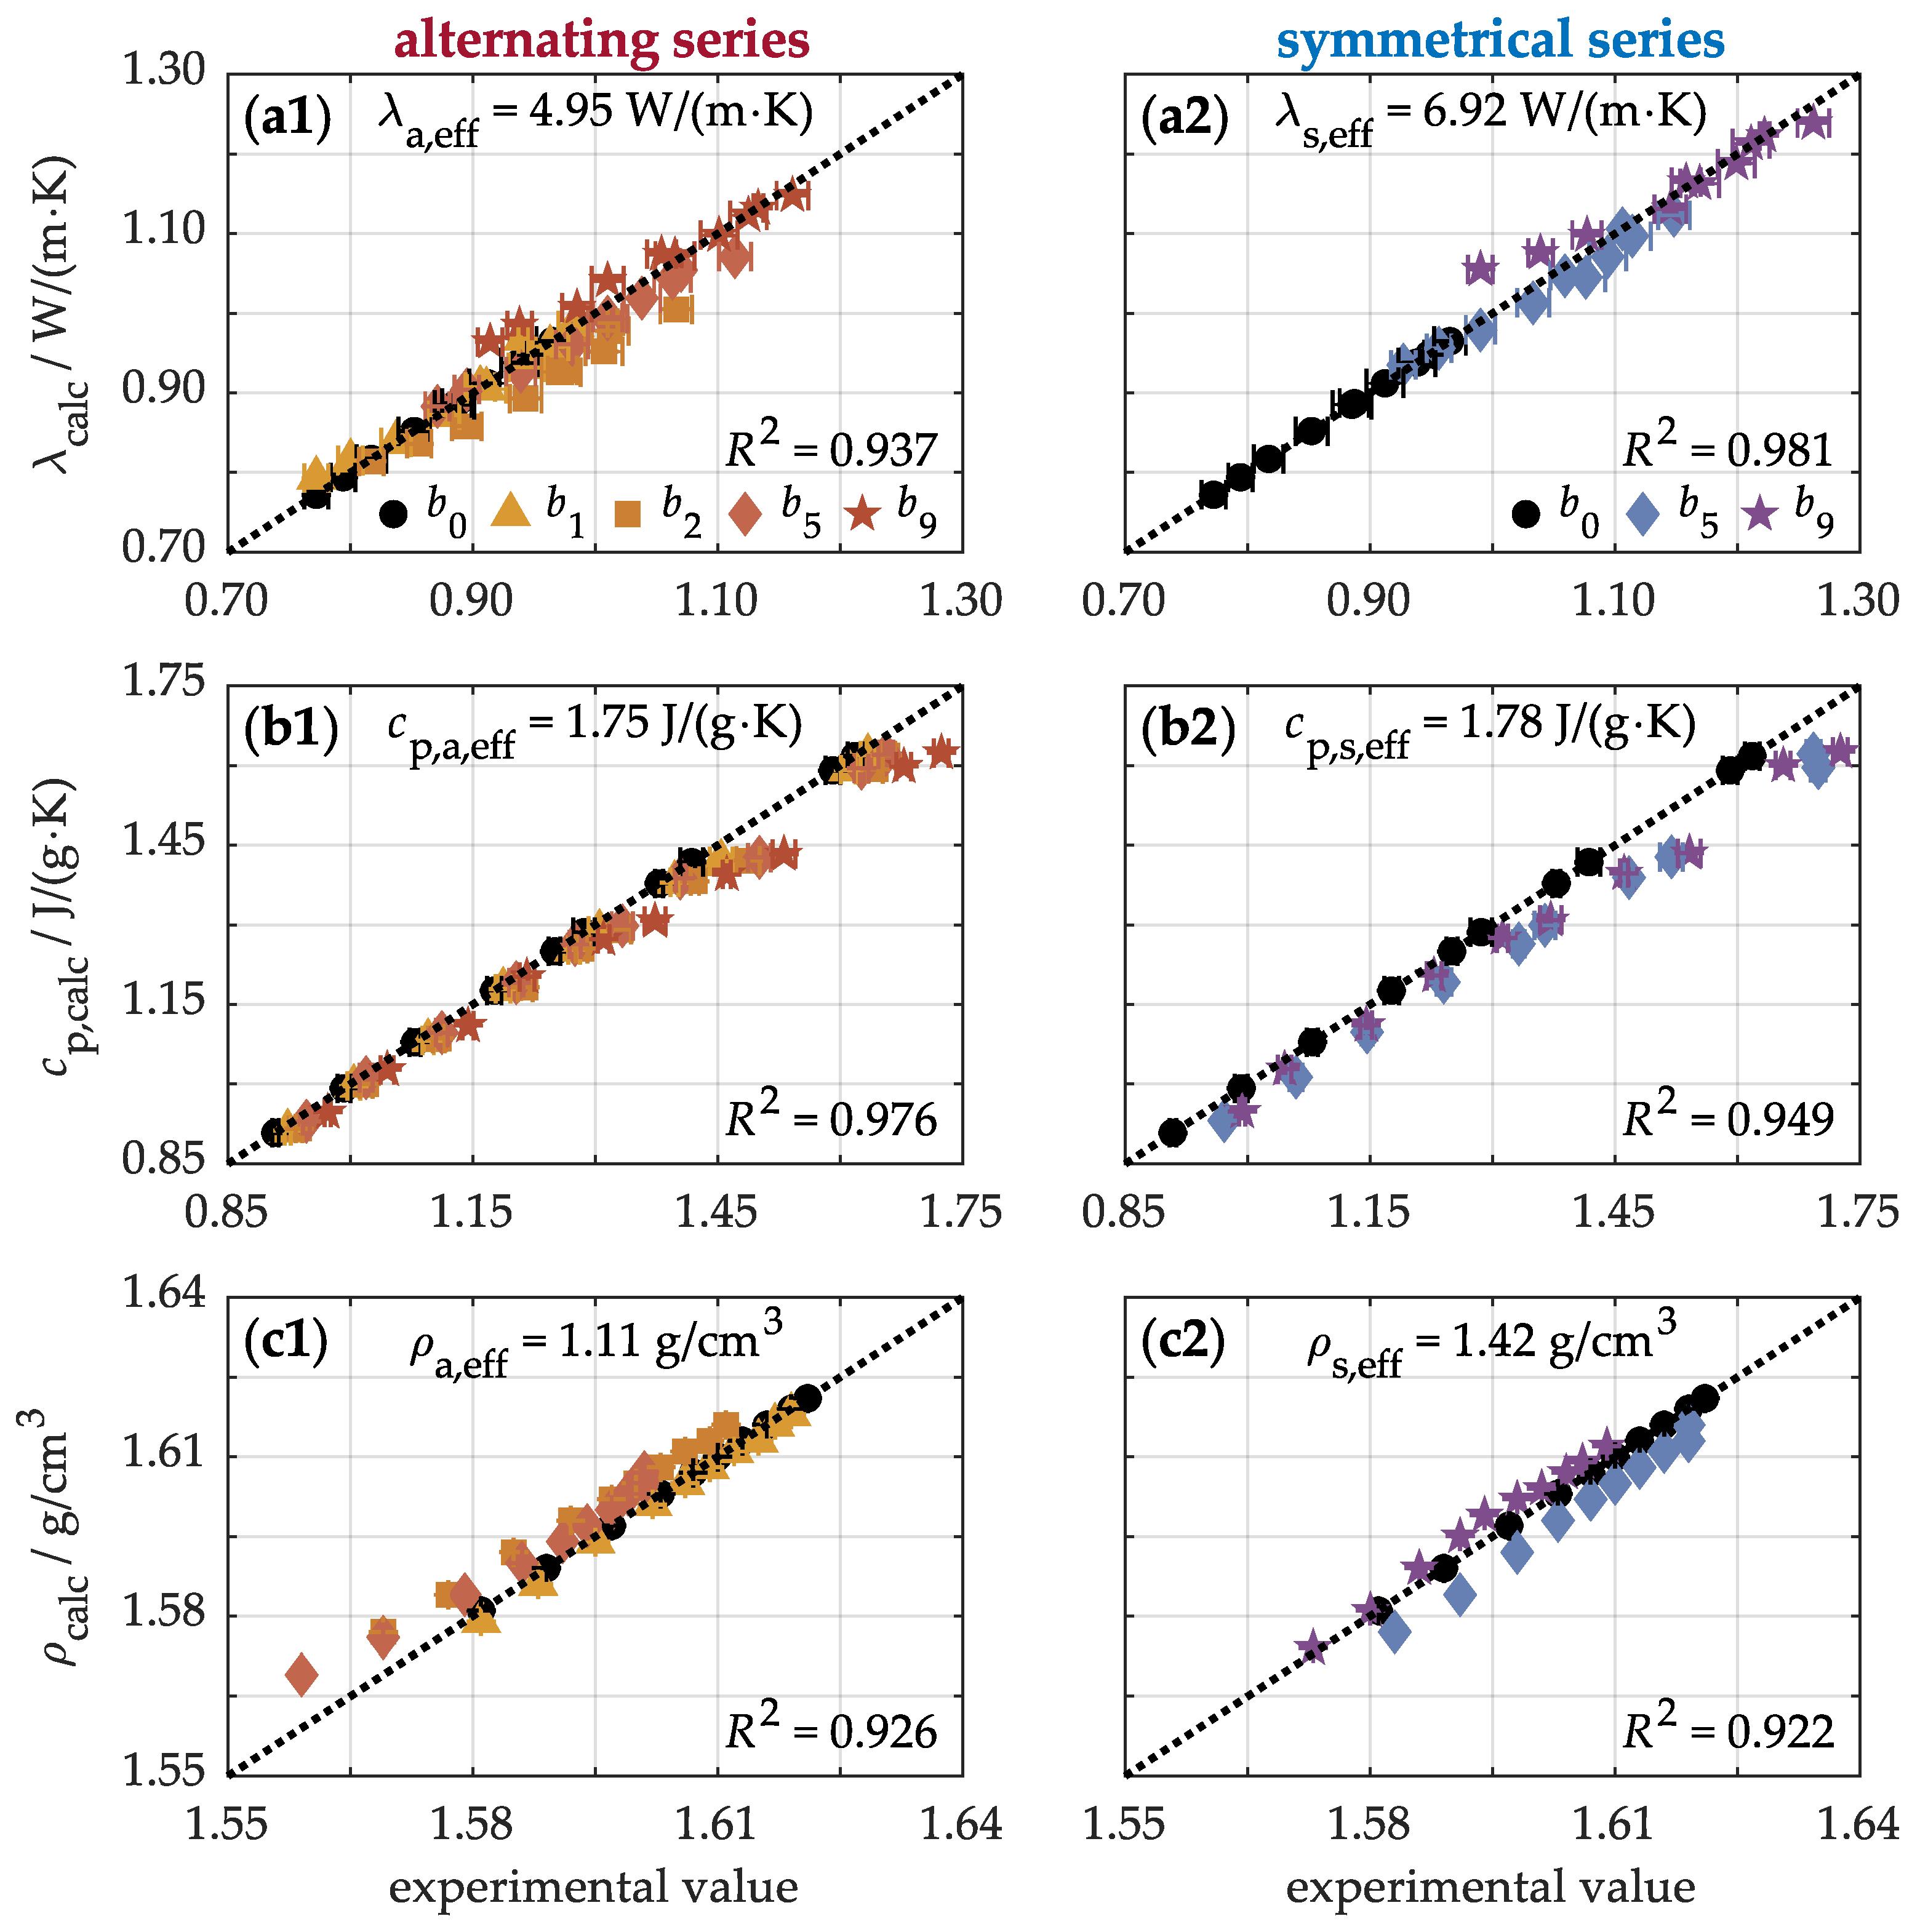
Figure A1 in the
Appendix A compares the calculated to the experimentally measured thermal conductivity at various temperatures. The calculation is performed using Equation (
1) by varying the conductivity of the nanotubes for a given particle fraction and the conductivity of the laminate. The effective conductivity of the nanoparticles is found when the best agreement between the calculated and experimental values is obtained. To meet this condition, the method of least squares is applied by maximizing the coefficient of determination. For example, in the alternating arrangement of the buckypapers (a1), the highest coefficient of determination of
= 0.937 is achieved at an effective thermal conductivity of 4.95 W/(m·K) for the integrated nanotubes, whereas in the symmetric arrangement (a2),
= 0.981 is obtained for 6.92 W/(m·K). Consequently, these nanotubes attain an effective thermal conductivity that is 6 to 9 times higher than that of the composite material itself. However, as observed in the melting process [
24], these calibrated effective conductivities are significantly lower than the theoretical ranges, which can reach 2000 to 6000 W/(m·K) for CNTs [
66]. This discrepancy arises because the nanotubes cannot fully exploit their theoretical potential within the composite, due to factors such as insufficient nanoparticle network density, misalignment of the nanotubes, defects and impurities in the nanotubes, and significant thermal resistance between adjacent particles, all of which limit the effective thermal conductivity.
The effective specific heat capacity and density can be determined analogously using Equation (
1), as illustrated in
Figure A1. A summary of the experimentally determined values for the unmodified material and the calibrated effective values for the nanotubes is provided in
Table 1. The nanotubes exhibit effective specific heat capacities of approximately 1.77 ± 0.02 J/(g·K) and an effective density of about 1.27 ± 0.16 g/cm
3, regardless of the arrangement of the buckypapers within the material. These effective values deviate significantly from the theoretical values for multi-walled carbon nanotubes, which have a specific heat capacity of approximately 0.8 J/(g·K) [
67] and a density of 1.6 g/cm
3 [
67]. This difference results from the fact that the effective values capture the behavior of the nanotubes as part of the matrix and not their properties in the free state. In the case of thermosetting plastics like epoxy resins, the matrix typically exhibits specific heat capacities between 1.7 and 2.0 J/(g·K) [
68] as well as a density of approximately 1.3 g/cm
3 [
15]. Consequently, the interaction between the nanotubes and the matrix causes the effective properties to align more closely with those of the plastic. Overall, the nanoparticles nearly double the specific heat capacity while maintaining only one-third of the density of the unmodified composite material. As a result, the embedded nanoparticles significantly enhance both the thermal storage and the lightweight potential of the composite material.
To validate the calibrated effective values,
Figure 8 compares the modeled data with the experimental results, including a 5% margin of error. This comparison highlights the strong correlation between the modeled and experimental values. For instance, when five buckypapers are incorporated into the composite material in an alternating arrangement (a1), the thermal conductivity is calculated as
= (1 − 0.027)·0.772 W/(m·K) + 0.027·4.95 W/(m·K) = 0.885 W/(m·K). This value aligns well with the experimentally determined thermal conductivity of 0.871 ± 0.032 W/(m·K). Similarly, when the same number of buckypapers are arranged symmetrically (a2), the higher effective thermal conductivity of the nanoparticles results in a calculated value of 0.938 W/(m·K), which closely matches the experimental result of 0.920 ± 0.005 W/(m·K). Beyond thermal conductivity (a1, a2), the approach also accurately predicts the specific heat capacity (b1, b2) and density (c1, c2) of the nanocomposite. Consequently, these findings underscore the reliability of the model in describing the thermal behavior of modified composite materials with buckypapers.
Under thermal loading, these properties determine the heat conduction in the composite material. Heat conduction is naturally described by the following unsteady-state heat conduction equation [
69]:
where
T denotes temperature,
z represents the material depth along the cross-section,
t depicts the exposure time, and
a illustrates the thermal diffusivity. Therefore, thermal diffusivity characterizes the rate at which a temperature change propagates through a material. According to (
2), it is defined as the ratio of a material’s ability to conduct heat to its capacity for storing heat. A high thermal conductivity
facilitates efficient heat transfer through the material, enabling rapid heat dissipation and distribution. Conversely, a high volumetric heat capacity
allows the material to absorb more heat energy before undergoing a significant temperature change, promoting effective heat storage and temperature stabilization.
As shown in
Table 1, the base material exhibits a thermal diffusivity of 0.525 ± 0.007 mm
2/s, resulting from its relatively low thermal conductivity of 0.772 W/(m·K) compared to its volumetric heat capacity of 1.47 J/(cm
3·K). This balance suggests that the material primarily functions as a thermal storage medium. The integration of carbon nanotubes significantly enhances the thermal performance. When arranged in an alternating buckypaper configuration, the nanotubes achieve a five-fold increase in thermal diffusivity of 2.55 ± 0.26 mm
2/s. This improvement is attributed to a substantial increase in effective thermal conductivity to 4.95 W/(m·K), while the effective volumetric heat capacity remains relatively moderate at 1.94 J/(cm
3·K). As a result, the nanotube’s structure behaves more like a heat sink. For example, integrating five buckypapers into the
sample increases the thermal diffusivity to approximately
a = (1 − 0.027)·0.525 mm
2/s + 0.027·2.55 mm
2/s = 0.580 mm
2/s. In a symmetric buckypaper arrangement, nanotubes even achieve a slightly higher diffusivity of 2.73 ± 0.27 mm
2/s. However, due to its higher volumetric heat capacity, the resulting effective thermal diffusivity of the
specimen remains comparable at 0.585 mm
2/s. Thus, the thermal diffusivities for different buckypaper configurations are nearly identical, indicating that heat distribution is predominantly governed by the concentration of carbon nanotubes rather than their specific arrangement.
4.5. Thermo-Induced Damage
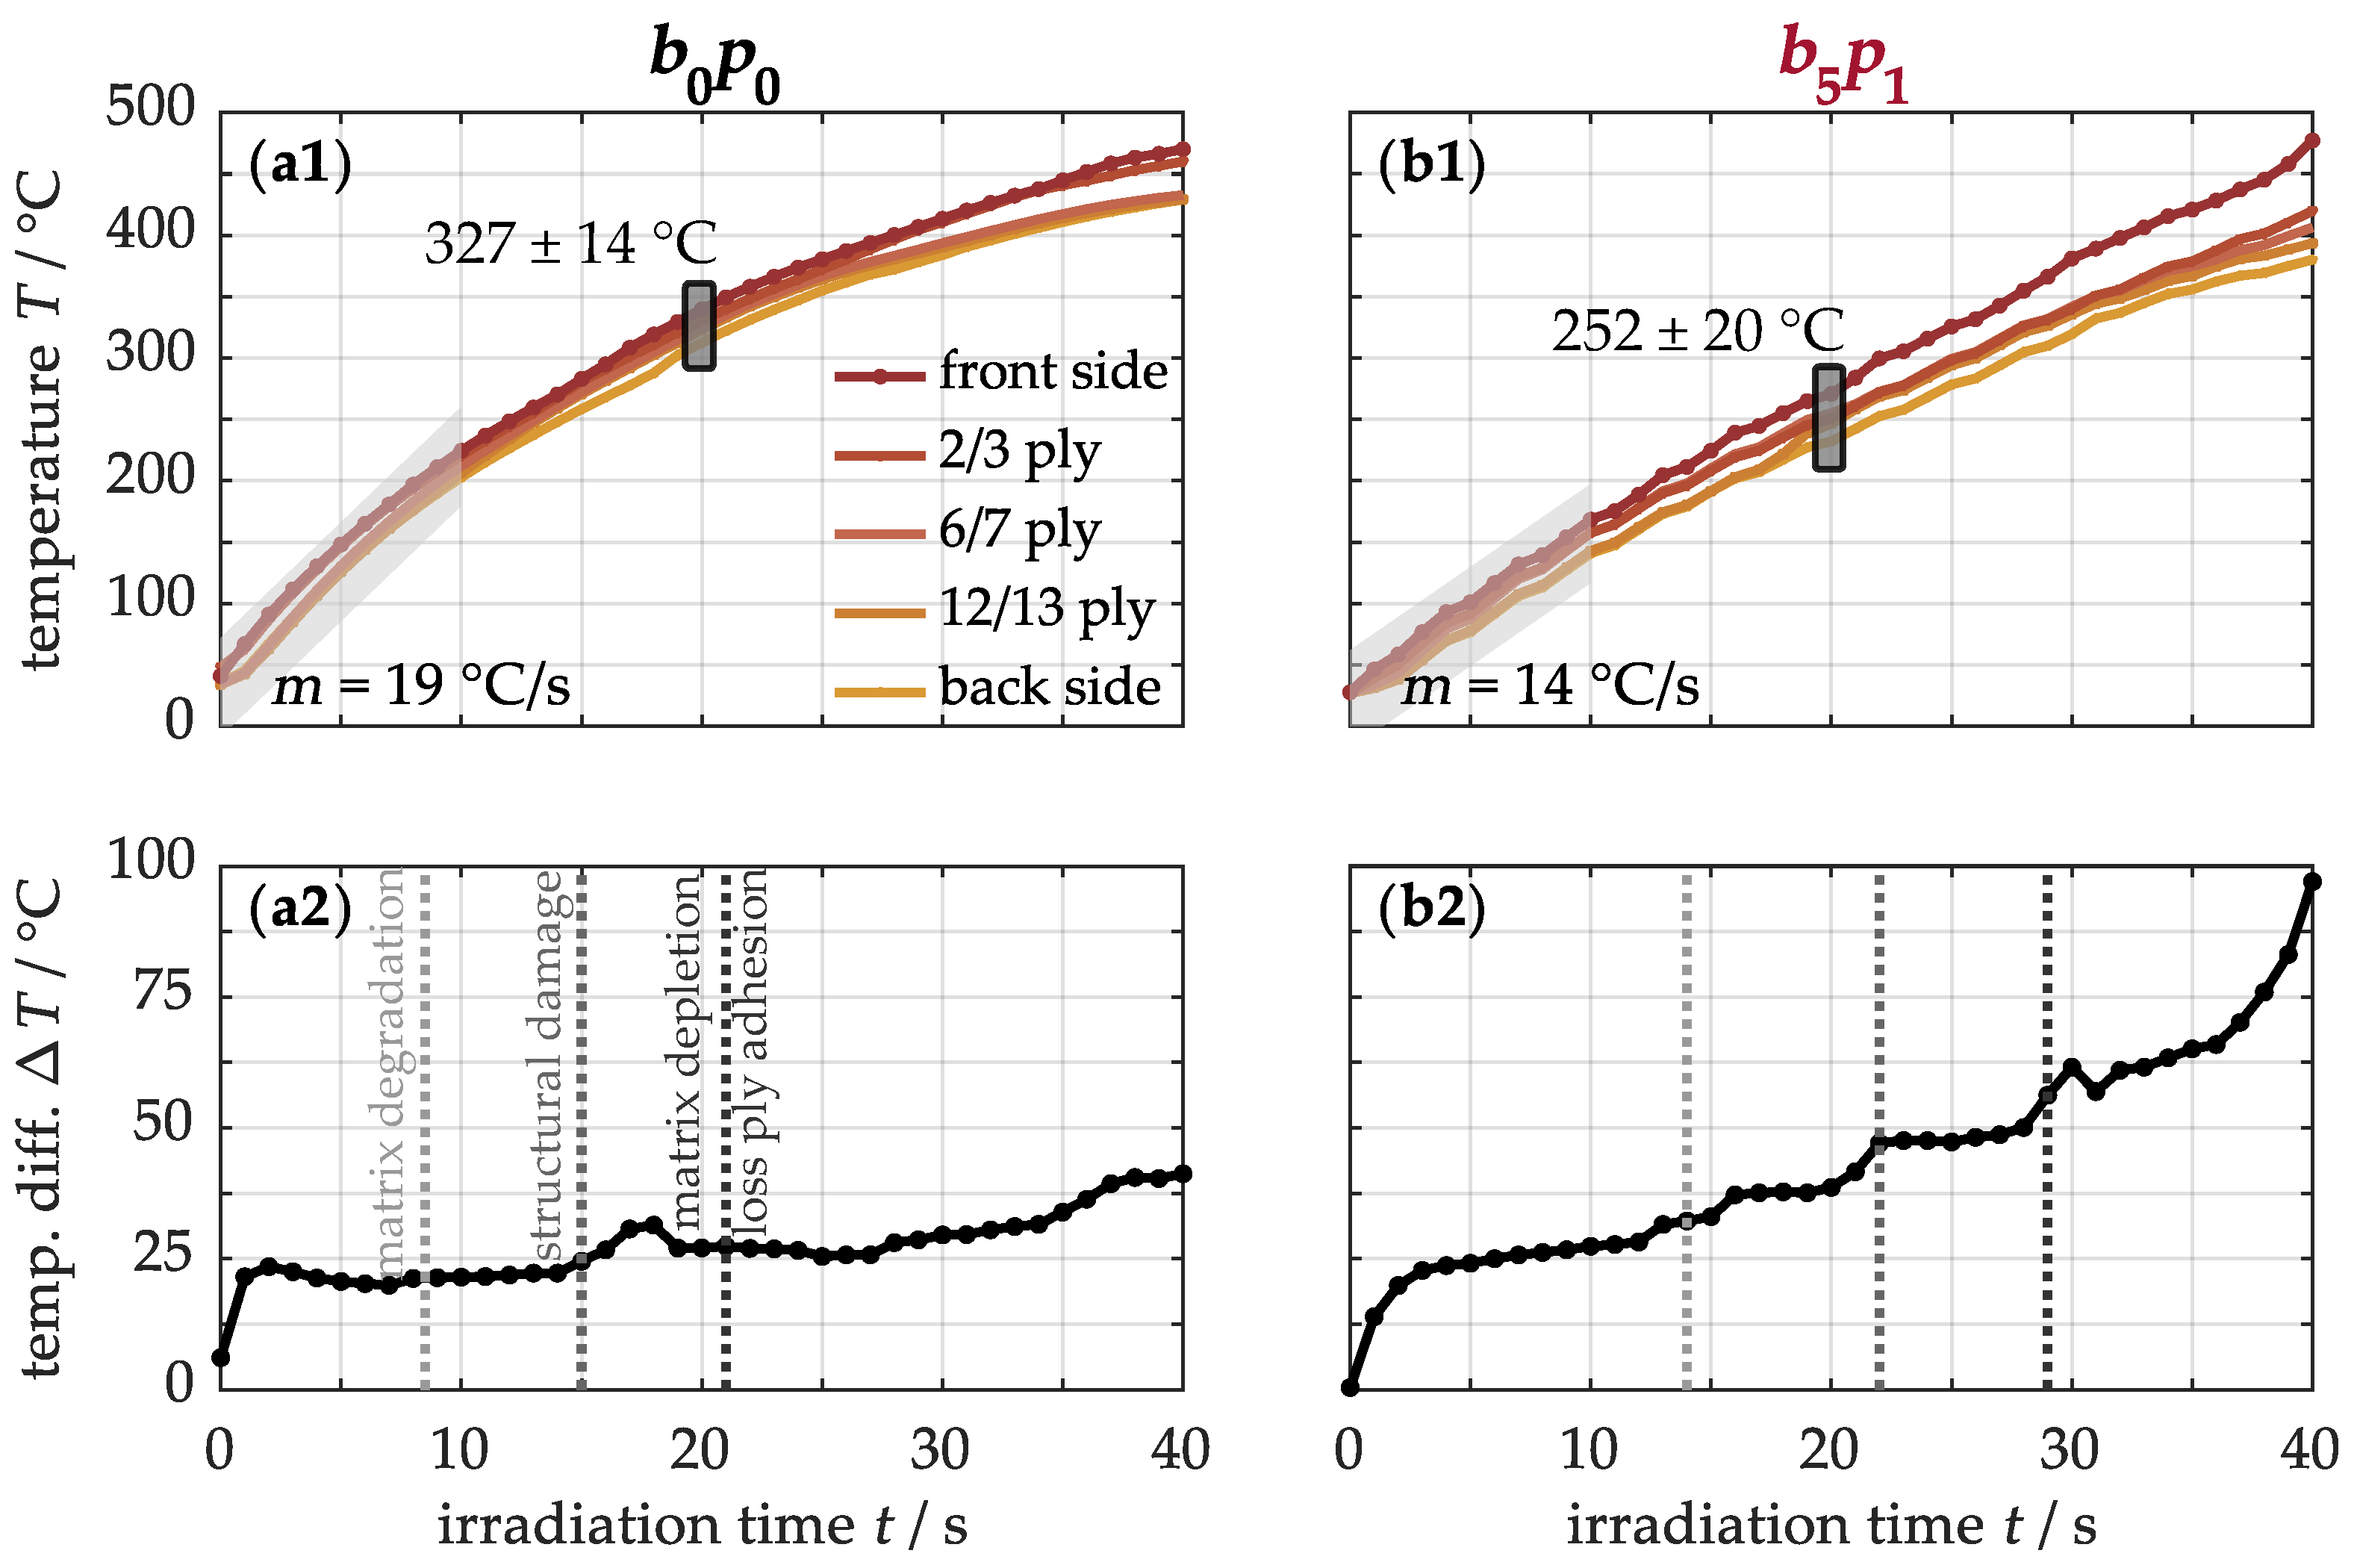
The effects of enhanced heat conduction in nanocomposites on their resistance to one-sided thermal stress are now examined. The focus is on the modified sample, consisting of five buckypapers interleaved with single prepreg plies, as it represents a well-balanced combination of high nanotube concentration and improved thermal properties. For this purpose,
Figure 10 illustrates the temperature profile
T(
z, t) for both the unmodified
sample (a1) and the modified
specimen (b1) under a heat flux of 50 kW/m
2. During thermal loading, the impinging radiative heat is primarily absorbed on the front side and conducted to the cooler back side, forming a temperature gradient along the cross-section. In this process, the unmodified material (a1) initially heats up at a rate of approximately 19 °C/s. With increasing loading time, the heating rate slows down according to the lower temperature rise. This effect is partly caused by the increased reflection of incoming radiation at higher temperatures, as described by the Stefan–Boltzmann law, where radiated power increases with the fourth power of temperature [
70]. As a result, after, for example, 20 s, the material reaches an average temperature of 327 ± 14 °C. In contrast, the modified material (b1) heats up at 14 °C/s, reaching only 252 ± 20 °C under the same conditions. Heat conduction is thus more efficient in the modified material, resulting in lower energy input. However, prolonged exposure also intensifies the temperature gradient along the ply depth.
For a more detailed analysis,
Figure 10 presents the temperature difference between the front and back sides of the non-modified (a2) and modified (b2) samples. After a brief warm-up phase, both materials stabilize at a temperature difference of around 25 °C for several seconds. With continued exposure, the temperature difference in the original material (a2) gradually increases to 41 °C, while the modified material (b2) quickly rises to nearly 100 °C during the loading phase. This suggests a more uneven heat distribution and steeper temperature gradient in the nanocomposite (b2), despite its enhanced thermal conductivity. To identify the cause, the initiation times of various thermo-induced damage processes are also shown in this figure. In the base material (a2), matrix degradation begins from around 8 s, with negligible effects on temperature development. A slight increase can only be observed after 15 s, attributed to the formation of structural damage such as delamination, impairing heat conduction by trapping insulating pyrolysis gases. Beyond 21 s, the temperature gradient rises sharply as the polymer matrix gradually decomposes into these gases and solid pyrolysis residues, further hindering heat transfer. In comparison, thermal damage in the modified material occurs later, but its impact on temperature is more pronounced. This indicates that temperature development is primarily determined by these damage processes, warranting a closer examination in the following section.
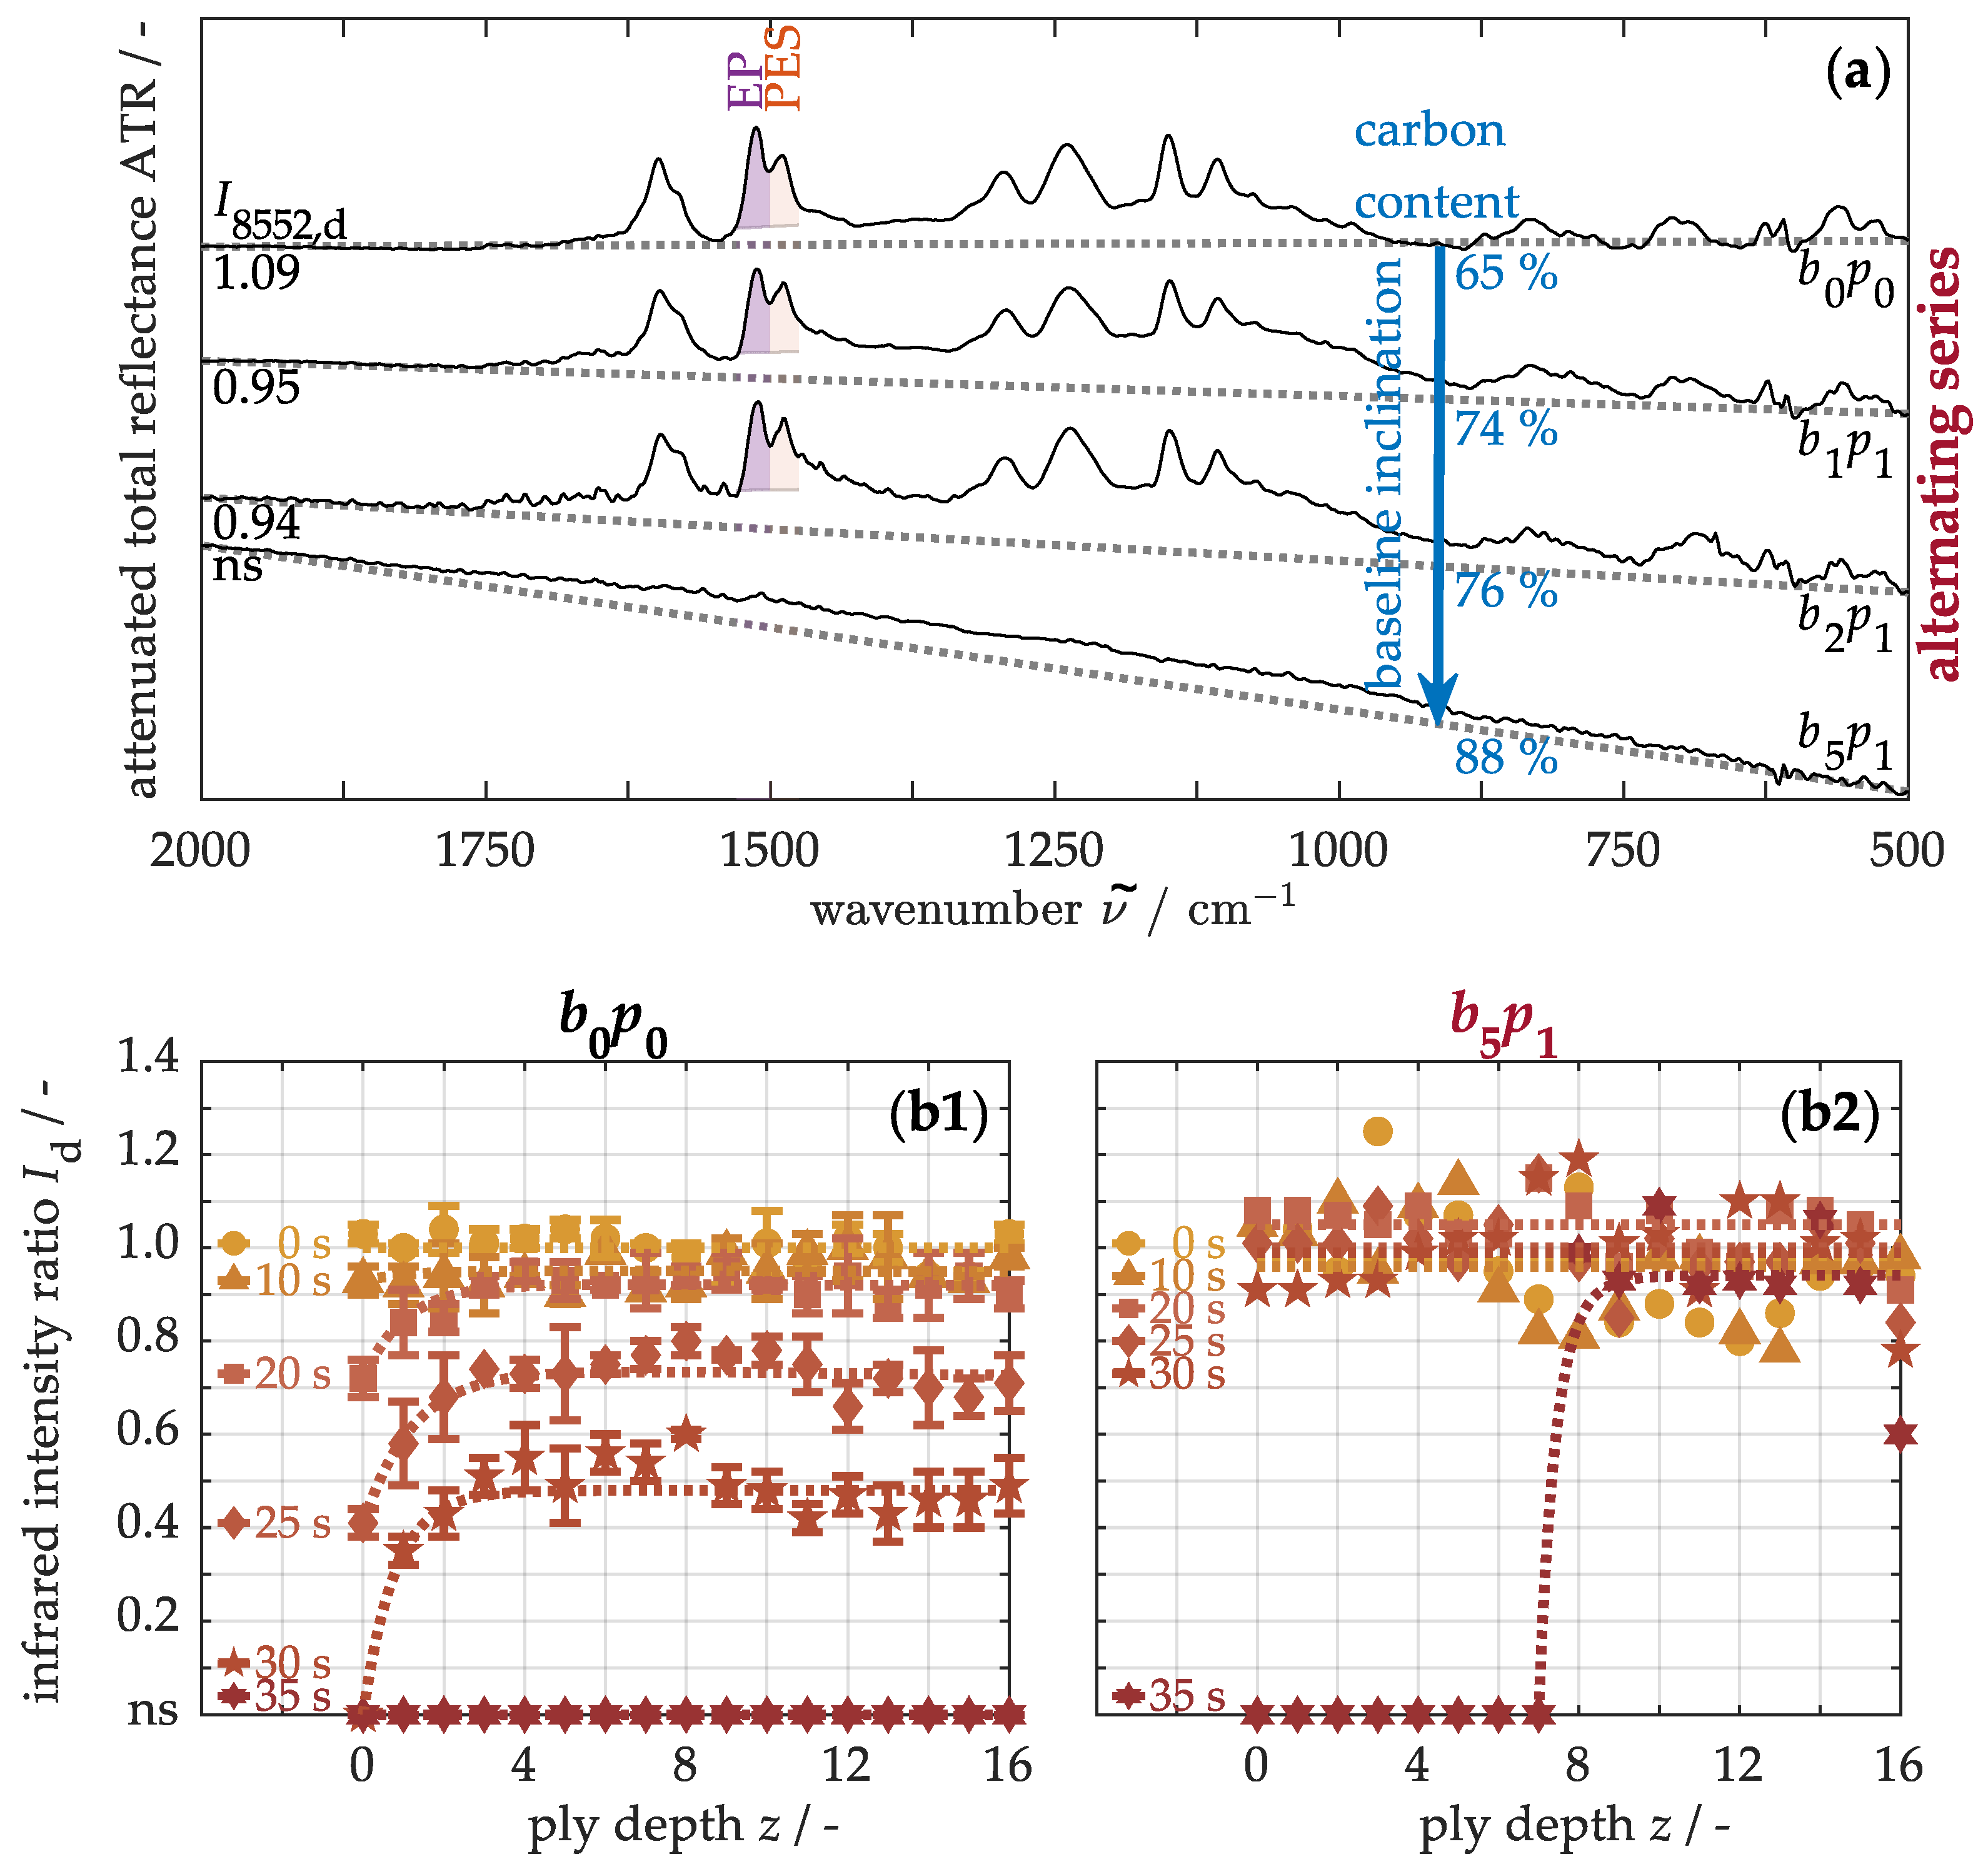
First, the matrix degradation is analyzed using infrared spectroscopy.
Figure 11a shows the infrared spectra from the front side of the materials with alternating buckypaper arrangements. The band at 1510 cm
−1 is assigned to the
(C=C) ring vibration in the aromatic structure of the epoxy resin (EP), while the band at 1486 cm
−1 corresponds to analogous vibrations in polyethersulfone (PES) [
71,
72]. To quantify matrix degradation, band intensities are determined through baseline-corrected integrations within a defined wavenumber range, and the ratio
=
/
is calculated. In the unmodified sample
, this ratio is approximately 1.09, whereas in the nanocomposites, the intensity diminishes progressively with rising buckypaper number, until no infrared signal (ns) is detectable. This development arises from various absorption and scattering effects. During measurement, infrared rays penetrate a few micrometers into the material and excite molecular vibrations. However, energy-dispersive X-ray spectroscopy analyses reveal that the carbon content on the surface increases from 65 to 88% due to the modifications. This increase leads to two effects: First, more incoming infrared radiation is absorbed by the modified surface, reducing the signal-to-noise ratio and thus the accuracy of the infrared band intensity determination. Second, Rayleigh scattering occurs at the infiltrated paper surface, as the structures of carbon nanotubes are significantly smaller than the infrared wavelength [
73]. This wavelength-dependent scattering deflects shorter wavelengths and thus higher wavenumbers more strongly than longer wavelengths [
73]. Consequently, as the carbon content rises, the baseline drops more steeply, distorting the band intensity measurements. Nevertheless, to compare thermo-induced matrix degradation between the original and modified materials, the infrared intensities are considered exclusively in the prepreg regions.
For this,
Figure 11 shows the quantified matrix degradation based on infrared intensity along the ply depth. In the original, untreated material (b1), the intensity remains constant at approximately 1.03 ± 0.03 over the entire cross-section. Only under one-sided thermal stress does the intensity decrease towards the front side after about 20 s due to the decomposition of the epoxy resin. In this initial stage, secondary alcohols in the polymer are predominantly dehydrated [
74]. As thermal stress increases, the intensity loss continues along the ply depth. Therefore, the allylic amine groups in the polymer can be cleaved and converted into volatile components or solid char residues [
75,
76]. After around 30 s, no infrared signal is detectable on the front side, indicating, among other degradation processes, thermoplastic decomposition. The dominant mechanism involves the carbonization of polyethersulfone, releasing sulfur dioxide from the sulfonic group and phenol from the ether group [
77,
78]. Shortly thereafter, both the thermosetting and thermoplastic components are decomposed throughout the material. In comparison, the modified material (b2) shows only a moderate and steady intensity decrease up to 30 s. The damage within the volume of the nanocomposite is thus significantly less pronounced. However, due to the incomplete matrix infiltration of the buckypaper on the front side, the bonding to the adjacent prepreg ply is slightly weakened, so that even moderate matrix degradation can negatively affect both its adhesive and structural properties.
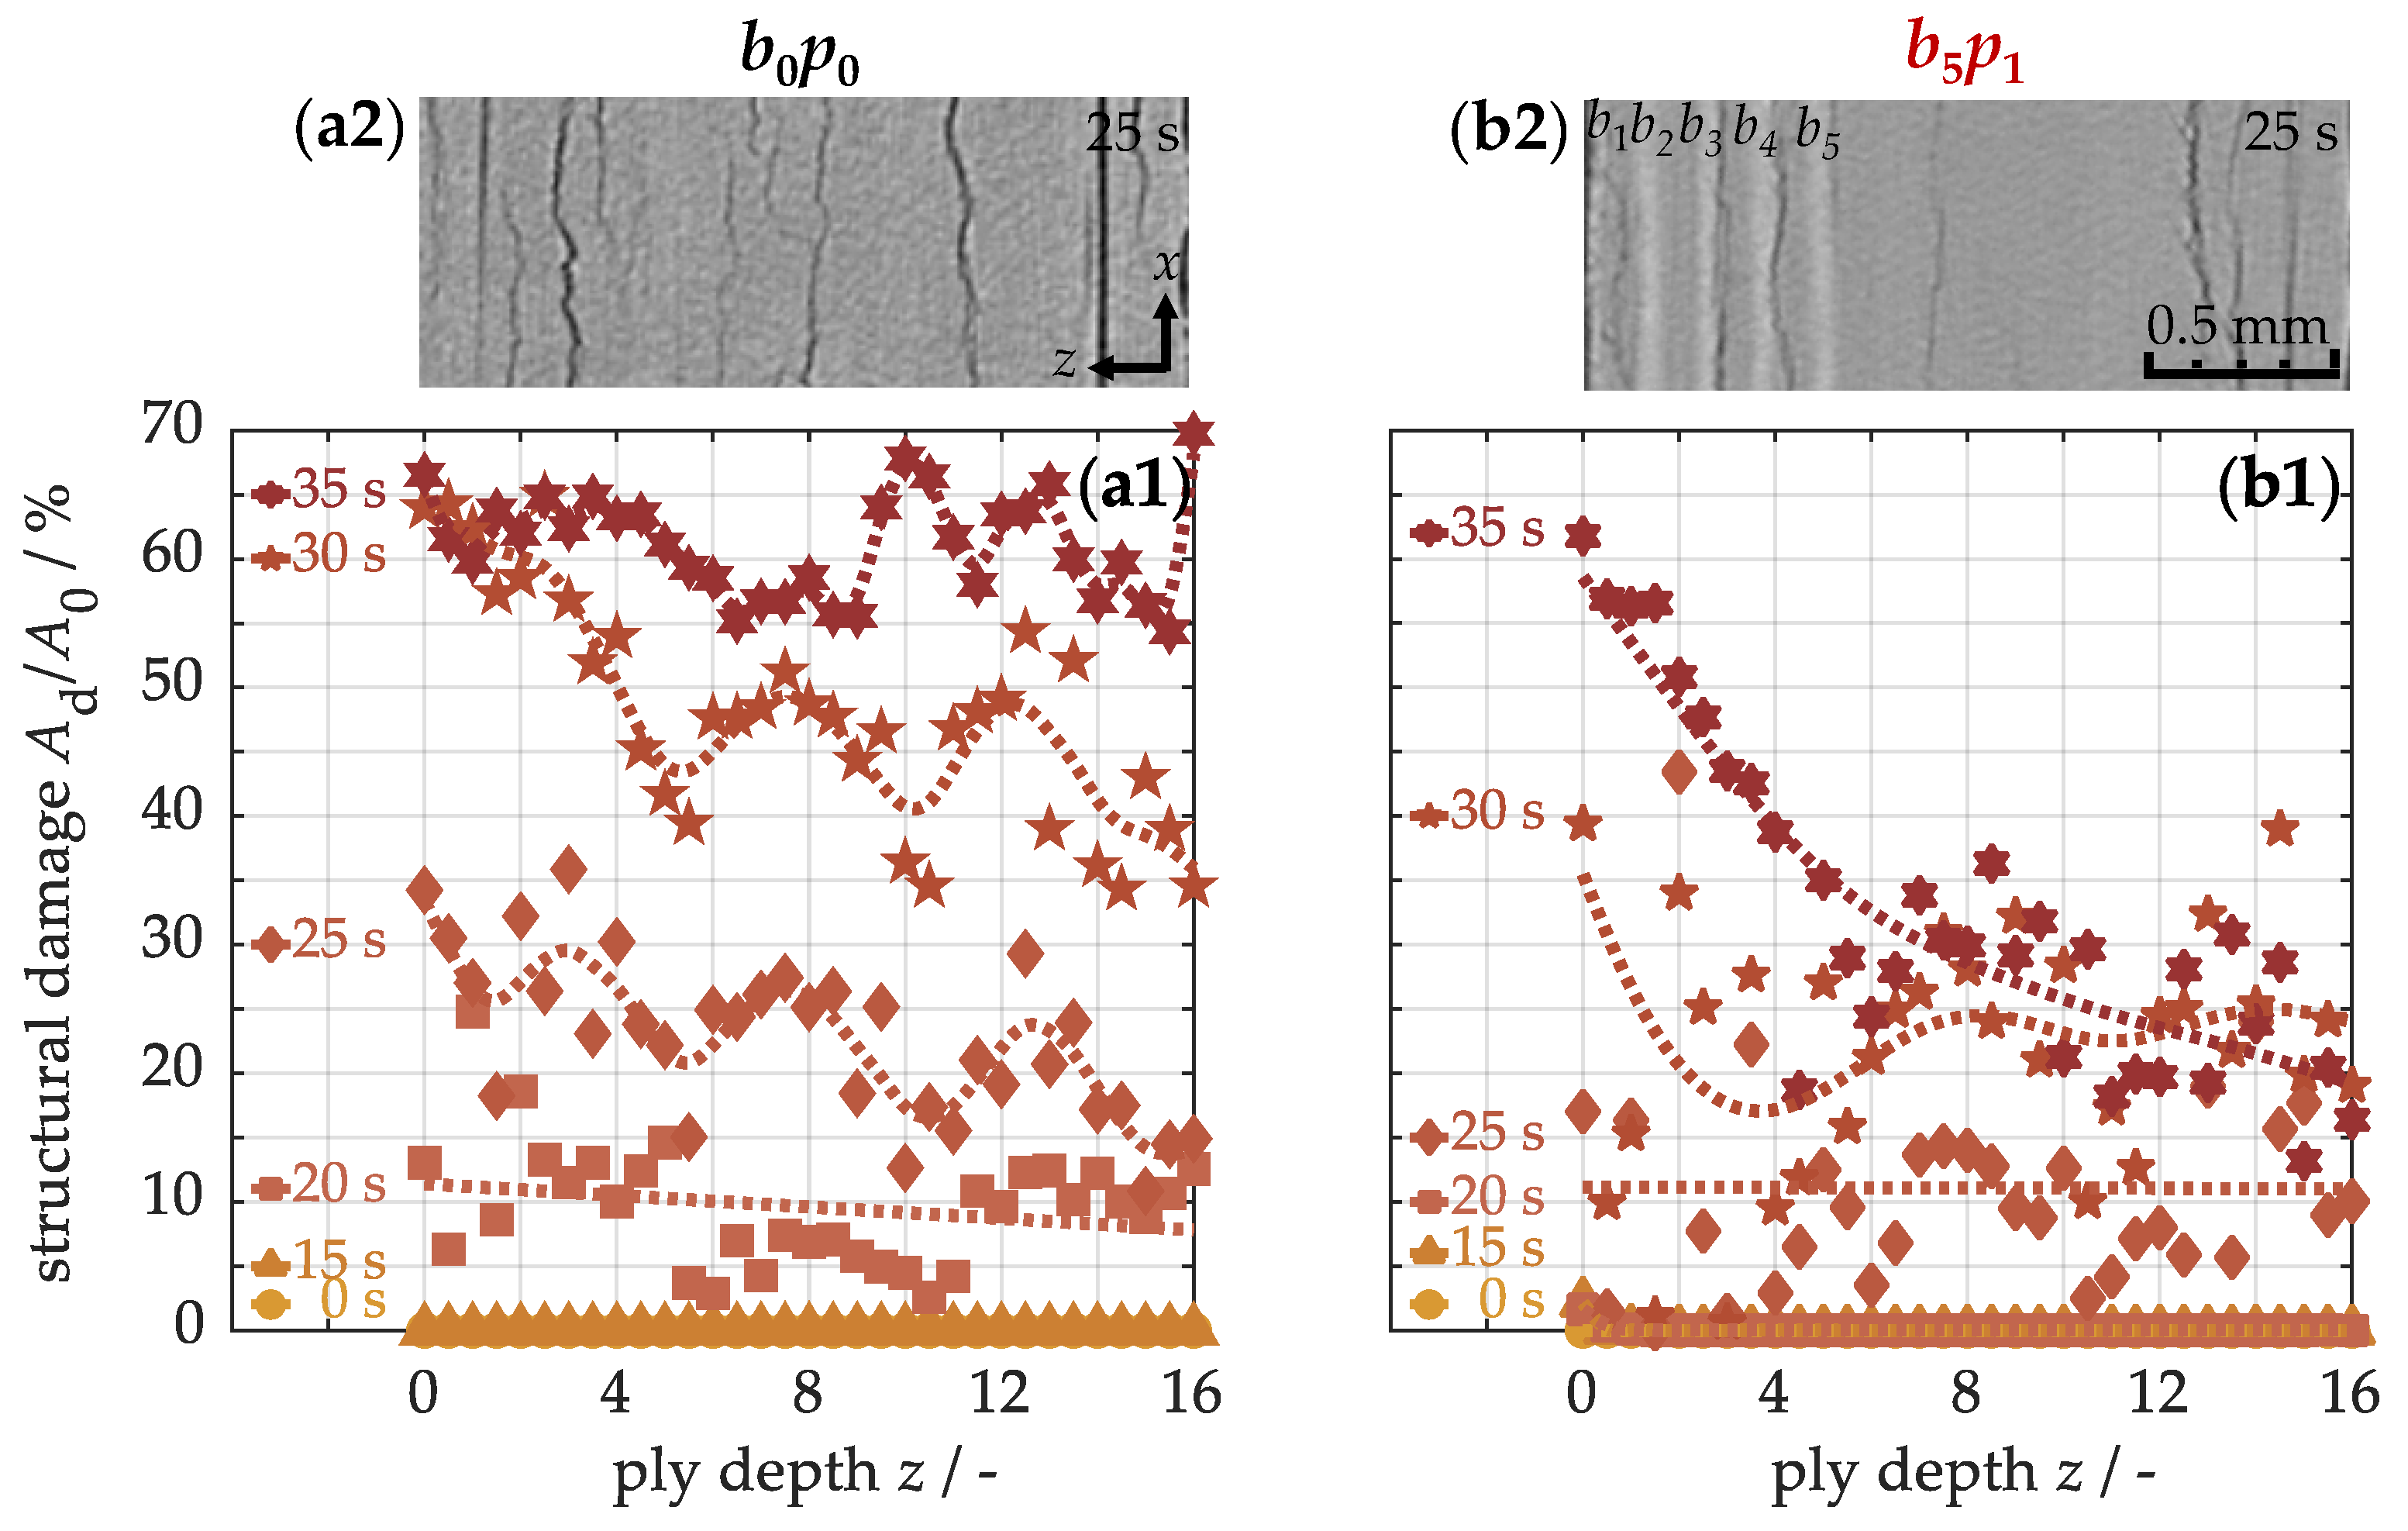
Structural damage was assessed using micro-computed tomography.
Figure 12 illustrates the damaged area as a function of ply depth. In the course of the heating process, delaminations become detectable in the base material (a1) after approximately 20 s. This damage phenomenon results from a combination of thermal stresses within the material and the decomposition of the polymer matrix. Under thermal loading, internal stresses arise due to the mismatch in thermal expansion properties: carbon fibers contract along their axial direction, while the polymer matrix expands isotropically. In the glass transition region, the epoxy resin additionally begins to decompose. Once a critical stress threshold is reached, accompanied by significant matrix degradation, thermo-induced structural damage occurs during relaxation. As heating continues, the damaged area grows due to delamination propagation. Therefore, local maxima can appear along the cross-section, resulting from a stronger detachment of individual plies (a2). However, structural damage in the sample with five integrated buckypapers (b1) forms slightly later. Accordingly, after, e.g., 25 s, the damage in the modified material is less pronounced, both in the quantified analysis (a1 → b1) and in the qualitative representation of the
xz-tomograms (a2 → b2). Under the same loading conditions, the nanocomposite thus consistently exhibits less structural damage. At longer exposure times, however, more pronounced damage gradients develop, rapidly decreasing toward the back side. The cause of this damage distribution will be further examined below.
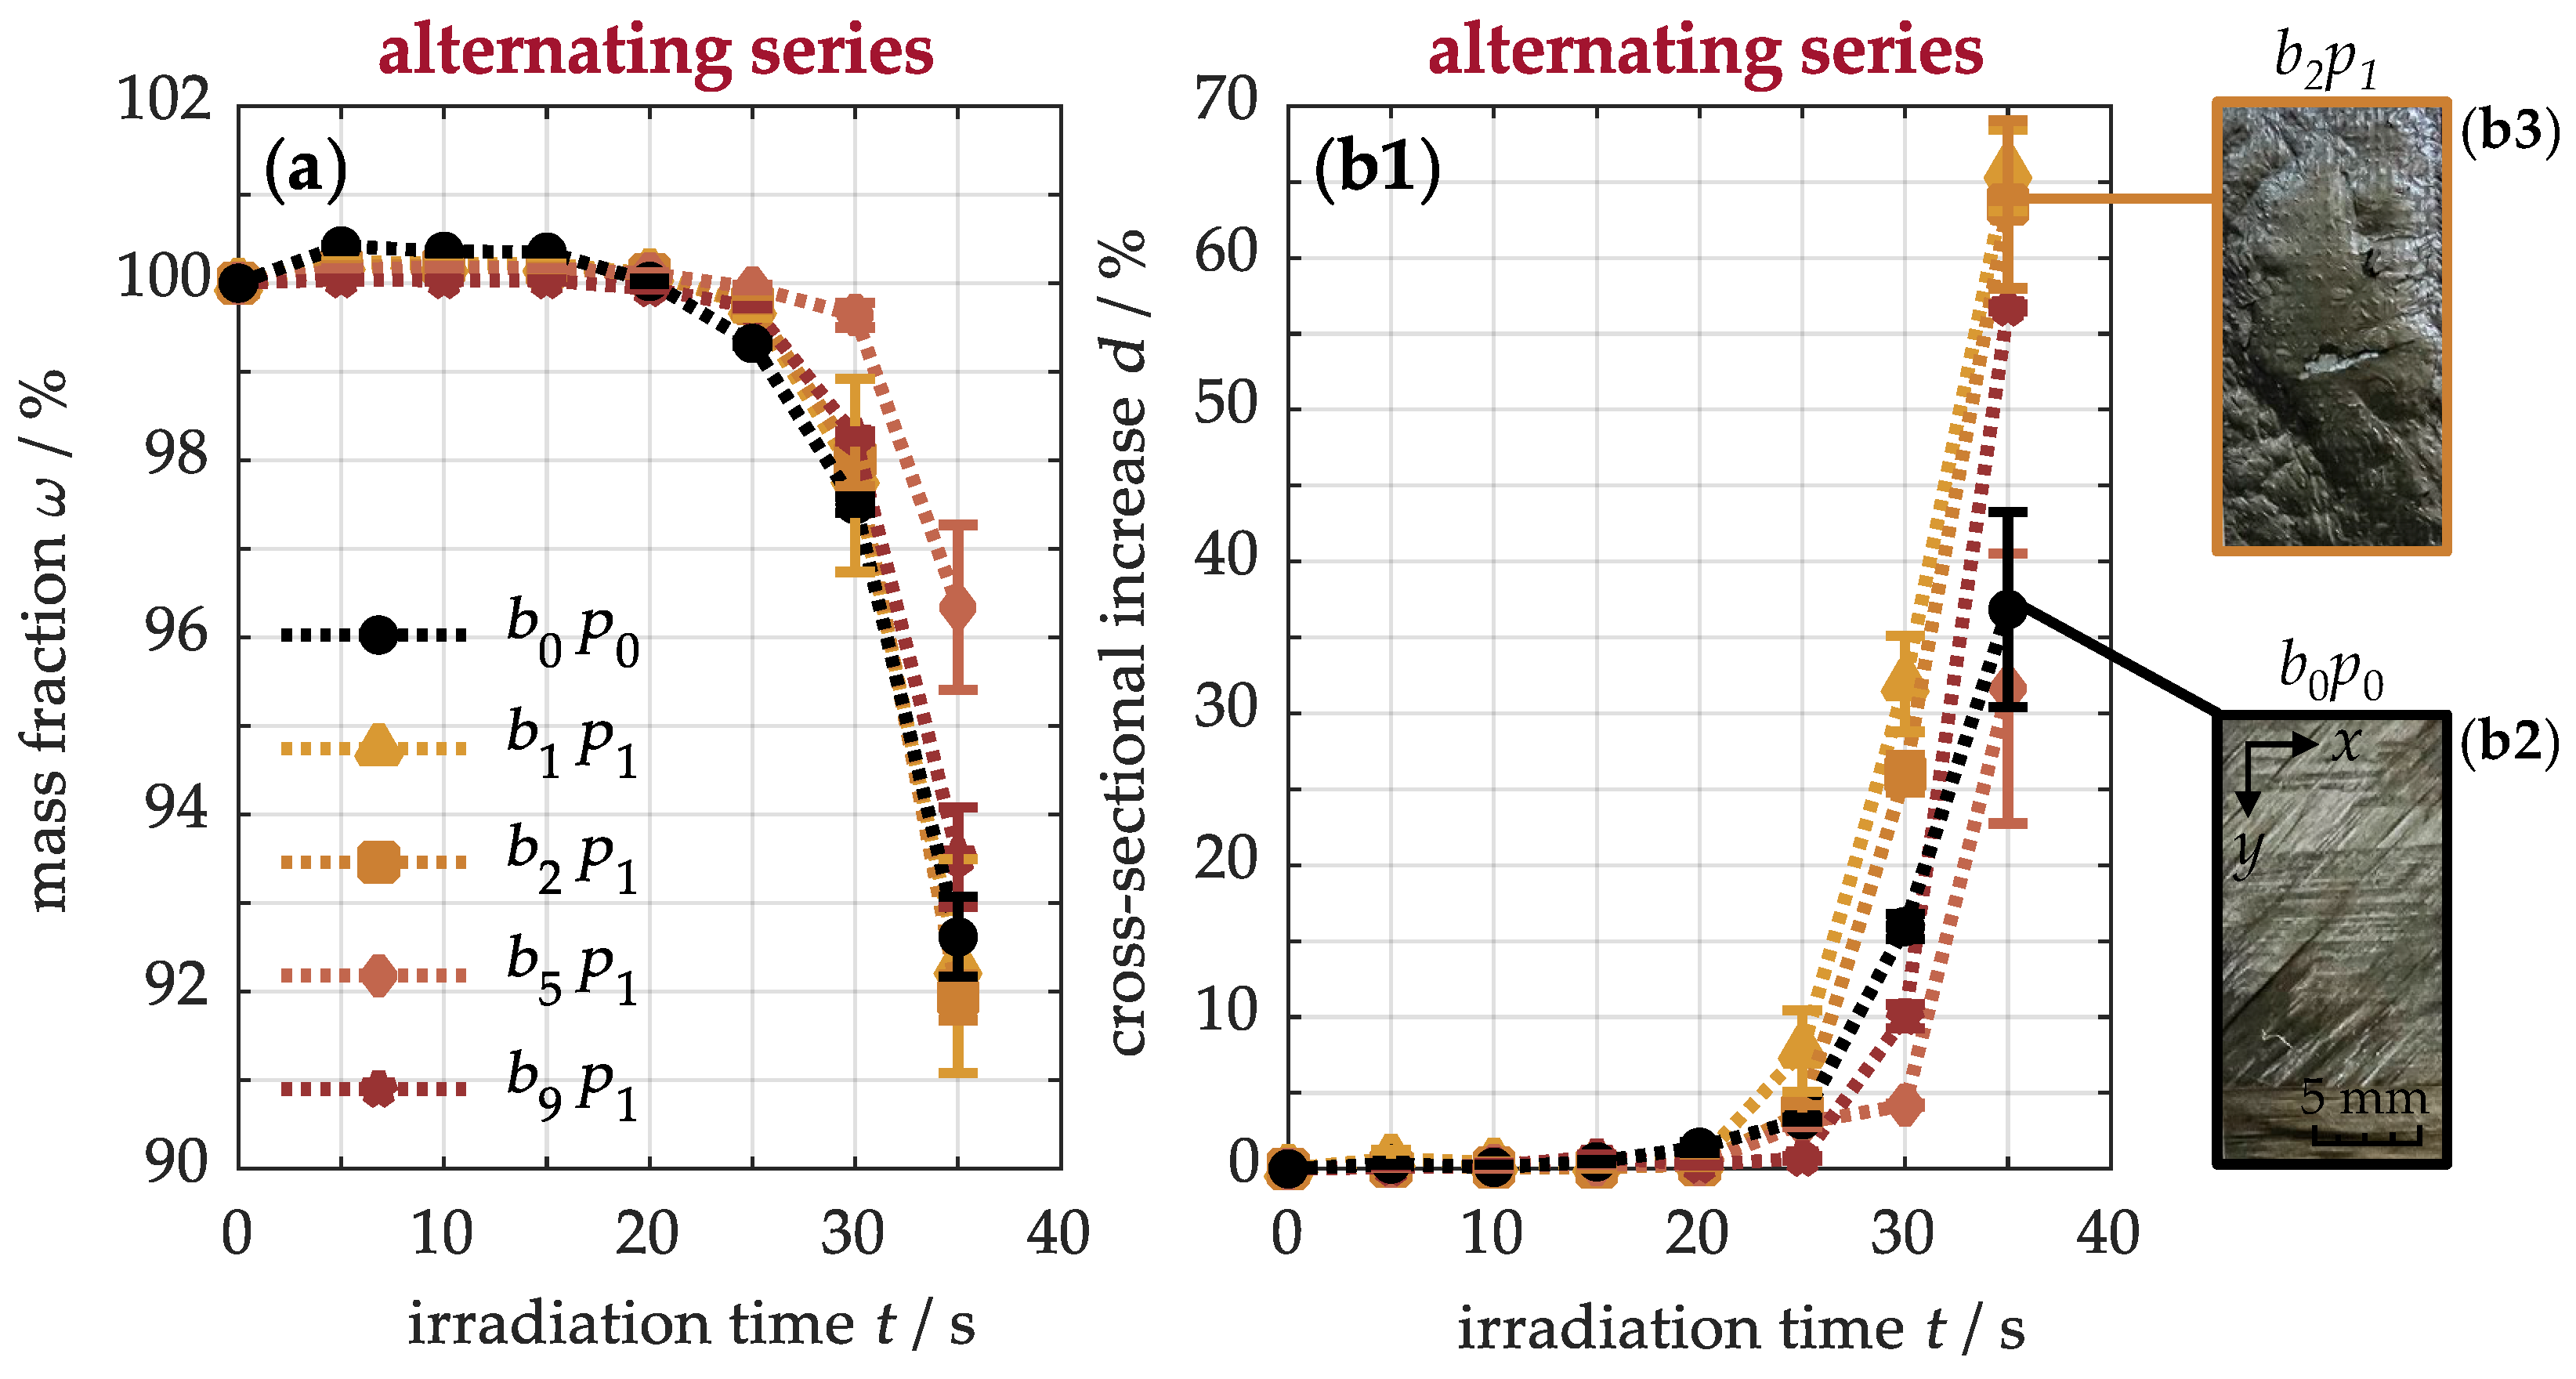
To this end,
Figure 13a shows the mass fraction of the materials after thermal exposure. Initially, the samples gain weight, indicating the formation of oxidation products near the surface. Only after about 20 s does the original
sample rapidly lose mass, while the modified materials, especially the
specimen, show a delayed decrease. This mass depletion results from the decomposition of the polymer matrix into volatile pyrolysis gases, which diffuse to the front side and are released to the environment. This process also affects the interply adhesion, which can be indirectly characterized by the development of the cross-section shown in
Figure 13(b1). Similarly to the weight loss, the material thickness begins to change after approximately 20 s, and subsequently increases by up to 37 ± 6% for the
sample, while the modified
specimen even reaches 64 ± 6%. This expansion occurs because decomposition products are not only released on the surface but also trapped between the plies. In the unmodified material (b2), less expansion is observed, since the pyrolysis gases can escape more freely, as shown in the surface image, where the depleted matrix exposes the carbon fibers in the 45° direction. In contrast, the modified material (b3) expands more noticeably due to the infiltrated buckypaper, which inhibits the diffusion of volatile products. Its dense carbon nanotube network acts as a physical barrier, causing pyrolysis gases to accumulate and inflate the buckypaper. As a result, this region provides thermal insulation, reducing heat flux and protecting the underlying material. This ultimately explains the sharp gradient drop in heat input (
Figure 10), matrix degradation (
Figure 11), and structural damage (
Figure 12). However, in the
sample, the cross-sectional expansion is even less pronounced than in the original material. This is due to delayed damage processes from the improved thermal properties and the incomplete infiltration of the buckypaper, which allows the gases to escape more easily.


