Article

The Air Stability of Sodium Layered Oxide NaTMO2 (100) Surface Investigated via DFT Calculations

1
Beijing Institute of Smart Energy, Beijing 102209, China
2
Key Laboratory of Advanced Optoelectronic Quantum Architecture and Measurement, Ministry of Education, School of Physics, Beijing Institute of Technology, Beijing 100081, China
*
Authors to whom correspondence should be addressed.
Nanomaterials 2025, 15(14), 1067; https://doi.org/10.3390/nano15141067
Submission received: 28 May 2025 / Revised: 22 June 2025 / Accepted: 30 June 2025 / Published: 10 July 2025
(This article belongs to the Special Issue Nanostructured Materials for Energy Storage)

Abstract

Air stability caused by the H2O/CO2 reaction at the layered oxide NaTMO2 surface is one of the main obstacles to commercializing sodium-ion batteries (SIBS). The H2O and CO2 adsorption properties on the (100) surface of sodium layered transition metal oxide NaTMO2 (TM = Co, Ni, Mo, Nd) are calculated using the DFT method to study the surface air stability. This study showed that the material bulk phase (symmetry), surface site, element type, and surface termination are all (though not the only) important factors that affect the adsorption strength. Contrary to previous studies, the P phase is not always more air-stable than the O phase; our calculations showed that the NaNiO2 O phase is more stable than the P phase. The calculated band center and occupation showed a direct relationship with the adsorption energy. The Na site adsorption for CO2 and H2O showed the same V-shape trend. However, the TM adsorption for CO2 and H2O showed a different trend. With an increased t2g band center, CO2 adsorption strength increases. There is no clear trend for H2O adsorption. Our calculations showed that the electronic structure of the surface atomic of adsorption site plays a decisive role in CO2 and H2O adsorption strength. This study demonstrated an effective method for obtaining a stability parameter regarding the electronic structure, which can be used to screen the air-stable layered oxide sodium cathode in the future.

1. Introduction

Fossil fuels, such as coal, oil, and natural gas, lay a critical material foundation for human survival and development, supporting societal progress and improving living standards. However, the excessive demand for fossil energy generates environmental pollution and global warming issues. Thus, searching for green and renewable alternatives (solar, wind, tidal energy, etc.) is a priority towards building a sustainable future [1,2,3]. Battery energy storage is preferred over other energy storage systems (ESSs) due to its high efficiency, long cycle life, and easier transmission via smart grids with high energy conversion efficiency [4]. With technological advances, the lithium-ion battery (LIBS) market has greatly expanded over the past ten years with the emergence of various electronic mobile devices, vehicles and the widespread applicatedenergy storage devices [5,6]. Nevertheless, continuously supplying LIBS is challenging due to the inadequate and maldistributed lithium in the Earth. In contrast, sodium has physical and electrochemical properties similar to lithium, but it is more abundant, with a crustal abundance of 2.64%. Therefore, sodium-ion batteries (SIBS) are gradually gaining more attention as a rechargeable battery alternative to lithium due to their advantages, including low cost, high safety, and high energy density.
A global effort has been made to accelerate SIBS commercialization. The cathode material is the well-known key factor that determines SIBS energy density [7,8], which can be primarily divided into polyanionic compounds, layered transition metal oxides, Prussian blue analogs, and metal–organic materials [9]. Among them, layered transition metal oxides have generally been used by virtue of their simple structure, facile synthesis, and high specific capacity. However, some challenges limit further adoption of layered transition metal oxides, such as air instability, short lifespan, and phase transition during battery cycling [9,10,11]. In particular, high air sensitivity has gained significant attention since it is the intrinsic spark that causes many negative effects, such as structure instability, capacity decay, and cycling reduction [12,13]. Thus, we must study the origin of air instability and take measures to prevent these negative effects [12]. To accelerate the commercialization of sodium-ion batteries, it is particularly important to explore the air stability of layered oxide cathode materials. Pan’s group comprehensively studied O3-phase NaNi1/3Fe1/3Mn1/3O2 materials under atmospheric conditions by controlling humidity and temperature and found that carbon dioxide was initially inserted into the sodium layer along the material surface (003), causing sodium carbonate to begin to grow between the metal layers, which further led to material structure destruction [14]. Pan et al. also found that the edges of (003) were more susceptible to moist air than the planes of (003) [14]. Hu’s group synthesized the O3-phase Na0.9[Cu0.22Fe0.30Mn0.48]O2 material without traditional Co and Ni and found that it was very stable in aqueous environments [12]. The reason for this is that both copper and iron are electrochemically active, and Cu2+/Cu3+ and Fe3+/Fe4+ redox is mainly responsible for the charge compensation mechanism, introducing copper into the layered oxide, increasing the average storage voltage, to avoid oxidation, along with the formation of different surface structures and compositions, thus protecting the material from direct contact with air. Malachi et al. studied the high-entropy and Co-free sodium-ion layered fluoride oxide and found that introducing Li to replace part of Na can reduce the shielding effect of sodium ions, thereby enhancing the oxidation resistance of the material and inhibiting the harmful reaction between the material and air. Among them, Na0.9Li0.1 is particularly prominent [15]. Huang et al. reported that Li/Mg co-doped Manganese/nickel-based layered transition metal oxides showed enhanced cycling stability due to the O-2p nonbonding states from Li and Mg–O bonds stabilizing the Ni–O eg states [16]. Manthiram et al. found that adding a 1 wt % (more than 1% reduces initial capacity) (NaPO3)n coating to O3-phase (Ni0.3Fe0.4Mn0.3)O2 materials can significantly improve their air stability, as sodium polyphosphate is converted into water and sodium phosphate into moist air to protect the layered structure [17]. Wei et al. also reported that O3-type Na0.96Ca0.02Ni0.25Fe0.5Mn0.25O2 delivered a reversible capacity of 122.1 mAh·g−1 at 10 mA·g−1, with a capacity retention of 83.4% after 200 cycles at 50 mA·g−1 and a good rate capability [18]. Zhang et al. also reported that a Ca-doped O3-type phase material with different ratios of Ni/Fe/Mn showed good air stability [19].
At the same time, researchers have been studying the air stability of P-phase layered materials. Chen et al. reported that Nb-doped Na0.67Mn0.67Ni0.33Nb0.03O2 could exhibit superior performance and outstanding cycling in a half cell after exposure in a moisture atmosphere (RH 93%) for 20 days [20]. Yin et al. observed that a Li-doped P2-type Na0.67Li0.1(Mn0.7Ni0.2Cu0.1)0.9O2 (NLMNC) cathode demonstrated good cycling performance after storage in air for 7 days, almost overlaying that of the pristine sample [21]. Liu et al. reported an air-stable single-crystal P2-type Na2/3Ni1/3Mn1/3Ti1/3O2 with reversible phase transitions (P2-OP4) [22]. Yang et al. used a simple second-sintering strategy to enhance NFM air stability by removing impurities and retrieving surface-precipitated Na+from the crystalline host [23]. Gu et al. designed and synthesized a novel air-stabilized P2-phase Na7/9Cu2/9Fe1/9Mn2/3O2, which has excellent reversible capacity (89 m Ah g−1 at 0.1c) and cycling stability (85% capacity retention after 150 cycles at 1c) [24]. Chen et al. compared P2-phase Na0.6MnO2 and Na0.6Mn0.9Cu0.1O2 and found that doping Cu2+ can effectively inhibit the Jahn–Teller effect of Mn3+ and improve the Na+/vacancy-ordering transition, thereby enhancing its air stability [25]. Zhou et al. designed and successfully prepared P3-phase Na2/3Ni1/4Mg1/12Mn2/3O2 sodium-ion battery cathode material, which is a good high-voltage air-stabilized material with high air stability (especially able to resist a large amount of water) and electrochemical utilization, and it can inhibit the phase transition at high voltage, thus realizing high-efficiency sodium storage [26]. Zuo et al. successfully extended the Na+ layer spacing of P2-phase Na0.67MnO2 via a water-mediated method (which is also feasible in other sodium-ion layered oxides), improving structural stability and Na+ mobility [27]. The material formed a hydrated phase with water in humid air and thus has good moisture resistance for atmospheric storage [27].
An increasing number of materials are being reported with different degrees of air stability. However, we are still lacking a structural parameter that measures stability. The reason for the poor air stability (mainly water and carbon dioxide) of sodium layered oxide materials is also not clear. In this study, we investigated the air stability of 3d- NaCoO2 and NaNiO2, 4d- NaNbO2 [28,29] and NaMoO2 [30,31] materials through DFT calculations for their O and P phases [32,33,34], respectively, which include a series of calculations of surface energies, work functions of the surface and adsorption energies of water and carbon dioxide [35]. More importantly, the O3 phase provides additional sodium storage sites, thereby increasing the material’s capacity over the P2 phase. However, previous studies showed that the O3 phase encounters a more severe air stability problem than the P2 phase. Thus, the exploration method for establishing an air stabilization strategy for the O3 phase is also very important. Our DFT calculation study contradicted the general belief that the P2 phase is always more stable than the O3 phase. Symmetry is not the only factor that determines air stability. This study outlines the key roles of the eletron structure for the determination of adsorption energy of the CO2/H2O, which will open a new door to searching and tuning for new stable O3-phase layered materials with higher capacities.

2. Computation Details

First-principle calculations, based on the density functional theory (DFT), were performed with generalized gradient approximation (GGA). Core electron states were represented by the projector augmented-wave method [36], as implemented in the Vienna ab initio simulation package (VASP) [37]. The R2SCAN [38] exchange correlation functional and a plane-wave representation for the wave function with a cut-off energy of 450 eV were used. The experimental lattice parameter was adopted, and the atomic position was fully relaxed and optimized with an atomic force convergence of 0.01 eV/Å and energy convergence of 0.1 meV before electron structure and total energy calculations.
The surface energy of a flat plate model with the Miller exponent (hkl) is given as follows [39]:
γ = E s l a b E b u l k × N E ( N a / T M / O ) × N ( N a / T M / O ) 2 × A s l a b
where Eslab is the total energy of the plate model, Ebulk is the energy of unit cell, E(Na/TM/O) is the chemical potential of the excess atoms contained in the slab, N is the number of cells in the plate model, and Aslab is the plate surface area.
H2O and CO2 adsorption energy calculation is expressed as follows:
E = E * + m o l E * E m o l
where E * is the surface energy, and E m o l is the H2O or CO2 energy.

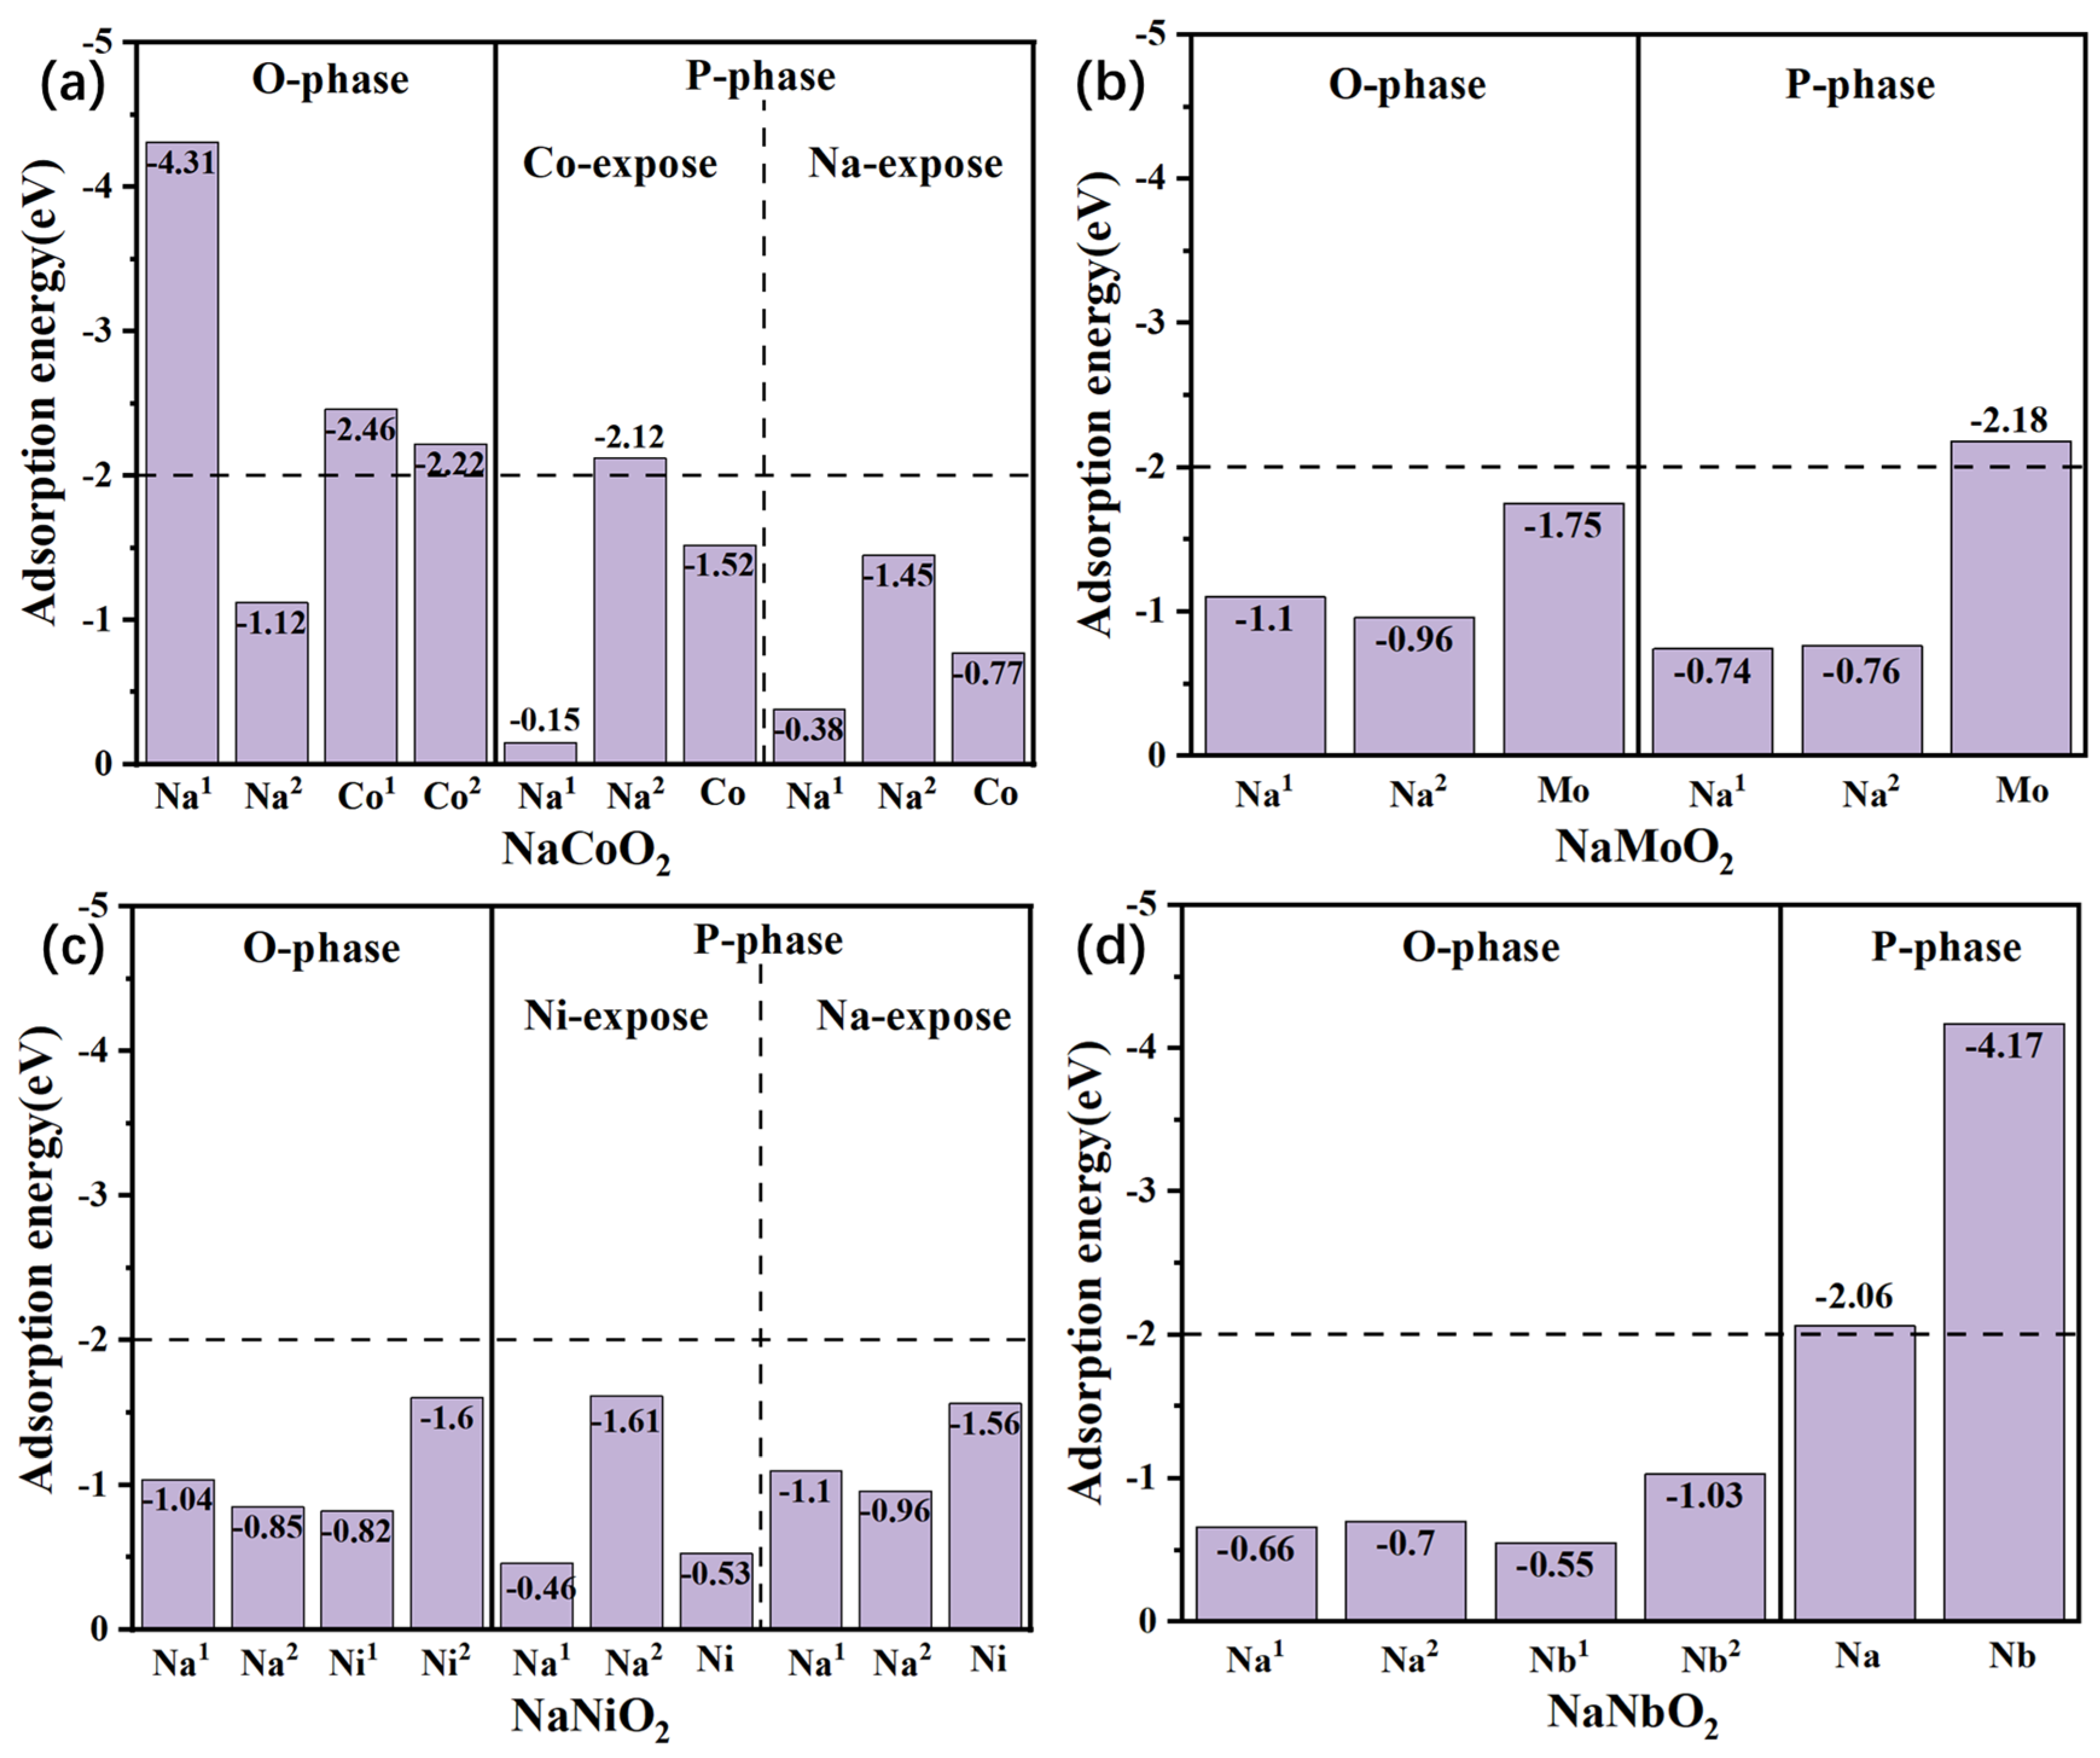
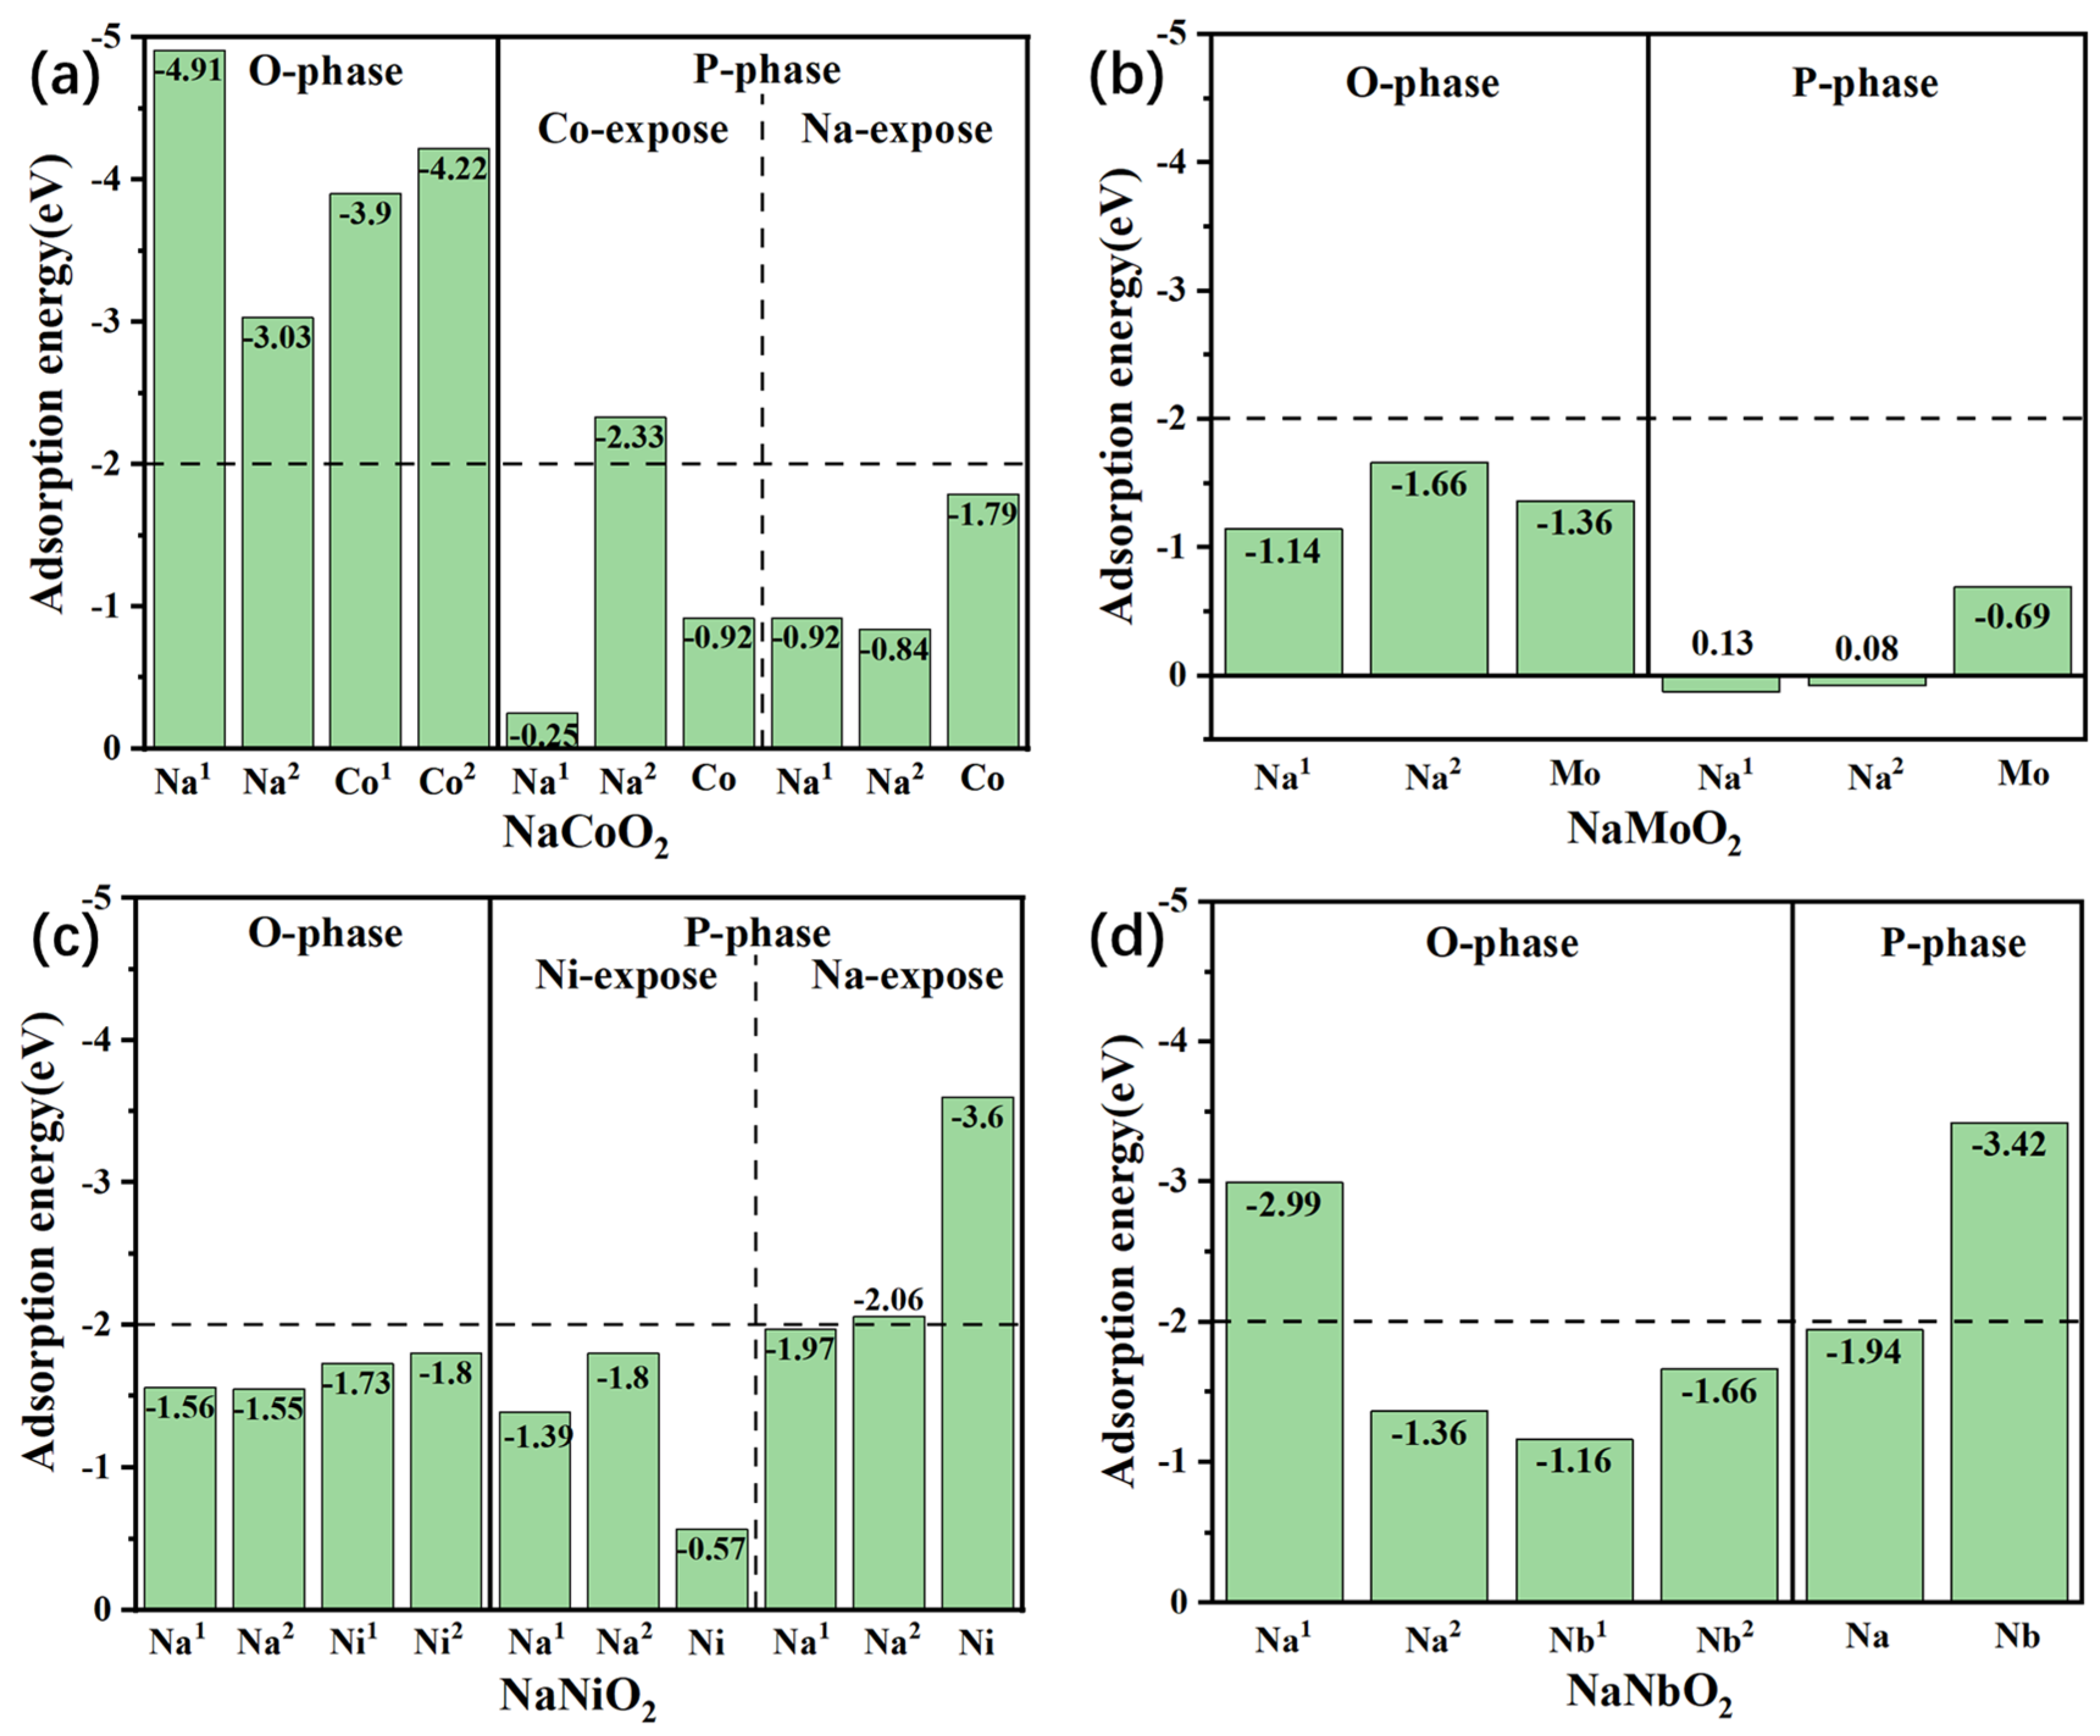
3. CO2 and H2O Adsorption Energy

It is generally accepted that adsorption energy above and below −1 eV yields weak physisorption and stronger chemisorption, respectively [40]. According to the definition of associative and dissociative adsorption [41], dissociative adsorption will include bond dissociation energy. The bond dissociation energies of H2O and CO2 are all above −5 eV [42,43]. After conferring with our experimental experts, we think it is safe to set −2.0 eV as the threshold energy for the non-dissociative adsorption of H2O and CO2. The experimental temperature spectra suggest that molecules with a calculated adsorption energy of −2.5 eV (250 KJ/mol) at 500 K [44] will be thermally activated for desorption when temperatures rise above 500 K. For sodium layered oxides with H2O and CO2 adsorption, if non-dissociative adsorption occurs on the crystal surface, they can be easily removed by simply putting the material into the furnace. Thus, a H2O/CO2 adsorption energy stronger than −2.0 eV is treated as a destructive dissociative adsorption indicator, which causes severe structural degradation and air stability issues. On the other hand, H2O/CO2 adsorption energy above −2.0 eV is treated as a non-dissociative adsorption indicator that adsorbents can be easily removed via thermal activation. In the present calculation, when the H2O/CO2 adsorption energy is around 2.0 eV, and no bond dissociation is observed, the above hypothesis is applicable.
To give an atomic-scale perspective of the above calculated air stability, we chose the most widely reported structure of O and P phases to calculate CO2 and H2O adsorption on the surface [45]. NaCoO2, NaNiO2, NaMoO2, and NaNbO2 are selected for the 3d and 4d transiton metal (TM) layered oxides. Most previous studies have been dedicated to the (001) surface [46,47]. Here, we choose the (100) surface, from which CO2 and H2O are most easily intercalated into the layered structure and lead to structural deterioration. Such a process has a decisive role for the structure stability that is of interest to the community in Na battery research.
The NaCoO2 (100) surface with an R 3 ¯ m symmetry structure demonstrated very strong CO2 adsorption at the Na1 site, the calculated structure (Figure S4) showed CO2 triple-site adsorption, and the exposed Co atoms also showed strong adsorption for CO2. However, for the P63/mmc symmetry crystal, CO2 adsorption is much weaker, except for the Na2 site where the Na atom is coordinated by four oxygen atoms to form a quadrangular pyramid with the Na atom on top. From the CO2 molecule adsorption energy (Figure 1), it can be concluded that the P2-phase NaCoO2 is more stable than the O phase, which is consistent with past experiments [48,49]. The calculated CO2 adsorption energy on NaNiO2 shows a relatively small value for both the P and O phases. The CO2 adsorption on the reconstructed (100) surface showed a maximum of 1.61 eV. Such low energy indicates that NaNiO2 is passivated to CO2. For the 4d transition metal layered oxides, the O- and P-phase NaMoO2 showed maximum CO2 adsorption energies of −1.75 eV and −2.18 eV on the Mo site, respectively. The calculation showed that NaMoO2 has a more stable O phase than P phase in the CO2-rich atmosphere. Such a trend is more prominent in the NaNbO2 phase, where the P-phase (100) surface showed strong CO2 adsorption. However, CO2 molecule adsorption only showed very weak physisorption below −1.0 eV on the O-phase NaNbO2 surface.
From the CO2 molecule adsorption energy (Figure 2), NaCoO2 with O-phase (100) surfaces showed very strong adsorption for the water molecule, along with OH formation after geometric optimization, as shown in Figure S4. However, for the P phase, the most strongly adsorbed site is the four-oxygen-coordinated Na site with an adsorption energy of −2.33 eV. Furthermore, most adsorption sites showed physisorption with adsorption energies below −1.0 eV. For the O-phase NaNiO2, water molecule adsorption is stronger but above −1.8 eV. On the other hand, P-phase adsorption showed much stronger H2O molecule binding to the Na site, especially from the Ni site (as shown in Figure S8). For NaMoO2, both the O and P phases showed relatively weak adsorption above −1.66 eV, especially for the P phase, in which water molecules only showed physisorption. NaNbO2 showed strong H2O adsorption for both the O and P phases, especially on the Na and Nb sites for the O and P phases, respectively.
The above calculations show that P-phase NaCoO2 is much more stable than the O phase, which is consistent with the general experimental results [49]. However, for NaNiO2, the calculation showed the opposite trend: the O phase is more stable than the P phase under open-air conditions. O-phase NaMoO2 shows good air stability, but the P phase shows less stability in the CO2-rich atmosphere. NaMoO2 is a very special material according to the present calculation, as it showed the most appealing adsorption energy for both CO2 and H2O, irrespective of phase structure and surface. Delmas did not report any air stability issues for the NaMoO2 cathode. Additionally, O-phase NaNbO2 showed strong stability in a CO2-rich atmosphere, but the P phase showed strong CO2 adsorption. Furthermore, neither the O nor P phase showed surface stability in the moist atmosphere.

4. Discussion

The molecule–solid interaction, also called the metal–support interaction [50,51] and d-band model [51], has been widely studied in the community invested in single-atom catalyst research. Many factors impact interaction strength, such as the surface charge density distribution, atom-site environment, surface-atom DOS, etc., as shown in Figure 3.
In the following section, a detailed analysis of the local atomic environment of the adsorption site and the charge distribution will be outlined. Along with the Na/TM surface adsorption site projected density of state (PDOS) is also given to aid the analysis of possible H2O/CO2 chemical bonding with the Na/TM adsorption site.

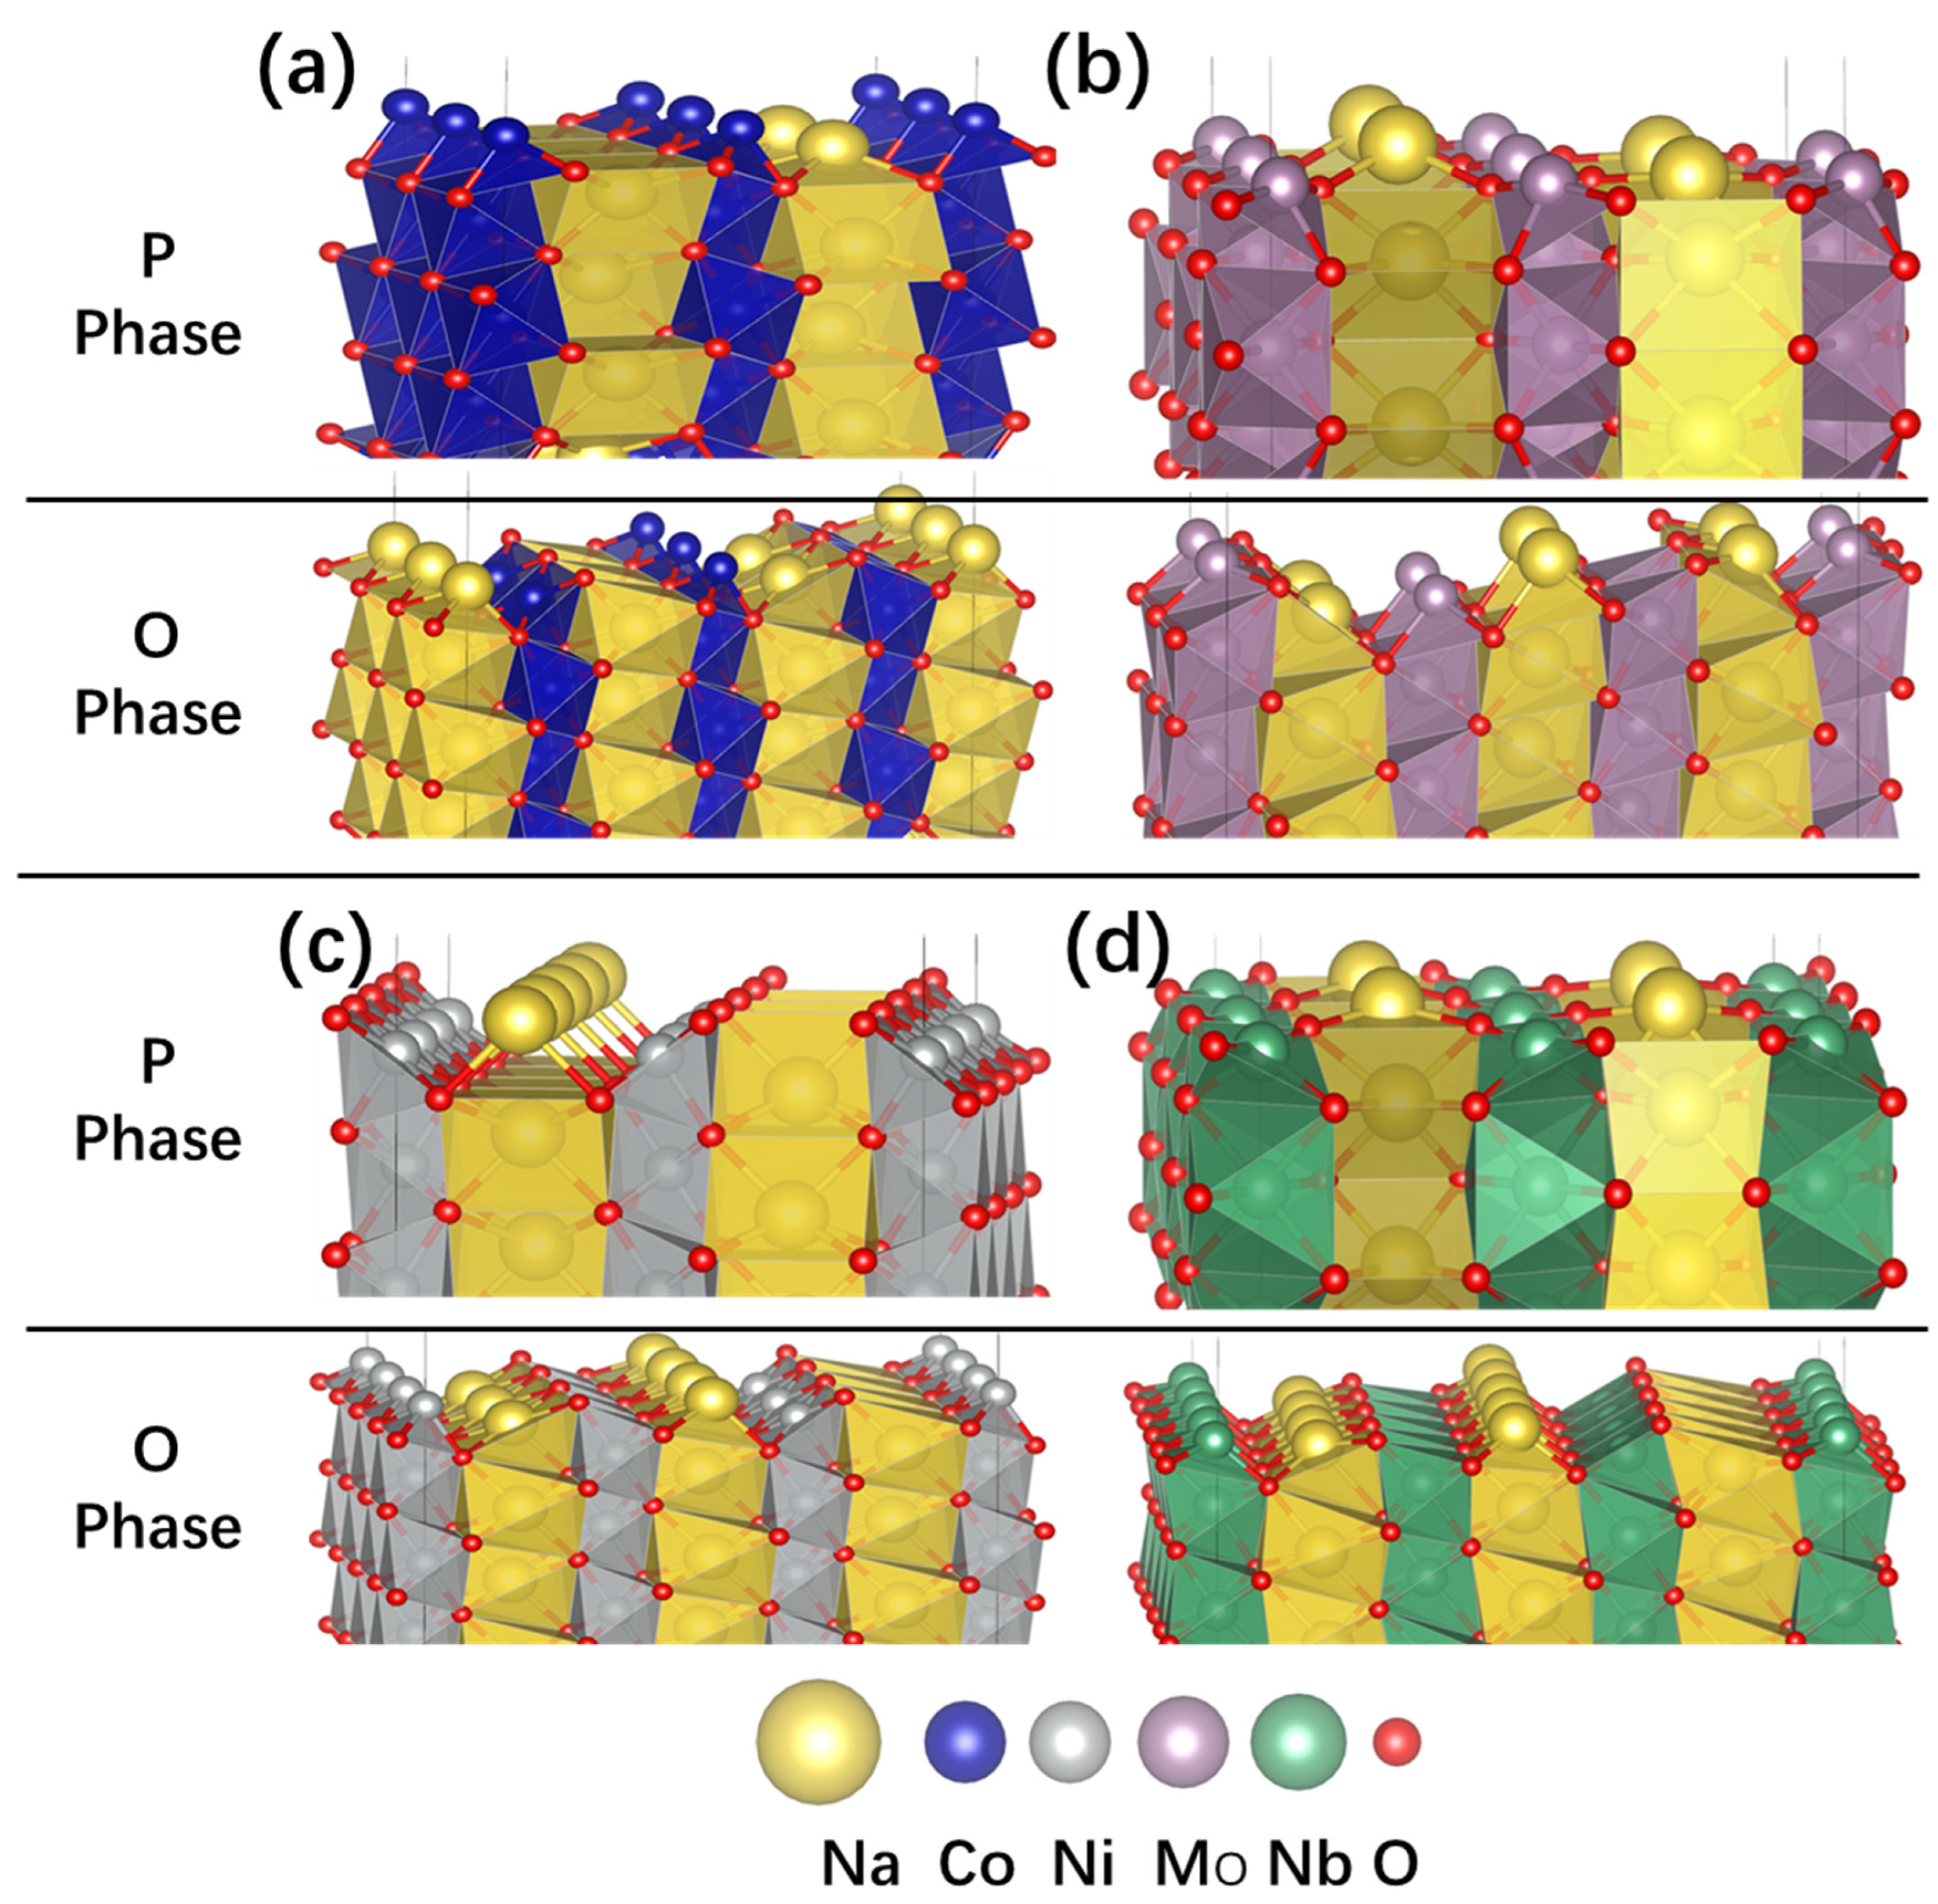
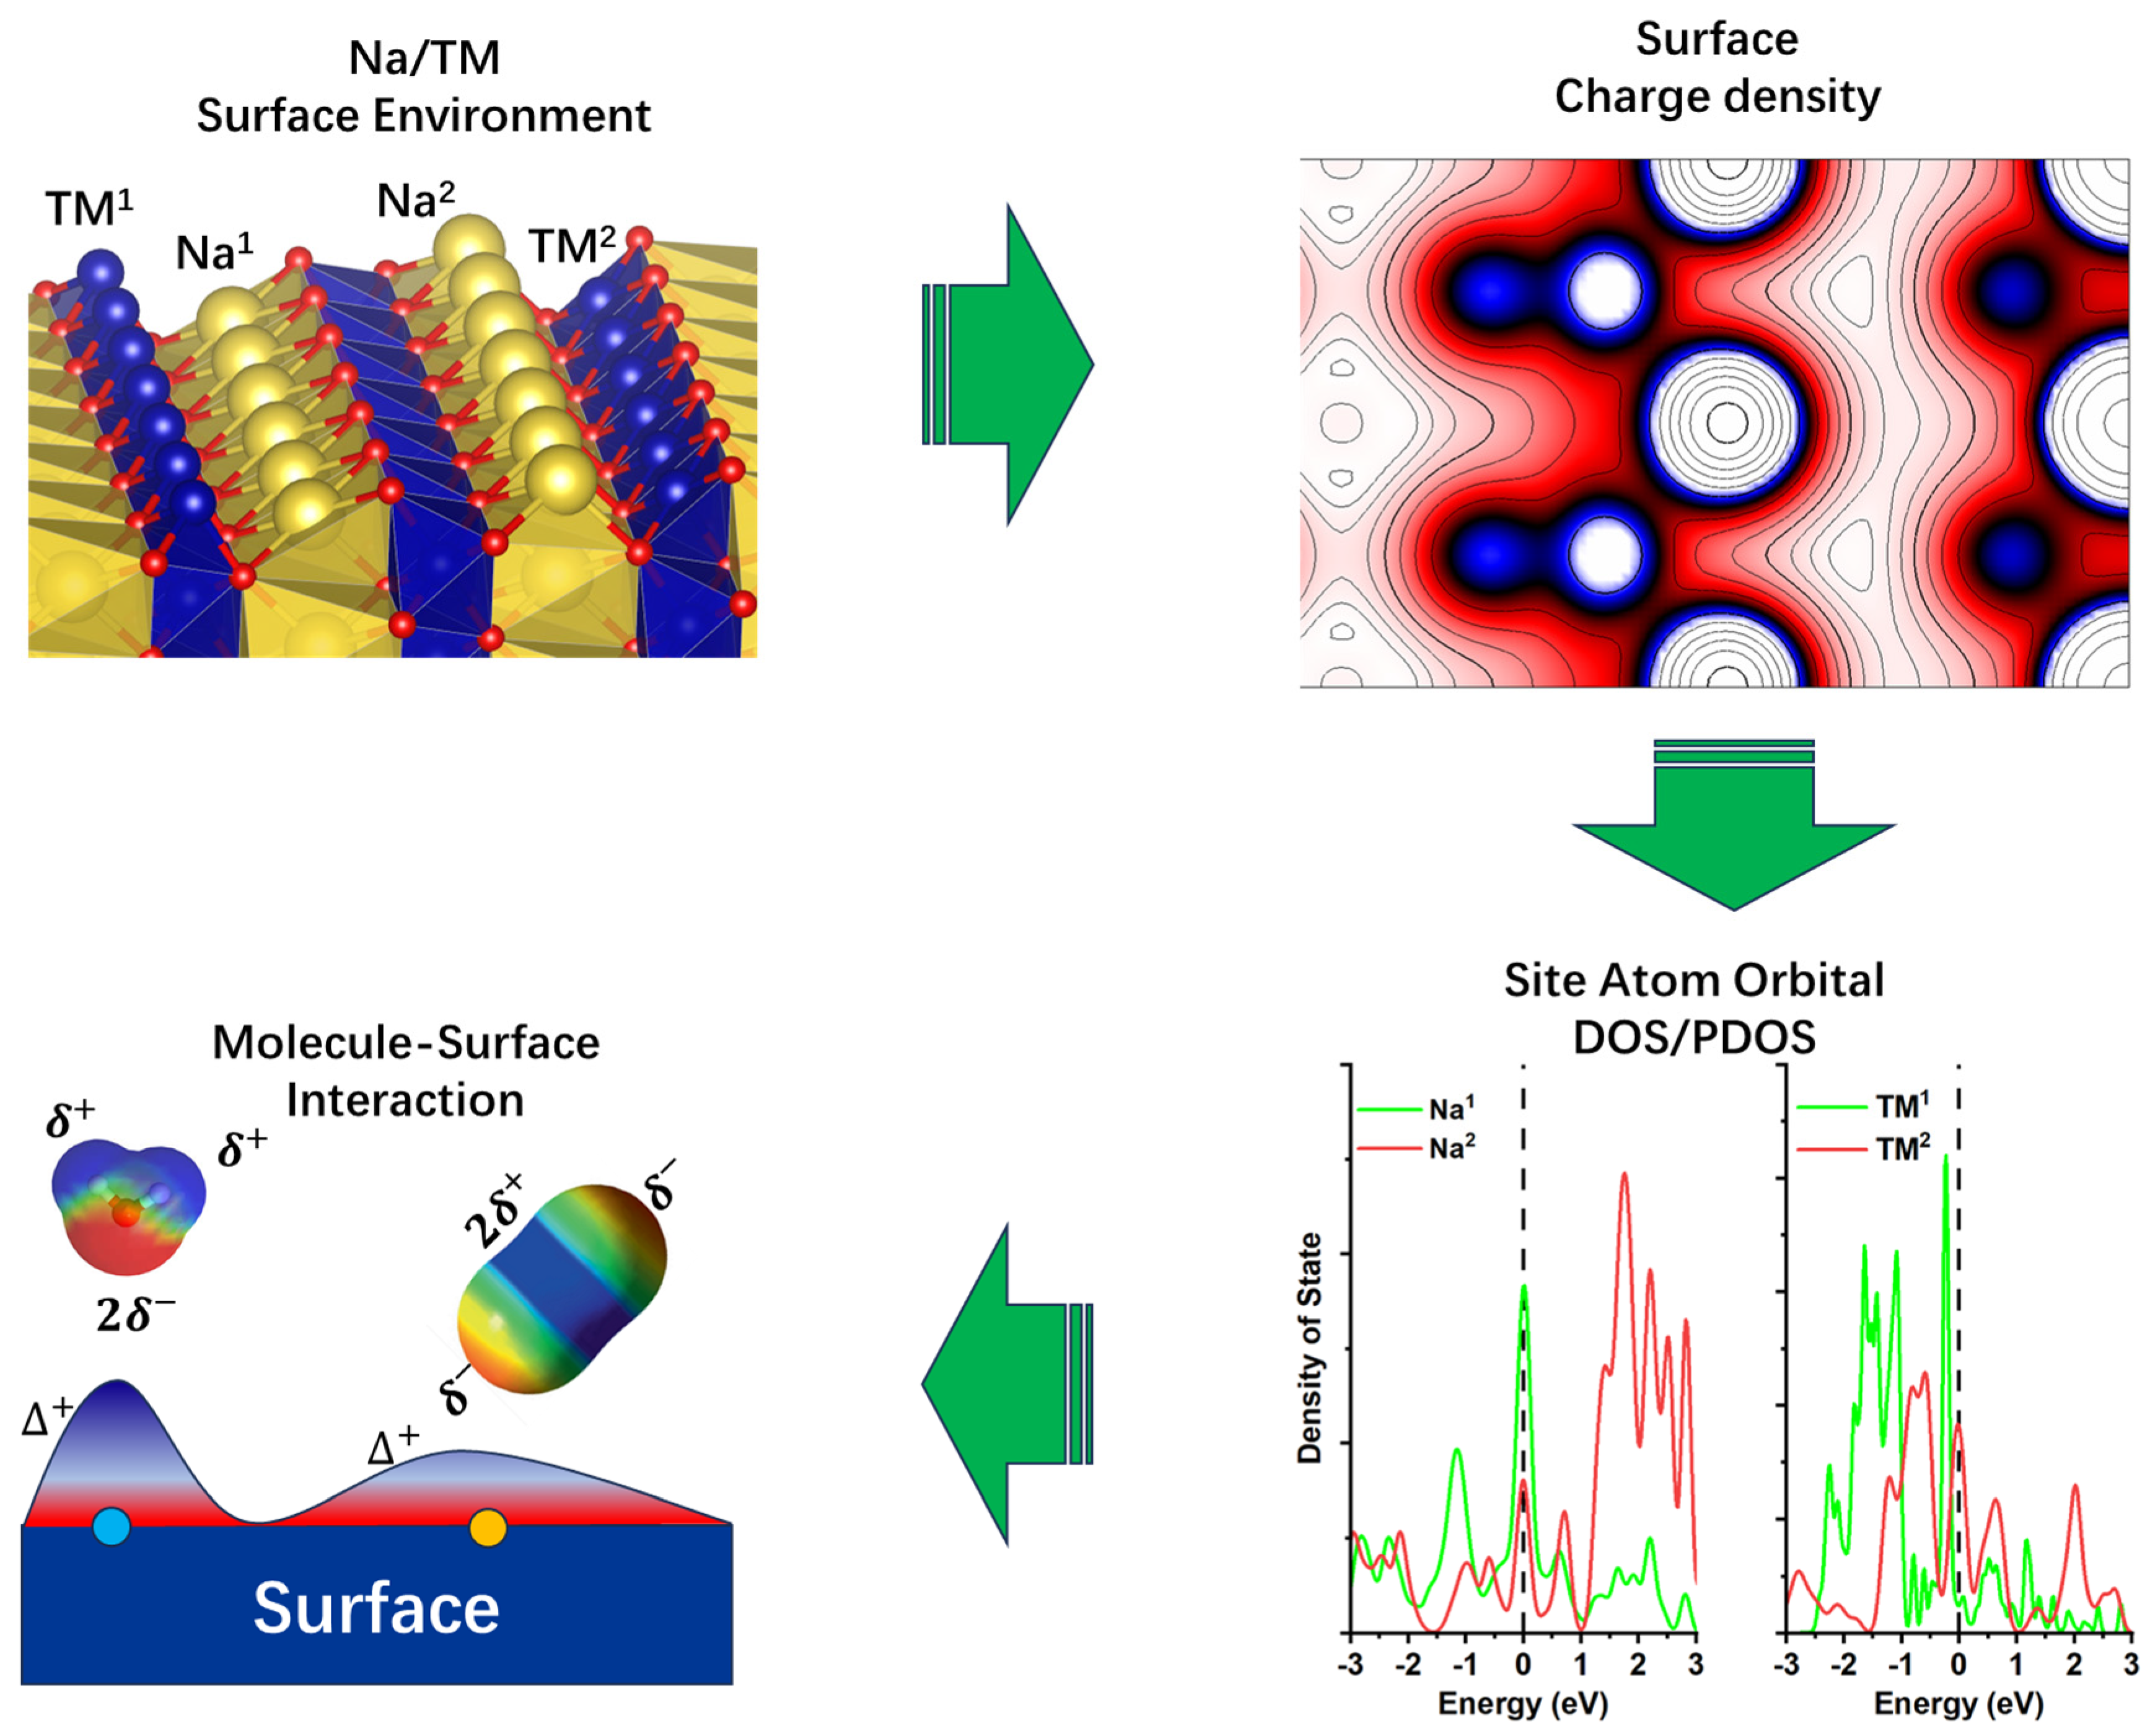
5. Surface Atomic Environment

The (100) surface of the selected material with P- and O-phase structures, downloaded from the material project [52], was cleaved using VESTA [53], as shown in Figure 4 and Figure S1. For the P-phase NaCoO2 and NaNiO2 (100) surface, there are two kinds of surfaces with different terminations: Na/TM termination (as shown in Figure 4) and Na/O termination (as shown in Figure S2). The calculated Na/Co termination has a surface energy of 0.1756 eV/Å2, which is lower than the corresponding Na/O termination with a surface energy of 0.322 eV/Å2.
Figure 4. The (100) surface of NaTMO2: (a) NaCoO2, (b) NaNiO2, (c) NaMoO2, and (d) NaNbO2. The upper and lower panels are the P2 and O3 phases, respectively. This figure only shows the lower energy surface of P-phase NaCoO2 and NaNiO2 with Na/TM termination. The other higher atomic termination surfaces are given in Figure S2 in the Supporting Information.
Nanomaterials 15 01067 g004
However, for the O-phase NaCoO2 and NaNiO2 (100) surfaces, there is only one kind of surface with Na/TM/O termination, as shown in Figure 4a,b. For the P-phase NaCoO2, the Co-O atoms form a three-oxygen-coordinated triangular pyramid with Co at the top of the summit on the (100) surface. The Na atom is coordinated by four oxygen atoms with a non-planar structure. For the O-phase NaCoO2, the surface Co atoms have two kinds of local atomic environments on the (100) surface: a three-oxygen-coordinated triangular pyramid with Co at the top of the summit and a five-oxygen-coordinated square pyramid. The surface Na also has two kinds of local structures: a five-oxygen-coordinated square pyramid with Na at the center of the plane and a three-oxygen-coordinated triangular pyramid with Na at the top of the summit.
For the P-phase NaNiO2, the surface Ni-O atoms form a five-coordinated square pyramid, and Na is coordinated by two O atoms, as shown in Figure 4b. For the O-phase NaNiO2, the surface Ni-O atoms form a five-oxygen-coordinated square pyramid with Ni at the center of the plane and a three-oxygen-coordinated triangular pyramid with Ni at the top of the summit. The surface Na also has two kinds of local structures: a five-oxygen-coordinated square pyramid with Ni at the center of the plane and a three-oxygen-coordinated triangular pyramid with Ni at the top of the summit.
For the 4d Mo and Nb layered oxides, the P phase has cmcm (space group 63) symmetry, which differs from the 3d Na and Ni layered oxides. There is only one termination type, as shown in Figure 4c,d. The surface energy is 0.060 eV/Å2 for the P-phase NaMoO2 (100) surface. There are two kinds of Na sites: one coordinated with four oxygen atoms and the other with two oxygen atoms. The Mo stie has four O coordinated atoms with Mo atom at the center of the defective trigonal bipyramid. For the P-phase NaNbO2 with a surface energy of 0.061 eV/Å2, there is only one kind of Na site with four oxygen coordinates, and the Nb atom is located at the center of the defective trigonal bipyramid.
For the O-phase NaMoO2 and NaNbO2 with an R 3 ¯ m symmetry, there is only one surface termination—the same as the O phase of Ni and Co layer oxides. The surface energies are 0.082 eV/Å2 and 0.105 eV/Å2, which are larger than their P-phase counterparts. For NaMoO2, there are two Na sites: one coordinated with four oxygen atoms and the other with three. The Mo atom is coordinated by three oxygen atoms in the Mo site. For NaNbO2, the Na atomic coordinate environment is the same as NaMoO2, but Nb has two sites, with one coordinated by three O atoms and the other by five.
From the analysis of the surface Na and TM atomic environment, the surface of 3d and 4d layered oxides showed various atomic environments. The difference in the Na/TM coordination environment indicates that the NaOx and TMOx polyhedron will change according to surface termination, symmetry, lattice parameters, and d-orbital shape. The crystal field split changes with NaOx and TMOx polyhedron changes; thus, the orbital overlap changes according to the crystal field. The previous study showed that surface MoCx polyhedron changes will alter the surface H adsorption due to the Mo site electron structure change [54]. In the present case, the NaTMO2 surface showed much more complexity, with a much more complex alteration in the NaOx/TMOx polyhedron. The electronic structure changes with NaOx/TMOx polyhedron variations which lead to rich physics and chemistry for small-molecule adsorption, such as CO2 and H2O. A more detailed investigation is provided below.

6. Electron Density Distribution

The electron density distribution of the (100) surface is calculated from bulk-crystal projection. For the P phase, the Na site showed a slight electron density change. NaMoO2 and NaNbO2 have the highest and lowest electron densities, respectively. The most striking change in the electron density distribution is from the TMO6 octahedron. For the P-phase NaCoO2, the calculation showed an elliptical isocycle with a long radius, pointing towards the TM metals. In the P-phase NaNiO2, the NiO6 octahedron showed less electron localization on the Ni-O bond. The isocycle becomes a truncated cube, which indicates less compression along the c-axis of the crystal. MoO6 showed a higher electron density between the oxygen atoms, indicated by the small cycle inside the truncated cube. NbO6 showed an even higher electron distribution around the NbO6 octahedron, as shown with the darker color around the Nb atom, and the isocycle becomes a rod pointing towards the O atoms, which indicates NbO6 compression along the a-b-axis of the crystal. CoO6 has the highest electron density for the TM-O bond, while the Ni-O bond has the lowest electron density distribution. The 4d MoO6 and NbO6 are located at the interval between CoO6 and NiO6.
For the O phase, the electron density distributions of Na sites are all different, as shown in the right column of Figure 5. Additionally, the TM-O bond from the double cycle shows a striking difference originating from the different distortions of the TMO6 octahedron. In summary, electron density distribution changes with the TM symmetry and element duo to the different TMO6 arrangements and TM-O bonding. The difference in the electron density distribution of the (100) surface will lead to rich surface properties that have an important influence on the surface air stability.
The H2O/CO2 surface interaction comprised chemical bonding and electrostatic and Vdw interactions, which are all strongly affected by the charge density, as shown in Figure 3. The above charge density calculation showed that the charge distribution is entirely different for the NaTMO2 crystal (100) surface, even in the Na sites. The charge accumulation patterns on the (100) surface will inevitably affect the interaction [55] between the surface Na/TM site and the H2O and CO2 through the electrostatic interaction and chemical bonding.

7. Projected Density of State (PDOS)

The above analysis showed that the charge density of the (100) NaTMO2 surface has complex patterns with alterations in symmetry, TM element, etc. However, the components of the surface charge density and band center are still unknown, which are important factors for surface adsorption [51]. The projected density of state (PDOS) analysis is employed to provide a detailed overview of the component and band center to understand H2O/CO2 adsorption. The surface NaCoO2 becomes half metallic, as shown in Figure 6 and Figure S14, and our calculations are consistent with previous work [56]. The projected density of state (PDOS) of the various surface Na and TM atoms showed that there are striking PDOS changes between the bulk and surface states (Figure 6 and Figure 7), even for the same Na or TM site at the surface, if they appeared at different surface element terminations, their PDOS are also different (Figure 7 and Figures S14–S22). Therefore, the electron states of surface atoms change with their local environment, such as symmetry, site location, surface termination, etc. For all Na sites, the most prominent phenomenon is that the PDOS increases around the Fermi level compared to bulk Na, which indicates electron accumulation after surface formation. This originated from charge neutralization. The Na ion showed plus charge, and the localization of the electron around the Na ion will decrease the net charge to stabilize the surface. Co showed the same trend as the Na site, while the Ni atom showed more complex behavior. In the O phase, the PDOS around the Fermi level decreased when moving from the bulk to the surface, while in the P phase, the PDOS around the Fermi level increased when moving from the bulk to the surface. Nb showed the same trend as Na, where the PDOS increased around the Fermi level when moving from the bulk to the surface, while the Mo site showed a decreased PDOS around the Fermi level. The calculated PDOS showed there is a unified trend for electron accumulation at the surface atomic site for Na, but the quantity of electron accumulation may be different. The electron distribution for the surface TM sites showed much more complex behavior.
According to the molecular orbital structure, CO2 has two occupied nonbonding orbitals from the O oxygen atom as the HOMO level. Such a molecular orbital shape is just like dyz/dxz with four lobes and well-separated from the other orbital in energy. H2O has only one occupied nonbonding p orbital from the O oxygen atom as the HOMO level with the lobe out of the water molecule plane. However, there is another π orbital just less than 2 eV below the HOMO level [36,37,57], which may involve strong σ-bonding interaction [38,,58]. In most cases, CO2 and H2O are treated as the Lewis acid and neutral ligand, respectively. According to the metal–ligand interaction, the molecular adsorption energy correlates with the metal orbital energy level and orbital overlap with the empty metal orbital.
The orbital center and occupancy of Na s and TM d orbitals around the Fermi level are calculated to assess their correlation with their CO2 and H2O adsorption energies (Figure 8).
CO2 and H2O adsorption energies follow the traditional band center theory, which is frequently used in the surface catalysis field. For close comparison of the CO2/H2O adsorptio energy on the Na site and TM stie between the 3d-NaTMO2 (Figure 8a,b) and 4d-NaTMO2 (Figure 8c,d) From 3d to 4d element of NaTMO2 crystals (100) surface, there is also another notable trend: the relationship between the band center and adsorption energy on Na or TM sites is also shifted to the right. The origin of such a shift is also a very interesting topic for future studies and is currently under investigation. CO2 and H2O adsorption on the Na site of the (100) surface followed a “V” shape when scaled with the occupation-and-bond-center ratio of the S orbital, which is used to tune the H atom adsorption energy on the MoC2 surface [59]. The bottom of the V curve showed very strong adsorption. In such bottom region, water splitting occurs (as shown in Figures S4, S5, S9, S11, and S12), and CO2 undergoes multisite adsorption (as shown in Figures S4 and S13). For the adsorption on the TM metal site, CO2 showed a monotonically decreasing relationship with an increased t2g band center for both the 3d and 4d transition metals. CO2 adsorption energy follows the traditional band center theory, which is frequently used in the surface catalysis field [60,61]. However, H2O adsorption on the 3d/4d transition metal sites showed a more complex relationship with the band center of d orbitals. Such a relationship and more diverse descriptors need to be explored in more detail, consistent with previous research [62]. The adsorption trend of CO2/H2O on the Na and TM sites is also different. This originates from the different symmetry of the partially filled Na S orbital and t2g orbitals. CO2/H2O adsorption has totally different orbital overlaps between the Na and TM sites. Another reason is the different electron negativities of the Na and TM elements. When the CO2/H2O binds with the Na and TM sites, the electron transfer from the site to the CO2/H2O molecule is different between the Na and TM sites.

8. Conclusions

The present study used 3d and 4d sodium layered transition metal oxides to investigate the surface stability of H2O and CO2 adsorption properties using DFT calculations. This study showed that the material bulk phase (symmetry), surface site, and element type are very important factors for air stability. Contrary to previous experimental results, the P phase is not always more air-stable compared to the O phase, as shown in our calculations, where the O-phase NaNiO2 is more stable than the P phase. The electronic structure of the surface atomic site plays a decisive role in the adsorption strength of the CO2 and H2O molecules. The calculated band center and occupation showed a direct relationship with the adsorption energy. The Na site adsorption for CO2 and H2O showed the same V-shape trend. However, the TM adsorption for CO2 and H2O showed a different trend. As the band center of t2g increases, the adsorption strength of CO2 increases. There is no clear trend for H2O adsorption. The band center and occupation near the interval of the Fermi level ([−2, 2] eV in the present study) are strongly correlated with the air stability of the surface. The present study showed that tuning the surface’s electronic structure may be useful for maintaining air stability for the layered transition metal oxide cathode. A more comprehensive study of the air stability of layered transition metal oxides including the other transition metal compoundsis in progress. More importantly, the doping strategy may change the surface electron structure, which can be used to alleviate or prevent air stability issues. The combined ion/electron effect may also contribute to Na ion diffusion, as demonstrated in MnV2O6 [63]. Thus, how doping affects the Na ion diffusion is another important issue that remains to be explored.

Supplementary Materials

The following supporting information can be downloaded at: https://www.mdpi.com/article/10.3390/nano15141067/s1, Figure S1 Schematic diagram of the P (left) and O (right) phases structures of NaTMO2: (a) NaCoO2, (b) NaNiO2, (c) NaNbO2, and NaMoO2. Figure S2 surface structure of the P phase NaCoO2 and NaNiO2 with Na/O and Ni/O termination, respectively. Figure S3 (100) surface energy various NaTMO2 (TM = Co, Ni, Mo, Nb) P and O phase. Figure S4 CO2 and H2O adsorption geometric before and after atomic relaxation (NaCoO2-R 3 ¯ m). Figure S5 CO2 and H2O adsorption geometric before and after atomic relaxation on the NaCoO2 (100) with Co/O atom termination (P63mmc). Figure S6 CO2 and H2O adsorption geometric before and after atomic relaxation on the NaCoO2 (100) with Na/O atom termination (P63mmc). Figure S7 CO2 and H2O adsorption geometric before and after atomic relaxation (NaNiO2-R 3 ¯ m). Figure S8 CO2 and H2O adsorption geometric before and after atomic relaxation on the NaNiO2 (100) with Na/O atom termination (P63mmc). Figure S9 CO2 and H2O adsorption geometric before and after atomic relaxation on the NaNiO2 (100) with Ni/O atom termination (P63mmc). Figure S10 CO2 and H2O adsorption geometric before and after atomic relaxation (NaMoO2-R 3 ¯ m). Figure S11 CO2 and H2O adsorption geometric before and after atomic relaxation (NaMoO2-cmcm). Figure S12 CO2 and H2O adsorption geometric before and after atomic relaxation (NaNbO2-R 3 ¯ m). Figure S13 CO2 and H2O adsorption geometric before and after atomic relaxation (NaNbO2-cmcm). Figure S14 The local projected density of state (PDOS) of surface TM and Na atoms with different (100) surface. (a) NaCoO2 (P63mmc-Co/O-termination); (b) NaCoO2 (P63mmc-Na/O-termination); (c) NaCoO2 (P63mmc-Co/O-termination); (d) NaCoO2 (P63mmc-Na/O-termination). Figure S16 The local projected density of state (PDOS) of surface TM and Na atoms with different (100) surface. (a) NaNiO2 (P63mmc-Ni/O-termination); (b) NaNiO2 (P63mmc-Na/O-termination); (c) NaNiO2 (P63mmc-Ni/O-termination); (d) NaNiO2 (P63mmc-Na/O-termination). Figure S17 The local projected density of state (PDOS) of surface TM and Na atoms with different (100) surface. (a) NaNbO2 (cmcm); (b) NaMoO2 (cmcm); (c) NaNbO2 (cmcm); (d) NaMoO2 (cmcm). Figure S18 The local projected density of state (PDOS) of surface TM and Na atoms with different (100) surface. (a) NaCoO2 (R 3 ¯ m); (b) NaCoO2 (P63mmc-Co/O-termination); (c) NaCoO2 (R 3 ¯ m); (d) NaCoO2 (P63mmc-Co/O-termination). Figure S19 The local projected density of state (PDOS) of surface TM and Na atoms with different (100) surface. (a) NaCoO2 (P63mmc-Na/O-termination); (b) NaNiO2 (R3m); (c) NaCoO2 (P63mmc-Na/O-termination); (d) NaNiO2 (R 3 ¯ m). Figure S20 The local projected density of state (PDOS) of surface TM and Na atoms with different (100) surface. (a) NaNiO2 (P63mmc-Ni/O-termination); (b) NaNiO2 (P63mmc-Na/O-termination); (c) NaNiO2 (P63mmc-Ni/O-termination); (d) NaNiO2 (P63mmc-Na/O-termination). Figure S21 The local projected density of state (PDOS) of surface TM and Na atoms with different (100) surface. (a) NaMoO2 (R 3 ¯ m); (b) NaMoO2 (cmcm); (c) NaMoO2 (R 3 ¯ m); (d) NaMoO2 (cmcm). Figure S22 The local projected density of state (PDOS) of surface TM and Na atoms with different (100) surface. (a) NaNbO2 (R 3 ¯ m); (b) NaNbO2 (cmcm); (c) NaNbO2 (R 3 ¯ m); (d)NaNbO2 (cmcm).

Author Contributions

Validation, P.S.; Formal analysis, C.S.; Investigation, H.B.; Data curation, X.W. and Y.H.; Writing—original draft, H.L.; Writing—review & editing, Q.X. and S.L.; Visualization, C.W. and G.S.; Project administration, Y.Q.; Funding acquisition, L.X. All authors have read and agreed to the published version of the manuscript.

Funding

This research was supported by the Science and Technology Program of State Grid (No. 5419-202158503A-0-5-ZN).

Data Availability Statement

Data are contained within the article and Supplementary Materials.

Conflicts of Interest

The authors declare no conflict of interest.

References

  1. Wang, C.; Zhang, L.; Zhang, Z.; Zhao, R.; Zhao, D.; Ma, R.; Yin, L. Layered materials for supercapacitors and batteries: Applications and challenges. Prog. Mater. Sci. 2021, 118, 100763. [Google Scholar] [CrossRef]
  2. Liu, Q.; Hu, Z.; Chen, M.; Zou, C.; Jin, H.; Wang, S.; Chou, S.-L.; Liu, Y.; Dou, S.-X. The Cathode Choice for Commercialization of Sodium-Ion Batteries: Layered Transition Metal Oxides versus Prussian Blue Analogs. Adv. Funct. Mater. 2020, 30, 1909530. [Google Scholar] [CrossRef]
  3. Yang, Y.; Okonkwo, E.G.; Huang, G.; Xu, S.; Sun, W.; He, Y. On the sustainability of lithium ion battery industry—A review and perspective. Energy Storage Mater. 2021, 36, 186–212. [Google Scholar] [CrossRef]
  4. Zhang, M.; Meng, Y.S. Sodium-Ion Batteries Paving the Way for Grid Energy Storage. ECS Meet. Abstr. 2021, MA2021-02, 230. [Google Scholar] [CrossRef]
  5. Chayambuka, K.; Mulder, G.; Danilov, D.L.; Notten, P.H.L. From Li-Ion Batteries Toward Na-Ion Chemistries: Challenges and Opportunities. Adv. Energy Mater. 2020, 10, 2001310. [Google Scholar] [CrossRef]
  6. Li, Y.; Chen, M.; Liu, B.; Zhang, Y.; Xia, X. Heteroatom Doping: An Effective Way to Boost Sodium Ion Storage. Adv. Energy Mater. 2020, 10, 2000927. [Google Scholar] [CrossRef]
  7. Yang, C.; Xin, S.; Mai, L.; You, Y. Materials Design for High-Safety Sodium-Ion Battery. Adv. Energy Mater. 2021, 11, 2000974. [Google Scholar] [CrossRef]
  8. Jin, T.; Li, H.X.; Zhu, K.J.; Wang, P.-F.; Liu, P.; Jiao, L.F. Polyanion-type cathode materials for sodium-ion batteries. Chem. Soc. Rev. 2020, 49, 2342–2377. [Google Scholar] [CrossRef]
  9. Liu, Y.F.; Han, K.; Peng, D.N.; Kong, L.Y.; Su, Y.; Li, H.W.; Hu, H.Y.; Li, J.Y.; Wang, H.R.; Fu, Z.Q.; et al. Layered oxide cathodes for sodium-ion batteries: From air stability, interface chemistry to phase transition. InfoMat 2023, 5, e12422. [Google Scholar] [CrossRef]
  10. Wang, P.F.; You, Y.; Yin, Y.X.; Guo, Y.G. Layered Oxide Cathodes for Sodium-Ion Batteries: Phase Transition, Air Stability, and Performance. Adv. Energy Mater. 2018, 8, 1701912. [Google Scholar] [CrossRef]
  11. Guo, S.; Liu, P.; Yu, H.; Zhu, Y.; Chen, M. A Layered P2- and O3-Type Composite as a High-Energy Cathode for Rechargeable Sodium-Ion Batteries. Angew. Chem. 2015, 127, 5992–5997. [Google Scholar] [CrossRef]
  12. Mu, L.Q.; Xu, S.Y.; Li, Y.M.; Hu, Y.-S.; Li, H.; Chen, L.Q.; Huang, X.J. Prototype Sodium-Ion Batteries Using an Air-Stable and Co/Ni-Free O-3-Layered Metal Oxide Cathode. Adv. Mater. 2015, 27, 6928–6933. [Google Scholar] [CrossRef] [PubMed]
  13. Liu, Q.N.; Hu, Z.; Chen, M.Z.; Zou, C.; Jin, H.L.; Wang, S.; Chou, S.-L.; Dou, S.-X. Recent Progress of Layered Transition Metal Oxide Cathodes for Sodium-Ion Batteries. Small 2019, 15, 1805381. [Google Scholar] [CrossRef] [PubMed]
  14. Xu, C.; Cai, H.; Chen, Q.; Kong, X.; Pan, H.; Hu, Y.S. Origin of Air-Stability for Transition Metal Oxide Cathodes in Sodium-Ion Batteries. ACS Appl. Mater. Interfaces 2022, 14, 5338–5345. [Google Scholar] [CrossRef]
  15. Joshi, A.; Chakrabarty, S.; Akella, S.H.; Saha, A.; Mukherjee, A.; Schmerling, B.; Ejgenberg, M.; Sharma, R.; Noked, M. High-Entropy Co-Free O3-Type Layered Oxyfluoride: A Promising Air-Stable Cathode for Sodium-Ion Batteries. Adv. Mater. 2023, 35, 2304440. [Google Scholar] [CrossRef]
  16. Huang, Z.-X.; Li, K.; Cao, J.-M.; Zhang, K.-Y.; Liu, H.-H.; Guo, J.-Z.; Liu, Y.; Wang, T.; Dai, D.; Zhang, X.-Y.; et al. New Insights into Anionic Redox in P2-Type Oxide Cathodes for Sodium-Ion Batteries. Nano Lett. 2024, 24, 13615–13623. [Google Scholar] [CrossRef]
  17. Lamb, J.; Manthiram, A. Surface-Modified Na(Ni0.3Fe0.4Mn0.3)O2 Cathodes with Enhanced Cycle Life and Air Stability for Sodium-Ion Batteries. ACS Appl. Energy Mater. 2021, 4, 11735–11742. [Google Scholar] [CrossRef]
  18. Wei, S.-B.; He, Y.-J.; Tang, Y.; Fu, H.-W.; Zhou, J.; Liang, S.-Q.; Cao, X.-X. A Ca-substituted air-stable layered oxide cathode material with facilitated phase transitions for high-performance Na-ion batteries. Rare Met. 2024, 43, 5701–5711. [Google Scholar] [CrossRef]
  19. Zhang, L.; Deshmukh, J.; Hijazi, H.; Ye, Z.; Johnson, M.B.; George, A.; Dahn, J.R.; Metzger, M. Impact of Calcium on Air Stability of Na[Ni1/3Fe1/3Mn1/3]O2 Positive Electrode Material for Sodium-ion Batteries. J. Electrochem. Soc. 2023, 170, 070514. [Google Scholar] [CrossRef]
  20. Chen, Y.; Shi, Q.; Zhao, S.; Feng, W.; Liu, Y.; Yang, X.; Wang, Z.; Zhao, Y. Investigation on the Air Stability of P2-Layered Transition Metal Oxides by Nb Doping in Sodium Ion Batteries. Batteries 2023, 9, 183. [Google Scholar] [CrossRef]
  21. Yin, W.; Huang, Z.; Zhang, T.; Yang, T.; Ji, H.; Zhou, Y.; Shi, S.; Zhang, Y. P2-type layered oxide cathode with honeycomb-ordered superstructure for sodium-ion batteries. Energy Storage Mater. 2024, 69, 103424. [Google Scholar] [CrossRef]
  22. Liu, Y.-F.; Hu, H.-Y.; Li, J.-Y.; Wang, H.; Zhao, Y.; Wang, J.; Wu, Y.-B.; Li, Y.-J.; Zhang, G.-Y.; Sun, Q.-Q.; et al. An air-stable single-crystal layered oxide cathode based on multifunctional structural modulation for high-energy-density sodium-ion batteries. Sci. China Chem. 2024, 67, 4242–4250. [Google Scholar] [CrossRef]
  23. Yang, H.; Zhang, Q.; Chen, M.; Yang, Y.; Zhao, J. Unveiling the Origin of Air Stability in Polyanion and Layered-Oxide Cathode Materials for Sodium-Ion Batteries and Their Practical Application Considerations. Adv. Funct. Mater. 2024, 34, 2308257. [Google Scholar] [CrossRef]
  24. Li, Y.; Yang, Z.; Xu, S.; Mu, L.; Gu, L.; Hu, Y.S.; Li, H.; Chen, L. Air-Stable Copper-Based P2-Na7/9Cu2/9Fe1/9Mn2/3O2 as a New Positive Electrode Material for Sodium-Ion Batteries. Adv. Sci. 2015, 2, 1500031. [Google Scholar] [CrossRef]
  25. Chen, T.R.; Sheng, T.; Wu, Z.G.; Li, J.T.; Wang, E.H.; Wu, C.J.; Li, H.T.; Guo, X.D.; Zhong, B.H.; Huang, L.; et al. Cu2+ Dual-Doped Layer-Tunnel Hybrid Na0.6Mn1−xCuxO2 as a Cathode of Sodium-Ion Battery with Enhanced Structure Stability, Electrochemical Property, and Air Stability. Acs Appl. Mater. Interfaces 2018, 10, 10147. [Google Scholar] [CrossRef]
  26. Zhou, Y.N.; Wang, P.F.; Zhang, X.D.; Huang, L.B.; Guo, Y.G. Air-Stable and High-Voltage Layered P3-Type Cathode for Sodium-Ion Full Battery. ACS Appl. Mater. Interfaces 2019, 11, 24184–24191. [Google Scholar] [CrossRef] [PubMed]
  27. Zuo, W.; Liu, X.; Qiu, J.; Zhang, D.; Xiao, Z.; Xie, J.; Ren, F.; Wang, J.; Li, Y.; Ortiz, G.F.; et al. Engineering Na+-layer spacings to stabilize Mn-based layered cathodes for sodium-ion batteries. Nat. Commun. 2021, 12, 4903. [Google Scholar] [CrossRef]
  28. Wang, X.; Gao, Y.; Shen, X.; Li, Y.; Kong, Q.; Lee, S.; Wang, Z.; Yu, R.; Hu, Y.; Chen, L. Anti-P-2 structured Na0.5NbO2 and its negative strain effect. Energy Environ. Sci. 2015, 8, 2753–2759. [Google Scholar] [CrossRef]
  29. Roth, H.-F.; Meyer, G.; Hu, Z.W.; Kaindl, G. Synthesis, structure, and X-ray absorption spectra of LixNbO2 and NaxNbO2 (x ≤ 1). Z. Für Anorg. Und Allg. Chem. 1993, 619, 1369–1373. [Google Scholar] [CrossRef]
  30. Vitoux, L.; Guignard, M.; Penin, N.; Carlier, D.; Darriet, J.; Delmas, C. NaMoO2: A Layered Oxide with Molybdenum Clusters. Inorg. Chem. 2020, 59, 4015–4023. [Google Scholar] [CrossRef]
  31. Vitoux, L.; Guignard, M.; Suchomel, M.R.; Pramudita, J.C.; Sharma, N.; Delmas, C. The NaxMoO2 phase diagram (1/2 ≤ x < 1): An electrochemical devil’s staircase. Chem. Mater. 2017, 29, 7243–7254. [Google Scholar]
  32. Zheng, Y.M.; Huang, X.B.; Meng, X.M.; Xu, S.D.; Chen, L.; Liu, S.B.; Zhang, D. Copper and Zirconium Codoped O3-Type Sodium Iron and Manganese Oxide as the Cobalt/Nickel-Free High-Capacity and Air-Stable Cathode for Sodium-Ion Batteries. ACS Appl. Mater. Interfaces 2021, 13, 45528–45537. [Google Scholar] [CrossRef]
  33. Stansby, J.H.; Sharma, N.; Goonetilleke, D. Probing the charged state of layered positive electrodes in sodium-ion batteries: Reaction pathways, stability and opportunities. J. Mater. Chem. A 2020, 8, 24833–24867. [Google Scholar] [CrossRef]
  34. Brugnetti, G.; Triolo, C.; Massaro, A.; Ostroman, I.; Pianta, N.; Ferrara, C.; Sheptyakov, D.; Muñoz-García, A.B.; Pavone, M.; Santangelo, S.; et al. Structural Evolution of Air-Exposed Layered Oxide Cathodes for Sodium-Ion Batteries: An Example of Ni-doped NaxMnO2. Chem. Mater. 2023, 35, 8440–8454. [Google Scholar] [CrossRef]
  35. Zuo, W.; Innocenti, A.; Zarrabeitia, M.; Bresser, D.; Yang, Y.; Passerini, S. Layered oxide cathodes for sodium-ion batteries: Storage mechanism, electrochemistry, and techno-economics. Acc. Chem. Res. 2023, 56, 284–296. [Google Scholar] [CrossRef]
  36. Blöchl, P.E. Projector augmented-wave method. Phys. Rev. B 1994, 50, 17953. [Google Scholar] [CrossRef]
  37. Hafner, J. Ab-initio simulations of materials using VASP: Density-functional theory and beyond. J. Comput. Chem. 2008, 29, 2044–2078. [Google Scholar] [CrossRef]
  38. Furness, J.W.; Kaplan, A.D.; Ning, J.; Perdew, J.P.; Sun, J. Accurate and numerically efficient r2SCAN meta-generalized gradient approximation. J. Phys. Chem. Lett. 2020, 11, 8208–8215. [Google Scholar] [CrossRef]
  39. Tran, R.; Xu, Z.; Radhakrishnan, B.; Winston, D.; Sun, W.; Persson, K.A.; Ong, S.P. Surface energies of elemental crystals. Sci. Data 2016, 3, 160080. [Google Scholar] [CrossRef]
  40. Abrantes, P.; Kort-Kamp, W.; Rosa, F.; Farina, C.; Pinheiro, F.; Cysne, T.P. Controlling electric and magnetic Purcell effects in phosphorene via strain engineering. Phys. Rev. B 2023, 108, 155427. [Google Scholar] [CrossRef]
  41. Jiang, Y.-L.; Liu, H.-Q.; Yi, D.-Q.; Lin, G.-Y.; Xun, D.; Zhang, R.-Q.; Sun, Y.-D.; Liu, S.-Q. Microstructure evolution and recrystallization behavior of cold-rolled Zr-1Sn-0.3 Nb-0.3 Fe-0.1 Cr alloy during annealing. Trans. Nonferrous Met. Soc. China 2018, 28, 651–661. [Google Scholar] [CrossRef]
  42. Boyarkin, O.V.; Koshelev, M.A.; Aseev, O.; Maksyutenko, P.; Rizzo, T.R.; Zobov, N.F.; Lodi, L.; Tennyson, J.; Polyansky, O.L. Accurate bond dissociation energy of water determined by triple-resonance vibrational spectroscopy and ab initio calculations. Chem. Phys. Lett. 2013, 568, 14–20. [Google Scholar] [CrossRef]
  43. Fukuda, T.; Maekawa, T.; Hasumura, T.; Rantonen, N.; Ishii, K.; Nakajima, Y.; Hanajiri, T.; Yoshida, Y.; Whitby, R.; Mikhalovsky, S. Dissociation of carbon dioxide and creation of carbon particles and films at room temperature. New J. Phys. 2007, 9, 321. [Google Scholar] [CrossRef]
  44. Schmid, M.; Parkinson, G.S.; Diebold, U. Analysis of Temperature-Programmed Desorption via Equilibrium Thermodynamics. ACS Phys. Chem. Au 2023, 3(1), 44–62. [Google Scholar] [CrossRef]
  45. Lei, Y.; Li, X.; Liu, L.; Ceder, G. Synthesis and stoichiometry of different layered sodium cobalt oxides. Chem. Mater. 2014, 26, 5288–5296. [Google Scholar] [CrossRef]
  46. Pai, W.W.; Huang, S.H.; Meng, Y.S.; Chao, Y.C.; Lin, C.H.; Liu, H.L.; Chou, F.C. Sodium Trimer Ordering on a NaxCoO2 Surface. Phys. Rev. Lett. 2008, 100, 206404. [Google Scholar] [CrossRef]
  47. Pillay, D.; Johannes, M.; Mazin, I. Electronic Structure of the NaxCoO2 Surface. Phys. Rev. Lett. 2008, 101, 246808. [Google Scholar] [CrossRef]
  48. Grépin, E.; Moiseev, I.A.; Abakumov, A.M.; Tarascon, J.-M.; Mariyappan, S. Rational selection of sodium layered oxides for high performance Na-ion batteries: P2 vs O3 vs P2-O3 intergrowths. J. Electrochem. Soc. 2023, 170, 080510. [Google Scholar] [CrossRef]
  49. Feng, J.; Fang, D.; Yang, Z.; Zhong, J.; Zheng, C.; Wei, Z.; Li, J. A novel P2/O3 composite cathode toward synergistic electrochemical optimization for sodium ion batteries. J. Power Sources 2023, 553, 232292. [Google Scholar] [CrossRef]
  50. Leybo, D.; Etim, U.J.; Monai, M.; Bare, S.R.; Zhong, Z.; Vogt, C. Metal–support interactions in metal oxide-supported atomic, cluster, and nanoparticle catalysis. Chem. Soc. Rev. 2024, 53, 10450–10490. [Google Scholar] [CrossRef] [PubMed]
  51. Hammer, B.; Nørskov, J.K. Theoretical surface science and catalysis—Calculations and concepts. In Advances in Catalysis; Academic Press: Cambridge, MA, USA, 2000; Volume 45, pp. 71–129. [Google Scholar]
  52. Jain, A.; Ong, S.P.; Hautier, G.; Chen, W.; Richards, W.D.; Dacek, S.; Cholia, S.; Gunter, D.; Skinner, D.; Ceder, G.; et al. Commentary: The Materials Project: A materials genome approach to accelerating materials innovation. APL Mater. 2013, 1, 011002. [Google Scholar] [CrossRef]
  53. Momma, K.; Izumi, F. VESTA 3 for three-dimensional visualization of crystal, volumetric and morphology data. J. Appl. Crystallogr. 2011, 44, 1272–1276. [Google Scholar] [CrossRef]
  54. Yang, Y.; Qian, Y.; Luo, Z.; Li, H.; Chen, L.; Cao, X.; Wei, S.; Zhou, B.; Zhang, Z.; Chen, S.; et al. Water induced ultrathin Mo2C nanosheets with high-density grain boundaries for enhanced hydrogen evolution. Nat. Commun. 2022, 13, 7225. [Google Scholar] [CrossRef]
  55. Chiter, F.; Costa, D.; Pébère, N.; Marcus, P.; Lacaze-Dufaure, C. Insight at the atomic scale of corrosion inhibition: DFT study of 8-hydroxyquinoline on oxidized aluminum surfaces. Phys. Chem. Chem. Phys. 2023, 25, 4284–4296. [Google Scholar] [CrossRef]
  56. Weng, H.; Xu, G.; Zhang, H.; Zhang, S.-C.; Dai, X.; Fang, Z. Half-metallic surface states and topological superconductivity in NaCoO 2 from first principles. Phys. Rev. B 2011, 84, 060408. [Google Scholar] [CrossRef]
  57. Ning, C.G.; Hajgató, B.; Huang, Y.R.; Zhang, S.F.; Liu, K.; Luo, Z.H.; Knippenberg, S.; Deng, J.K.; Deleuze, M.S. High resolution electron momentum spectroscopy of the valence orbitals of water. Chem. Phys. 2008, 343, 19–30. [Google Scholar] [CrossRef]
  58. Ishida, H. Theory of the alkali-metal chemisorption on metal surfaces. II. Phys. Rev. B 1990, 42, 10899. [Google Scholar] [CrossRef]
  59. Sun, Z.; Song, Z.; Yin, W.-J. Going beyond the d-band center to describe CO2 activation on single-atom alloys. Adv. Energy Sustain. Res. 2022, 3, 2100152. [Google Scholar] [CrossRef]
  60. Sun, X.; Sun, L.; Li, G.; Tuo, Y.; Ye, C.; Yang, J.; Low, J.; Yu, X.; Bitter, J.H.; Lei, Y.; et al. Phosphorus Tailors the d-Band Center of Copper Atomic Sites for Efficient CO2 Photoreduction under Visible-Light Irradiation. Angew. Chem. 2022, 134, e202207677. [Google Scholar] [CrossRef]
  61. Stojković, M.; Pašti, I.A. Strain Engineering for Tuning the Photocatalytic Activity of Metal-Organic Frameworks-Theoretical Study of the UiO-66 Case. Catalysts 2021, 11, 264. [Google Scholar] [CrossRef]
  62. Zhao, Z.-J.; Gong, J. Catalyst design via descriptors. Nat. Nanotechnol. 2022, 17, 563–564. [Google Scholar] [CrossRef]
  63. Muruganantham, R.; Liu, W.-R.; Lin, C.-H.; Rudysh, M.; Piasecki, M. Design of meso/macro porous 2D Mn-vanadate as potential novel anode materials for sodium-ion storage. J. Energy Storage 2019, 26, 100915. [Google Scholar] [CrossRef]
Figure 1. The CO2 adsorption energy of Na and TM atoms with different (100) surfaces.
Nanomaterials 15 01067 g001
Figure 2. The H2O adsorption energy of Na and TM atoms with different (100) surfaces.
Nanomaterials 15 01067 g002
Figure 3. The illustration for the in-depth investigation of the H2O/CO2–surface interaction.
Nanomaterials 15 01067 g003
Figure 5. The (100) surface charge density distribution of P- and O-phase (left and right columns, respectively) NaTMO2 (TM = Co, Ni, Mo, Nb). (a,b) for NaCoO2; (c,d) for NaNiO2; (e,f) for NaMoO2; (g,h) for NaNbO2. The cycle region is labeled by the elements. The double black–blue cycle is the TM-O bond.
Nanomaterials 15 01067 g005
Figure 6. The local projected density of state (PDOS) of surface Na atom with different (100) surfaces: (a) NaCoO2 (R 3 ¯ m); (b) NaNiO2 (R 3 ¯ m); (c) NaNbO2 (R 3 ¯ m); (d) NaMoO2 (R 3 ¯ m).
Nanomaterials 15 01067 g006
Figure 7. The local projected density of state (PDOS) of surface TM atoms with different (100) surfaces: (a) NaCoO2 (R 3 ¯ m); (b) NaNiO2 (R 3 ¯ m); (c) NaNbO2 (R 3 ¯ m); (d) NaMoO2 (R 3 ¯ m).
Nanomaterials 15 01067 g007
Figure 8. Band occupation and band center dependence of the H2O/CO2 adsorption energy at different sites of NaTMO2. (a) CO2 and H2O adsorption energy of the Na site of NaCoO2 and NaNiO2. (b) CO2 and H2O adsorption energy of the TM site of NaCoO2 and NaNiO2. (c) CO2 and H2O adsorption energy of the Na site of NaMoO2 and NaNbO2. (d) CO2 and H2O adsorption energy of the TM site of NaMoO2 and NaNbO2. Occ means occupation, and BC indicates the band center of S orbital band.
Nanomaterials 15 01067 g008
Disclaimer/Publisher’s Note: The statements, opinions and data contained in all publications are solely those of the individual author(s) and contributor(s) and not of MDPI and/or the editor(s). MDPI and/or the editor(s) disclaim responsibility for any injury to people or property resulting from any ideas, methods, instructions or products referred to in the content.

