Article

Microwave Dielectric Permittivity of Nanostructured RMn2O5 Manganate, R2Ti2O7 Titanate, and LiCoPO4 and LiNi0.5Co0.5PO4 Orthophosphate Composites

by
Anatoly B. Rinkevich
*,
Dmitry V. Perov
,
Evgeny A. Kuznetsov
and
Maria S. Stenina
M.N. Miheev Institute of Metal Physics UB RAS, Sofia Kovalevskaya St., 18, 620108 Ekaterinburg, Russia
*
Author to whom correspondence should be addressed.
Nanomaterials 2025, 15(13), 995; https://doi.org/10.3390/nano15130995
Submission received: 2 June 2025 / Revised: 22 June 2025 / Accepted: 23 June 2025 / Published: 26 June 2025

Abstract

The complex dielectric permittivity has been studied with the waves of millimeter wavelength for rare earth manganate and titanate and LiCoPO4 and LiNi0.5Co0.5PO4 orthophosphate composites. The measurements are carried out at frequencies of 26 to 38 GHz via measurements of transmission and reflection coefficients through a plate. A special method on how to extract the real and imaginary parts of dielectric permittivity is applied. Discussion is conducted on a nonmonotonic type of the frequency dependences for both real and imaginary parts of permittivity, and it has been shown that relaxation is non-Debye. The Cole–Cole, Havriliak–Negami, and Kohlrausch–Williams–Watts models cannot also explain the nonmonotonic frequency dependence of the real part of dielectric permittivity. Investigation of the structure and phase composition of nanocomposites has been carried out.

1. Introduction

The frequency dependences of the dielectric permittivity of nanostructures and nanocomposites have specific features conditioned by the space limitation of the components of heterogeneous media [1]. As noted in [2], a multi-channel propagation and scattering of phonons and photons is possible in nano-objects that influence the frequency dependences of permittivity. In recent years, an essential interest has attracted investigation of the magnetoelectric effect in multiferroics. This effect is studied specifically in rare earth manganates with the general formula RMn2O5, where R is a trivalent rare earth ion [3,4,5], and in the orthophosphates LiNiPO4 and LiCoPO4 [6]. In these systems, a complicated magnetic ordering of the antiferromagnetic type is realized at low temperatures, which can transform into an incommensurate noncollinear type of magnetic structure as temperature increases. The crystal and magnetic structures of several manganates have been investigated in [7] using magnetometry and neutron scattering. The crystal structures of RMn2O5 are orthorhombic at room temperature with the Pbam space group. The magnetic and dielectric properties of five rare earth manganates have been studied in [8]. The magnetic and dielectric phase transitions were demonstrated to occur simultaneously. As a rule, a ferroelectric polarization exists if the spin configuration for Mn4+ and Mn3+ ions is in the commensurate magnetic phase. The electric polarization in erbium and terbium manganates is studied in [9], and a special attention is drawn to the fact that the electric polarization presents, induced by local polar phase separation domains. In relaxors, standing ferroelectric phonons develop in nanoregions at the frequency when a wavelength equals the polar nanoregion size [10]. High values of the real part of dielectric permittivity have been found for manganates with R = Tb, Dy, and Er in the paraelectric phase at temperatures above 78 K at frequencies of 100 Hz to 1 MHz [11]. A correlation between the high dielectric permittivity and the size of R ions has been proposed. The influence of doping by yttrium on the complex dielectric permittivity of gadolinium manganate is studied in [12].
The magnetic structure of orthophosphates is investigated in a magnetic field up to 56 T by neutron diffraction and magnetometry [6]. The conditions that allow the magnetoelectric phase in LiNiPO4 to exist have been established. These orthophosphate compounds have an orthorhombic crystalline structure (space group Pnma) and commensurate antiferromagnetic ground states. A detailed study of the LiNiPO4 structure by scanning electron transmission microscopy and X-ray diffraction pointed that a considerable proportion of antisite defects presents in this compound, which may have a pronounced effect on the electrochemical and magnetoelectric properties [13]. The dielectric permittivity of LiNiPO4 is examined in [14]. Investigation of dielectric permittivity, performed over the frequency range 10 Hz to 1 MHz at temperatures of 150 to 300 °C, convinced that the relaxation is of non-Debye type. The dielectric permittivity and alternating current conductivity of the LiNiPO4 compound were investigated by impedance spectroscopy [15]. The presence of two thermally activated peaks is established from the temperature dependence of impedance. Raman and far-infrared spectra of LiNiPO4 were measured and discussed in [16]. It has been established that the value of losses is linked with the distortion of the [NiO6] octahedra. A low dielectric constant ε′ = 5.18 at a frequency f = 17.2 GHz is found in ceramics sintered at 825 °C. The LiNiPO4 and LiNi0.5Co0.5PO4 compounds are synthesized by the solid-state reaction method [17]. It is shown that the electrical conductivity of LiNi0.5Co0.5PO4 is higher than that of pure LiNiPO4. Zinc-doped LiCoPO4 was prepared by the solid-state reaction method [18]. It has been obtained from the temperature dependence of conductivity that both pure and Zn2+-doped samples obey the Arrhenius law.
The scenario of dielectric relaxation and the specific features of relaxors are discussed in the review [19]. The high-temperature dielectric properties of BiMn2O5 manganate are examined in [20], where it has been shown that BiMn2O5 ceramic demonstrates relaxor behavior. Using the impedance spectroscopy method, it was found that Dy-substituted YMn2O5 manganate exhibits a non-Debye type of relaxation [21]. The relaxation of dynamically correlated clusters is discussed theoretically in [22]. The Havriliak–Negami and Kohlrausch–Williams–Watts approaches are regarded as more suitable for the micro/mesoscopic relaxing systems. The non-Debye dielectric relaxation is inherent in complex heterogeneous media [23].
As a rule, the high real parts of the dielectric permittivity of rare earth manganates and orthophosphates up to tens of thousands are realized at low frequencies [9,14,21]. A drastic decrease in the real part occurs in GdMn2O5 and YMn2O5 at 2–3 kHz [12,21]. In ErMn2O5, TbMn2O5 DyMn2O5 manganates, it sharply decreases at frequencies of 10–100 kHz [11]. In relaxor bismuth manganite, a gradual monotonic decrease in the real part occurs starting from kilohertz to megahertz [20].
The dielectric permittivity of BaZrO3-BaTiO3 solid solutions is studied in a wide frequency range [24]. The high values of the real part of dielectric permittivity are about 200, remaining up to ~1011 Hz. A peak of losses at 100–200 GHz corresponds to a Debye-type relaxation. Additionally, another peak of losses presents in the GHz range. Its frequency dependence satisfies to the Cole–Cole model, and the relaxation time is related to thermally activated processes. In Ba2LaTi2Nb3O15 and Ba2La0.5Nd0.5Ti2Nb3O15 niobates, the relaxation takes place mostly at frequencies of MHz and GHz ranges and continues up to ~500 GHz [25]. The real part of permittivity at frequencies of less than 1 kHz is about 800, and it decreases monotonically if the frequency rises. The millimeter-wave dielectric permittivity of nanocomposite rare earth titanates is studied in [26]. The tendency is established that the real part of the dielectric constant of the rare earth nanocomposite titanate increases with the increase in quantum number S of rare earth ion R3+. The microwave dielectric permittivity of LiNiPO4 ceramic for LTCC applications is explored in [27]. The relaxation time was demonstrated to vary by TiO2 addition. The centimeter-wavelength dielectric permittivity of flower-like NiO structures was studied in [28]. These structures reveal enhanced microwave absorption properties. A new high-performance cobalt-free BaCe0.16Y0.04Fe0.8O3−δ nanocomposite was synthesized and studied [29].
As presented above, a short review of the dielectric properties of rare earth manganates and orthophosphates shows that these properties are valuable in order to understand magnetoelectric behavior. Most of the studies concern polycrystalline or ceramic samples, while nanocomposite samples are less examined. The structure and microwave dielectric properties of nanocomposite manganates with R3+: Er, Tb, Yb, and La; titanates R2Ti2O7 with R3+: Gd, Tb, Yb, Er, and Sm; and orthophosphates LiCoPO4 and LiNi0.5Co0.5PO4 at frequencies of 26 to 38 GHz are studied in this paper. All nanocomposites have been obtained by impregnation of particles in artificial opal matrices. Greatest attention is paid to which type of the frequency dependence of dielectric permittivity is realized, monotonic or nonmonotonic.

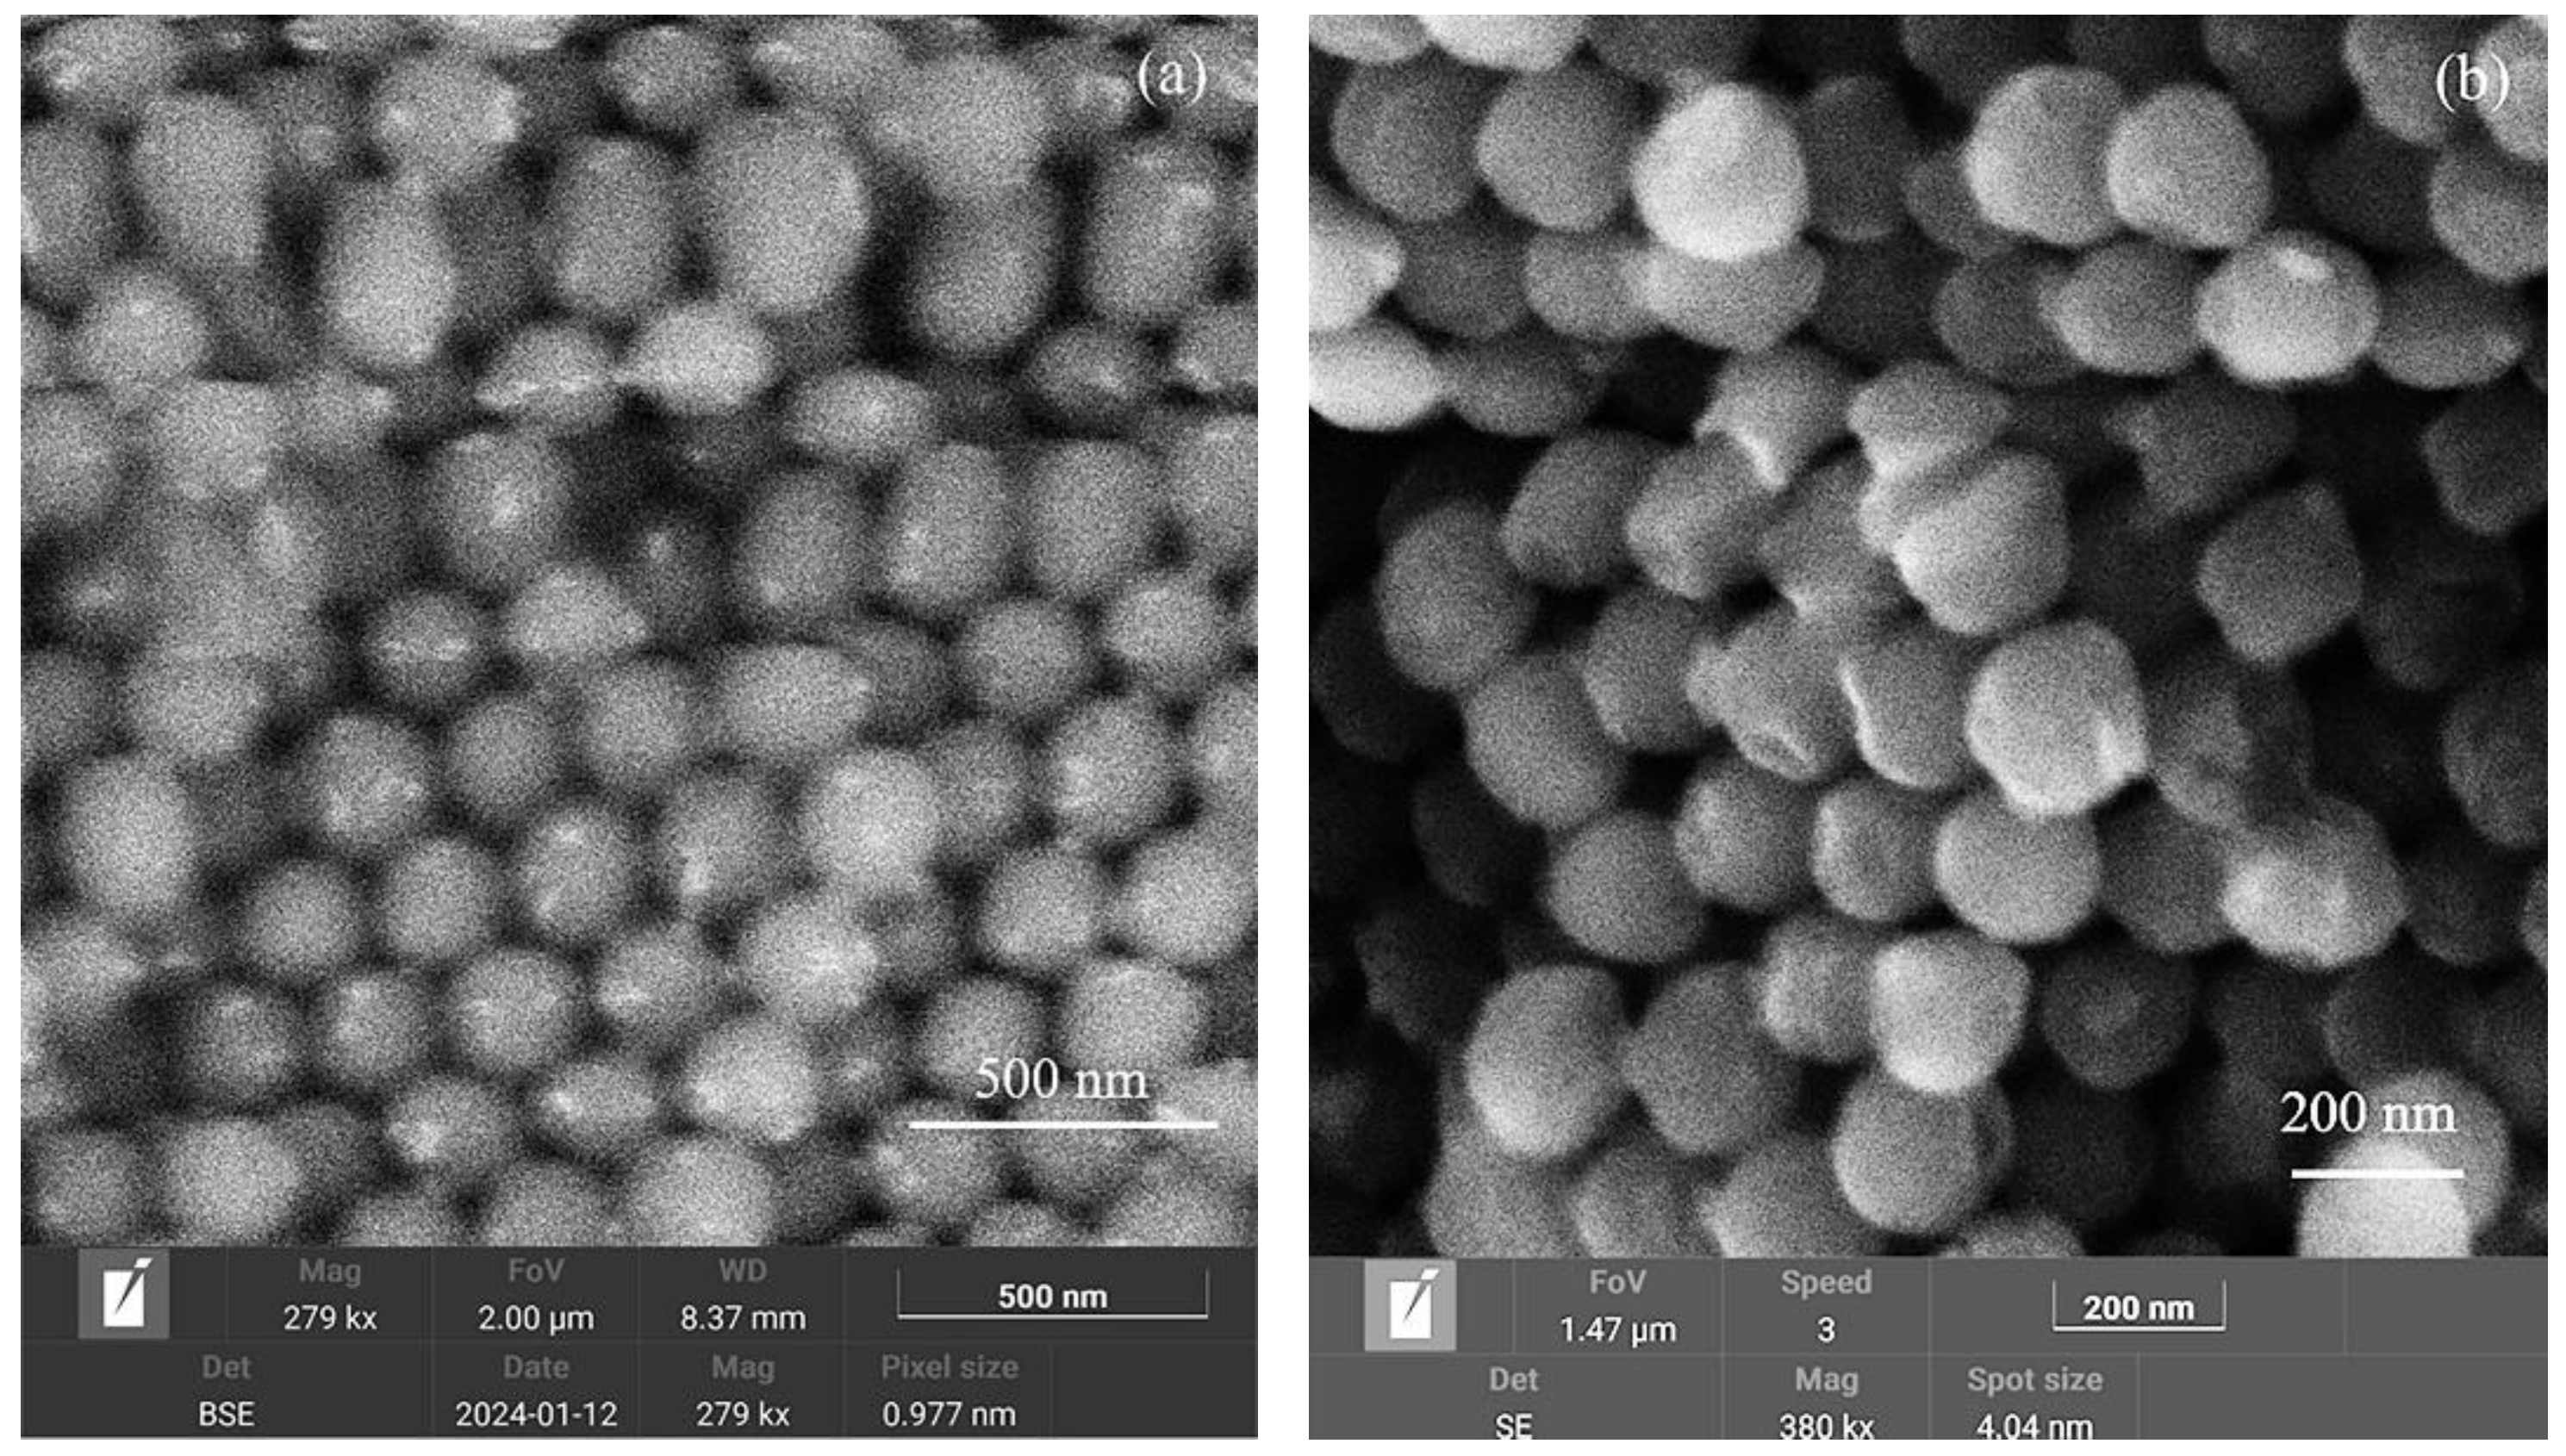
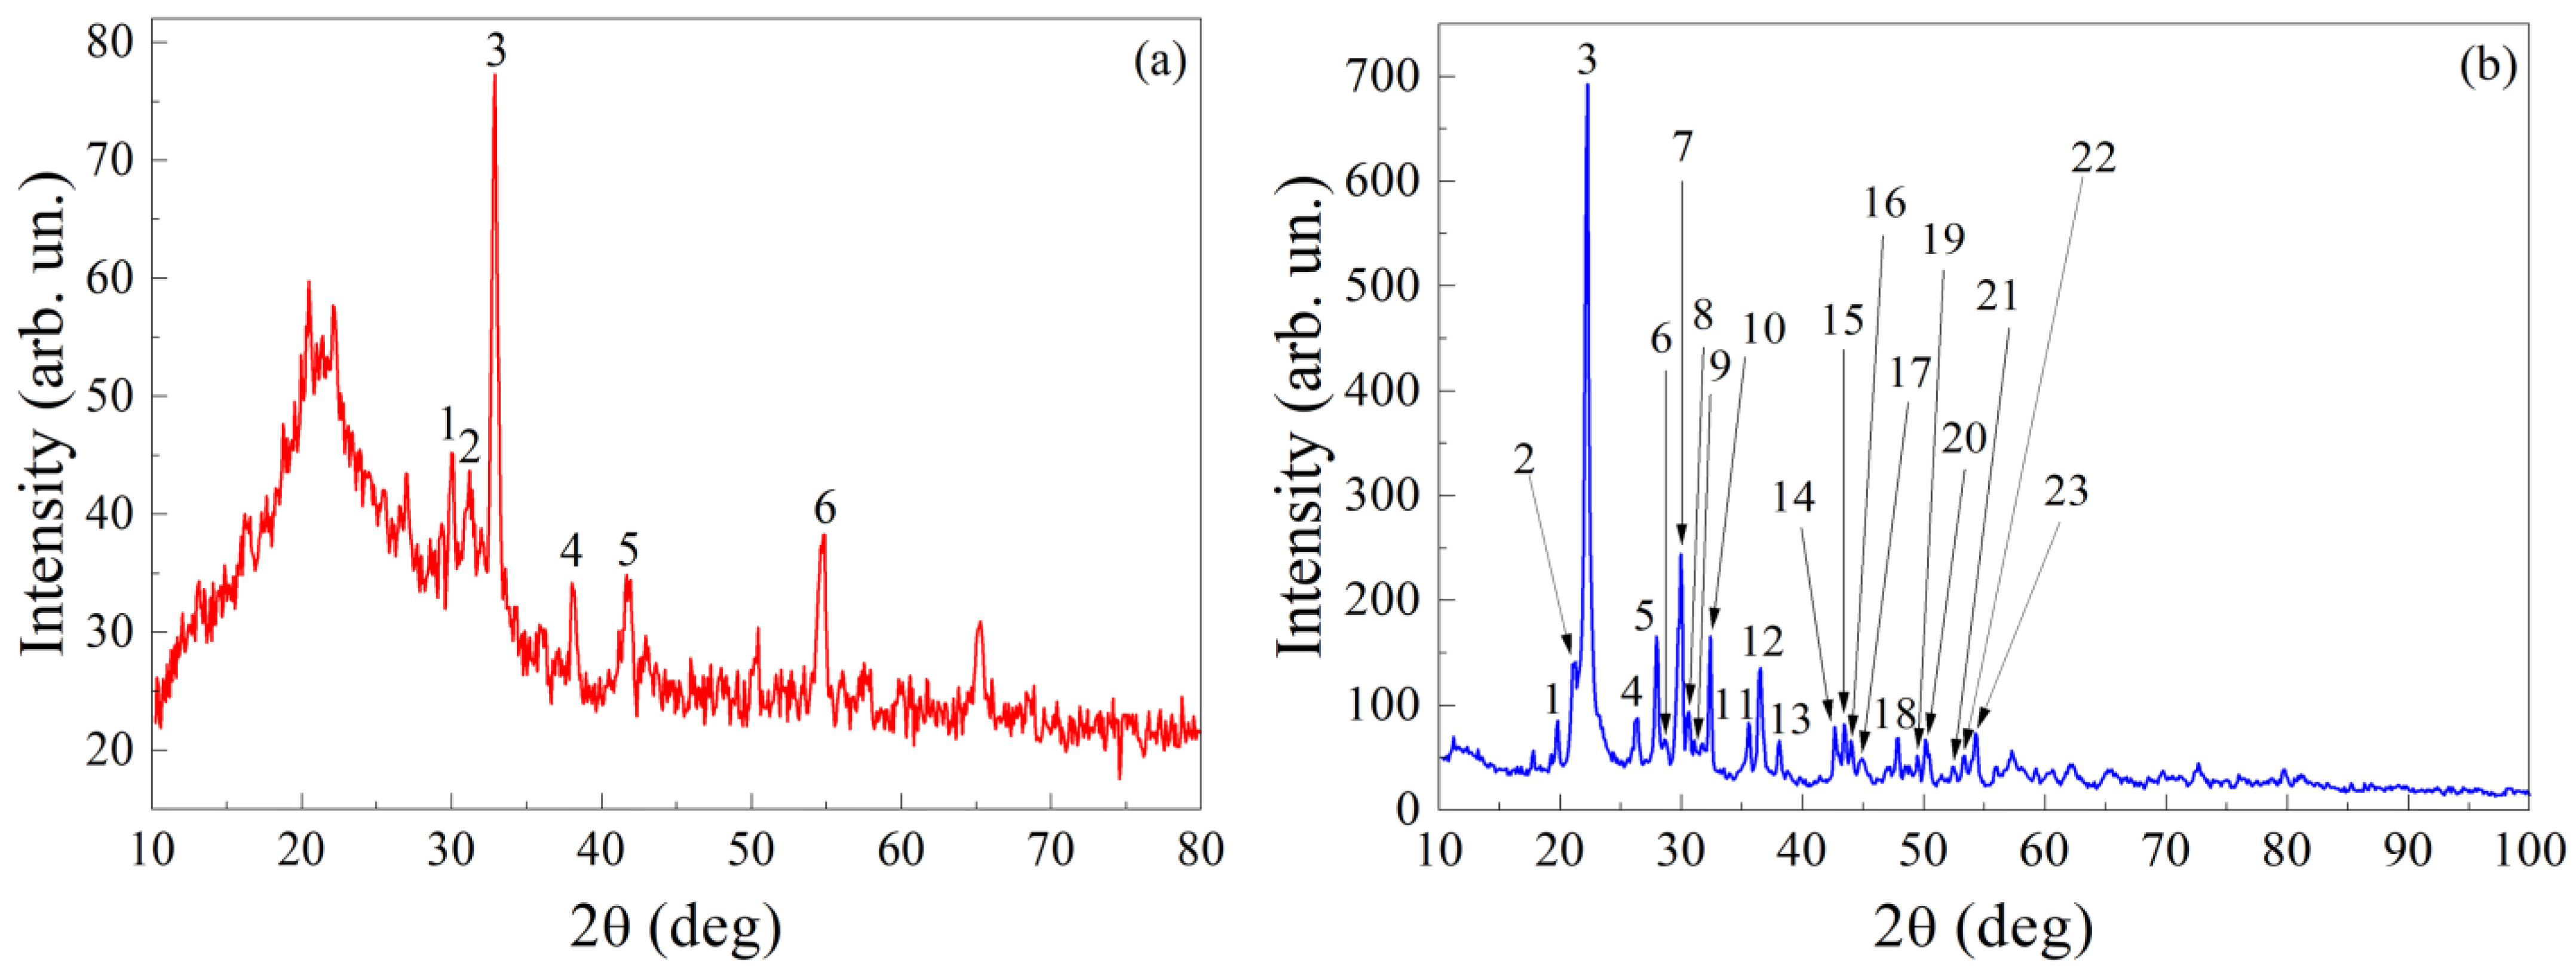
2. Preparation and Characterization of Nanocomposite Samples

Artificial opal matrices with a submicron SiO2 sphere diameter close to 260 nm were chosen as a matrix for nanocomposite samples. The opal matrices were prepared in JSC “Central Research Institute of Technology” Technomash. The nanocomposites were obtained by the impregnation method with subsequent thermal treatment [30]. The matrix was saturated by a water precursor solution. Drying and thermal treatment were performed later. In order to obtain the rare earth manganates, annealing at 900 °C was need. To increase the filling of the inter-spherical voids, the impregnation and thermal treatment procedures were repeated 4–6 times. The structure of the samples was investigated with the scanning electron microscope Tescan MIRA LMS (Tescan, Brno, Czech Republic). An image of the structure of the sample with TbMn2O5 is shown in Figure 1a. The particles of the embedded substance (they are light in Figure 1a) had either irregular or close to spherical shape. The size of most particles did not exceed 60 nm.
The elemental composition was performed with an EDAX instrument. For the sample with TbMn2O5 particles, this analysis determined the following elements: Tb, Mn, O, and Si. The elemental composition of this sample is presented in Table 1. An X-ray diffraction image for the sample with TbMn2O5 particles is shown in Figure 2a. XRD refinement was conducted to identify the detailed structural information and the phase content [31]. The X-ray data for the sample are given in Table 2. The X-ray diffraction data obtained with DRON–3M and XRD-6000 with CuKα irradiation show that, besides SiO2 (hexagonal syngony, space group P3221), the following crystalline phases are present in the composite: TbMn2O5 (orthorhombic syngony, Pbam, 50-0294), in accordance with the ICDD PDF-2 database, and also small amount of Mn2O3 (cubic syngony, Ia-3, 89-4836).
The crystalline structure of LiMPO4 orthophosphates belongs to the olivine type of structure, and it is described by the crystallographic space group Pnma [32]. The element cell of orthophosphates contains four Co++ or/and Ni++ ions. The crystalline structure has a rhombic symmetry. In order to obtain composites, a sample of an opal matrix is placed in Li3PO4 and Ni3(PO4)2 or Co3(PO4)2 solution, where it is kept for certain number of minutes so that the inter-spherical voids are filled with the solution. After drying, annealing at 900 °C is performed. This procedure is repeated 4–6 times for more infilling of voids by orthophosphate. The method for preparing composite multiferroics in the opal matrices is described in [33].
The structure of the nanocomposite samples with orthophosphate particles has been studied with the scanning electron microscope Tescan MIRA LMS. The results for the sample with LiCoPO4 particles are shown in Figure 1b. The embedded substance is found in the inter-spherical voids. Therefore, the maximal size of the particles is less than 60 nm. The shape of the particles is either irregular or close to spherical. The elemental composition obtained with EDAX is presented in Table 3. X-ray structure analysis is carried out in CuKα irradiation. The X-ray diffraction image for samples with LiCoPO4 particles is shown in Figure 2b. The X-ray data for the sample with LiCoPO4 nanoparticles are presented in Table 4. Silicon dioxide (SiO2) is mostly in X-ray amorphous state and partially in the crystalline one. The crystalline phase of SiO2 corresponds to cristobalite (tetragonal syngony, P41212) and tridymite (hexagonal syngony, P63/mmc). The introduced substance LiCoPO4 or LiNi0.5Co0.5PO4 is related to orthorhombic syngony, Pnma. Estimations give sizes of 37–50 nm for the regions of coherent X-ray scattering.
A characterization of the samples of rare earth titanates is presented in [34]. A list of the samples used in this paper is presented in Table 5. The chemical composition of particles in nanocomposites is shown, as well as the number of impregnations applied during preparation. The values of the real ε′ and imaginary ε″ parts of the dielectric permittivity of the samples averaged over the frequency range 26 to 38 GHz are presented in Table 5.
As a whole, all samples under study have the elemental and phase composition close to the nominal one. The nanoparticles of the embedded substance are located in the inter-spherical voids of an opal matrix. The concentration of the embedded substance is below the percolation threshold. Particles are either irregular in shape or close to spherical.

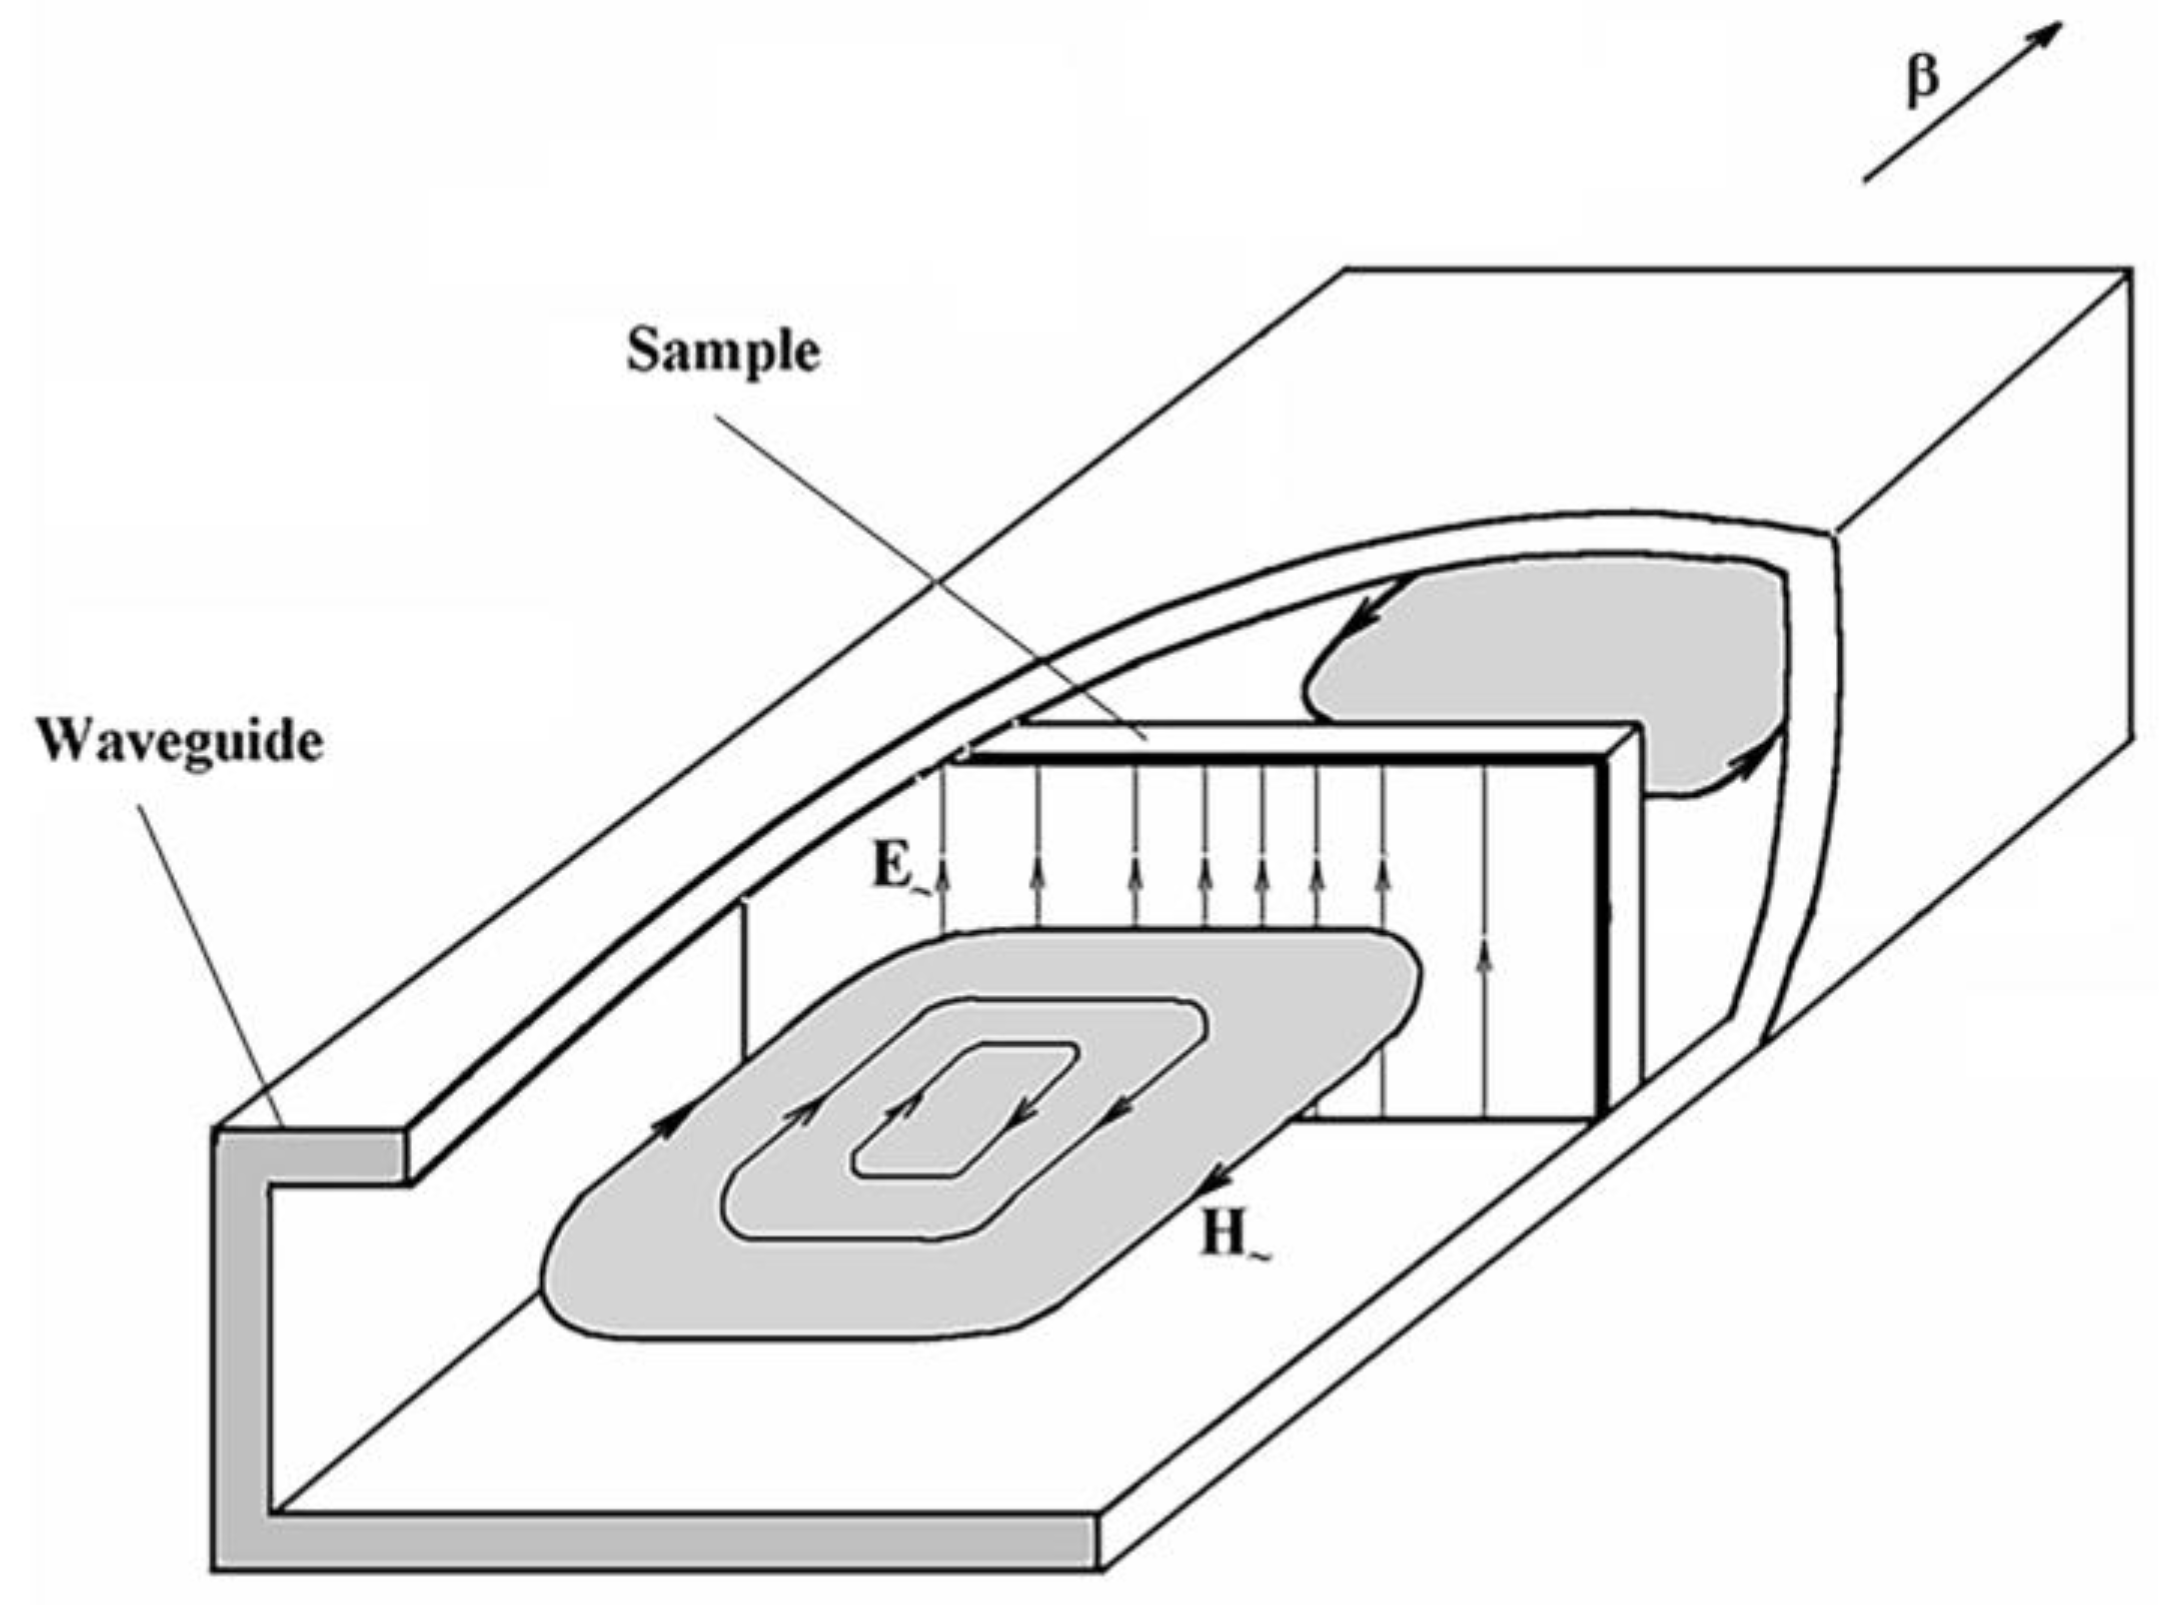
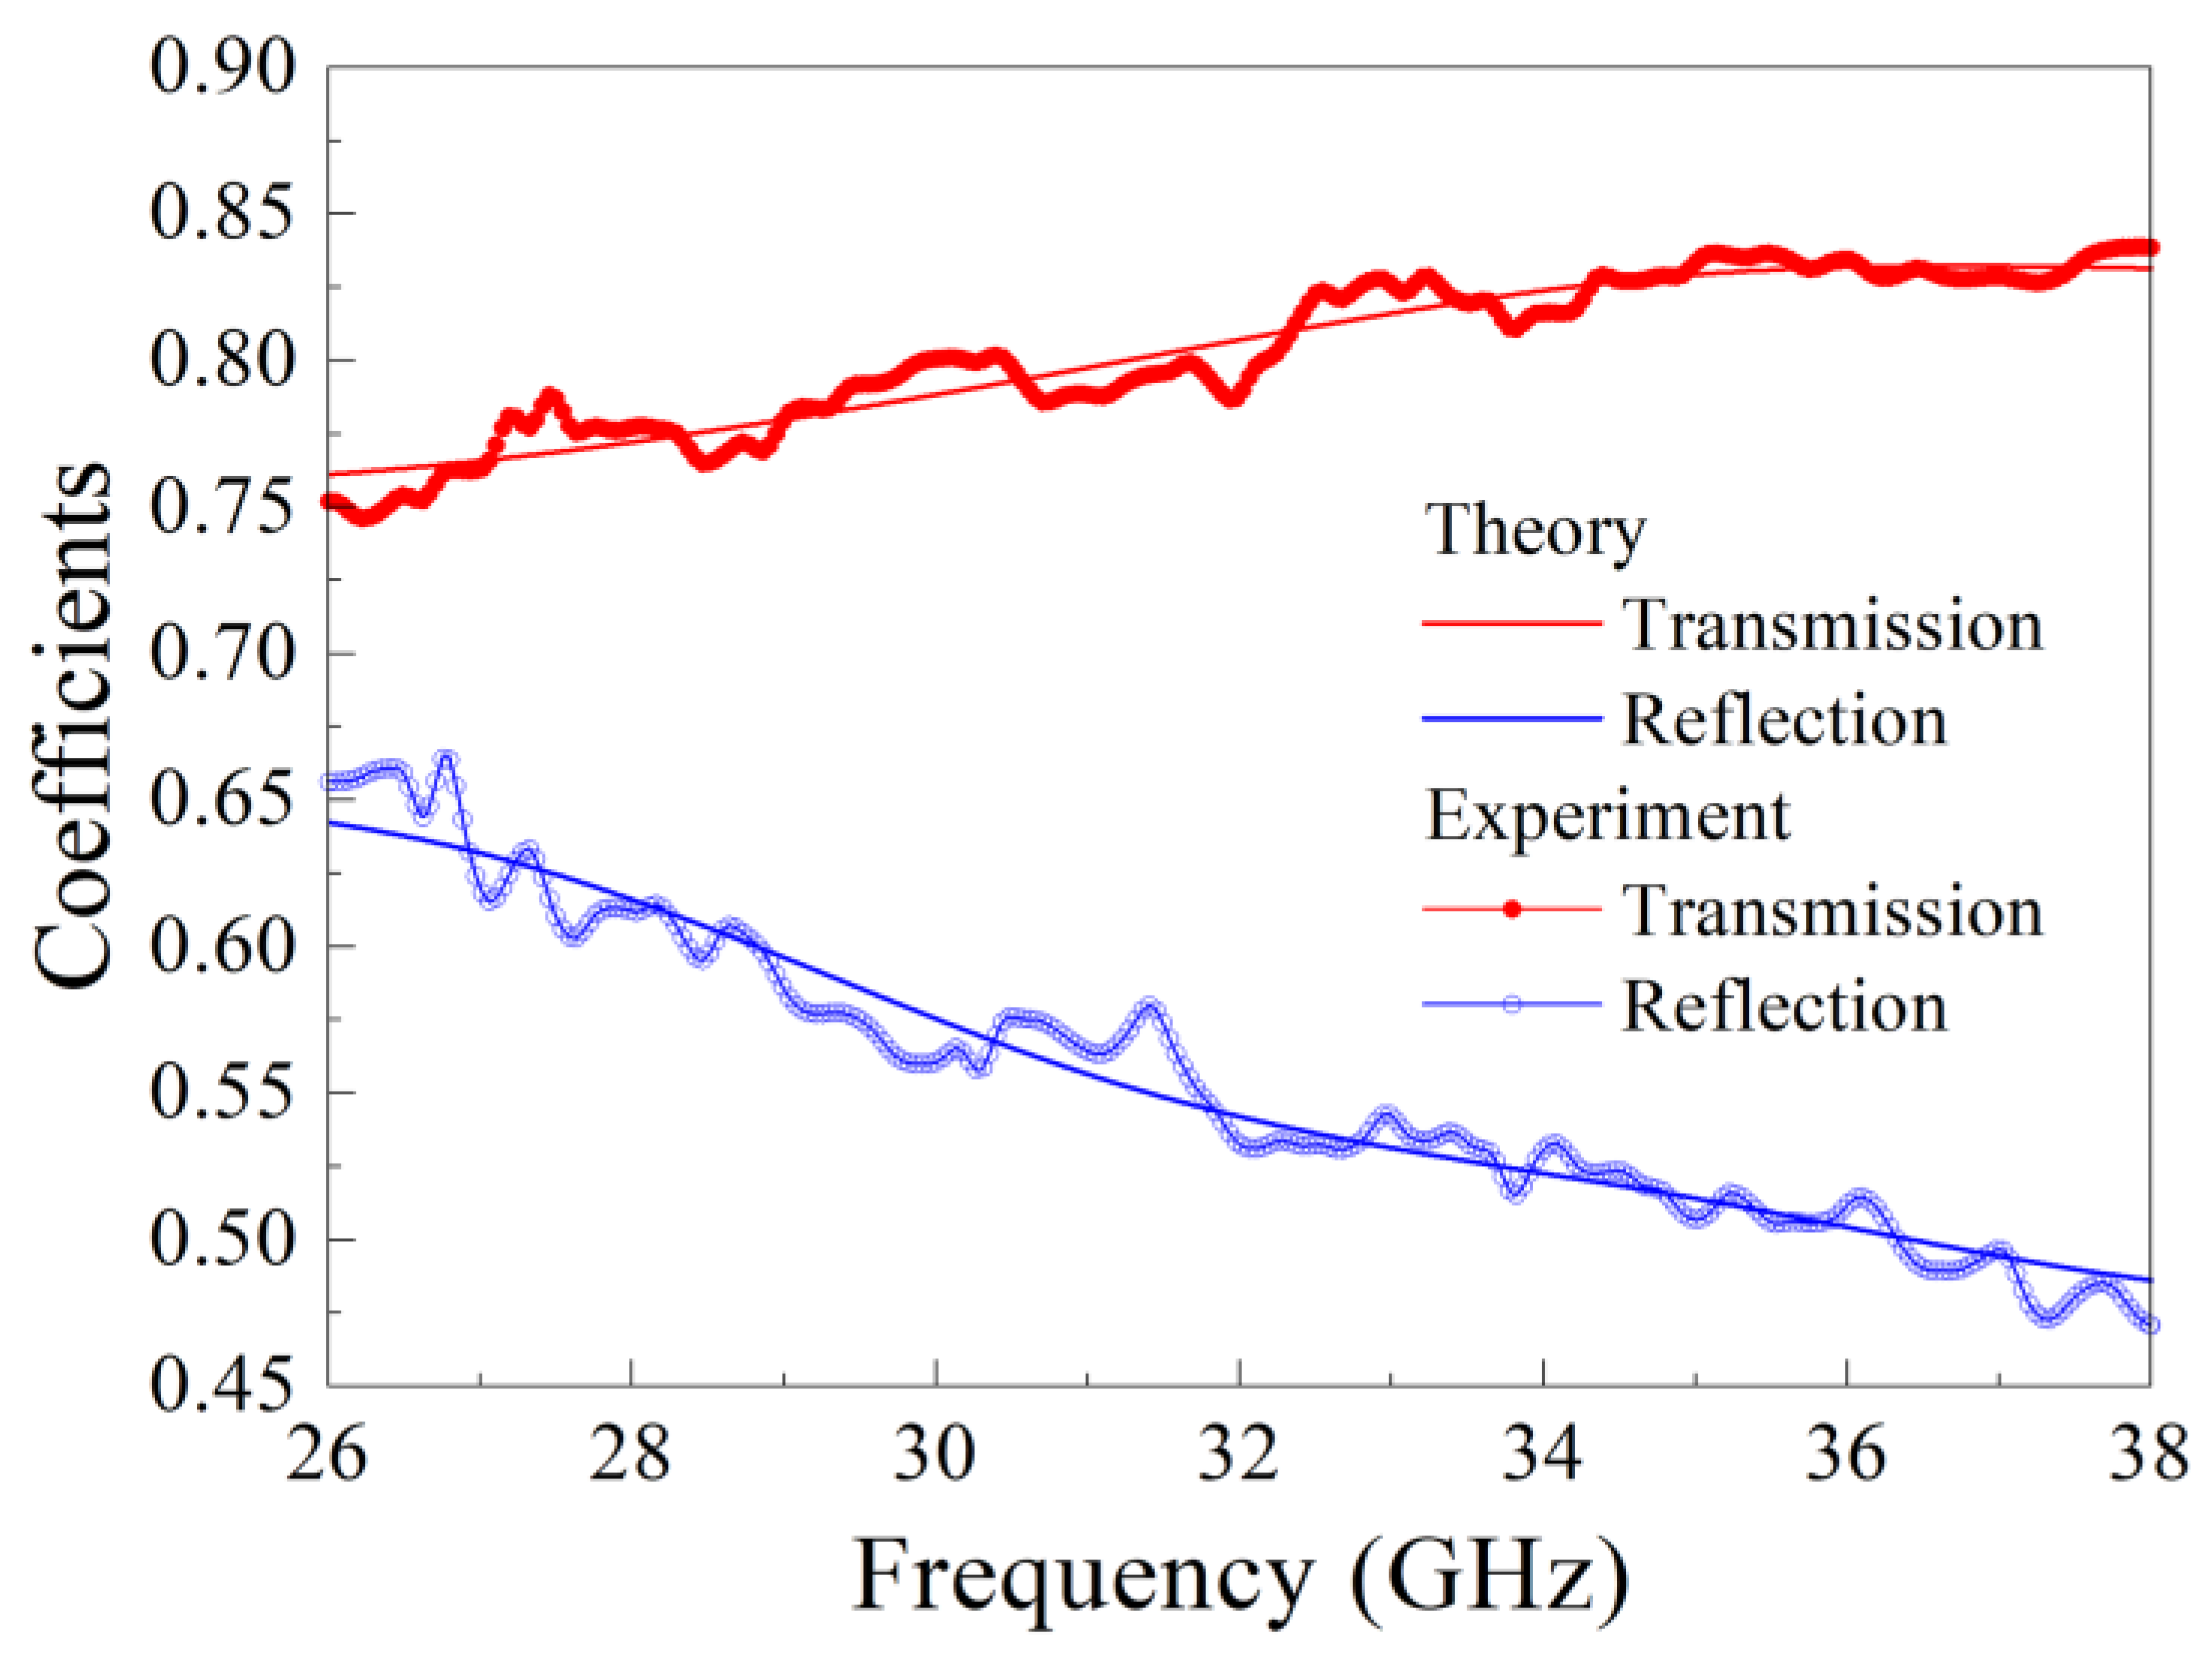
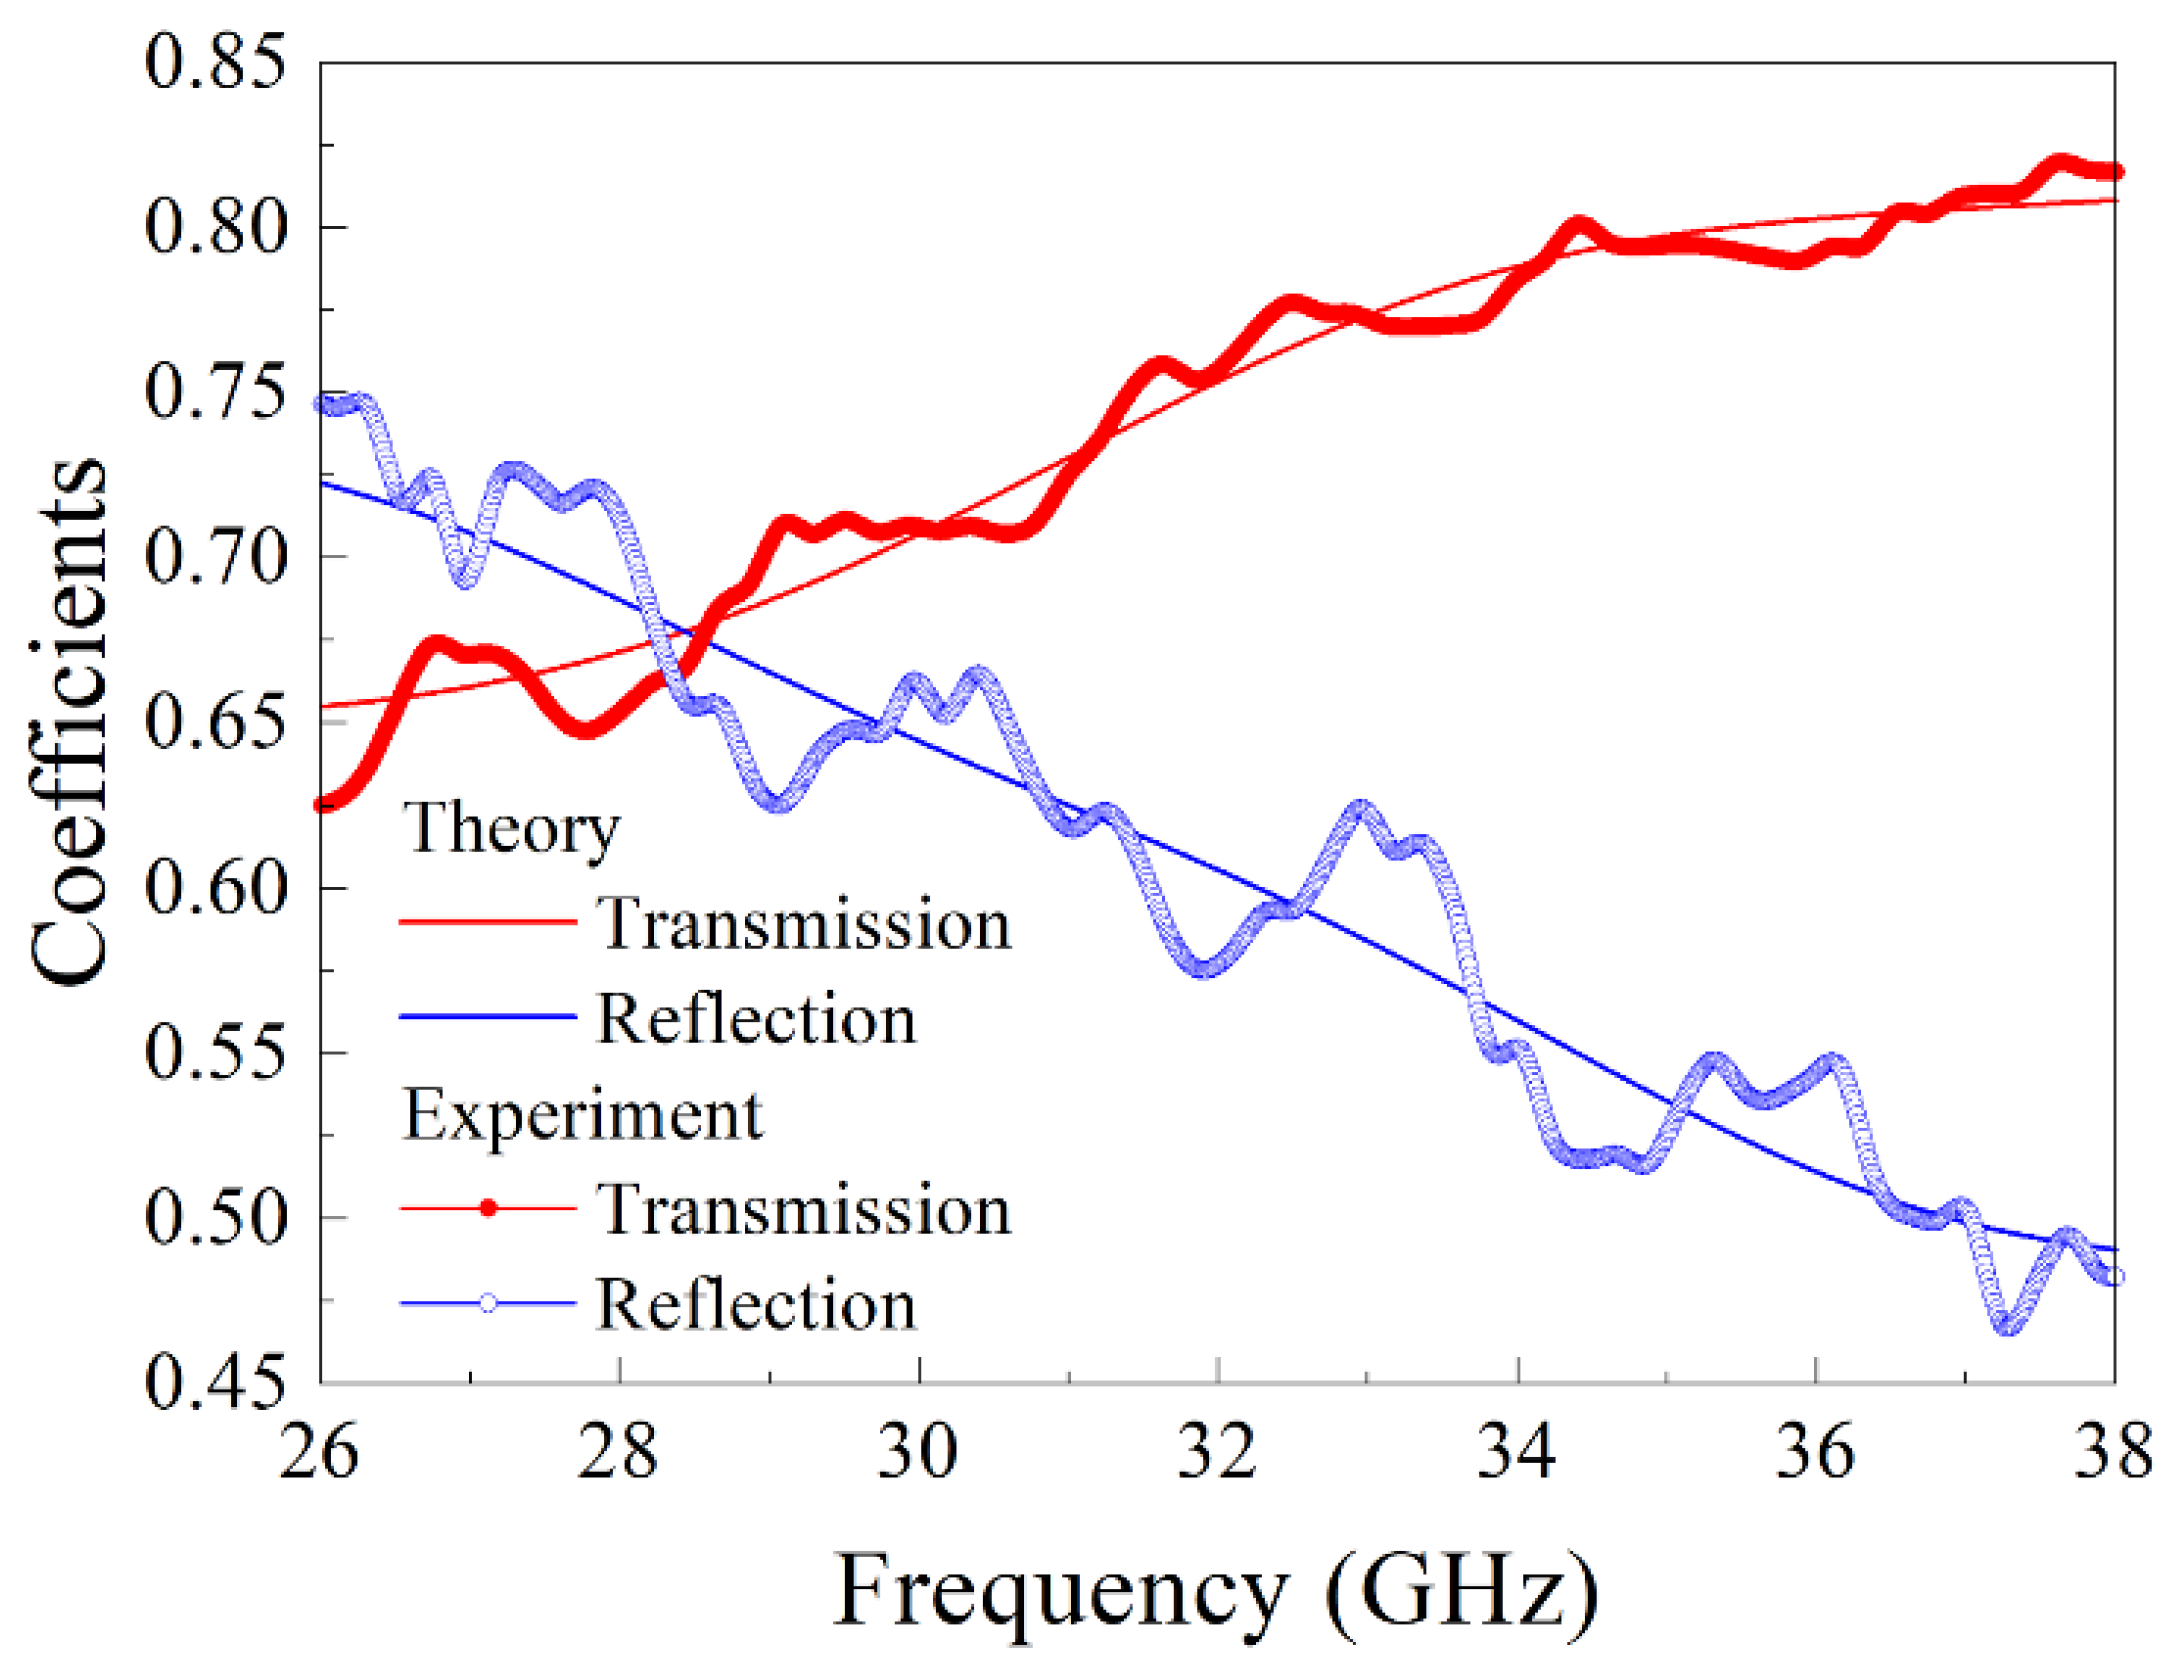
3. Measurement of Microwave Dielectric Permittivity

The microwave measurements are carried out using the wave transmission/reflection method at room temperature [35]. The measurements are performed in the frequency range 26 to 38 GHz. The scheme of the sample disposition in a waveguide is shown in Figure 3. The power transmission T and reflection R coefficient modules and their frequency dependences are measured.
The view of the frequency dependence of transmission and reflection coefficients is determined by the following factors: (1) the relation between the sample thickness d and the wavelength λ , (2) the value of the absorption coefficient, and (3) the dispersion of TE10 mode in the rectangular waveguide. The frequency dependences of transmission and reflection coefficients are used in order to restore the effective dielectric permittivity ε = ε i ε of a nanocomposite medium [35]. Let us denote the impedance for the part of the waveguide with the sample as Z 2 and the impedance outside the sample as Z 1 . The complex propagation constant in the sample is indicated as β 2 = β 2 + i β 2 . The thickness of the sample equals d, and the greater side of the waveguide is a. The complex transmission T and reflection R coefficients can be calculated via the formulas [36,37]
T = 1 cos β 2 d + i 2 ξ + ξ 1 sin β 2 d
R = i 2 ξ ξ 1 sin β 2 d cos β 2 d + i 2 ξ + ξ 1 sin β 2 d
where ξ = Z 2 / Z 1 is the ratio of the impedances. The propagation constant is calculated as β 2 = ω c 2 ε μ π a 2 , where ε and μ are the effective dielectric permittivity and magnetic permeability of the composite media. We believe that μ ≈ ~1 at our frequencies ~30 GHz. Let us designate the experimentally measured transmission coefficient module as T and the difference between the theoretical transmission coefficient from (1) and the experimental transmission coefficient at a given frequency ω = 2 π f as Δ T = Δ T ω , ε = T T . In the same way, we can introduce Δ R = Δ R ω , ε = R R for the reflection coefficient. The value of the complex permittivity ε = ε i ε is an unknown quantity. Using the least square method, we search for the minimal value of the total approximation error
Δ ε , ε 2 = min ε = ε min ε = ε   Δ R ω , ε , ε 2 + Δ T ω , ε , ε 2
The value ε = ε i ε obtained as a result is considered an estimate of the dielectric permittivity. The minimization of the error (3) can be performed both in the entire frequency range, in which measurements were performed, and in narrower intervals within it, which can be called windows. By moving such a window over the frequency range, it is possible to determine the frequency dependences of the complex permittivity, rather than its single value, as when estimating over the entire range. Thus, the use of a frequency window makes it possible to identify the dispersion of permittivity of the material under study. The minimal width of the window is selected in such a way that it contains at least one period of oscillation of the frequency dependences of the reflection and transmission coefficients, which can appear due to the partial mismatch of the waveguide measuring line to the load at its output. Averaging the data within the frequency window makes it possible to reduce the influence of these oscillations on the result of the permittivity estimation.
The part of the power dissipated inside the sample is designated as dissipation D. The absorbed and scattered power contributes to the dissipation and the power of non-propagating modes transformed from the fundamental waveguide mode TE10. The dissipation can be calculated from the transmission and reflection coefficients as
D = 1 T 2 R 2

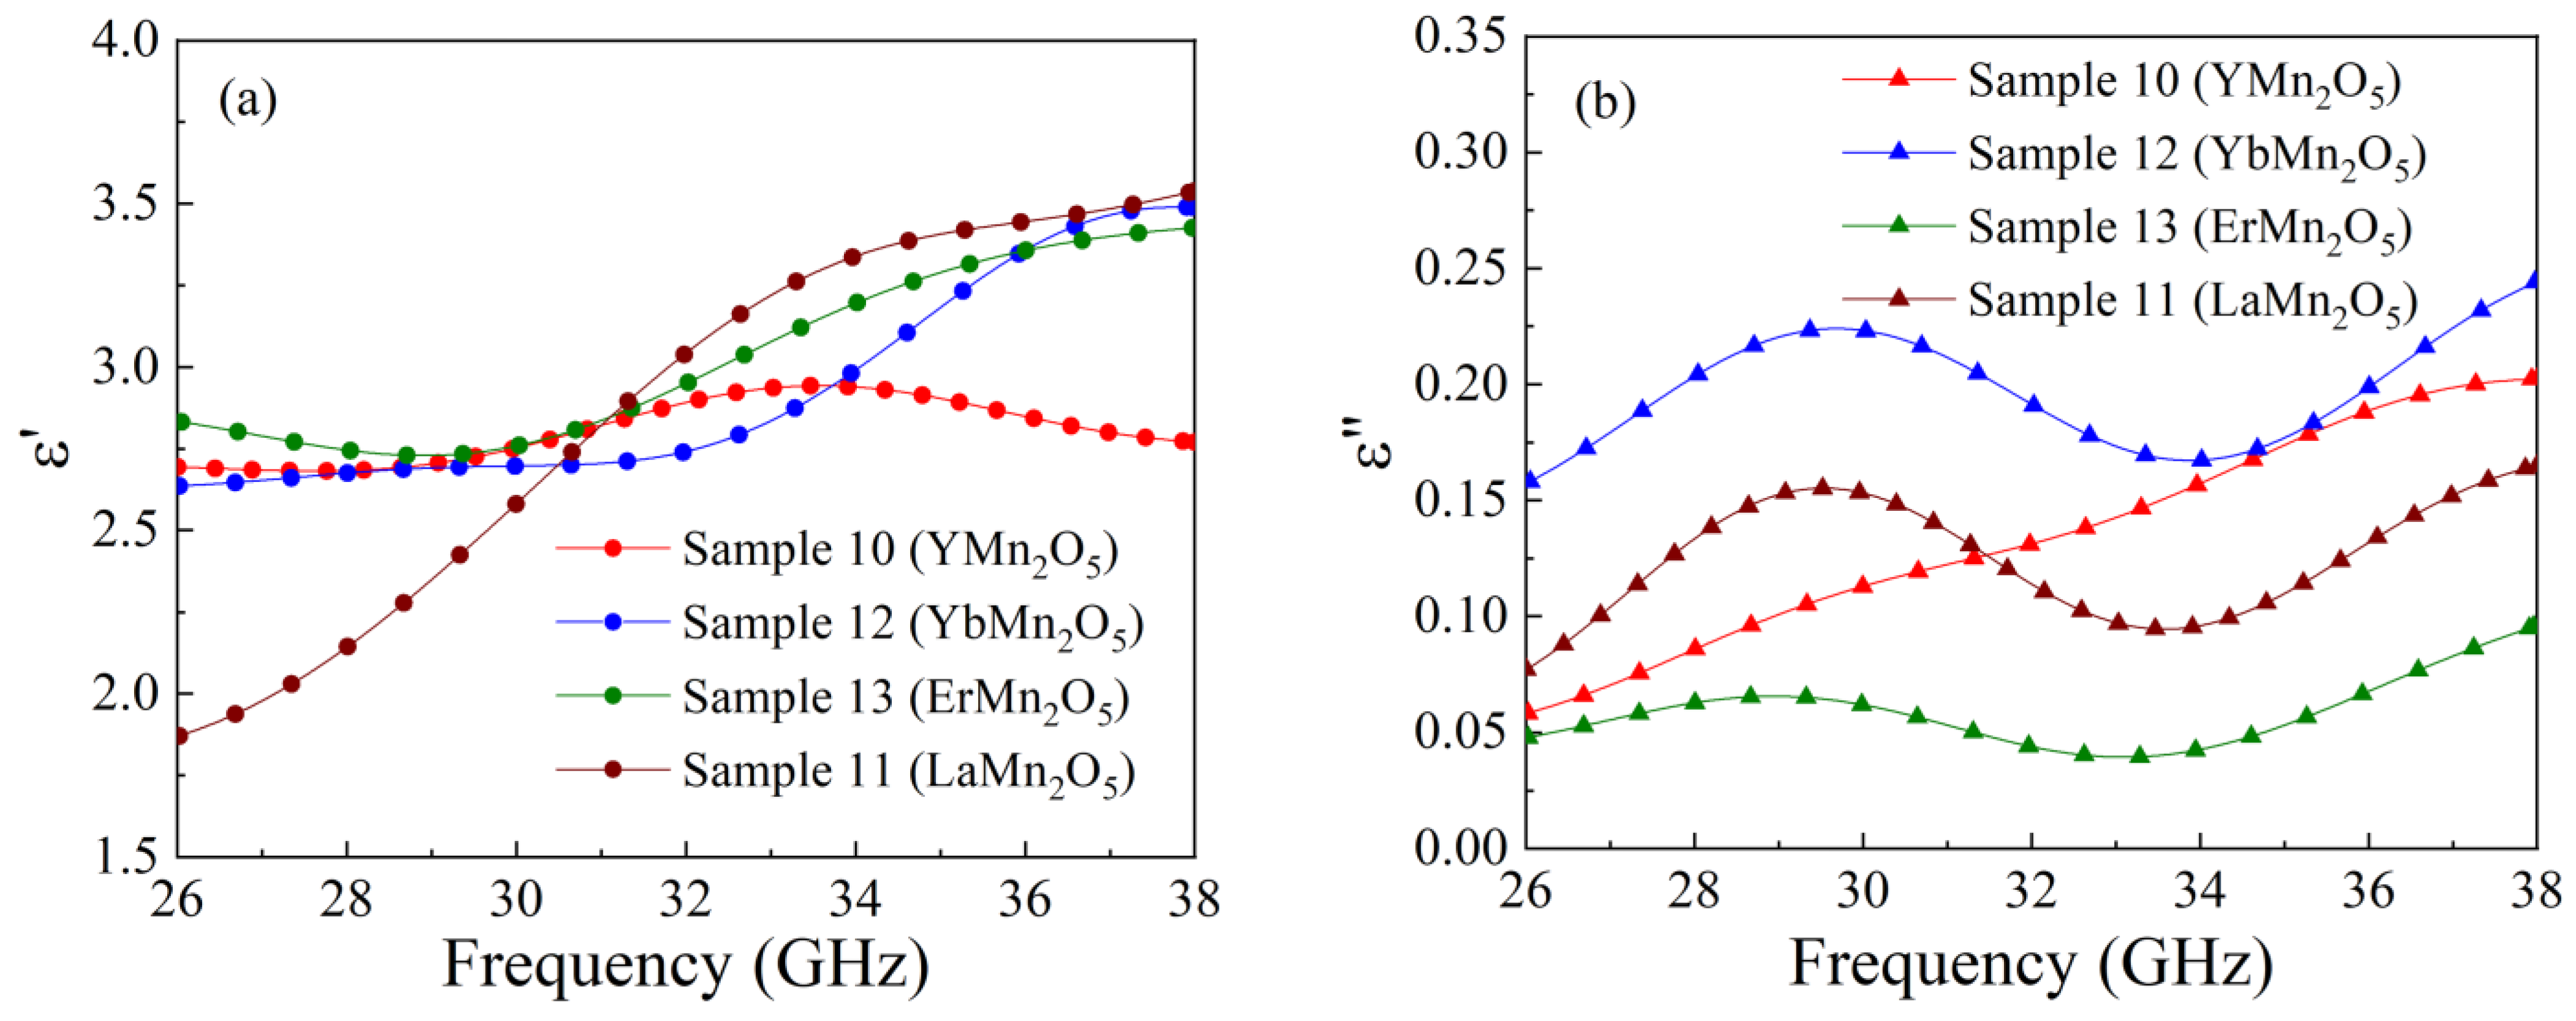
4. Dielectric Permittivity of Manganate Composites

Let us consider the results of the frequency dependences’ measurement of transmission and reflection coefficients for manganate composite samples. These dependences for a nanocomposite sample with ErMn2O5 particles are shown in Figure 4. It is obvious that the calculated dependence is close to the measured one, and small differences are conditioned by a slight mismatch of the microwave tract. The application of the method described in the above section allows us to restore the frequency dependence of the real and imaginary parts of the complex dielectric permittivity. The results for samples with YMn2O5, ErMn2O5, YbMn2O5, and LaMn2O5 particles are shown in Figure 5. The designation of the manganate samples is given in Table 5. Within the range concerned, the real part of permittivity ε′ of sample 10 with YMn2O5 particles varies nonmonotonically with the increase in frequency, and it has a maximum close to 33 GHz. The dependences for other samples increase in the frequency range 26 to 38 GHz, but they evidently have maxima at higher frequencies because ε′ must tend toward 1 if the frequency rises infinitely. The imaginary part ε for samples 11, 12, and 13 is a nonmonotonic function; moreover, for these samples, it has a maximum at frequencies of 30–32 GHz. In the high-frequency region of the range, namely, at frequencies of more than 35 GHz, the ε″ function increases again. The inequality ε″ << ε′ is valid for all samples in the whole frequency range 26–38 GHz. For comparison, the dielectric permittivity of an empty opal matrix is about 2.4–2.5. In principle, a low value of ε″ is not surprising for multiferroics; see [38], for example.

5. Dielectric Permittivity of Rare Earth Titanate Composites

The frequency dependences of transmission and reflection coefficients for sample 4 with Gd2Ti2O7 particles are shown in Figure 6. The bold lines indicate the measured dependences, whereas the thin lines are related to the calculated ones via Formulas (1) and (2). The frequency dependences of the real and imaginary parts of the dielectric permittivity of the nanocomposites with rare earth titanate particles are shown in Figure 7, and the averaged ones over the frequency range values are placed in Table 5. The frequency dependences of ε for samples 4–6 are nonmonotonic within the discussed range. For samples 5, 7, and 8 at frequencies above 35 GHz, an increase in ε is seen if the frequency rises. Probably, the maximum takes place at higher frequencies. For the imaginary part of the dielectric permittivity, the maximum is found close to 29–30 GHz for samples 4–7. Therefore, the nonmonotonic frequency dependence for both the real and imaginary parts of the dielectric permittivity is observed for almost all samples of rare earth titanates under study.

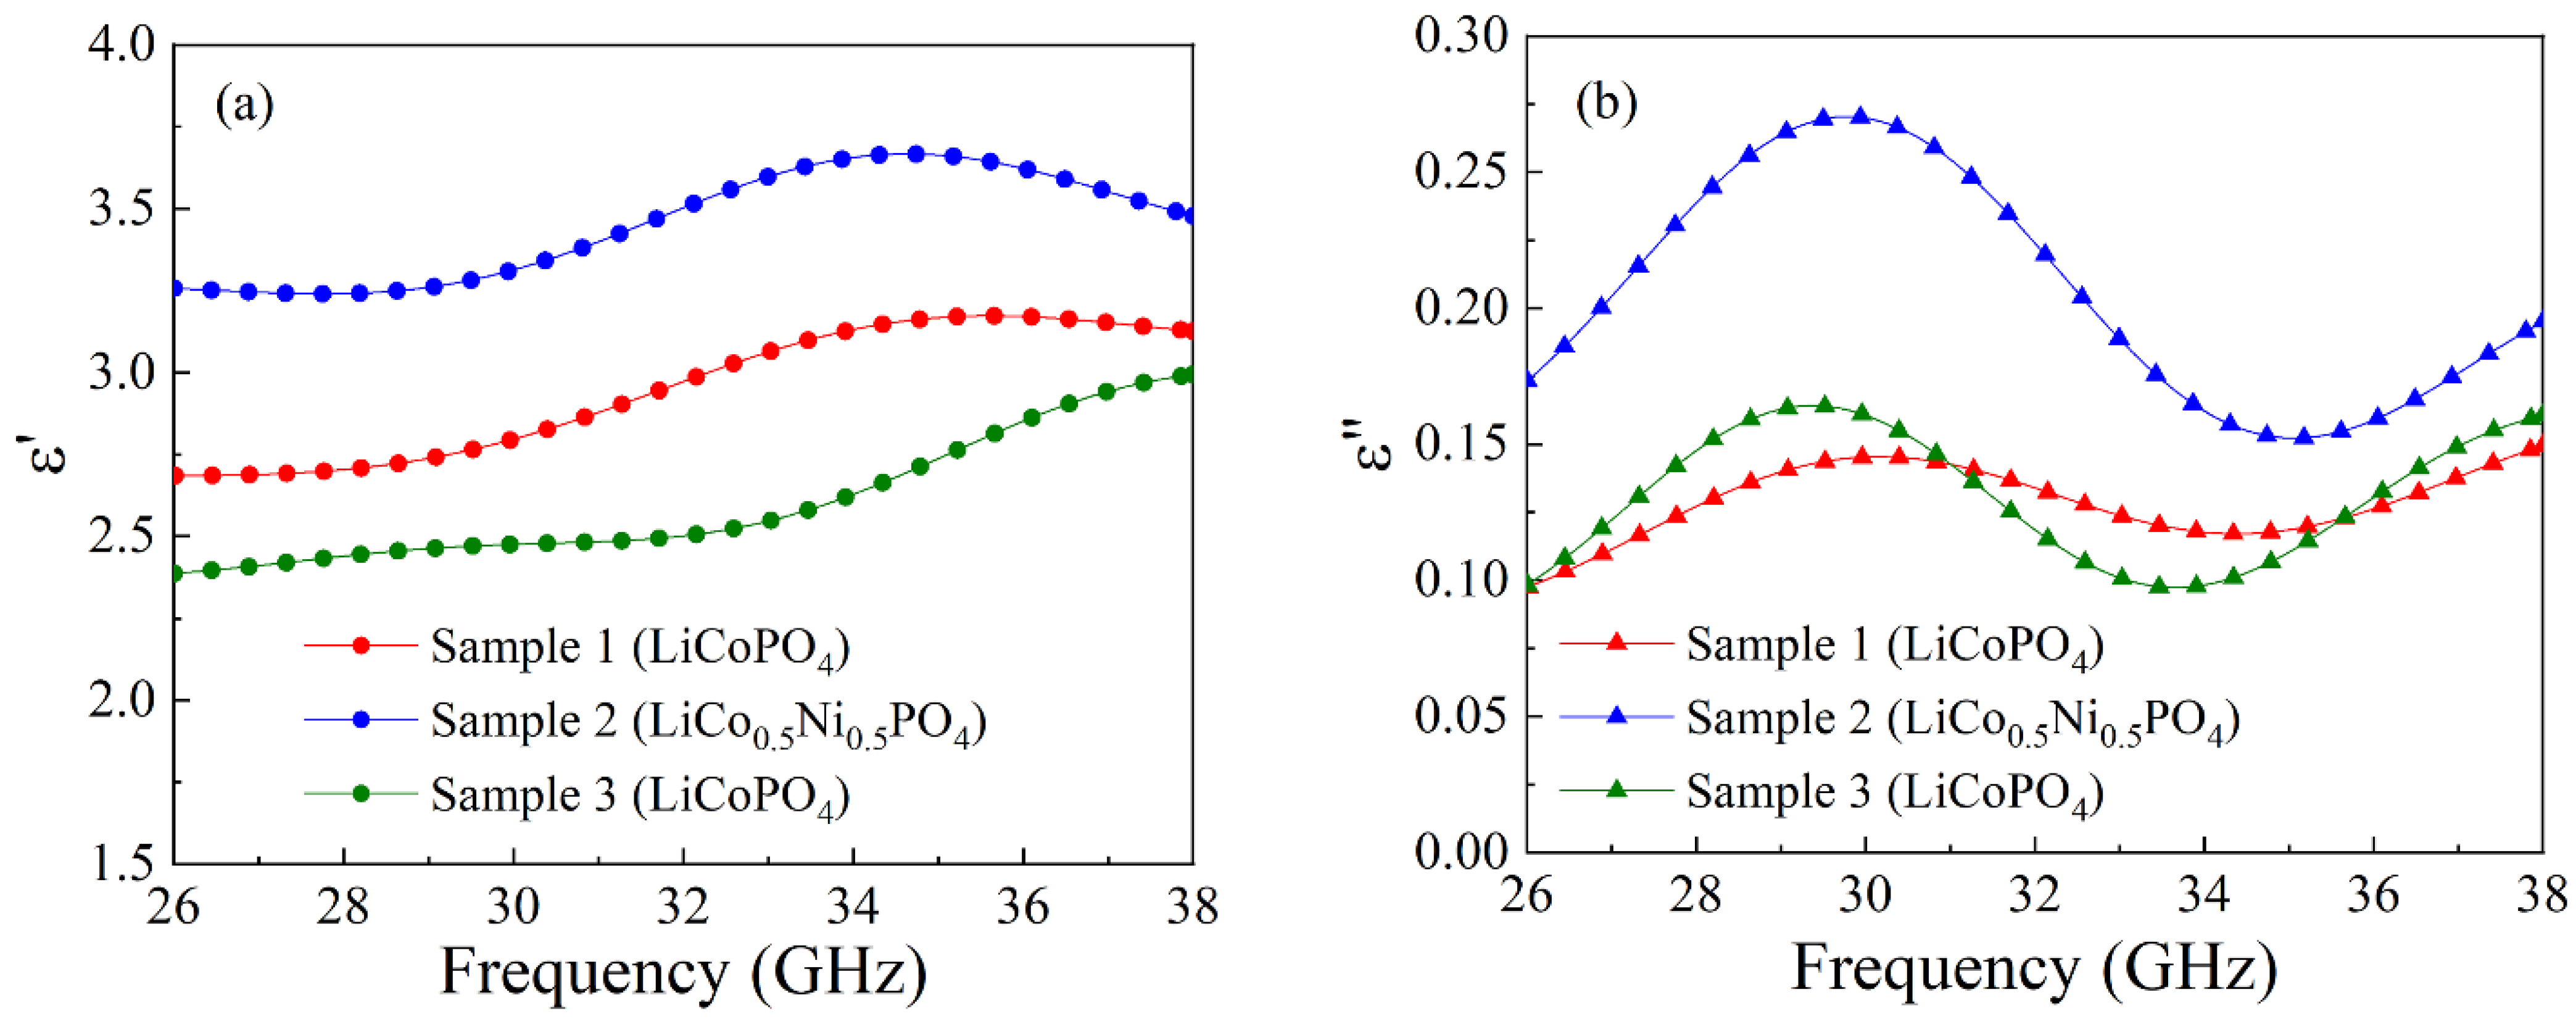
6. Dielectric Permittivity of Orthophosphate Composites
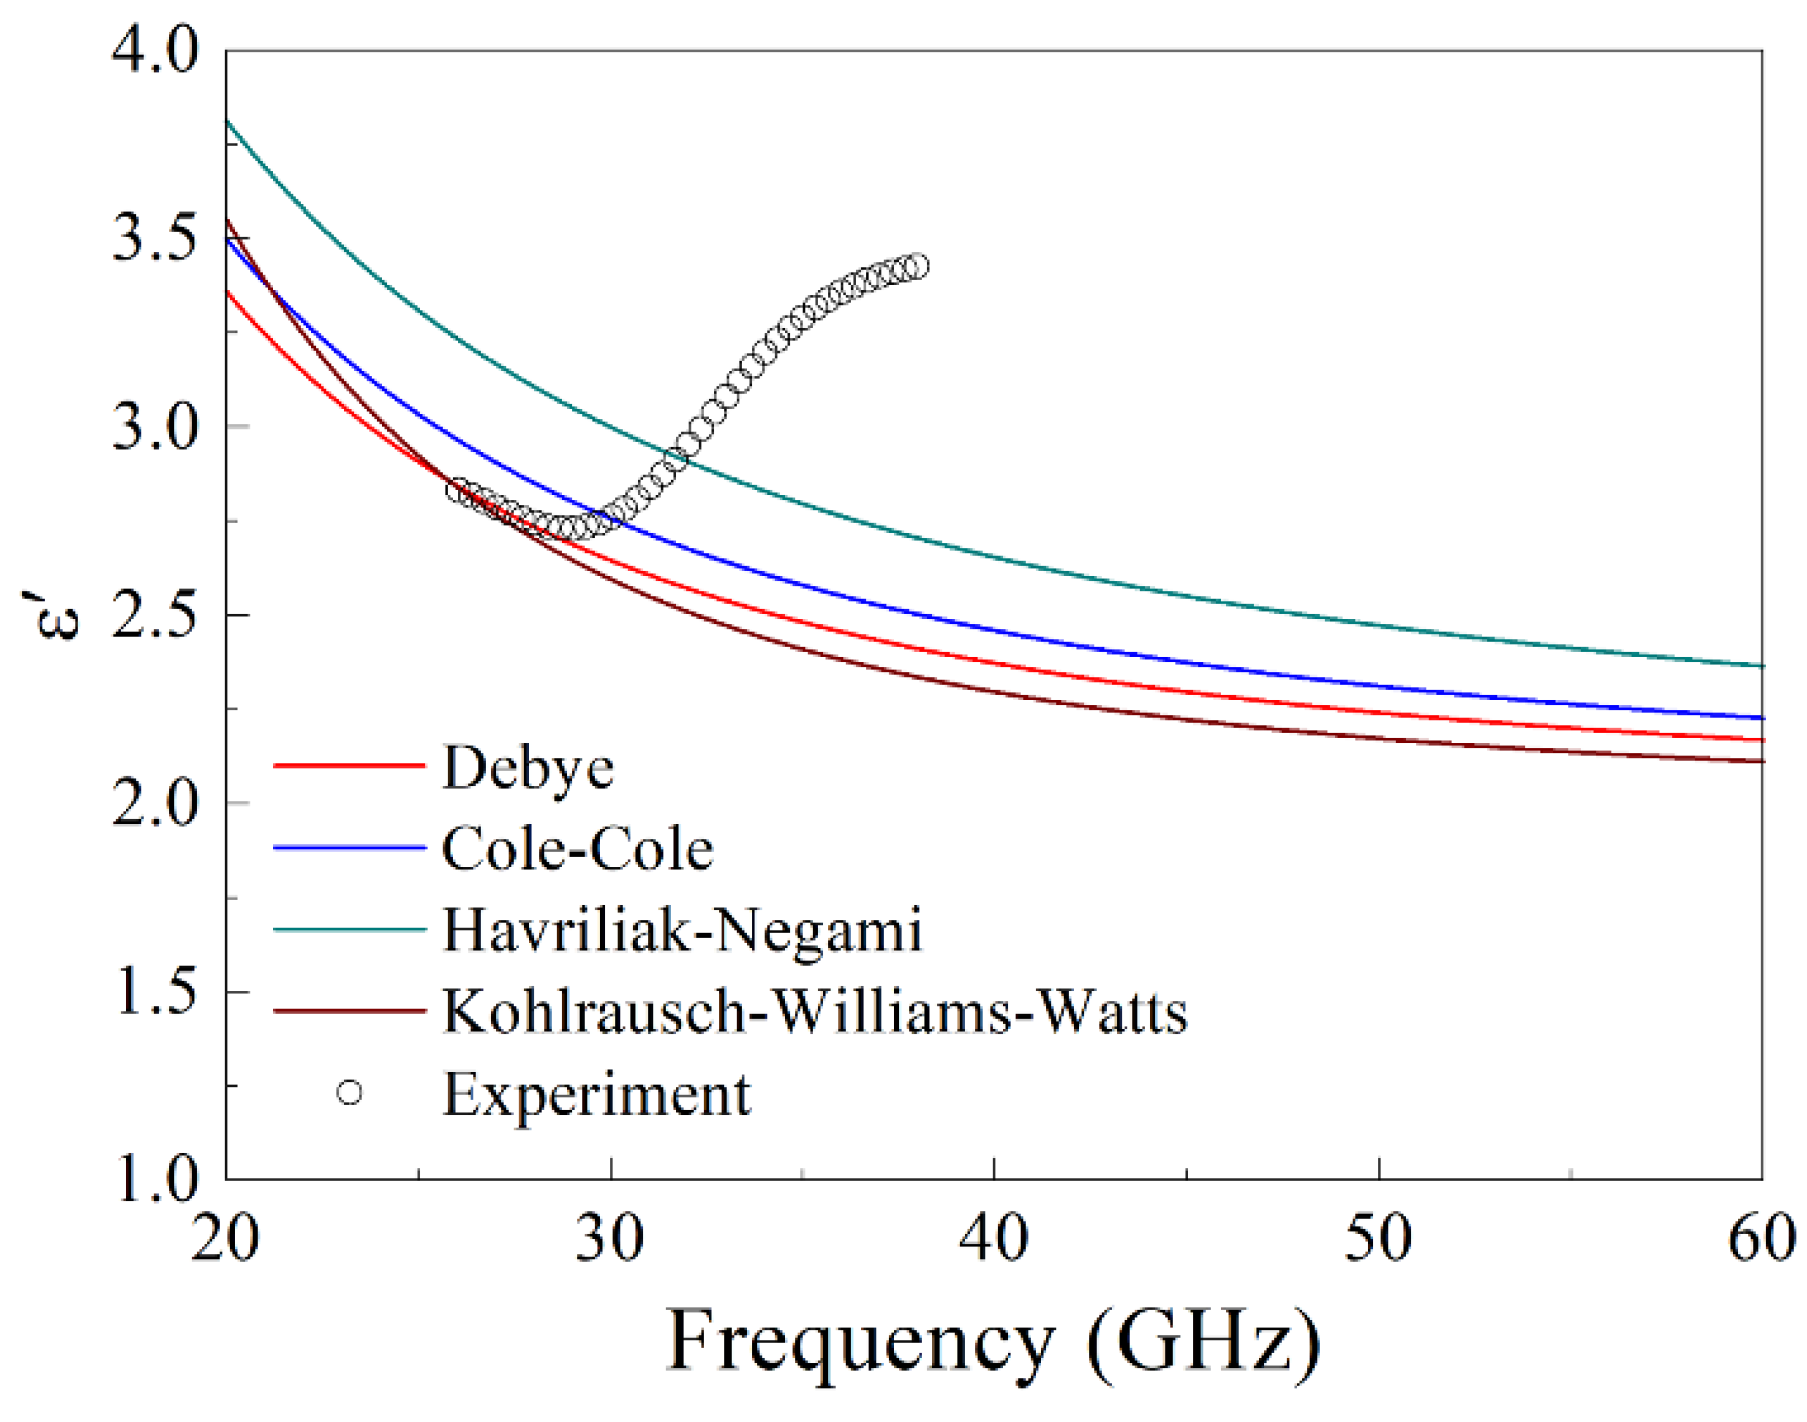
Let us now discuss the results of measurements of transmission and reflection coefficients for the samples with orthophosphate particles. The measurements are carried out with three samples: with LiCoPO4 particles and different impregnations and with the sample of a composite with LiNi0.5Co0.5PO4 particles. Frequency dependences of transmission and reflection coefficients of electromagnetic waves for nanocomposite sample 1 with LiCoPO4 particles and 6 impregnations are shown in Figure 8.
Small differences between the calculated and measured values of the coefficients are caused by the minor mismatch of the tract. Frequency dependences of the real and imaginary parts of dielectric permittivity are shown in Figure 9. The ε′ dependence is a nonmonotonic function for samples 1 and 2, and ε″ has a maximum for all samples. The inequality ε″ << ε′ is realized for all samples in the whole frequency range 26–38 GHz. The mean values of the real and imaginary parts of dielectric permittivity averaged over the range 26–38 GHz are presented in Table 5.

7. Discussion

From the electromagnetic wave theory in condensed matter is known that the dielectric permittivity possesses dispersion, and its frequency dependence is expressed in terms of the frequencies of the transverse and longitudinal phonons, as follows [1]:
ε ( ω ) = ε + ε 0 ε 1 ω 2 / ω T O 2 = ε ω L O 2 ω 2 ω T O 2 ω 2
where ε 0 and ε are the isothermal and adiabatic dielectric permittivity, respectively; ω L O is the frequency of longitudinal phonons; ε ω L O = 0 , ω T O is the frequency of transversal phonons; and ε ω T O = 0 . We deal with the frequencies ω < < ω L O , ω T O . That is why we will analyze the diverse simple models and try to approximate the dependences shown in Figure 5, Figure 7 and Figure 9. The simplest and generally used is the Debye model [39], as follows:
ε ω = ε + ε 0 ε 1 + i ω τ
where τ is the relaxation time. It is adopted in this model that relaxation is described by one oscillator. In the Cole–Cole model, the following expression is proposed [40]:
ε ω = ε + ε 0 ε 1 + i ω τ 1 α
where α is a coefficient, α 0 ,   1 . The Davidson–Cole model is close the this one [41]; it looks like
ε ω = ε + ε 0 ε 1 + i ω τ β
where β is a constant, β 0 ,   1 . The Havriliak–Negami model [42] contains two parameters, α and β, as follows:
ε ω = ε + ε 0 ε 1 + i ω τ 1 α β
where α 0 ,   1 , β 0 ,   1 . The real and imaginary parts of dielectric permittivity corresponding to (9) can be written in the explicit form (see [43]), as follows:
ε ω = ε + ε 0 ε r β 2   cos β θ
ε ω = ε 0 ε r β 2   sin β θ
where
r = 1 + ω τ 1 α sin α π 2 2 + ω τ 1 α cos α π 2 2
and
θ = atan ω τ 1 α cos α π 2 1 + ω τ 1 α sin α π 2
Models (6)–(9) can be generalized for the case of several discrete relaxation times. The sum of several terms is necessary to write corresponding to every relaxation time. For example, Formula (6) for K relaxation times takes the form
ε ω = ε + k = 1 K Δ ε k 1 + i ω τ k
where Δ ε k = ε k 0 ε k , ε = ε K , and ε 0 = ε 1 0 . Where ε 0 = ε ω = 0 and ε = lim ω ε ω . Let us notice that the following expressions result from (14):
ε ω = ε + k = 1 K Δ ε k 1 + ω τ k 2
ε ω = k = 1 K ω τ k Δ ε k 1 + ω τ k 2
It is possible to generalize the Formulas (15) and (16) for the case when the continuous function of the relaxation times distribution ξ τ is discussed against of the discrete relaxation times. Therefore, the integral relations are following from (15) and (16)
ε ω = ε + 0 ξ τ d τ 1 + ω τ 2
ε ω = 0 ω τ ξ τ d τ 1 + ω τ 2
which correspond to the Fröhlich model [44]. In the case of the discrete set of relaxation times, when ξ τ = k = 1 K Δ ε k δ τ τ k , where δ x is the Dirac delta function, Formulas (17) and (18) go into relations (15) and (16).
One more possibility is to explain the frequency dispersion of permittivity if a stretched exponential decay is realized in the composites under study [45]. The function Φ ( t ) is introduced in order to describe the time dependence of the electric polarization if the electric field is switched on instantaneously, as follows:
P ( t ) = P ( t ) Φ ( t )
The dielectric permittivity can be calculated from the time derivative of Φ ( t ) , as follows:
ε ω 1 = ( ε ( ω 0 ) 1 ) 0 d Φ d t cos ω t   d t
ε ω = ( ε ( ω 0 ) 1 ) 0 d Φ d t sin ω t   d t
The function Φ ( t ) in the Debye model has the following form:
Φ ( t ) = exp t τ
and our calculations show that an exponential decay of this sort does not satisfy our experimental data. In the case of stretched exponential decay, Φ ( t ) is chosen in the form of the Kohlrausch–Williams–Watts function, as follows:
Φ ( t ) = exp t τ γ
where γ > 0 . Under the choice of (22), the real and imaginary parts of dielectric permittivity can be calculated via the Formulas (20) and (21) [19]. In the case of stretched exponential decay, the ε function decreases more slowly than in the Debye model, and it is possible to diminish ε to some extent within a definite frequency range.
All examined models (6)–(9), (20), and (21) result in a conclusion that the frequency dependences of the real part of dielectric permittivity are represented by the monotonically decreasing functions. In the case of two or more relaxation times, this dependence can look like a stepwise function also decreasing monotonically; see Formulas (14)–(16). For the composite materials, dielectric permittivity should be considered an effective permittivity. This effective permittivity can be calculated by mixing formulas from the permittivities of components [46]. It is possible to make sure that the Maxwell Garnett and Bruggeman formulas for the effective permittivity also led to a monotonic frequency dependence of ε . Therefore, within the discussed models, we face an irreconcilable contradiction with the experimental fact that the frequency dependence of a real part of dielectric permittivity is a nonmonotonic function for a number of nanocomposite samples of rare earth manganates and titanates, as well as lithium orthophosphates.
As an example, we now consider the results of the approximations of the frequency dependence of the real part of permittivity for sample 12 using the Debye, Cole–Cole, Havriliak–Negami, and Kohlrausch–Williams–Watts models, which are shown in Figure 10.
The experimental dependence being considered here was derived from the results of microwave measurements of transmission and reflection coefficients; see Figure 5. The calculations were performed using Formulas (6), (7), (9) and (20)–(22) for the following parameter values: ε 0 = 11.75, ε = 1, τ = 2.2 · 10−11 s, α = 0.02, β = 0.95, γ = 1.3. The choice of this set provides an approximation of the “regular” part of the experimental curve where the permeability decreases with increasing frequency.
Let us discuss why the imaginary part of the dielectric permittivity ε is essentially less than the real one, i.e., ε << ε . Of course, we deal now with the frequency range of 26 to 38 GHz. Following the data from Table 5, ε is only 2–4% from ε for the samples with ErMn2O5, Tb2Ti2O7, Yb2Ti2O7 + TiO2, and Er2TiO5 particles.
A possibility to explain the very low values of ε lies in the analytic properties of the ε ( ω ) function. For the media with spatial dispersion, this function is not a single-valued function of the complex frequency ω ˙ = ω i ω , and the singularities of a function can present in the upper half plane. Then the Kramers–Kronig dispersion relations in their typical view fail, and the relation between ε ( ω ) and ε ( ω ) can vary. For example, an essential difference between the Debye model and the Kramers-Kronig dispersion relations as regards the decrease in ε has been observed in optics near the exciton state [47]. Further investigations are required in order to make the type of relaxation clear. Under our conditions, the inequality q l < < 1 is valid and the spatial dispersion is considered to be weak [48]. Here, q is the real part of the wavenumber, and l is a length characteristic for the space scale of the nanocomposite structure. This is either the size of a separate particle ~60 nm or the period of the matrix structure ~260 nm. These spatial scales are too small in order to destroy the inequality. As known, the long-range crystalline ordering within the regions ≤ 1 mm in length is present in opal artificial crystals [49]. In principle, this extensive spatial scale could be a reason for the spatial dispersion taken into account. Therefore, the relation between the real and imaginary parts of dielectric permittivity can vary.

8. Conclusions

The frequency dependences of the transmission and reflection coefficients have been measured, and the complex dielectric permittivity for several nanocomposite rare earth manganates and titanates and Co-Ni lithium orthophosphates has been defined. These objects are chosen for study because they are multiferroics and possess a magnetoelectric effect. The composites are obtained by the impregnation of particles of multiferroics into artificial opal matrices. The dispersion of complex dielectric permittivity is studied at frequencies of 26 to 38 GHz. It has been established that the imaginary part of dielectric permittivity is much less than the real part in this frequency range. A comparison of the frequency dependences of the real and imaginary parts of permittivity with those prescribed by the Debye, Cole–Cole, Havriliak–Negami, and Kohlrausch–Williams–Watts models is performed, and it is demonstrated that all these models fail to satisfactorily describe the dispersion of the dielectric permittivity. In particular, these models cannot explain a nonmonotonic frequency dispersion of the real part of the dielectric permittivity observed for a number of nanocomposite samples of rare earth manganates and titanates and lithium orthophosphates.

Author Contributions

Conceptualization, A.B.R.; methodology, A.B.R. and D.V.P.; software, D.V.P.; validation, A.B.R., D.V.P. and M.S.S.; formal analysis, D.V.P.; investigation, A.B.R., E.A.K. and M.S.S.; writing—original draft preparation, A.B.R.; writing—review and editing, A.B.R. and D.V.P. All authors have read and agreed to the published version of the manuscript.

Funding

This research was funded by Grant No. 24-22-00023 from the Russian Scientific Foundation.

Data Availability Statement

The original contributions presented in this study are included in the article. Further inquiries can be directed to the corresponding author.

Acknowledgments

The structure of nanocomposites was carried out with the scanning electron microscope Tescan MIRA LMS at the Collaborative Access Center “Testing Center of Nanotechnology and Advanced Materials” of IMP UB RAS.

Conflicts of Interest

The authors declare no conflicts of interest.

References

  1. Stroscio, M.A.; Dutta, M. Phonons in Nanostructures; Cambridge University Press: Cambridge, UK, 2001. [Google Scholar]
  2. Kosevich, Y.A. Multichannel propagation and scattering of phonons and photons in low-dimensional nanostructures. Phys. Usp. 2008, 51, 848–859. [Google Scholar] [CrossRef]
  3. Liu, J.-M.; Dong, S. Ferrielectricity in DyMn2O5: A golden touchstone for multiferroicity of RMn2O5 family. J. Adv. Dielect. 2015, 5, 1530003. [Google Scholar] [CrossRef]
  4. Sushkov, A.B.; Kant, C.; Schiebl, M.; Shuvaev, A.M.; Pimenov, A.; Pimenov, A.; Lorenz, B.; Park, S.; Cheong, S.-W.; Mostovoy, M.; et al. Spectral origin of the colossal magnetodielectric effect in multiferroic DyMn2O5. Phys. Rev. B 2014, 90, 054417. [Google Scholar] [CrossRef]
  5. Bukhari, S.H.; Ahmad, J. Magnetoelectric effect in multiferroic NdMn2O5. Chin. Phys. B 2017, 26, 018103. [Google Scholar] [CrossRef]
  6. Fogh, E.; Kihara, T.; Toft-Petersen, R.; Bartkowiak, M.; Narumi, Y.; Prokhnenko, O.; Miyake, A.; Tokunaga, M.; Oikawa, K.; Sørensen, M.K.; et al. Magnetic structures and quadratic magnetoelectric effect in LiNiPO4 beyond 30 T. Phys. Rev. B 2020, 101, 024403. [Google Scholar] [CrossRef]
  7. Blake, G.R.; Chapon, L.C.; Radaelli, P.G.; Park, S.; Hur, N.; Cheong, S.-W.; Rodríguez-Carvajal, J. Spin structure and magnetic frustration in multiferroic RMn2O5 (R = Tb, Ho, Dy). Phys. Rev. B 2005, 71, 214402. [Google Scholar] [CrossRef]
  8. Noda, Y.; Kimura, H.; Fukunaga, M.; Kobayashi, S.; Kagomiya, I.; Kohn, K. Magnetic and ferroelectric properties of multiferroic RMn2O5. J. Phys. Condens. Matter. 2008, 20, 434206. [Google Scholar] [CrossRef]
  9. Khannanov, B.K.; Golovenchits, E.I.; Sanina, V.A. Effect of rare-earth ions on an electric polarization induced by the phase separation domains in RMn2O5 (R = Er, Tb). Phys. Solid State 2020, 62, 308–317. [Google Scholar] [CrossRef]
  10. Manley, M.E.; Lynn, J.W.; Abernathy, D.L.; Specht, E.D.; Delaire, O.; Bishop, A.R.; Sahul, R.; Budai, J.D. Phonon localization drives polar nanoregions in a relaxor ferroelectric. Nat. Commun. 2014, 5, 3683. [Google Scholar] [CrossRef]
  11. Han, T.C.; Lin, J.G.; Kuo, K.M.; Chern, G. Large dielectric permittivity in the paraelectric RMn2O5 with R = Tb, Dy, and Er. J. Appl. Phys. 2008, 103, 084106. [Google Scholar] [CrossRef]
  12. Ahmad, J.; Zaheer, H.; Khan, J.A.; Bukhari, S.H.; Nissar, U. Electrical and dielectric properties of multiferroic Gd1-xYxMn2O5. J. Nanoscope 2021, 2, 39–52. [Google Scholar] [CrossRef]
  13. Devaraju, M.K.; Truong, Q.D.; Hyodo, H.; Sasaki, Y.; Honma, I. Synthesis, characterization and observation of antisite defects in LiNiPO4 nanomaterials. Sci. Rep. 2015, 5, 11041. [Google Scholar] [CrossRef]
  14. Prabu, M.; Selvasekarapandian, S. Dielectric and modulus studies of LiNiPO4. Mater. Chem. Phys. 2012, 134, 366–370. [Google Scholar] [CrossRef]
  15. Ben Bechir, M.; Ben Rhaiem, A.; Guidara, K.A.c. conductivity and dielectric study of LiNiPO4 synthesized by solid-state method. Bull. Mater. Sci. 2014, 37, 473–480. [Google Scholar] [CrossRef]
  16. Xiao, E.; Cao, Z.; Li, J.; Li, X.-H.; Liu, M.; Yue, Z.; Chen, Y.; Chen, G.; Song, K.; Zhou, H.; et al. Crystal structure, dielectric properties, and lattice vibrational characteristics of LiNiPO4 ceramics sintered at different temperatures. J. Am. Ceram. Soc. 2020, 103, 2528–2539. [Google Scholar] [CrossRef]
  17. Vijaya Babu, K.; Seeta Devi, L.; Veeraiah, V.; Anand, K. Structural and dielectric studies of LiNiPO4 and LiNi0.5Co0.5PO4 cathode materials for lithium-ion batteries. J. Asian Ceram. Soc. 2016, 4, 269–276. [Google Scholar] [CrossRef]
  18. Karthickprabhu, S.; Hirankumar, G.; Maheswaran, A.; Daries Bella, R.S.; Sanjeeviraja, C. Structural and electrical studies on Zn2+ doped LiCoPO4. J. Electrostat. 2014, 72, 181–186. [Google Scholar] [CrossRef]
  19. Bokov, A.; Ye, Z.-G. Dielectric relaxation in relaxor ferroelectrics. J. Adv. Dielect. 2012, 2, 124101. [Google Scholar] [CrossRef]
  20. Fier, I.; Walmsley, L.; Souza, J.A. Relaxor behavior in multiferroic BiMn2O5 ceramics. J. Appl. Phys. 2011, 110, 084101. [Google Scholar] [CrossRef]
  21. Chouaibi, H.; Khirouni, K.; Dhahri, E. Enhanced dielectric performance of Dy—Substituted YMn2O5 for high-frequency applications. Prog. Nat. Sci. Mater. Int. 2021, 31, 762–777. [Google Scholar] [CrossRef]
  22. Jurlewicz, A.; Weron, K. Relaxation of dynamically correlated clusters. J. Non-Cryst. Solids 2002, 305, 112–121. [Google Scholar] [CrossRef]
  23. Feldman, Y.; Puzenko, A.; Ryabov, Y. Non-Debye dielectric relaxation in complex materials. Chem. Phys. 2002, 284, 139–168. [Google Scholar] [CrossRef]
  24. Petzelt, J.; Nuzhnyy, D.; Savinov, M.; Bovtun, V.; Kempa, M.; Ostapchuk, T.; Hlinka, J.; Canu, G.; Buscaglia, V. Broadband dielectric spectroscopy of Ba(Zr,Ti)O3: Dynamics of relaxors and diffuse ferroelectrics. Ferroelectrics 2014, 469, 14–25. [Google Scholar] [CrossRef]
  25. Kamba, S.; Veljko, S.; Kempa, M.; Savinov, M.; Bovtun, V.; Vanek, P.; Petzelt, J.; Stennett, M.C.; Reaney, I.M.; West, A.R. Dielectric spectra of a new relaxor ferroelectric system Ba2LnTi2Nb3O15 (Ln = La, Nd). J. Eur. Ceram. Soc. 2005, 25, 3069–3073. [Google Scholar] [CrossRef]
  26. Rinkevich, A.B.; Pakhomov, Y.A.; Perov, D.V. Millimeter waveband dielectric properties of nanocomposite 3d and rare-earth titanates. Mater. Today: Proc. 2019, 14, 144–147. [Google Scholar] [CrossRef]
  27. Zhang, P.; Wu, S.; Xiao, M. The microwave dielectric properties and crystal structure of low temperature sintering LiNiPO4 ceramics. J. Eur. Ceram. Soc. 2018, 38, 4433–4439. [Google Scholar] [CrossRef]
  28. Liu, P.; Ng, V.M.H.; Yao, Z.; Zhou, J.; Lei, Y.; Yang, Z.; Lv, H.; Kong, L.B. Facile synthesis and hierarchical assembly of flowerlike NiO structures with enhanced dielectric and microwave absorption properties. ACS Appl. Mater. Interfaces 2017, 9, 16404–16416. [Google Scholar] [CrossRef]
  29. Zou, D.; Yi, Y.; Song, Y.; Guan, D.; Xu, M.; Ran, R.; Wang, W.; Zhou, W.; Shao, Z. The BaCe0.16Y0.04Fe0.8O3−δ nanocomposite: A new high-performance cobalt-free triple-conducting cathode for protonic ceramic fuel cells operating at reduced temperatures. J. Mater. Chem. A 2022, 10, 5381–5390. [Google Scholar] [CrossRef]
  30. Rinkevich, A.B.; Burkhanov, A.M.; Samoilovich, M.I.; Belyanin, A.F.; Kleshcheva, S.M.; Kuznetsov, E.A. Three-dimensional nanocomposite metal dielectric materials on the basis of opal matrices. Russ. J. Gen. Chem. 2013, 83, 2148–2158. [Google Scholar] [CrossRef]
  31. Guan, D.; Xu, H.; Huang, Y.-C.; Jing, C.; Tsujimoto, Y.; Xu, X.; Lin, Z.; Tang, J.; Wang, Z.; Sun, X.; et al. Operando studies redirect spatiotemporal restructuration of model coordinated oxides in electrochemical oxidation. Adv. Mater. 2025, 37, 2413073. [Google Scholar] [CrossRef]
  32. Toft-Petersen, R.; Reehuis, M.; Jensen, T.B.S.; Andersen, N.H.; Li, J.; Le, M.D.; Laver, M.; Niedermayer, C.; Klemke, B.; Lefmann, K.; et al. Anomalous magnetic structure and spin dynamics in magnetoelectric LiFePO4. Phys. Rev. B 2015, 92, 024404. [Google Scholar] [CrossRef]
  33. Samoilovich, M.I.; Rinkevich, A.B.; Bovtun, V.; Belyanin, A.F.; Kempa, M.; Nuzhnyy, D.; Tsvetkov, M.Y.; Kleshcheva, S.M. Optical, magnetic, and dielectric properties of opal matrices with intersphere nanocavities filled with crystalline multiferroic, piezoelectric, and segnetoelectric materials. Russ. J. Gen. Chem. 2013, 83, 2132–2147. [Google Scholar] [CrossRef]
  34. Rinkevich, A.B.; Perov, D.V. Cole-Cole formula for dependence of dynamic magnetic susceptibility of rare-earth titanates on magnetic field. J. Magn. Magn. Mater. 2021, 530, 167917. [Google Scholar] [CrossRef]
  35. Ustinov, V.V.; Rinkevich, A.B.; Perov, D.V.; Burkhanov, A.M.; Samoilovich, M.I.; Kleshcheva, S.M.; Kuznetsov, E.A. Giant antiresonance in electromagnetic wave reflection from a 3D structure with ferrite spinel nanoparticles. Tech. Phys. 2013, 58, 568–577. [Google Scholar] [CrossRef]
  36. Brekhovskikh, L.M. Waves in Layered Media; Academic Press: Salt Lake City, UT, USA, 1960. [Google Scholar]
  37. Perov, D.V.; Rinkevich, A.B. Ferromagnetic resonance and antiresonance in composite medium with flakes of Finemet-like alloy. Nanomaterials 2021, 11, 1748. [Google Scholar] [CrossRef]
  38. Khan, A.R.; Goel, R.; Gupta, A.; Tripathi, H.; Kumar, N.; Bhardwaj, S.; Kumar, S.; Kuma, G.; Sharma, P. Improved multiferroic and magnetodielectric properties in Ni and Fe co-doped barium strontium titanate ceramics. J. Mater. Sci. Mater. Electron. 2024, 35, 1383. [Google Scholar] [CrossRef]
  39. Debye, P. Zur Theorie der anomalen Dispersion im Gebiete der langwelligen elektrischen Strahlung. Verh. Dtsch. Phys. Ges. 1913, 15, 777–793. [Google Scholar]
  40. Cole, K.S.; Cole, R.H. Dispersion and absorption in dielectrics I. Alternating current characteristics. J. Chem. Phys. 1941, 9, 341–351. [Google Scholar] [CrossRef]
  41. Davidson, D.W.; Cole, R.H. Dielectric relaxation in glycerol, propylene glycol, and n-propanol. J. Chem. Phys. 1951, 19, 1484–1490. [Google Scholar] [CrossRef]
  42. Havriliak, S.; Negami, S. A complex plane analysis of α-dispersions in some polymer systems. J. Polym. Sci. Part C 1966, 14, 99–117. [Google Scholar] [CrossRef]
  43. Volkov, A.S.; Koposov, G.D.; Perfil’ev, R.O.; Tyagunin, A.V. Analysis of experimental results by the Havriliak–Negami model in dielectric spectroscopy. Opt. Spectrosc. 2018, 124, 202–205. [Google Scholar] [CrossRef]
  44. Fröhlich, H. Theory of Dielectrics: Dielectric Constant and Dielectric Loss; Clarendon Press: Oxford, UK, 1949. [Google Scholar]
  45. Jonscher, A.K. Universal Relaxation Law; Chelsea Dielectrics Press: London, UK, 1996. [Google Scholar]
  46. Sihvola, A. Homogenization principles and effect of mixing on dielectric behavior. Photonics Nanostruct. Fundam. Appl. 2013, 11, 364–373. [Google Scholar] [CrossRef]
  47. Strashnikova, M.I.; Mozdor, E.V. Limits of applicability of the Kramers-Kronig relations in the presence of an additional light wave. J. Exp. Theor. Phys. 1998, 87, 756–763. [Google Scholar] [CrossRef]
  48. Agranovich, V.M.; Ginzburg, V.L. Crystal Optics with Spatial Dispersion, and Excitons; Springer: Berlin/Heidelberg, Germany, 1984. [Google Scholar]
  49. Mayoral, R.; Requena, J.; Lypez, C.; Moya, S.J.; Mhguez, H.; Vozquez, L.; Meseguer, F.; Holgado, M.; Cintas, A.; Blanco, A. 3D long-range ordering in an SiO2 submicrometer-sphere sintered superstructures. Adv. Mater. 1997, 9, 257–260. [Google Scholar] [CrossRef]
Figure 1. Structure of the nanocomposite with TbMn2O5 particles (a) and of the nanocomposite with LiCoPO4 particles (b) obtained with the scanning electron microscope Tescan MIRA LMS.
Nanomaterials 15 00995 g001
Figure 2. The X-ray diffraction images for samples with TbMn2O5 (a) and LiCoPO4 (b) particles.
Nanomaterials 15 00995 g002
Figure 3. Scheme of microwave fields during the measurements of transmission and reflection coefficients.
Nanomaterials 15 00995 g003
Figure 4. Frequency dependences of transmission and reflection coefficients of electromagnetic waves for a nanocomposite sample with ErMn2O5 particles: experimental dependences are bold lines, and calculated dependences are thin solid lines.
Nanomaterials 15 00995 g004
Figure 5. Frequency dependences of real (a) and imaginary (b) parts of the dielectric permittivity of the composite with manganate particles.
Nanomaterials 15 00995 g005
Figure 6. Frequency dependences of transmission and reflection coefficients of electromagnetic waves for a nanocomposite sample with Gd2Ti2O7 particles: experimental dependences are bold lines, and calculated dependences are thin solid lines.
Nanomaterials 15 00995 g006
Figure 7. Frequency dependences of real (a) and imaginary (b) parts of the dielectric permittivity of the composite with rare earth titanates.
Nanomaterials 15 00995 g007
Figure 8. Frequency dependences of transmission and reflection coefficients of electromagnetic waves for nanocomposite sample 1 with LiCoPO4 particles: experimental dependences are bold lines, and calculated dependences are thin solid lines.
Nanomaterials 15 00995 g008
Figure 9. Frequency dependences of real (a) and imaginary (b) parts of the dielectric permittivity of the composite with orthophosphate particles.
Nanomaterials 15 00995 g009
Figure 10. Approximations of the frequency dependence of ε′ for sample 12 with YbMn2O5 particles, which are made using different relaxation models.
Nanomaterials 15 00995 g010
Table 1. The elemental composition of sample with TbMn2O5 particles.
ElementType of LineWt.%At.%
OK51.4666.97
SiK42.7631.70
MnL2.310.88
TbM3.470.45
Table 2. The X-ray data for sample with TbMn2O5 nanoparticles.
Peak’s
Number
Experimental DataData from ICDD PDF-2
Intensity, arb. un.Intensity,
%
Bragg Angle 2θ,
deg.
Peak Semiwidth,
deg.
Interplane Space, ÅMn2O3—Cubic Syngony, Space Group
Ia-3 (89-4836)
TbMn2O5—Orthorhombic Syngony, Space Group
Pbam (50-0294)
d, ÅhklI, %d, ÅhklI, %
117.932329.8200.3962.9934   3.040012165
217.302230.9670.3962.8851   2.8580211100
377.2510032.6880.3962.73702.71522221002.743022011
46.28837.8270.2532.37612.351540013.72.37401319
510.481441.7450.4172.1617   2.154031130
615.512054.7160.3411.67601.662744039.91.674042023
712.001665.1550.2891.43041.418062217.61.414006018
Table 3. The elemental composition of a sample with LiCoPO4 particles.
ElementType of LineWt.%At.%
OK56.3369.83
SiK41.2829.15
PK0.690.45
CoK1.700.57
Table 4. The X-ray data for the sample with LiCoPO4 nanoparticles.
Peak’s
Number
Experimental DataData from ICDD PDF-2
Intensity,
arb. un.
Intensity,
%
Bragg
Angle 2θ,
deg.
Peak Semiwidth,
deg.
Interplane Space, ÅSiO2 (Cristobalite)—
Tetragonal Syngony, Space Group P41212 (89-3434)
LiCoPO4
Orthorhombic Syngony,
Space Group
Pnma (85-0002)
SiO2 (Quartz)—
Hexagonal Syngony,
Space Group P3221 (86-1565)
d, ÅhklI, %d, ÅhklI, %d, ÅhklI, %
134.99519.5230.3284.5427         
2105.341520.9080.3284.2448   4.261010167.5   
3692.0210021.9840.3284.03944.0281101100   4.072210022.1
435.17526.1720.2713.4017   3.458311181.1   
581.981227.8230.2203.2035      3.2191011100
614.53228.5280.2203.1259         
7105.781529.7320.1573.0020   2.982121110.3   
825.48430.3430.1572.9430   2.959902064.0   
910.94230.8470.1572.8960         
1060.06932.1430.1572.78212.834010211.42.752730124.5   
1135.20535.2370.3162.5446   2.56002202.4   
1297.481436.1860.3162.48002.479320013.52.4960311100   
1327.59437.7760.3162.3792   2.341900217.52.351111012.0
1440.96642.3910.2252.13032.11142112.6   2.14611115.3
1539.12643.1720.2252.0935   2.130511216.7   
1622.70343.7330.2252.0680         
1720.00344.6180.2252.02902.01402021.92.01573214.42.03612007.8
1835.55547.5390.3741.91091.92461134.81.93194202.21.89860211.5
1918.82349.1890.3741.85061.86602124.8      
2038.70649.9570.3741.8239   1.838023012.1   
2112.33252.2100.2431.7504      1.75221128.6
2222.29353.1300.2431.7222   1.7291     
2350.37754.0880.2431.69401.68712032.3      
Table 5. Designation and mean values of dielectric permittivity of composites.
No. of Sample Chemical Composition of SamplesNumber of Impregnations<ε′><ε″>
1LiCoPO462.940.13
2LiCo0.5Ni0.5PO453.450.21
3LiCoPO452.590.13
4Gd2Ti2O753.170.16
5Tb2Ti2O752.730.07
6Yb2Ti2O7 + TiO252.520.07
7Er2Ti2O752.390.12
8Sm2Ti2O752.520.16
9Er2TiO552.740.023
10YMn2O5102.360.13
11LaMn2O552.810.12
12YbMn2O562.850.2
13ErMn2O562.720.06
Disclaimer/Publisher’s Note: The statements, opinions and data contained in all publications are solely those of the individual author(s) and contributor(s) and not of MDPI and/or the editor(s). MDPI and/or the editor(s) disclaim responsibility for any injury to people or property resulting from any ideas, methods, instructions or products referred to in the content.

