Article

Comparative Study of Water Flow in Nanopores with Different Quartz (101¯0) Surfaces via Molecular Dynamics Simulations

1
State Key Laboratory of Oil and Gas Reservoir Geology and Exploitation, Chengdu University of Technology, Chengdu 610059, China
2
Guizhou Energy Industry Research Institute Co., Guiyang 550025, China
3
College of Energy, Chengdu University of Technology, Chengdu 610059, China
4
School of Geophysics, Chengdu University of Technology, Chengdu 610059, China
*
Authors to whom correspondence should be addressed.
Nanomaterials 2025, 15(12), 896; https://doi.org/10.3390/nano15120896
Submission received: 22 April 2025 / Revised: 25 May 2025 / Accepted: 4 June 2025 / Published: 10 June 2025
(This article belongs to the Special Issue Nanomaterials and Nanotechnology for the Oil and Gas Industry)

Abstract

Dewatering and gas production are applied on a large scale in shale gas development. The fundamental mechanisms of water flow in shale nanoporous media are essential for the development of shale oil and gas resources. In this work, we use molecular dynamic simulations to investigate water flow in two different quartz surface ( ( 10 1 ¯ 0 ) - α and ( 10 1 ¯ 0 ) - β ) nanopores. Results show that the ( 10 1 ¯ 0 ) - β surface exhibits stronger water molecule structuring with a structure arranged in two layers and higher first-layer adsorption density (2.44 g/cm3) compared to the ( ( 10 1 ¯ 0 ) - α surface (1.68 g/cm³). The flow flux under the ( 10 1 ¯ 0 ) - α surface is approximately 1.2 times higher than that under the ( 10 1 ¯ 0 ) - β surface across various pressure gradients. We developed a theoretical model dividing the pore space into non-flowing, adsorbed, and bulk water regions, with critical thicknesses of 0.14 nm and 0.27 nm for the non-flowing region, and 0.15 nm for the adsorbed region in both surfaces. This model effectively predicts velocity distributions and volumetric flow rates with errors generally below 5%. Our findings provide insights into water transport mechanisms in shale inorganic nanopores and offer practical guidance for numerical simulation of shale gas production through dewatering operations.

Graphical Abstract

1. Introduction

Shale oil and gas, as clean energy resources, have become a focal point in current exploration and development efforts to address energy challenges [1,2,3]. The shale formations that generate and store shale gas are characterized by ubiquitous nanoscale and microscale pores [4,5,6]. Large-scale hydraulic fracturing [7,8,9], involving high-pressure fluid injection into shale formations, serves as a crucial technique for stimulating tight rock matrices to release trapped gas and oil. However, the physical properties of fluids in confined nanoscale pores differ significantly from those under bulk conditions [10,11,12]. The confinement effects lead to various phenomena, such as adsorption [13,14], phase behavior changes [15,16], and slip effects [17,18], which play crucial roles in fluid transport. These nanoscale effects on fluids cannot be neglected. In nanopores, water–wall interactions can significantly influence water molecule distribution and confined fluid dynamic characteristics [19,20,21]. Therefore, to predict shale oil/natural gas development outcomes, it is imperative to understand the underlying mechanisms of water transport in shale nanoporous media [22,23].
Unlike conventional reservoirs, shale reservoirs contain both organic (e.g., kerogen) and inorganic (e.g., clay, quartz, and carbonates) materials [20,24], with both organic and inorganic pores featuring nanometer-scale pore sizes [25]. Based on geochemical analysis using X-ray diffraction (XRD) or fluorescence spectroscopy, quartz constitutes one of the primary components of shale rock [26,27,28], with Total Organic Carbon (TOC) typically comprising less than 20 wt% [29], while quartz can reach up to 65 wt% [30]. Consequently, studying the interactions between water and quartz surfaces becomes essential. The wettability of different α-quartz surfaces has been investigated through molecular simulation and contact angle measurements, demonstrating complete water-wet characteristics [31,32]. However, according to research by Kobayashi et al. [33], different quartz surfaces exhibit varying interactions with water, resulting in distinct water film structures. Regarding the influence of wettability on flow dynamics, Wu et al. [34] developed relational equations describing the relationship between wettability and slip length, establishing that stronger wettability corresponds to shorter slip lengths. Nevertheless, research by Ho et al. [35] revealed that slip phenomena can occur even on hydrophilic surfaces. These findings underscore the significance of studying water flow patterns on different α-quartz surfaces for shale oil and gas development.
The slip boundary condition has been widely applied to modify the Navier–Stokes (NS) equations to explain flow enhancement predicted by flow dynamics equations [36,37,38]. The critical thickness δ is commonly used to represent the thickness of the viscous region [34]. Zhan et al. [20] measured δ for various viscous minerals and found it approximately equals the thickness of the first adsorption layer. Fang et al. [39] proposed that δ should equal the thickness of the first water adsorption layer, which is approximately 0.29 nm in hydrophilic quartz nanopores. X-ray reflectivity experiments by Schlegel et al. [40] demonstrated that the real α-quartz ( 10 1 ¯ 0 ) growth face exhibits two different terminations: the ( 10 1 ¯ 0 ) - α surface and the ( 10 1 ¯ 0 ) - β surface, both possessing identical hydroxyl densities [33]. Chen et al. [21] modified graphene surfaces by adding hydroxyl groups and discovered that, at the same hydroxyl density, random versus uniform hydroxyl arrangements did not affect flow outcomes. However, Skelton et al. [41] indicated that the intrasurface hydrogen bonding (hydrogen bonding between OH of silanol groups at the surface) significantly influences surface hydration. The ( 10 1 ¯ 0 ) - β surface exhibits higher intra-surface hydrogen bond density compared to the ( 10 1 ¯ 0 ) - α surface [41], resulting in different density distributions of water in the adsorption region [42]. Sun et al. [43] confirmed hydrogen bonding between hydroxyl groups influences the viscosity of surface-adsorbed water. Therefore, even on surfaces of identical minerals with equal surface hydroxyl densities, different phenomena may exist. Most flow studies have utilized only one type of quartz, leaving the characteristics of water flow and boundary conditions in different quartz nanopores not fully understood.
In this work, molecular dynamics (MD) simulations were employed to study water flow characteristics in two different terminations of α-quartz surfaces ( ( 10 1 ¯ 0 ) - α and ( 10 1 ¯ 0 ) - β , which possess identical surface hydroxyl densities. Section 2 provides detailed descriptions of the quartz wall model construction, MD simulation parameters, and flow theory in nanoscale pores. Section 3 analyzes the distinct distribution characteristics of water molecules on ( 10 1 ¯ 0 ) - α and ( 10 1 ¯ 0 ) - β surfaces, along with flow characteristics and flux, leading to the establishment of flow equations for different surfaces. Section 4 emphasizes key insights obtained from the simulations and provides a comprehensive evaluation of the results. This work provides more detailed mechanisms for water flow in inorganic nanopores of shale, offering different flow models for various shale formation scenarios with inorganic pores, thereby supporting numerical simulation and gas production through dewatering operations.

2. Models and Methods

In this section, we describe the molecular models and simulation methods for water flow in two different terminations of the α-quartz ( 10 1 ¯ 0 ) surface ( ( 10 1 ¯ 0 ) - α and ( 10 1 ¯ 0 ) - β surfaces). All MD simulations were performed using the LAMMPS 2022 software package [44], with molecular configurations visualized using VMD 1.9.3 software [45].

2.1. Molecular Models

Usually, the α-quartz ( 10 1 ¯ 0 ) surfaces exhibit two different terminations [40]. The α-quartz unit was first cut along the ( 10 1 ¯ 0 ) plane [41,42], followed by hydrogen addition to the cleaved oxygen atoms on the fractured quartz surface. The unit cell was then replicated and extended in the x and y directions to obtain the hydroxylated quartz surface [41]. Different surfaces were exposed based on where the surface was cleaved, as shown in Figure 1a. Figure 1 illustrates slit-shaped quartz nanopores composed of α-quartz ( 10 1 ¯ 0 ) - α and ( 10 1 ¯ 0 ) - β surface structures as substrates. Figure 1b,c contain 1243 and 1259 water molecules, respectively. As sedimentary rocks were initially water-saturated, the substrate surfaces are fully hydroxylated to represent the strong hydrophilicity of quartz under geological conditions [46]. The pore width H is defined as the distance between the hydroxyl oxygen atoms on the inner sides of the two quartz surfaces. The dimensions of each substrate in the x, y, and z directions are 2.946 × 2.701 × 1.327 nm3, similar to the work of Wang et al. [46] and Xu et al. [47]. The hydroxyl (-OH) density on each surface is 7.54 sites/nm2, which aligns well with previous simulation work [48] and empirical calculations [49]. Furthermore, the quartz substrates remain rigid throughout all simulations, except for the hydroxyl hydrogens [50]. The ClayFF force field [51] is employed to describe the quartz nanopores, while water molecules are described using the SPC (Simple Point Charge) model [51].

2.2. Simulation Methods and Details

In this work, the temperature and pressure conditions are set at 323 K and 20 MPa, respectively. The target pressure is verified by comparing the bulk density of water at the pore center with the density under NPT ensemble conditions. This methodology is widely employed in MD simulations to determine the appropriate number of fluid molecules under confinement conditions [52,53,54]. Intermolecular interactions consist of the pairwise additive 12–6 Lennard-Jones (LJ) and Coulomb potentials. The LJ potentials are truncated at 1.2 nm with tail corrections. The Coulombic potential is used to model the long-range electrostatic interactions with the particle–particle particle–mesh (PPPM) method [46,55]. The interactions between different particles are described using the Lorentz–Berthelot mixing rules. Periodic boundary conditions are applied only in the x and y directions. In the z-direction, a large enough vacuum slab is added to minimize the periodic charge effects [39,56]. The time step is set at 1 fs.
First, 6 ns of equilibrium molecular dynamics (EMD) simulations are performed, with the initial 3 ns dedicated to system equilibration and the subsequent 3 ns for data sampling to analyze the static distribution characteristics of water molecules within the pore. Following the EMD simulations, external field non-equilibrium molecular dynamics (EF-NEMD) simulations are conducted by applying external driving forces to investigate water flow in quartz nanopores under pressure-driven conditions [57,58,59]. Referred to the previous research of Xu et al. [47], we employ a series of pressure gradients ranging from 1.5 to 9 MPa/nm to make the water form steady-state flow in the EF-NEMD simulations [60]. The total EF-NEMD simulation time is 9 ns, with the first 3 ns allocated for achieving steady-state flow conditions and the subsequent 6 ns for data collection.

3. Results and Discussions

3.1. Density Profile and Orientation Parameter

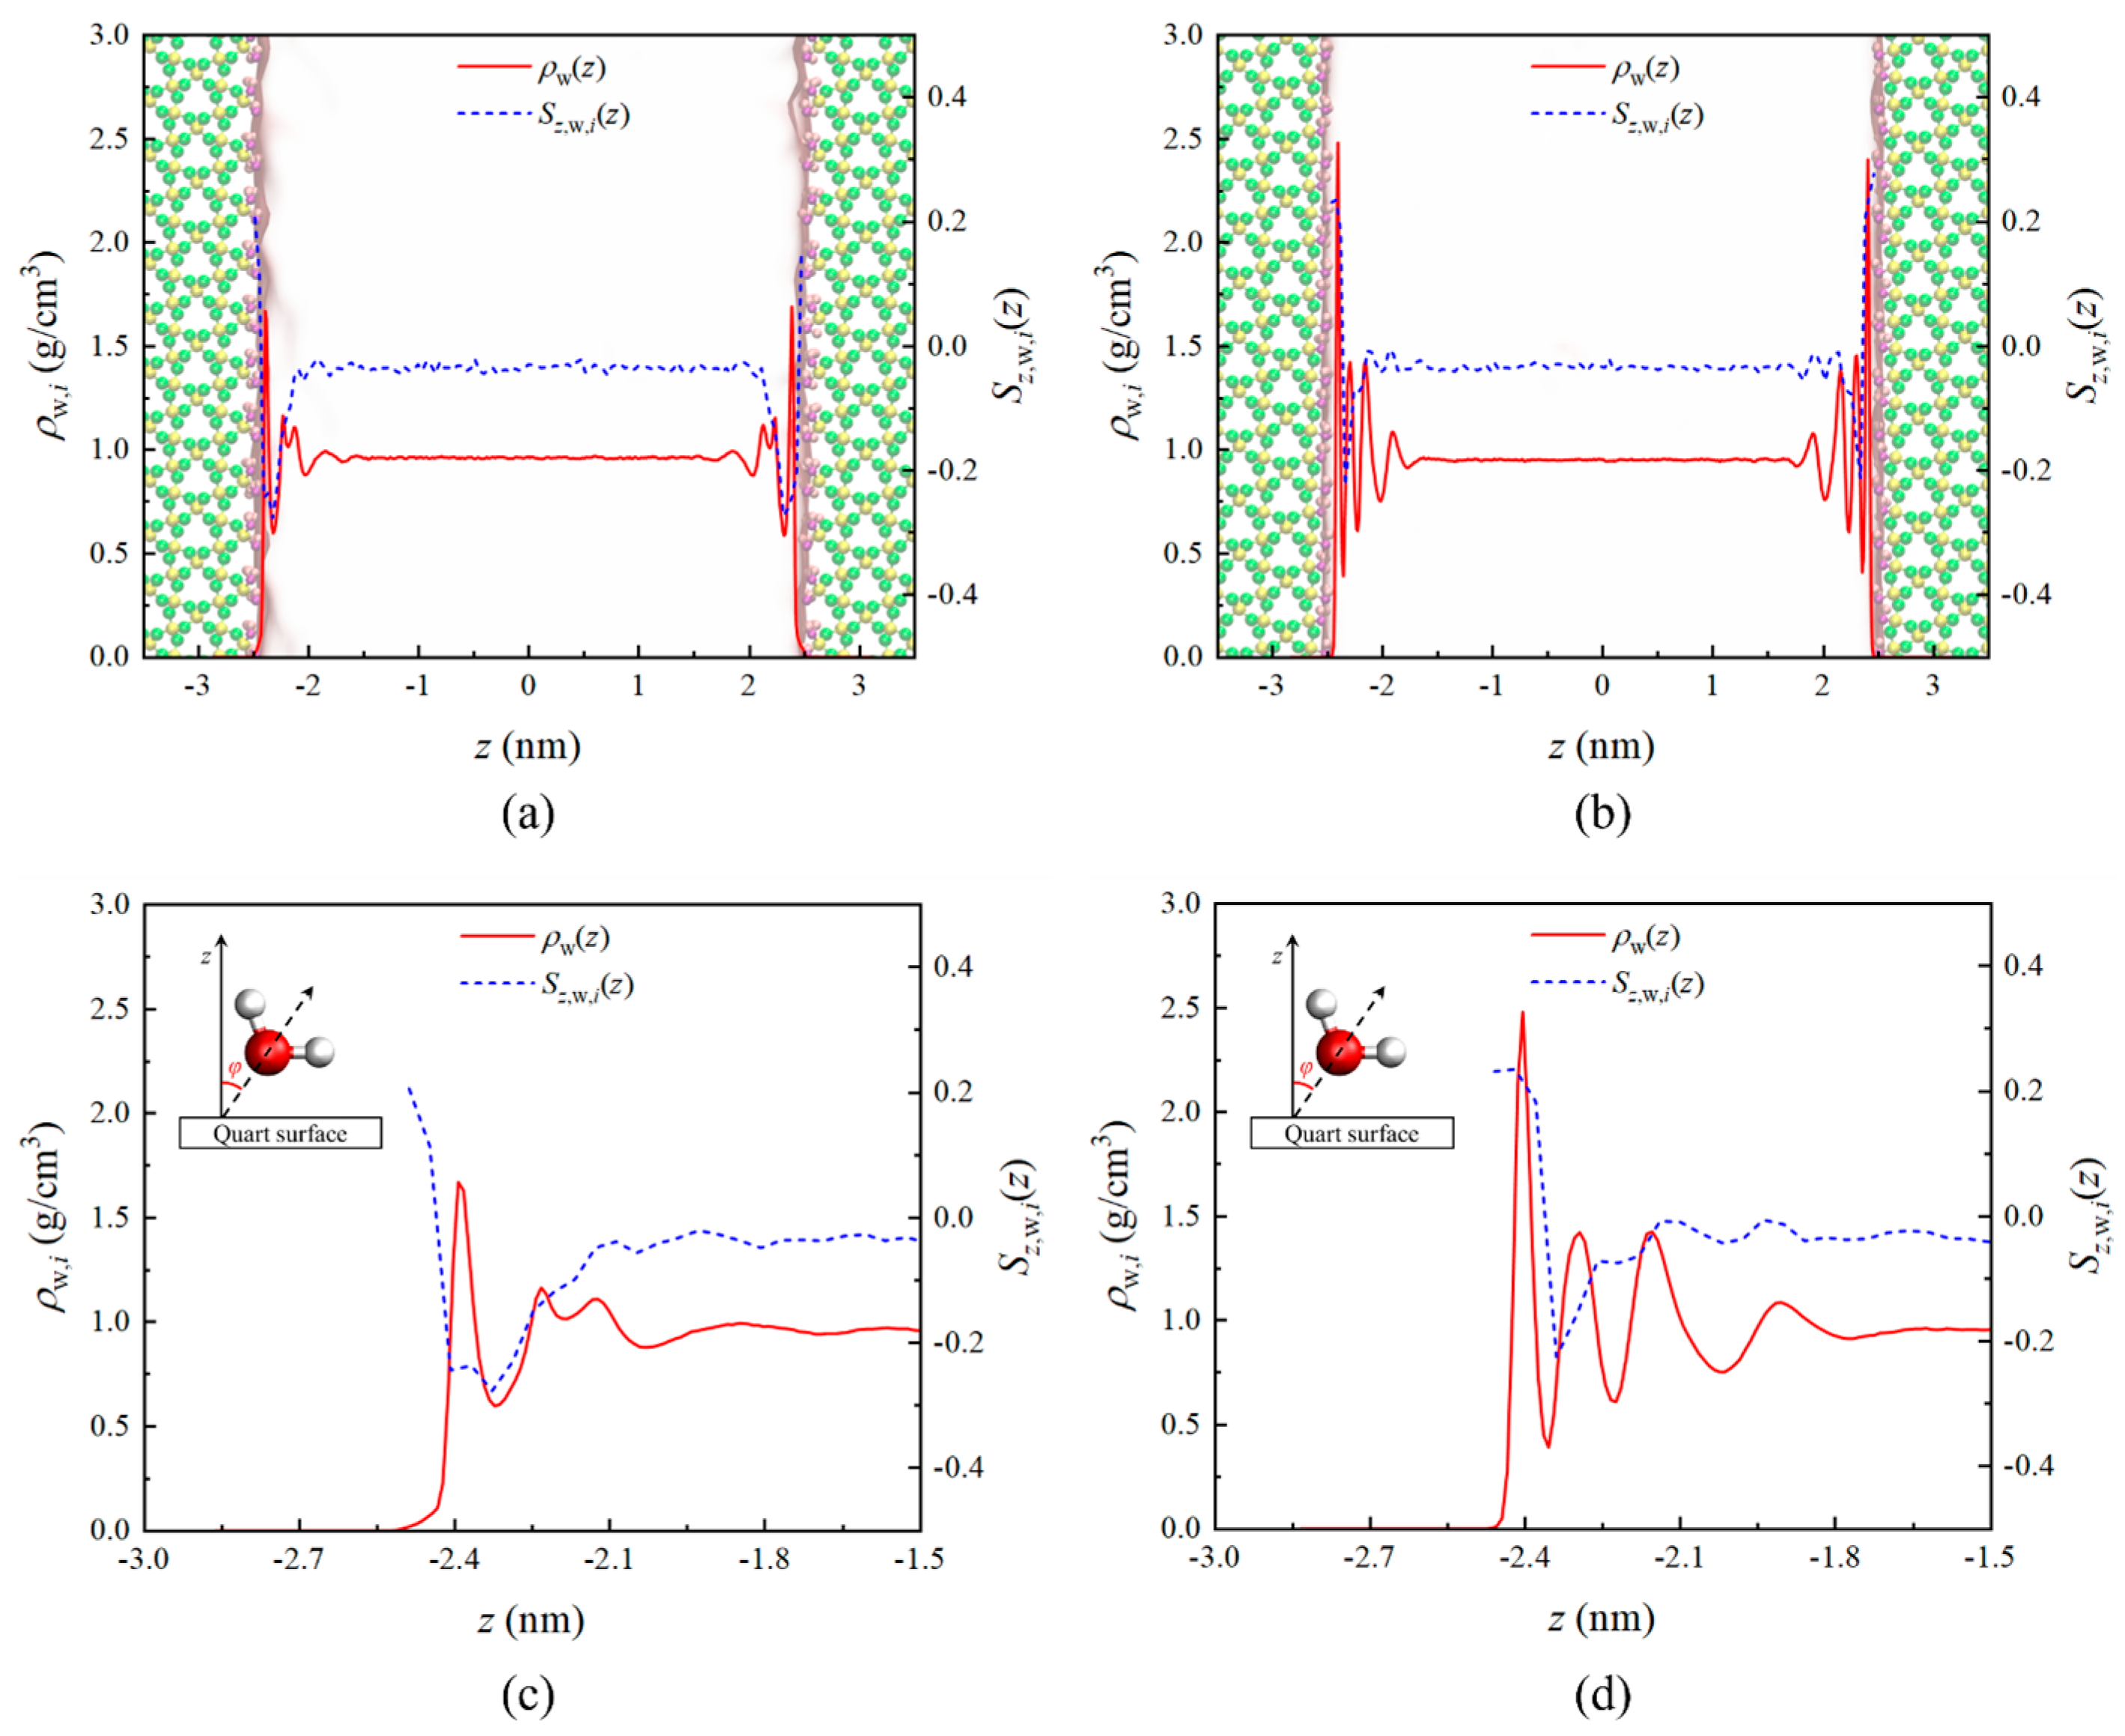
Figure 2 illustrates the static density distribution of water molecules under confinement effects in quartz nanopores. In Figure 2a,b, due to the strong hydrophilicity of the quartz walls, water molecules exhibit four adsorption layers in both cases [39,61], with thicknesses of approximately 0.77 nm and 0.73 nm, respectively, which aligns with the critical thickness of the interfacial region determined by Wu et al. [34] and Xu et al. [47]. On the ( 10 1 ¯ 0 ) - α surface, the adsorption density of the first layer is 1.68 g/cm³, significantly lower than the 2.44 g/cm³ observed on the ( 10 1 ¯ 0 ) - β surface, consistent with findings by Kobayashi et al. [33] and Skelton et al. [41]. Moreover, all four adsorption layers on the ( 10 1 ¯ 0 ) - α surface demonstrates lower densities compared to those on the ( 10 1 ¯ 0 ) - β surface. The water density in the pore center remains relatively stable, with densities of 0.961 g/cm3 and 0.951 g/cm3 by MD simulation, respectively. These values show less than 5% relative error compared to the bulk water density of 0.996 g/cm3 under the same temperature and pressure conditions from the NIST database [62], thereby validating the accuracy of the force field employed.
Furthermore, the orientational parameter Sz,w,i(z) of water molecules was calculated [63], which is given as
S z , w , i ( z ) = 1.5 × cos 2 φ 0.5 , i = α , β ,
where φ is the angle of H2O between the z-axis and the connecting line of the O atom and the middle of two H atoms (as shown in Figure 2). Sz,w,i(z) = 1 means that bisecting vectors of water molecule are fully perpendicular to the quartz surface, while Sz,w,i(z) = −0.5 means that bisecting vectors of water molecule are fully parallel to the quartz surface, and Sz,w,i(z) = 0 means that molecules have a disordered distribution.
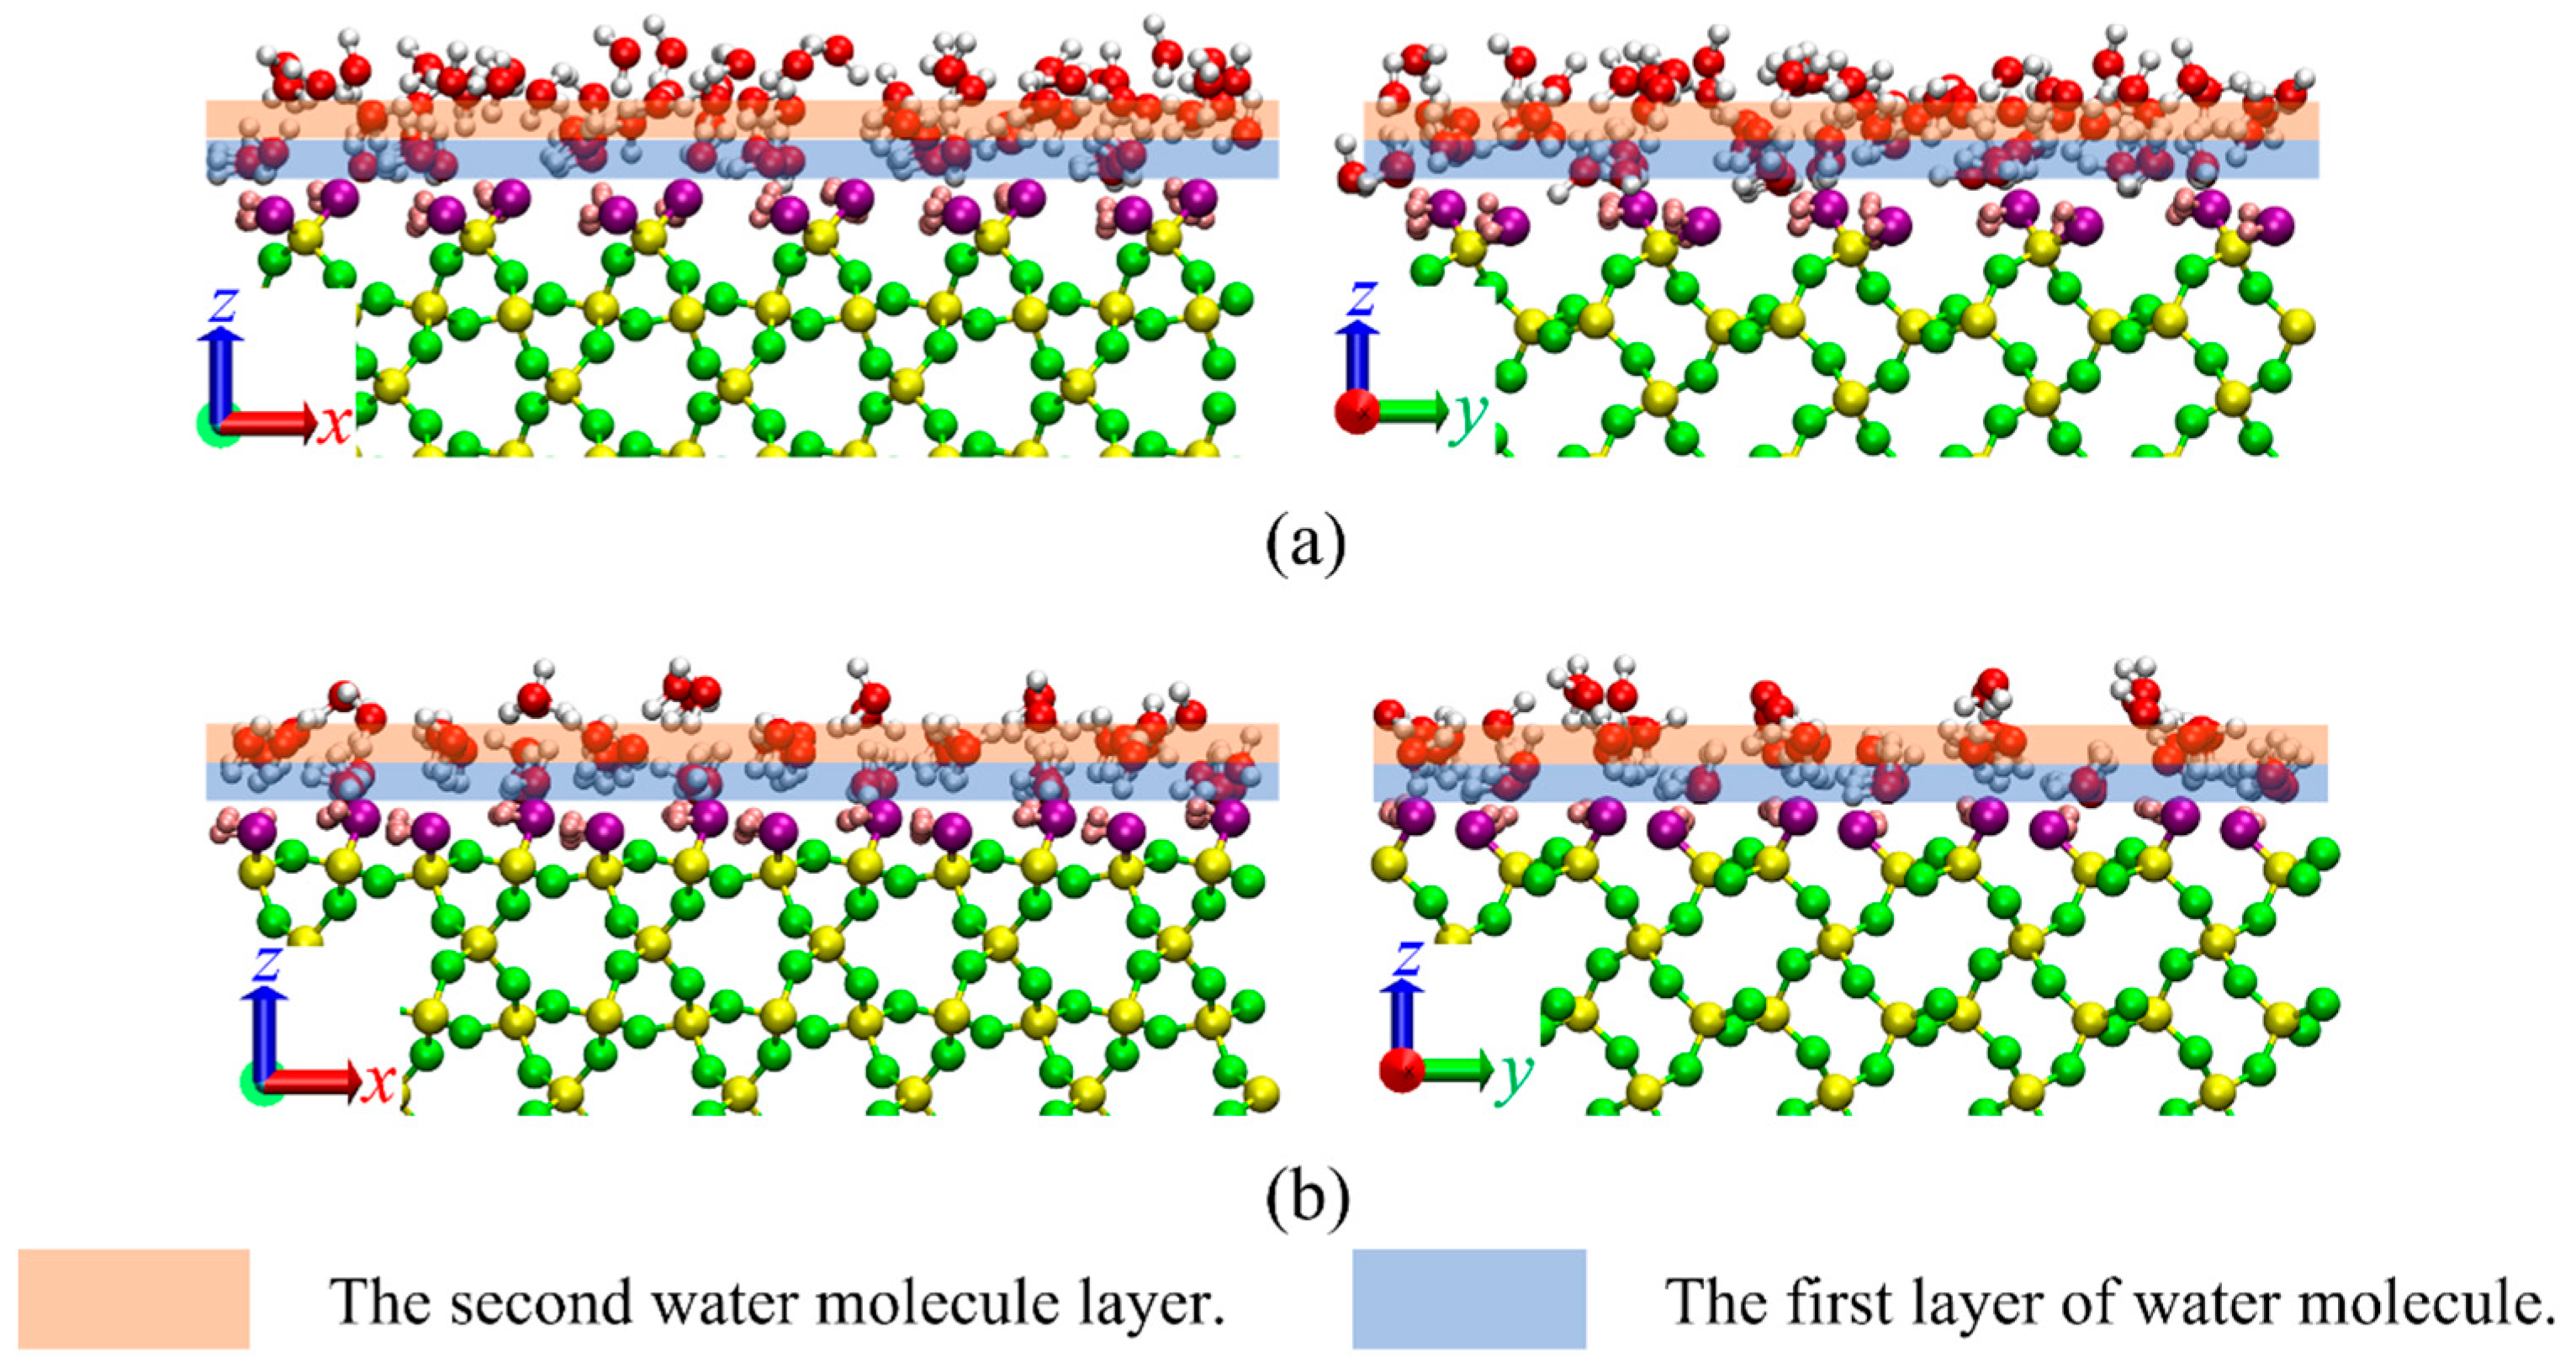
Figure 2 demonstrates the orientational parameter of water molecules, revealing strong orientational characteristics near the walls, indicating that water molecules form specific structures on the two quartz surfaces. As shown in Figure 2c, water molecules form only one layer arrangement structure under the ( 10 1 ¯ 0 ) - α surface; meanwhile, Figure 2d shows that water molecules form two layers of distinct arrangement structures under the ( 10 1 ¯ 0 ) - β surface. To investigate this further, we obtained molecular simulation snapshots of the near-wall region, as illustrated in Figure 3. Water molecules near the ( 10 1 ¯ 0 ) - α surface show a relatively disordered distribution, while those near the ( 10 1 ¯ 0 ) - β surface clearly exhibit a structure arranged in two layers, corresponding to the molecular orientation patterns.

3.2. Velocity Profile and Volume Flux

After establishing the static characteristics of water molecules in quartz nanopores, we conducted studies on water flow characteristics using EF-NEMD. Figure 4 shows the water velocity profiles and density distribution curves under different pressure gradients at the two quartz surfaces. The density distribution curves of the water phase under various pressure gradients essentially coincide with those under static conditions. This invariance of single-phase fluid density distribution concerning driving force has become a consensus in numerous EF-NEMD studies [17,46]. Under different pressure gradients, the water velocity profiles exhibit parabolic shapes, consistent with traditional Navier-Stokes (NS) equations descriptions. The flow velocity under the ( 10 1 ¯ 0 ) - α surface is observed to be slightly higher than that under the ( 10 1 ¯ 0 ) - β surface. Two possible explanations for this phenomenon are first, the different flow boundaries under the two surfaces, and second, the varying viscosity of bulk water under the two surfaces.
Accordingly, we fitted the velocity distributions under different pressures for both surfaces using the equation vx,w,i(z) = az2 + b. In a single-phase pressure-driven Poiseuille flow, the viscosity ηw,bulk,i, namely the shear viscosity, could be obtained according to the curvature of parabolic velocity profiles vx,w,i [64],
η w , b u l k , i = d p / d x ( d 2 v x , w , i ( z ) d z 2 ) , i = α , β ,
where dp/dx indicates the pressure gradient along the x-direction. Thus, the viscosity is obtained by η w , b u l k , i = d p / d x 2 a . Through fitting and calculations of the bulk water region velocities, the bulk water viscosity under the ( 10 1 ¯ 0 ) - α surface is 0.309 ± 0.016 mPa·s, while under the ( 10 1 ¯ 0 ) - β surface it is 0.303 ± 0.014 mPa·s. These results closely align with the bulk viscosity value of 0.292 mPa·s calculated using the SPC water model at 19.1 MPa and 306.5 K [65], and show excellent agreement with the values of Zhan et al. (0.301 ± 0.026 mPa·s, 323 K, 20 MPa) [60]. This indicates that the velocity differences are solely attributable to differences in flow boundary conditions. Although Chen et al. [21] concluded that the distribution of hydroxyl groups does not influence the flow characteristics of water, the differences in atoms other than hydroxyl groups on the surface are the main reason for the differences in flow boundary conditions, as shown in Figure 1, Figure 2 and Figure 3.
To quantify the effects of velocity differences, we calculated the respective flow flux [56],
J w , i MD = H 2 H 2 ρ w , i ( z ) v x , w , i ( z ) d z ρ w , bulk , i = α , β ,
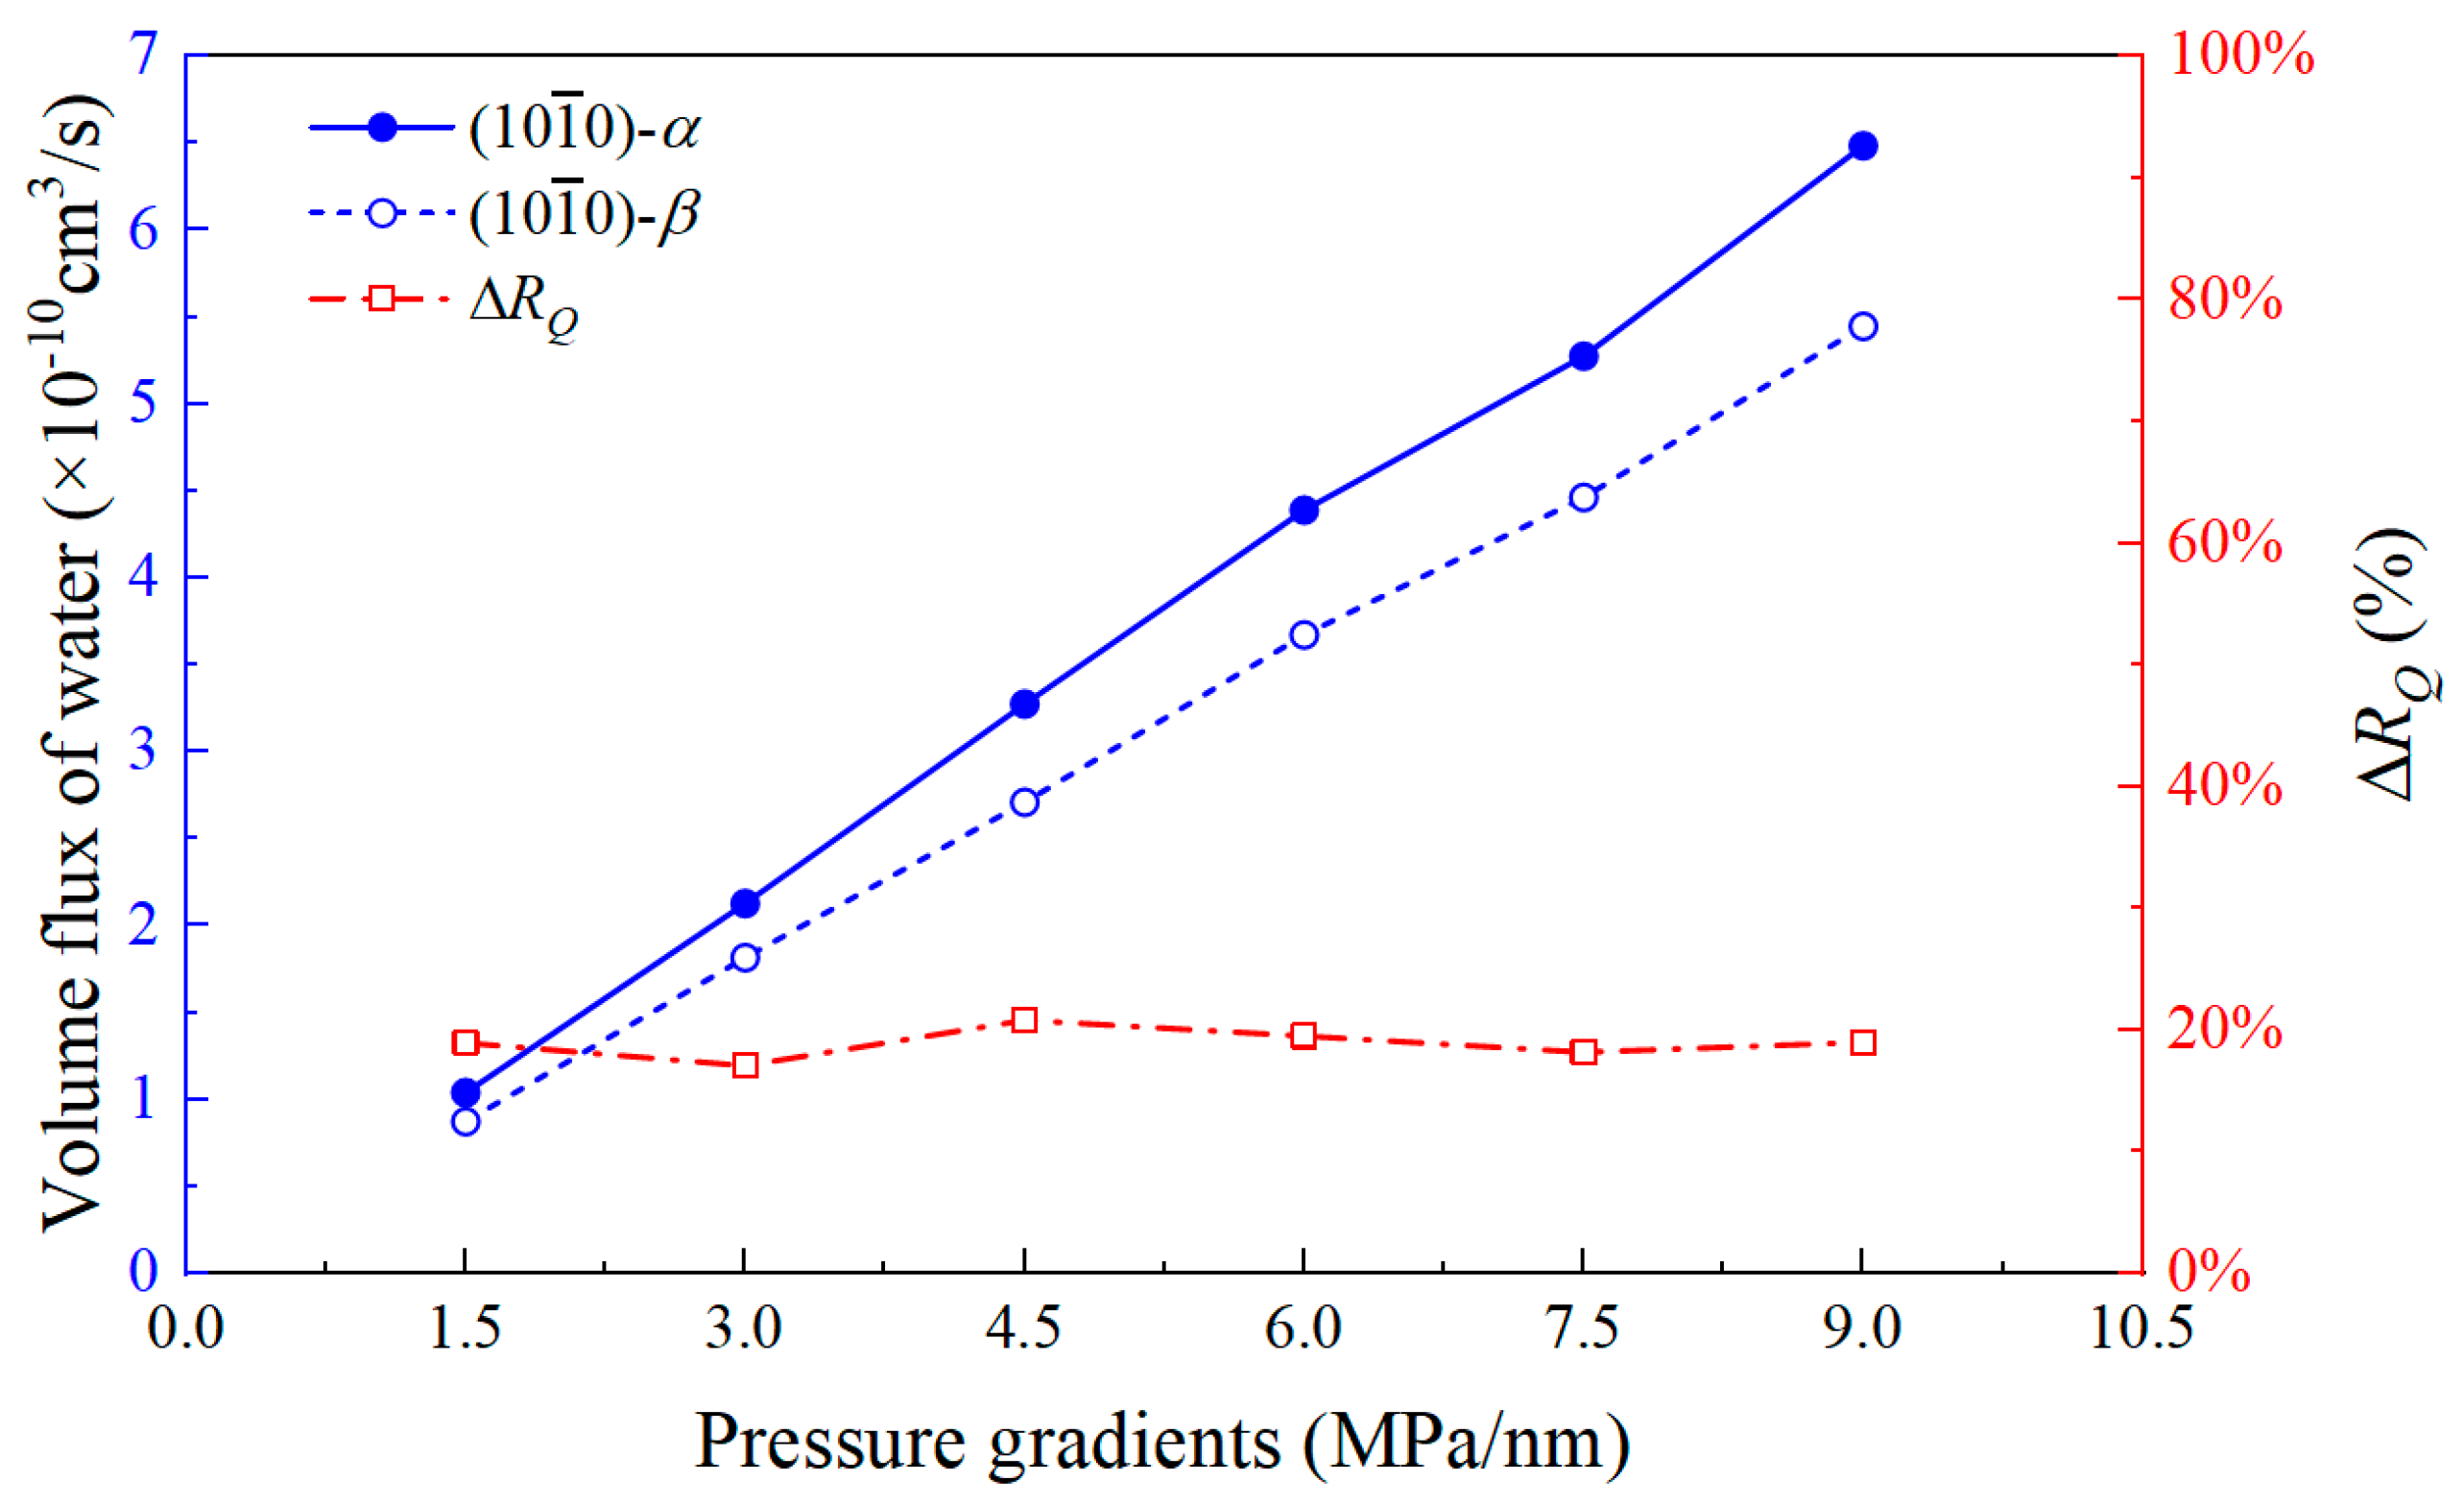
where ρw,bulk is the bulk density of water at the given temperature and pressure conditions, g/cm3. Using the flow flux under the ( 10 1 ¯ 0 ) - β wall as the reference, the difference in flow flux between the two quartz surfaces is quantified ( Δ R Q = J w , α MD J w , β MD J w , β MD × 100 % ), as shown in Figure 5. It can be observed that the flow flux under both wall surfaces exhibits a good linear relationship with the pressure gradient. The flow flux under the ( 10 1 ¯ 0 ) - α wall is consistently higher than that under the ( 10 1 ¯ 0 ) - β wall for any pressure gradient. A comparison of the flow flux differences shows that the flow flux under the ( 10 1 ¯ 0 ) - α wall is approximately 1.2 times that under the ( 10 1 ¯ 0 ) - β wall. Therefore, the study of flow boundaries is crucial, and the next section will present the flow boundaries for the two wall surfaces.

3.3. Water Flow Theoretical Model

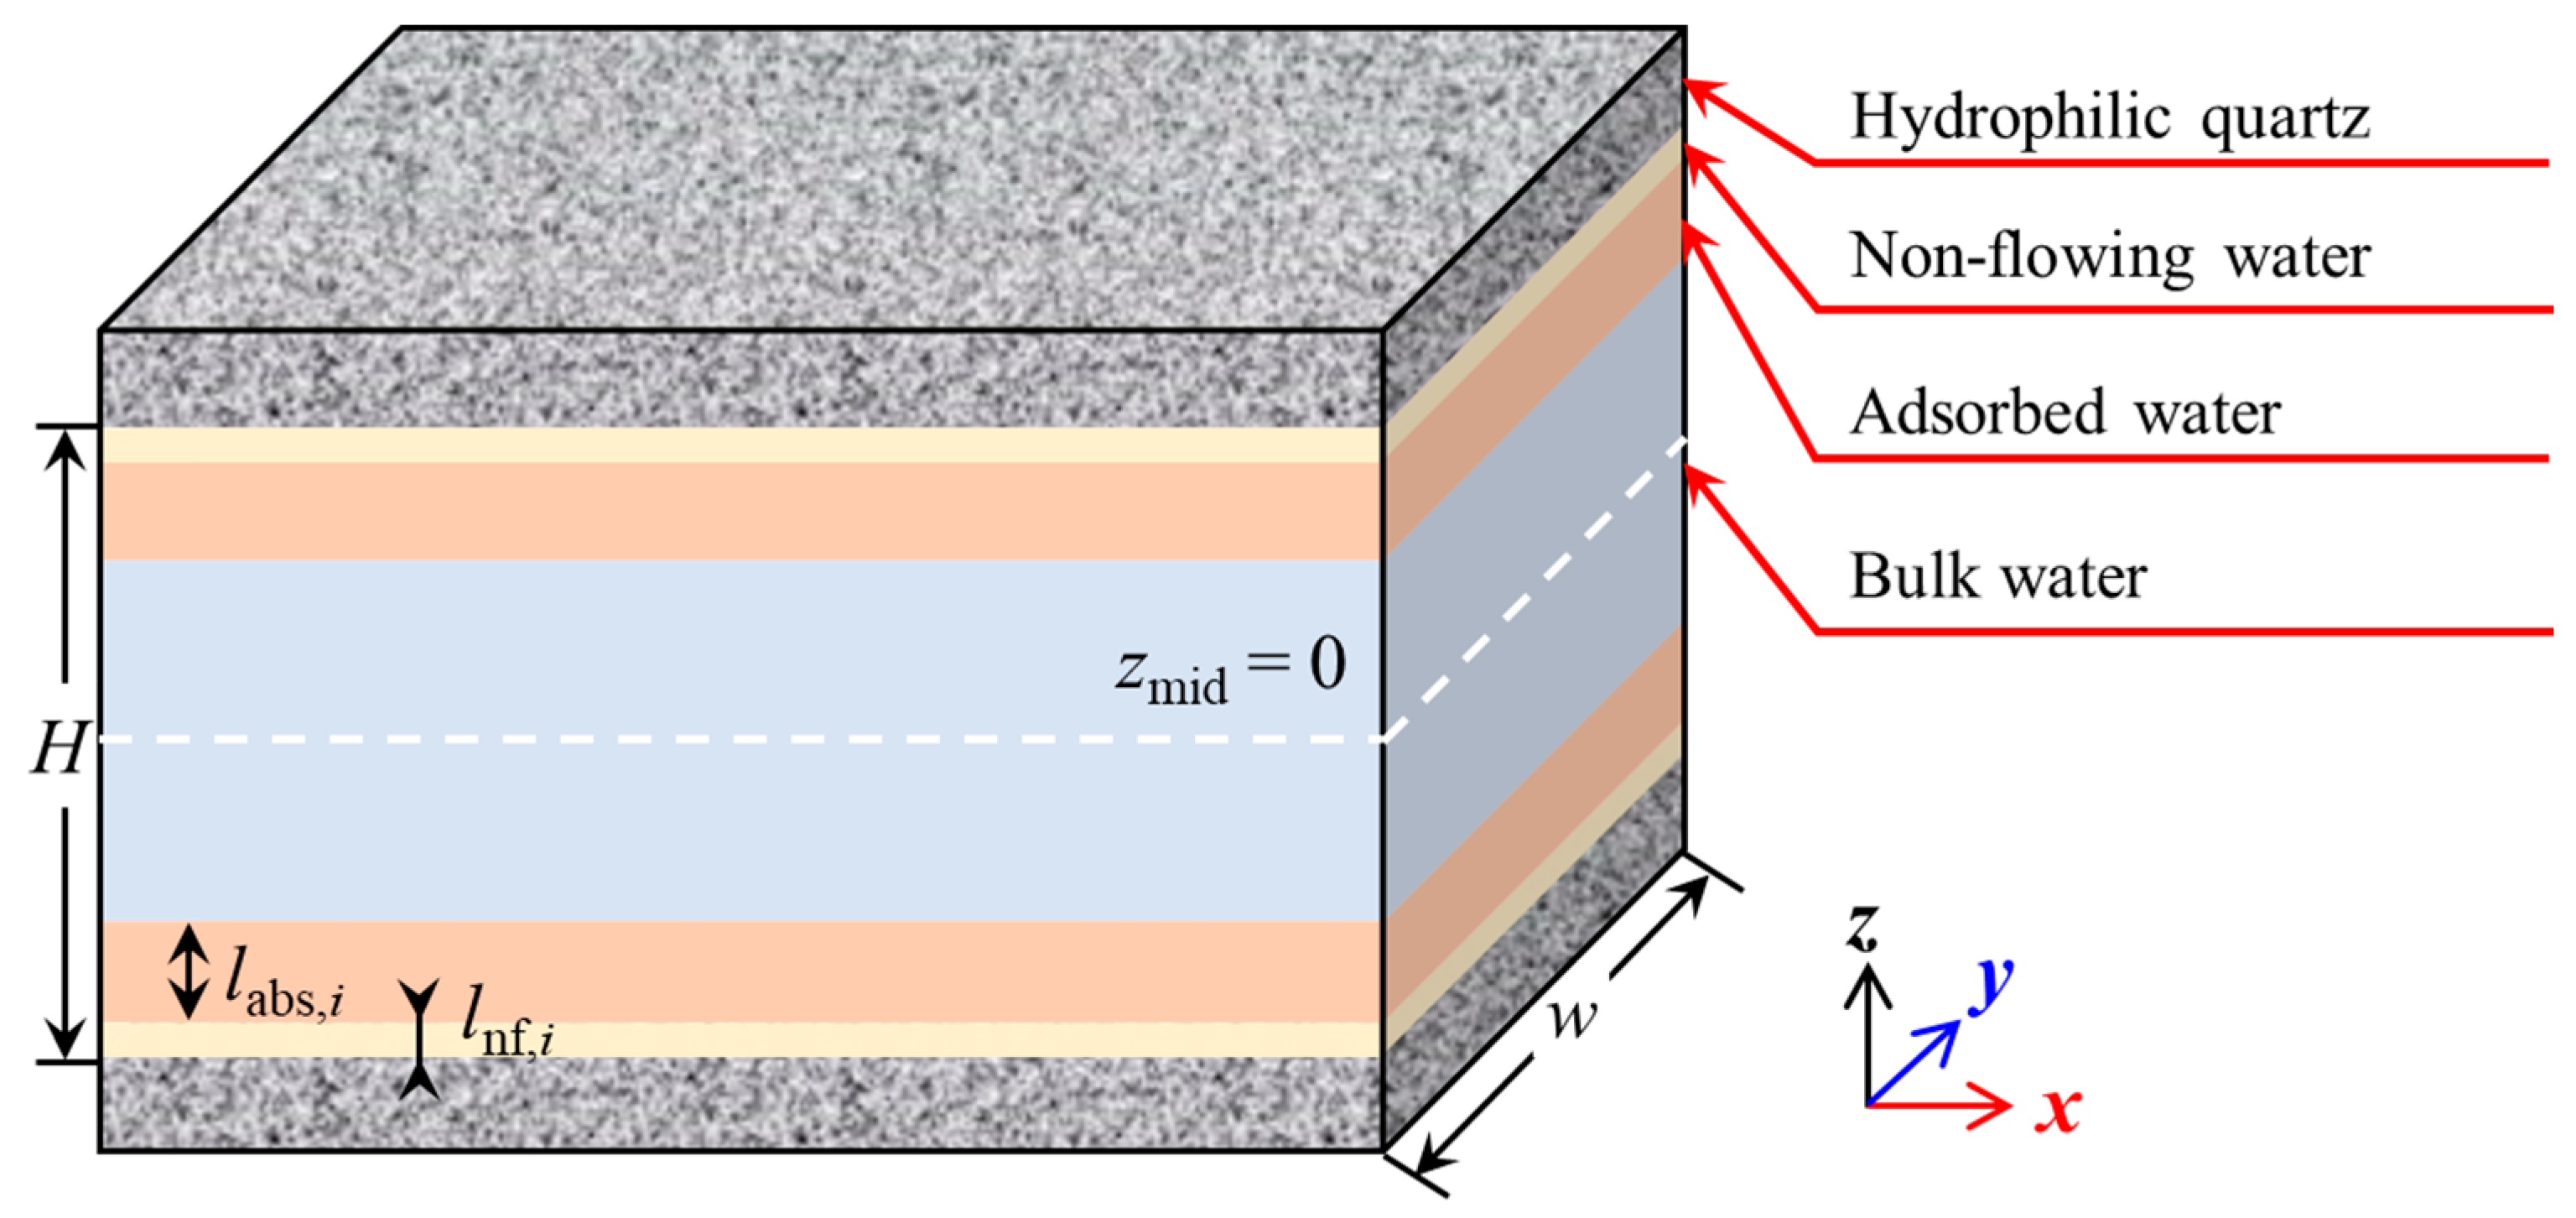
The mathematical model based on the continuous medium hypothesis has been widely applied in the petroleum industry. Although the fluid density within nanoscale confined spaces exhibits heterogeneity due to the influence of pore surfaces, with a continuous variation in density distribution, many researchers simplify the calculation by considering the effects of solid–liquid interactions on the fluid density distribution. They divide the fluid-filled space inside the pore into two regions: the near-wall region and the bulk water region [22,34,37,66,67]. Based on the analysis in the previous section, the water fluid is divided into three regions: the non-flowing water region, the adsorbed water region, and the bulk water region, as shown in Figure 6. Each region exhibits different fluid physical properties, such as density, viscosity, and others.
The critical thickness (lnf,i) of the non-flowing water region is determined based on the velocity profile and adsorption layer thickness shown in Figure 4, measuring 0.14 nm beneath the ( 10 1 ¯ 0 ) - α surface and 0.27 nm beneath the ( 10 1 ¯ 0 ) - β surface. Regarding the critical thickness (labs,i) of the adsorbed water region, some researchers consider it to be the thickness of all fluid adsorption layers, taking labs,i as 0.7 nm or 0.8 nm [68,69], while others argue it should be the thickness of the first adsorption layer, approximately 0.3 nm [60]. To determine a reasonable value for this thickness, this study establishes a mathematical model for single-phase water flow based on continuous medium assumptions. By combining this with velocity distribution curves obtained from molecular simulations, various current perspectives are analyzed and compared to determine the precise thickness of the adsorbed water region during single-phase water flow in quartz nanopores.
For the non-flowing water region, the velocity is assumed to be zero, indicating no flow occurs.
For the adsorbed water region, according to the theory of Wu et al. [34], the viscosity (ηw,abs), density (ρw,abs), and slip length (ls) are all dependent on wettability, are given as
η w , abs η w , bulk = 0.018 θ + 3.25 ,
ρ w , abs = ρ w , bulk + ( 1.6 0.0095 θ ) ,
l s = 0.41 1 + cos θ 2 ,
where θ is the contact angle of water on the quartz surface. According to the research by Kobaya et al. [33], the systems of the ( 10 1 ¯ 0 ) - α surface and ( 10 1 ¯ 0 ) - β surface are completely water-wet, that is, the contact angles are zero. Then, the velocity of water in the adsorbed water region vx,w,i(z) is given as
v x , w , i z = 1 2 η w , abs d p d x ( H 2 l nf , i ) 2 z 2 + C 1 , i , H 2 l nf , i l abs , i z H 2 l nf , i
For bulk water region, the velocity of water vx,w,i(z) is given as
v x , w , i z = 1 2 η w , bulk d p d x ( H 2 l nf , i ) 2 z 2 + C 2 , i , 0 z H 2 l nf , i l abs , i
Then, considering the slip boundary at the liquid–wall interface and assuming that the water velocity distribution at the absorbed water and bulk water interface is continuous, the constants C1,i and C2,i in Equations (9) and (10) are given as
C 1 , i = l s ( H 2 l nf , i ) η w , abs d p d x
C 2 , i = 1 2 η w , abs 1 2 η w , bulk d p d x l abs , i l abs , i + 2 l nf , i H + C 1 , i
where i = α, β represent the ( 10 1 ¯ 0 ) - α surface and the ( 10 1 ¯ 0 ) - β surface, respectively.
We set the values of labs,i to 0 nm, 0.15 nm, and 0.27 nm, with the corresponding velocity distributions shown in Figure 7. Under the ( 10 1 ¯ 0 ) - α surface, the lnf value of 0.14 nm encompasses only the first adsorption layer, while under the ( 10 1 ¯ 0 ) - β surface, the lnf value of 0.26 nm spans both the first and second adsorption layers. Notably, the hydroxyl density is identical for both surfaces, with the only difference being the arrangement of the hydroxyl groups. According to the theory of Ho et al. [35], if adsorption sites on a hydrophilic surface are sufficiently close to allow water molecules to easily migrate from one site to another, such hydrophilic surfaces can exhibit liquid slip. Thus, the hydroxyl arrangement pattern can account for these observed differences. Comparing with the water molecule velocity profiles obtained from MD simulations, we found that setting labs to 0.15 nm provides the best fit (with relative errors of 1.18% for ( 10 1 ¯ 0 ) - α and 0.11% for ( 10 1 ¯ 0 ) - β ). This thickness approximates that of the next adsorption layer beyond the non-flowing water region. Using the 0 nm model overestimates the average velocity (with relative errors of 12.17% for ( 10 1 ¯ 0 ) - α and 14.36% for ( 10 1 ¯ 0 ) - β ), while the 0.27 nm model underestimates it (with relative errors of −6.06% for ( 10 1 ¯ 0 ) - α and −4.30% for ( 10 1 ¯ 0 ) - β ).
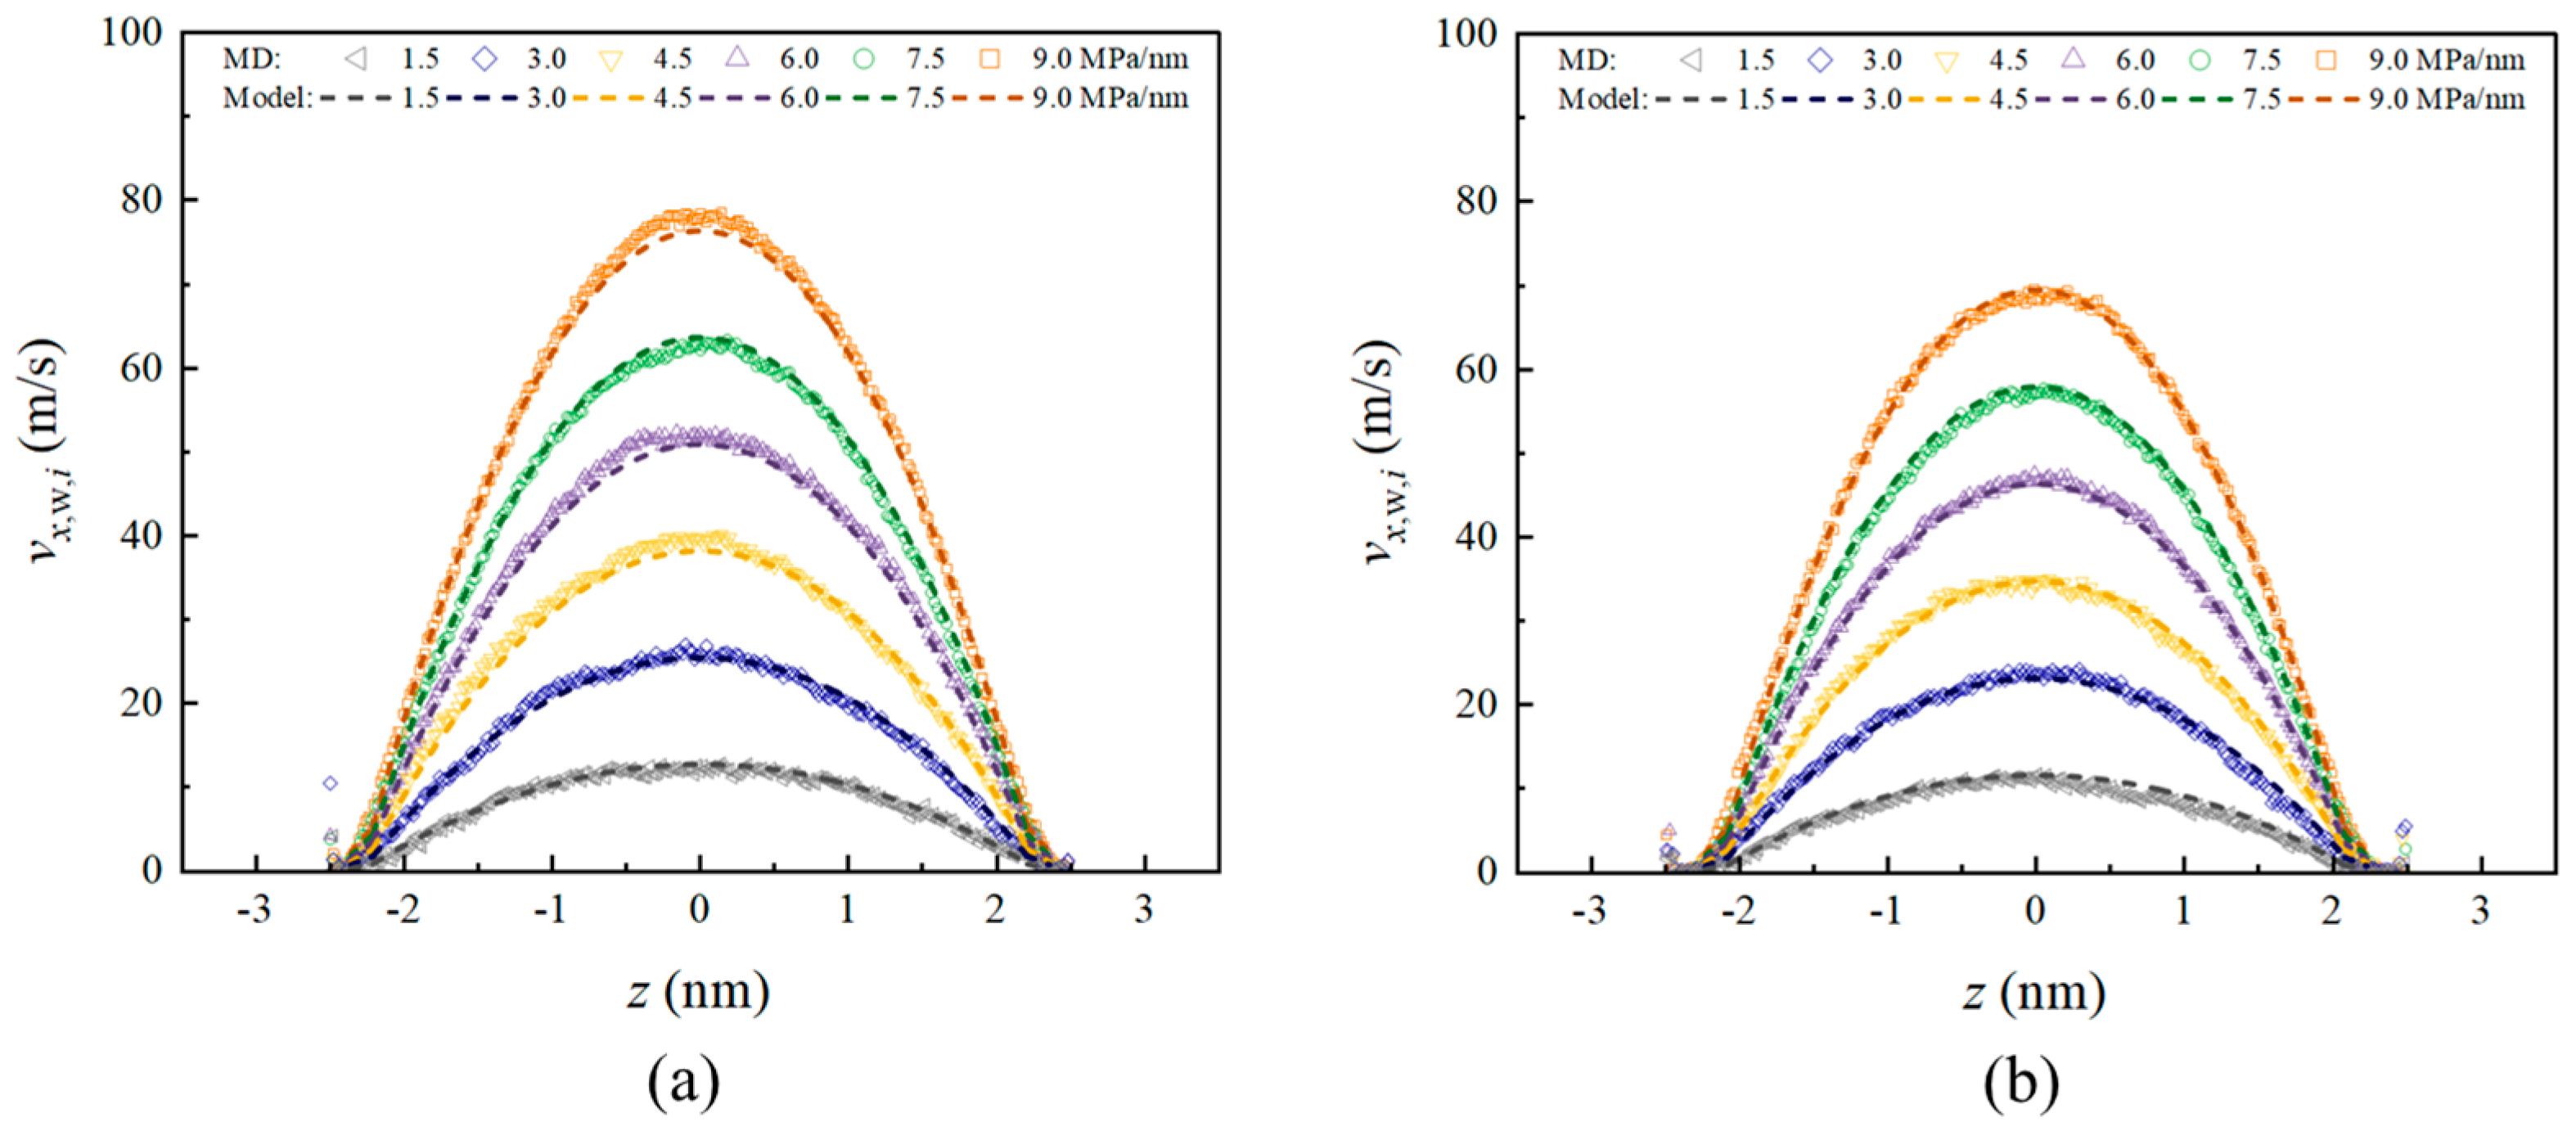
Accordingly, we selected 0.15 nm as labs,i for both cases, while using 0.14 nm and 0.27 nm, respectively, for lnf,i to calculate velocity distributions under different pressure gradients, as shown in Figure 8. The results demonstrate that this model can effectively predict velocity distributions under different wall surfaces.
Furthermore, we calculated the model flow flux. In the model, the water mass fluxes in the adsorbed water region, Qabs,i, in the bulk water region Qbulk,i are given as
Q abs , i = 2 ρ w , abs H 2 l nf , i l abs , i H 2 l nf , i v x , w , i z w d z = ρ w , abs η w , abs d p d x w ( H 2 l nf , i ) 2 2 3 l abs , i 2 + c 1 , i l abs , i
Q bulk , i = 2 ρ w , bulk 0 H 2 l nf , i l abs , i v x , w , i z w d z = ρ w , bulk 3 η w , bulk d p d x w ( H 2 l nf , i l abs , i ) ( H 2 l nf , i ) 2 + 4 ( H 2 l nf , i ) l abs , i 2 l abs , i 2 + 3 c 2 , i
where c1,i, c2,i are given as
c 1 , i = C 1 , i ( 1 2 η w , abs d p d x ) = 2 l s ( H 2 l nf , i )
c 2 , i = C 2 , i ( 1 2 η w , bulk d p d x ) = η w , bulk η w , abs η w , abs l abs , i l abs , i + 2 l nf , i H + c 1 , i η w , bulk η w , abs
where w = 2.701 nm is the width of the pore space in the y-direction. The total volumetric flux of water using the model, Jw,i is given as
J w , i = ( Q abs , i + Q bulk , i ) / ρ w , bulk
To verify the accuracy of the model, we calculated the relative error (Δεi) between the model volumetric flow flux and MD simulation volumetric flow flux, which is given as
Δ ε i = J w , i J w , i MD J w , i MD × 100 % , i = α , β ,
The calculated errors are shown in Figure 9. As can be seen, our model accurately calculates the volumetric fluxes of water in the two quartz nanopores, with relative errors within 5%. Based on the comparison of the flow data, our established model can effectively predict both velocity distributions and volumetric flow rates in pores with different quartz surfaces.

4. Conclusions

In this study, we investigated water flow characteristics in different α-quartz ( 10 1 ¯ 0 ) surface nanopores using molecular dynamics simulations. We examined two distinct surface terminations ( ( 10 1 ¯ 0 ) - α and ( 10 1 ¯ 0 ) - β ), which possess identical hydroxyl densities but different arrangements. Through equilibrium and non-equilibrium molecular dynamics simulations, we analyzed the density distribution, molecular orientation, velocity profiles, and volumetric flux of confined water, and based on MD simulation results, a hydrodynamic flow model to describe water in nanopores was developed. The detailed conclusions are listed as following.
1. Despite having identical hydroxyl densities, the ( 10 1 ¯ 0 ) - α and ( 10 1 ¯ 0 ) - β surfaces exhibit distinct water molecule distribution patterns. The ( 10 1 ¯ 0 ) - β surface shows stronger water molecule structuring with a structure arranged in two layers and higher first-layer adsorption density (2.44 g/cm³) compared to the more disordered distribution and lower first-layer density (1.68 g/cm³) on the ( 10 1 ¯ 0 ) - α surface;
2. The flow characteristics differ significantly between the two surfaces. Under identical pressure gradients, the flow flux through ( 10 1 ¯ 0 ) - α surface nanopores is consistently about 1.2 times higher than through ( 10 1 ¯ 0 ) - β surface nanopores. This difference is primarily attributed to varying flow boundary conditions rather than bulk water viscosity, which remains similar for both surfaces (0.309 ± 0.016 mPa·s and 0.303 ± 0.014 mPa·s, respectively);
3. We established a theoretical model that divides the pore space into three regions: non-flowing water, adsorbed water, and bulk water. The critical thickness of the non-flowing region is 0.14 nm for the ( 10 1 ¯ 0 ) - α surface and 0.27 nm for the ( 10 1 ¯ 0 ) - β surface, while the adsorbed region thickness is 0.15 nm for both surfaces. This model effectively predicts both velocity distributions and volumetric flow rates with errors generally below 5%;
4. The findings demonstrate that surface hydroxyl arrangement patterns significantly influence water flow characteristics in quartz nanopores, even when hydroxyl densities are identical. This has important implications for understanding and predicting fluid transport in shale formations with varying mineral surface properties.
These results provide valuable insights into water transport mechanisms in shale inorganic nanopores and offer practical guidance for numerical simulation of shale gas production through dewatering operations. The developed theoretical model can be applied to improve the accuracy of large-scale reservoir simulations.

Author Contributions

Conceptualization, S.Z.; methodology, P.Z. and S.L.; software, J.B.; validation, J.B.; formal analysis, B.L.; investigation, Z.L.; resources, S.Z., X.W. and B.L.; data curation, S.L.; writing—original draft, J.B.; writing—review and editing, S.Z.; visualization, S.Z., S.L. and Z.L.; supervision, S.L.; project administration, P.Z. and X.W.; funding acquisition, X.W. All authors have read and agreed to the published version of the manuscript.

Funding

This research was funded by National Science Foundation of China (Grant Nos. 52204033, 42272180) and the Guizhou Provincial Science and Technology Projects (No. [CXTD]2023014).

Data Availability Statement

Data are contained within the article.

Acknowledgments

This work was financially supported by the National Science Foundation of China (Grant Nos. 52204033, 42272180) and the Guizhou Provincial Science and Technology Projects (No. [CXTD]2023014). This research was enabled in part by support provided by Hefei Advanced Computing Center.

Conflicts of Interest

The authors declare that they have no known competing financial interests or personal relationships that could have appeared to influence the work reported in this paper.

References

  1. Salygin, V.; Guliev, I.; Chernysheva, N.; Sokolova, E.; Toropova, N.; Egorova, L. Global shale revolution: Successes, challenges, and prospects. Sustainability 2019, 11, 1627. [Google Scholar] [CrossRef]
  2. Liao, Q.; Wang, B.; Chen, X.; Tan, P. Reservoir stimulation for unconventional oil and gas resources: Recent advances and future perspectives. Adv. Geo-Energy Res. 2024, 13, 7–9. [Google Scholar] [CrossRef]
  3. Guo, W.; Deng, S.; Sun, Y. Recent advances on shale oil and gas exploration and development technologies. Adv. Geo-Energy Res. 2024, 11, 81–87. [Google Scholar] [CrossRef]
  4. Clarkson, C.R.; Solano, N.; Bustin, R.M.; Bustin, A.; Chalmers, G.R.; He, L.; Melnichenko, Y.B.; Radliński, A.; Blach, T.P. Pore structure characterization of North American shale gas reservoirs using USANS/SANS, gas adsorption, and mercury intrusion. Fuel 2013, 103, 606–616. [Google Scholar] [CrossRef]
  5. Cao, T.; Song, Z.; Wang, S.; Cao, X.; Li, Y.; Xia, J. Characterizing the pore structure in the Silurian and Permian shales of the Sichuan Basin, China. Mar. Pet. Geol. 2015, 61, 140–150. [Google Scholar] [CrossRef]
  6. Feng, Q.; Xu, S.; Xing, X.; Zhang, W.; Wang, S. Advances and challenges in shale oil development: A critical review. Adv. Geo-Energy Res. 2020, 4, 406–418. [Google Scholar] [CrossRef]
  7. Sheng, G.; Su, Y.; Wang, W. A new fractal approach for describing induced-fracture porosity/permeability/compressibility in stimulated unconventional reservoirs. J. Pet. Sci. Eng. 2019, 179, 855–866. [Google Scholar] [CrossRef]
  8. Ren, L.; Su, Y.; Zhan, S.; Meng, F.; Zhao, G. Fully coupled fluid-solid numerical simulation of stimulated reservoir volume (SRV)-fractured horizontal well with multi-porosity media in tight oil reservoirs. J. Pet. Sci. Eng. 2019, 174, 757–775. [Google Scholar] [CrossRef]
  9. Wang, W.; Fan, D.; Sheng, G.; Chen, Z.; Su, Y. A review of analytical and semi-analytical fluid flow models for ultra-tight hydrocarbon reservoirs. Fuel 2019, 256, 115737. [Google Scholar] [CrossRef]
  10. Xing, X.; Feng, Q.; Zhang, W.; Wang, S. Vapor-liquid equilibrium and criticality of CO2 and n-heptane in shale organic pores by the Monte Carlo simulation. Fuel 2021, 299, 120909. [Google Scholar] [CrossRef]
  11. Riewchotisakul, S.; Akkutlu, I.Y. Adsorption-enhanced transport of hydrocarbons in organic nanopores. SPE J. 2016, 21, 1960–1969. [Google Scholar] [CrossRef]
  12. Vishnyakov, A.; Neimark, A.V. Studies of Liquid-Vapor equilibria, criticality, and spinodal transitions in nanopores by the gauge cell Monte Carlo simulation method. J. Phys. Chem. B 2001, 105, 7009–7020. [Google Scholar] [CrossRef]
  13. Zhan, S.; Bao, J.; Ning, S.; Zhang, M.; Wu, J.; Wang, X.; Li, Y. Effect of surface roughness on methane adsorption in shale organic nanopores from the perspective of molecular simulations. Chem. Eng. J. 2024, 498, 155322. [Google Scholar] [CrossRef]
  14. Zhan, S.; Ning, S.; Bao, J.; Jing, W.; Zhang, M.; Cui, J.; Duan, X.; Wang, X.; Li, Y. Comparative study on adsorption behaviors of CH4/CO2 and CH4/H2S in quartz nanopores from molecular perspectives: Implication for EGR in shale reservoirs. Colloids Surf. A Physicochem. Eng. Asp. 2025, 712, 136419. [Google Scholar] [CrossRef]
  15. Bao, B.; Zhao, S. A review of experimental nanofluidic studies on shale fluid phase and transport behaviors. J. Nat. Gas Sci. Eng. 2021, 86, 103745. [Google Scholar] [CrossRef]
  16. Nojabaei, B.; Johns, R.T.; Chu, L. Effect of capillary pressure on phase behavior in tight rocks and shales. SPE Reserv. Eval. Eng. 2013, 16, 281–289. [Google Scholar] [CrossRef]
  17. Nan, Y.; Li, W.; Jin, Z. Slip length of methane flow under shale reservoir conditions: Effect of pore size and pressure. Fuel 2020, 259, 116237. [Google Scholar] [CrossRef]
  18. Zhan, S.; Bao, J.; Wang, X.; Wang, W.; Su, Y.; Zhang, M.; Wang, Y.; Jin, Z. A comparative study of shale oil transport behavior in graphene and kerogen nanopores with various roughness via molecular dynamics simulations. Chem. Eng. J. 2024, 498, 155173. [Google Scholar] [CrossRef]
  19. Alipour, P.; Toghraie, D.; Karimipour, A.; Hajian, M. Molecular dynamics simulation of fluid flow passing through a nanochannel: Effects of geometric shape of roughnesses. J. Mol. Liq. 2019, 275, 192–203. [Google Scholar] [CrossRef]
  20. Zhan, S.; Su, Y.; Jin, Z.; Wang, W.; Cai, M.; Li, L.; Hao, Y. Molecular insight into the boundary conditions of water flow in clay nanopores. J. Mol. Liq. 2020, 311, 113292. [Google Scholar] [CrossRef]
  21. Chen, B.; Jiang, H.; Liu, X.; Hu, X. Observation and analysis of water transport through graphene oxide interlamination. J. Phys. Chem. C 2017, 121, 1321–1328. [Google Scholar] [CrossRef]
  22. Sun, Z.; Wu, K.; Shi, J.; Zhang, T.; Feng, D.; Wang, S.; Liu, W.; Mao, S.; Li, X. Effect of pore geometry on nanoconfined water transport behavior. AIChE J. 2019, 65, e16613. [Google Scholar] [CrossRef]
  23. Wu, K.; Chen, Z.; Xu, J.; Hu, Y.; Li, J.; Dong, X.; Liu, Y.; Chen, M. A universal model of water flow through nanopores in unconventional reservoirs: Relationships between slip, wettability and viscosity. In Proceedings of the SPE Annual Technical Conference and Exhibition, Dubai, United Arab Emirates, 26–28 September 2016; p. D021S027R009. [Google Scholar]
  24. Yu, H.; Fan, J.; Xia, J.; Liu, H.; Wu, H. Multiscale gas transport behavior in heterogeneous shale matrix consisting of organic and inorganic nanopores. J. Nat. Gas Sci. Eng. 2020, 75, 103139. [Google Scholar] [CrossRef]
  25. Yang, J.; Hatcherian, J.; Hackley, P.C.; Pomerantz, A.E. Nanoscale geochemical and geomechanical characterization of organic matter in shale. Nat. Commun. 2017, 8, 2179. [Google Scholar] [CrossRef]
  26. Wang, H.; He, Z.; Zhang, Y.; Bao, H.; Su, K.; Shu, Z.; Zhao, C.; Wang, R.; Wang, T. Dissolution of marine shales and its influence on reservoir properties in the Jiaoshiba area, Sichuan Basin, China. Mar. Pet. Geol. 2019, 102, 292–304. [Google Scholar] [CrossRef]
  27. Ross, D.J.; Bustin, R.M. The importance of shale composition and pore structure upon gas storage potential of shale gas reservoirs. Mar. Pet. Geol. 2009, 26, 916–927. [Google Scholar] [CrossRef]
  28. Liu, K.; Ostadhassan, M. Microstructural and geomechanical analysis of Bakken shale at nanoscale. J. Pet. Sci. Eng. 2017, 153, 133–144. [Google Scholar] [CrossRef]
  29. Gupta, I.; Rai, C.; Sondergeld, C.; Devegowda, D. Rock typing in eagle ford, barnett, and woodford formations. SPE Reserv. Eval. Eng. 2018, 21, 654–670. [Google Scholar] [CrossRef]
  30. Liu, K.; Ostadhassan, M.; Zhou, J.; Gentzis, T.; Rezaee, R. Nanoscale pore structure characterization of the Bakken shale in the USA. Fuel 2017, 209, 567–578. [Google Scholar] [CrossRef]
  31. Deng, Y.; Wu, Q.; Li, Z.; Huang, X.; Rao, S.; Liang, Y.; Lu, H. Crystal face dependent wettability of α-quartz: Elucidation by time-of-flight secondary ion mass spectrometry techniques combined with molecular dynamics. J. Colloid Interface Sci. 2022, 607, 1699–1708. [Google Scholar] [CrossRef]
  32. Deng, Y.; Li, Z.; Rao, S.; Zheng, H.; Huang, X.; Liu, Q.; Wang, D.; Lu, H. Mechanism for the effects of surface chemical composition and crystal face on the wettability of α-quartz surface. Appl. Surf. Sci. 2023, 633, 157559. [Google Scholar] [CrossRef]
  33. Kobayashi, K.; Firoozabadi, A. Water Film Structure and Wettability of Different Quartz Surfaces: Hydrogen Bonding Across Various Cutting Planes. Langmuir 2024, 40, 4635–4645. [Google Scholar] [CrossRef]
  34. Wu, K.; Chen, Z.; Li, J.; Li, X.; Xu, J.; Dong, X. Wettability effect on nanoconfined water flow. Proc. Natl. Acad. Sci. 2017, 114, 3358–3363. [Google Scholar] [CrossRef] [PubMed]
  35. Ho, T.A.; Papavassiliou, D.V.; Lee, L.L.; Striolo, A. Liquid water can slip on a hydrophilic surface. Proc. Natl. Acad. Sci. 2011, 108, 16170–16175. [Google Scholar] [CrossRef] [PubMed]
  36. Afsharpoor, A.; Javadpour, F. Liquid slip flow in a network of shale noncircular nanopores. Fuel 2016, 180, 580–590. [Google Scholar] [CrossRef]
  37. Wang, H.; Su, Y.; Wang, W.; Sheng, G.; Li, H.; Zafar, A. Enhanced water flow and apparent viscosity model considering wettability and shape effects. Fuel 2019, 253, 1351–1360. [Google Scholar] [CrossRef]
  38. Wang, H.; Su, Y.; Wang, W.; Sheng, G. Hydrodynamic resistance model of oil flow in nanopores coupling oil–wall molecular interactions and the pore-throat structures effect. Chem. Eng. Sci. 2019, 209, 115166. [Google Scholar] [CrossRef]
  39. Fang, C.; Sun, S.; Qiao, R. Structure, thermodynamics, and dynamics of thin brine films in oil–brine–rock systems. Langmuir 2019, 35, 10341–10353. [Google Scholar] [CrossRef]
  40. Schlegel, M.L.; Nagy, K.L.; Fenter, P.; Sturchio, N.C. Structures of quartz (100)-and (101)-water interfaces determined by x-ray reflectivity and atomic force microscopy of natural growth surfaces. Geochim. et Cosmochim. Acta 2002, 66, 3037–3054. [Google Scholar] [CrossRef]
  41. Skelton, A.; Wesolowski, D.J.; Cummings, P.T. Investigating the quartz (1010)/water interface using classical and ab initio molecular dynamics. Langmuir 2011, 27, 8700–8709. [Google Scholar] [CrossRef]
  42. Skelton, A.; Fenter, P.; Kubicki, J.D.; Wesolowski, D.J.; Cummings, P.T. Simulations of the quartz (1011)/water interface: A comparison of classical force fields, ab initio molecular dynamics, and X-ray reflectivity experiments. J. Phys. Chem. C 2011, 115, 2076–2088. [Google Scholar] [CrossRef]
  43. Sun, C.; Zhou, R.; Zhao, Z.; Bai, B. Unveiling the hydroxyl-dependent viscosity of water in graphene oxide nanochannels via molecular dynamics simulations. Chem. Phys. Lett. 2021, 778, 138808. [Google Scholar] [CrossRef]
  44. Plimpton, S. Fast parallel algorithms for short-range molecular dynamics. J. Comput. Phys. 1995, 117, 1–19. [Google Scholar] [CrossRef]
  45. Humphrey, W.; Dalke, A.; Schulten, K. VMD: Visual molecular dynamics. J. Mol. Graph. 1996, 14, 33–38. [Google Scholar] [CrossRef]
  46. Wang, S.; Javadpour, F.; Feng, Q. Molecular dynamics simulations of oil transport through inorganic nanopores in shale. Fuel 2016, 171, 74–86. [Google Scholar] [CrossRef]
  47. Xu, J.; Zhan, S.; Wang, W.; Su, Y.; Wang, H. Molecular dynamics simulations of two-phase flow of n-alkanes with water in quartz nanopores. Chem. Eng. J. 2022, 430, 132800. [Google Scholar] [CrossRef]
  48. Wright, L.B.; Walsh, T.R. Facet selectivity of binding on quartz surfaces: Free energy calculations of amino-acid analogue adsorption. J. Phys. Chem. C 2012, 116, 2933–2945. [Google Scholar] [CrossRef]
  49. Koretsky, C.M.; Sverjensky, D.A.; Sahai, N. A model of surface site types on oxide and silicate minerals based on crystal chemistry; implications for site types and densities, multi-site adsorption, surface infrared spectroscopy, and dissolution kinetics. Am. J. Sci. 1998, 298, 349–438. [Google Scholar] [CrossRef]
  50. Le, T.; Striolo, A.; Cole, D.R. Propane simulated in silica pores: Adsorption isotherms, molecular structure, and mobility. Chem. Eng. Sci. 2015, 121, 292–299. [Google Scholar] [CrossRef]
  51. Cygan, R.T.; Liang, J.-J.; Kalinichev, A.G. Molecular models of hydroxide, oxyhydroxide, and clay phases and the development of a general force field. J. Phys. Chem. B 2004, 108, 1255–1266. [Google Scholar] [CrossRef]
  52. Neek-Amal, M.; Peeters, F.M.; Grigorieva, I.V.; Geim, A.K. Commensurability effects in viscosity of nanoconfined water. ACS Nano 2016, 10, 3685–3692. [Google Scholar] [CrossRef] [PubMed]
  53. Fang, C.; Yin, X.; Qiao, R. Interfacial CO2-mediated nanoscale oil transport: From impediment to enhancement. Phys. Chem. Chem. Phys. 2020, 22, 23057–23063. [Google Scholar]
  54. Thomas, J.A.; McGaughey, A.J. Reassessing fast water transport through carbon nanotubes. Nano Lett. 2008, 8, 2788–2793. [Google Scholar] [CrossRef] [PubMed]
  55. Orsi, M. Comparative assessment of the ELBA coarse-grained model for water. Mol. Phys. 2014, 112, 1566–1576. [Google Scholar] [CrossRef]
  56. Zhan, S.; Su, Y.; Jin, Z.; Wang, W.; Li, L. Effect of water film on oil flow in quartz nanopores from molecular perspectives. Fuel 2020, 262, 116560. [Google Scholar] [CrossRef]
  57. Li, Z.; Yao, J.; Kou, J. Mixture composition effect on hydrocarbon–water transport in shale organic nanochannels. J. Phys. Chem. Lett. 2019, 10, 4291–4296. [Google Scholar] [CrossRef] [PubMed]
  58. Liu, B.; Qi, C.; Zhao, X.; Teng, G.; Zhao, L.; Zheng, H.; Zhan, K.; Shi, J. Nanoscale two-phase flow of methane and water in shale inorganic matrix. J. Phys. Chem. C 2018, 122, 26671–26679. [Google Scholar] [CrossRef]
  59. Falk, K.; Sedlmeier, F.; Joly, L.; Netz, R.R.; Bocquet, L. Ultralow liquid/solid friction in carbon nanotubes: Comprehensive theory for alcohols, alkanes, OMCTS, and water. Langmuir 2012, 28, 14261–14272. [Google Scholar] [CrossRef]
  60. Zhan, S.; Su, Y.; Jin, Z.; Zhang, M.; Wang, W.; Hao, Y.; Li, L. Study of liquid-liquid two-phase flow in hydrophilic nanochannels by molecular simulations and theoretical modeling. Chem. Eng. J. 2020, 395, 125053. [Google Scholar] [CrossRef]
  61. Kucaba-Piętal, A.; Walenta, Z.; Peradzyński, Z. Molecular dynamics computer simulation of water flows in nanochannels. Bull. Pol. Acad. Sci. Tech. Sci. 2009, 57, 55–61. [Google Scholar] [CrossRef]
  62. Lemmon, E.W.; McLinden, M.O.; Friend, D.G. Thermophysical Properties of Fluid Systems by in NIST Chemistry WebBook; NIST Standard Reference Database Number 69; Linstrom, P.J., Mallard, W.G., Eds.; National Institute of Standards and Technology: Gaithersburg, MD, USA; Volume 20899. Available online: http://webbook.nist.gov (accessed on 3 June 2025).
  63. Jin, Z.; Firoozabadi, A. Methane and carbon dioxide adsorption in clay-like slit pores by Monte Carlo simulations. Fluid Phase Equilibria 2013, 360, 456–465. [Google Scholar] [CrossRef]
  64. Botan, A.; Rotenberg, B.; Marry, V.; Turq, P.; Noetinger, B. Hydrodynamics in clay nanopores. J. Phys. Chem. C 2011, 115, 16109–16115. [Google Scholar] [CrossRef]
  65. Hess, B. Determining the shear viscosity of model liquids from molecular dynamics simulations. J. Chem. Phys. 2002, 116, 209–217. [Google Scholar] [CrossRef]
  66. Wu, K.; Chen, Z.; Li, J.; Xu, J.; Wang, K.; Wang, S.; Dong, X.; Zhu, Z.; Peng, Y.; Jia, X. Manipulating the flow of nanoconfined water by temperature stimulation. Angew. Chem. 2018, 130, 8568–8573. [Google Scholar] [CrossRef]
  67. Zhang, Q.; Su, Y.; Wang, W.; Lu, M.; Sheng, G. Apparent permeability for liquid transport in nanopores of shale reservoirs: Coupling flow enhancement and near wall flow. Int. J. Heat Mass Transf. 2017, 115, 224–234. [Google Scholar] [CrossRef]
  68. Wang, H.; Su, Y.; Wang, W.; Li, L.; Sheng, G.; Zhan, S. Relative permeability model of oil-water flow in nanoporous media considering multi-mechanisms. J. Pet. Sci. Eng. 2019, 183, 106361. [Google Scholar] [CrossRef]
  69. Zhang, T.; Li, X.; Sun, Z.; Feng, D.; Miao, Y.; Li, P.; Zhang, Z. An analytical model for relative permeability in water-wet nanoporous media. Chem. Eng. Sci. 2017, 174, 1–12. [Google Scholar] [CrossRef]
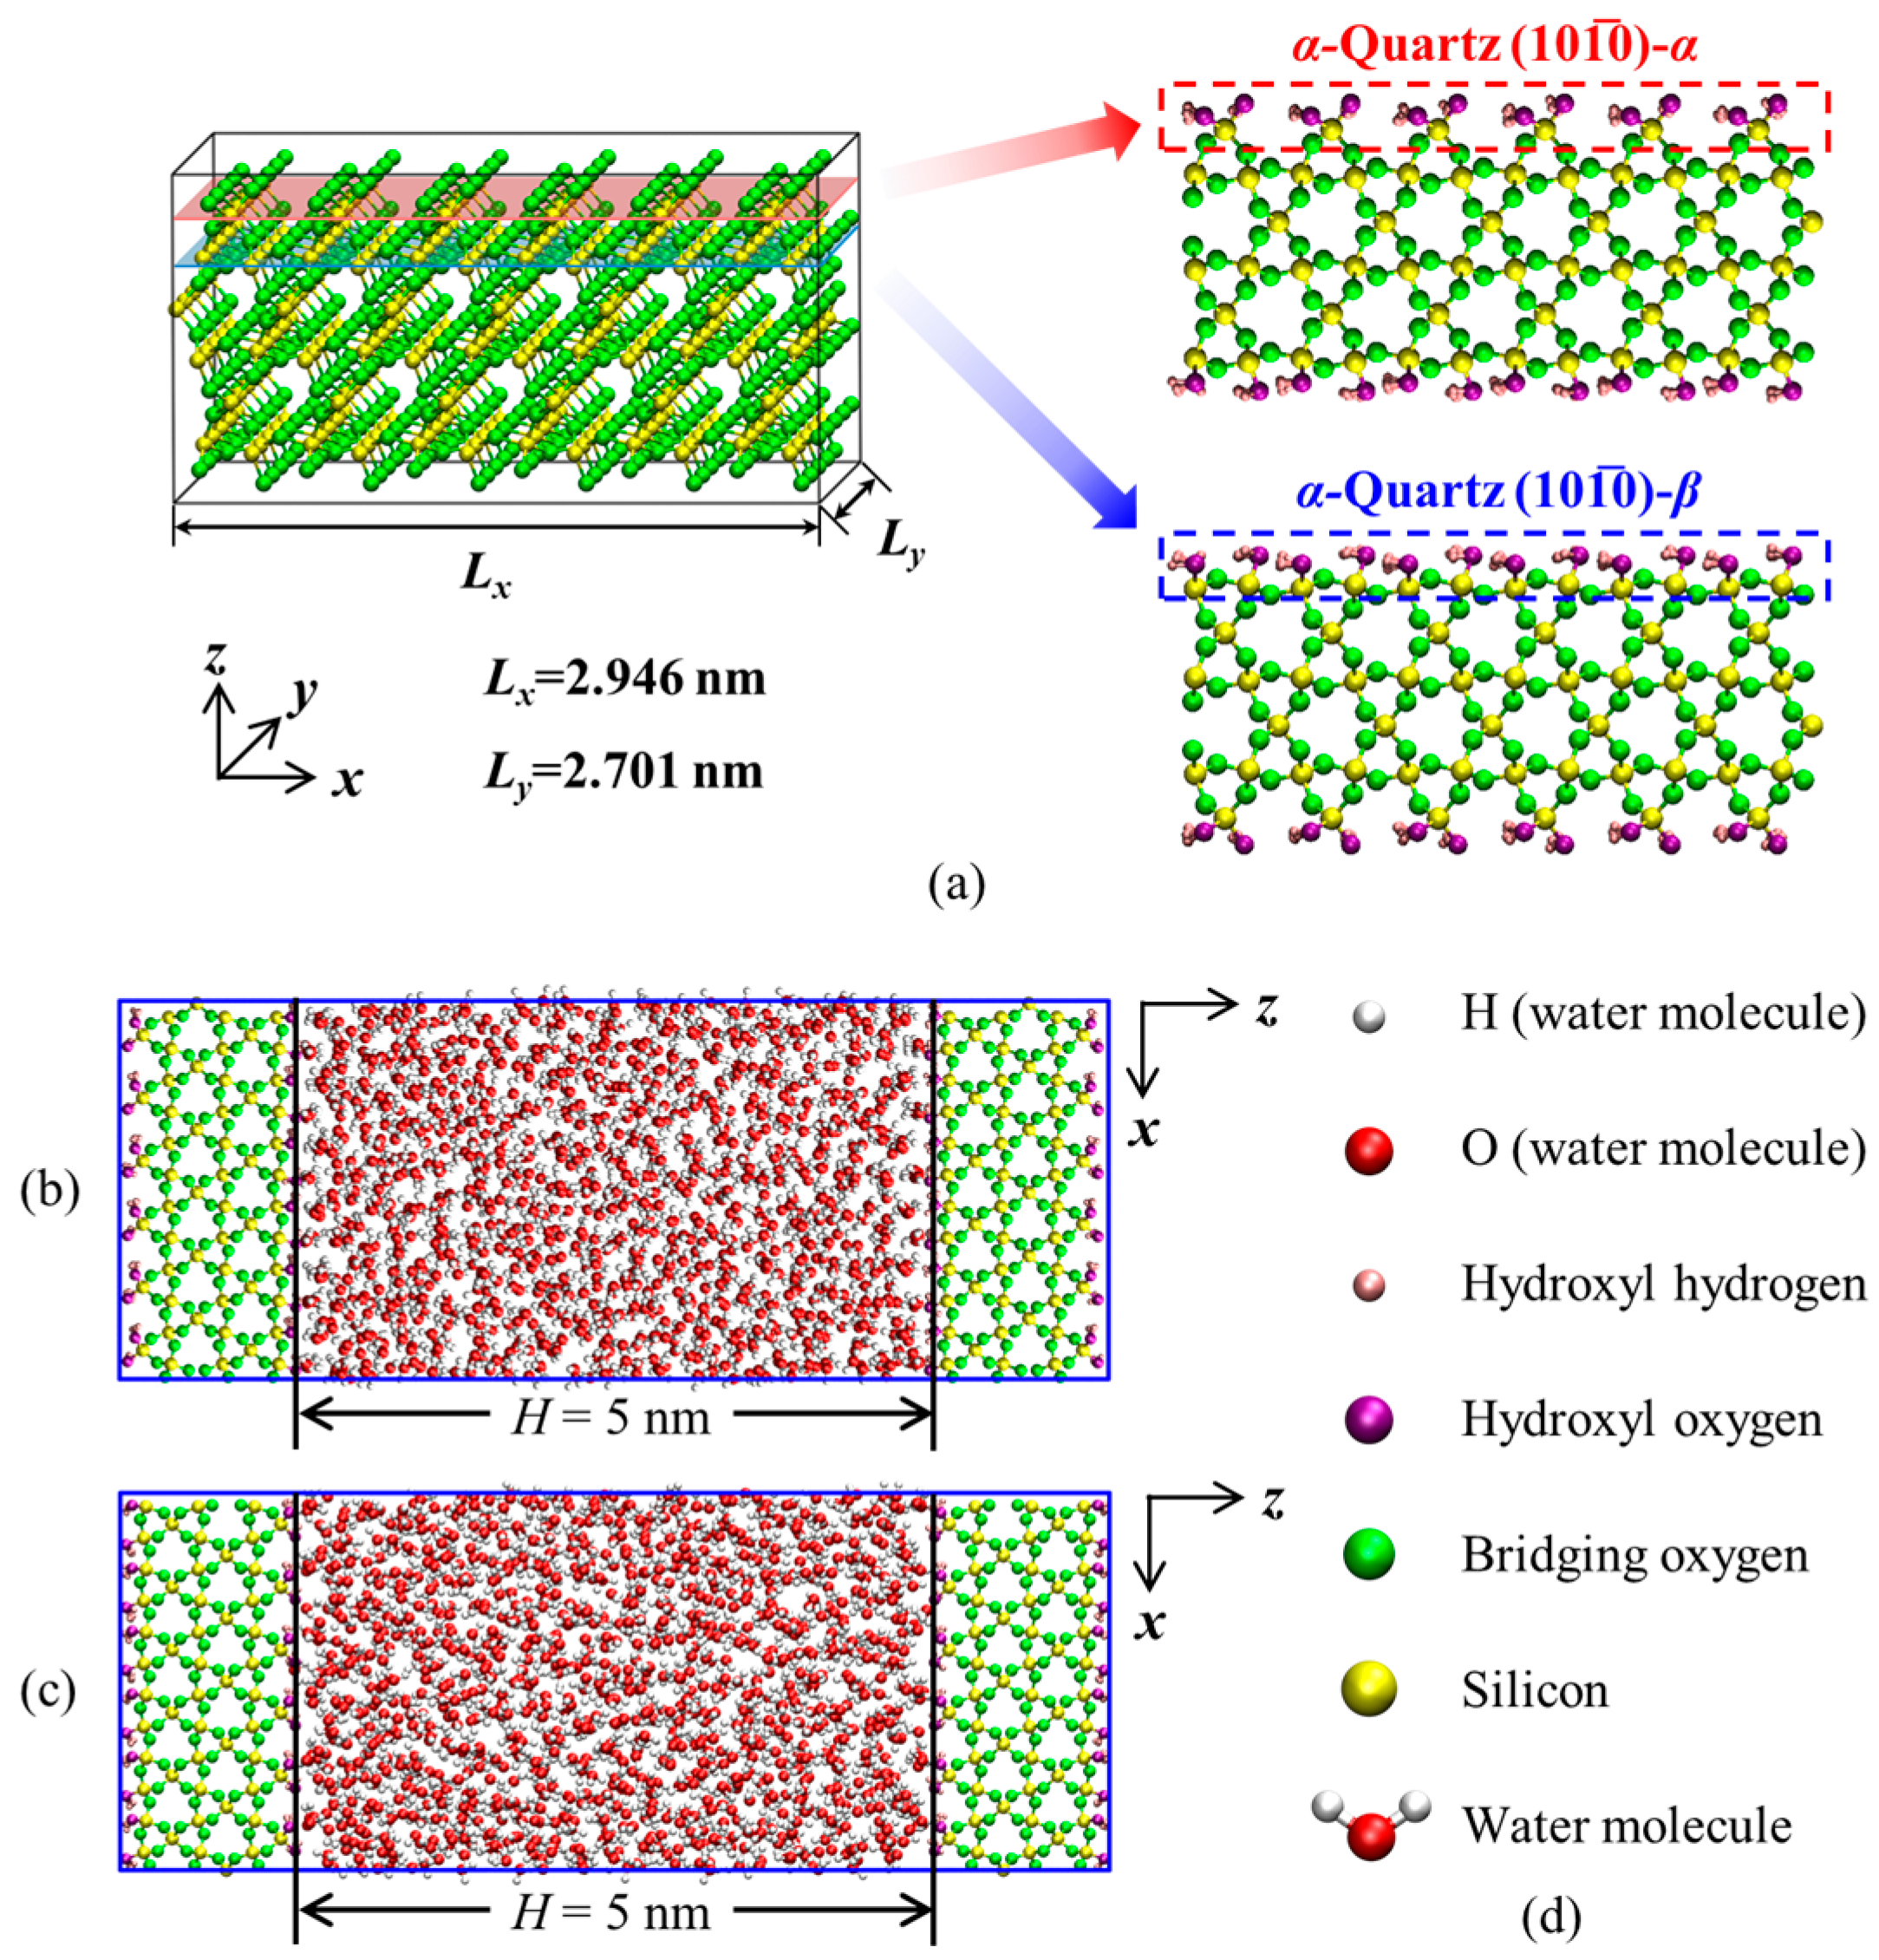
Figure 1. (a) The two different terminations of the α-quartz ( 10 1 ¯ 0 ) surface. Snapshots of simulation systems with two different terminations as (b) ( 10 1 ¯ 0 ) - α ; (c) ( 10 1 ¯ 0 ) - β . H is the separation distance between the most inner hydroxyl oxygen atoms in the two quartz sheets. (d) Ball-and-stick model; white, red, pink, purple, green, and yellow spheres represent the hydroxyl SPC water model, H (water molecule), O (water molecule), hydroxyl H, hydroxyl O, bridging O, and Si, respectively.
Nanomaterials 15 00896 g001
Figure 2. The density distribution ρw and orientation characteristics of water Sz,w,i at the two quartz surfaces: (a) ( 10 1 ¯ 0 ) - α ; (b) ( 10 1 ¯ 0 ) - β ; (c) the region when −3.0 nm < z < 1.5 nm of ( 10 1 ¯ 0 ) - α ; (d) the region when 3.0 nm < z < 1.5 nm of ( 10 1 ¯ 0 ) - β .
Nanomaterials 15 00896 g002
Figure 3. Snapshots of the water molecules near the two quartz surfaces: (a) ( 10 1 ¯ 0 ) - α ; (b) ( 10 1 ¯ 0 ) - β . The labels of x, y and z in the images mean the direction.
Nanomaterials 15 00896 g003
Figure 4. The density distribution ρw and the velocity profiles vx,w,i of water confined at the two quartz surfaces under various pressure gradients, (a) ( 10 1 ¯ 0 ) - α and (b) ( 10 1 ¯ 0 ) - β .
Nanomaterials 15 00896 g004
Figure 5. Volume flux of water confined in two quartz nanopores under various pressure gradients and the volume flow deviation (ΔRQ).
Nanomaterials 15 00896 g005
Figure 6. Schematic representation of water flow in quartz nanopores. H is the pore width in the z direction, zmid is the z-coordinate of the middle point in pore space, labs,i is the critical thickness of the adsorbed water region, lnf,i is the critical thickness of the non-flowing water region, and w is the channel width in the y direction.
Nanomaterials 15 00896 g006
Figure 7. The density distribution ρw and the velocity profiles in x-direction vx,w,i(z) of water in two quartz nanopores under 9 MPa/nm by using various labs, values: (a) ( 10 1 ¯ 0 ) - α ; (b) ( 10 1 ¯ 0 ) - β .
Nanomaterials 15 00896 g007
Figure 8. Liquid velocity profiles from the model and MD simulations at various pressure gradients (MPa/nm) for (a) ( 10 1 ¯ 0 ) - α ; (b) ( 10 1 ¯ 0 ) - β .
Nanomaterials 15 00896 g008
Figure 9. The relative errors Δεi of water volume fluxes in two quartz nanopores calculated by the model.
Nanomaterials 15 00896 g009
Disclaimer/Publisher’s Note: The statements, opinions and data contained in all publications are solely those of the individual author(s) and contributor(s) and not of MDPI and/or the editor(s). MDPI and/or the editor(s) disclaim responsibility for any injury to people or property resulting from any ideas, methods, instructions or products referred to in the content.