Article

A TMO-ZnO Heterojunction-Based Sensor for Transformer Defect Detection: A DFT Study

1
Electric Power Research Institute of Yunnan Power Grid, Kunming 650214, China
2
College of Engineering and Technology, Southwest University, Chongqing 400716, China
*
Author to whom correspondence should be addressed.
Nanomaterials 2025, 15(11), 856; https://doi.org/10.3390/nano15110856
Submission received: 10 April 2025 / Revised: 28 May 2025 / Accepted: 31 May 2025 / Published: 3 June 2025
(This article belongs to the Section Nanoelectronics, Nanosensors and Devices)

Abstract

:
The gas adsorption and sensing properties of a transition metal oxide (TMO)-ZnO heterojunction-based sensor for H2, CO, and C2H4 are analyzed. It is found that CuO, Ag2O, and Cu2O stably composite onto the surface of ZnO by forming heterojunctions, which helps to improve the gas sensing and selectivity of the sensor. The adsorption results show that CuO-ZnO shows physical adsorption for H2 and good gas sensing performance for CO and C2H4, while Ag2O-ZnO and Cu2O-ZnO have significant responses for H2, CO, and C2H4. In addition, the introduction of the TMO-ZnO heterojunction structure can effectively avoid the sensor poisoning phenomenon, as the gas adsorption process does not destroy the original geometric configuration of the heterojunction. This study lays a theoretical foundation for preparing TMO-ZnO heterojunction-based sensors for transformer defect detection and energy efficiency analysis.

Graphical Abstract

1. Introduction

Oil-immersed transformers are crucial components that are widely used in power systems [1,2]. With the sharp increase in social electricity consumption, the power system has put forward higher energy efficiency requirements for these numerous transformers [3]. The energy efficiency of transformers is not only affected by the materials (silicon steel, amorphous materials), structure (stacked and rolled core), and production process [4], but also by complex transformer defects during long-term operation, such as impulse discharge, short circuiting between winding, overheating, etc. [5]. Therefore, it is necessary to track and monitor the running status and energy efficiency level of transformers in operation and to gradually eliminate old transformers that do not meet the energy efficiency standards. Studies have shown that dissolved gas analysis in transformer oil has become a convenient and feasible method for monitoring the operating status of transformers, diagnosing transformer defect types, and ensuring the high running efficiency of transformers [6,7].
Metal oxide semiconductor-based gas sensors have attracted widespread attention from researchers around the world due to their high sensitivity, low cost, and fast response time [8,9]. At present, metal oxide gas sensing materials that are extensively studied include ZnO, CuO, Ag2O, Cu2O, etc. [10,11,12,13]. However, single metal oxide gas sensors generally have drawbacks, such as operating temperature requirements, low detection sensitivity, low selectivity, and a long response time. However, when a heterojunction is formed between two different gas sensing materials, the charge transfer caused by the inconsistent Fermi energy levels of the two metal oxides forms a charge depletion layer and potential barrier at the interface of the two different metal oxide semiconductor materials [14]. Combined with the synergistic effect of the small size and high specific surface area of the metal oxide, the gas sensing response characteristics of the metal oxide heterojunction gas sensor are improved [15].
Li et al. successfully prepared a unique graded radial CeO2-ZnO heterostructure with excellent triethylamine gas sensing performance through a feasible solvent thermal method [16]. Yuan et al. proposed a new etching and calcination method to prepare porous ZnO-Co3O4 nanoplates, which exhibit excellent performance in CO detection [17]. Meng et al. successfully synthesized NiO-SnO2 heterojunction micropowders assembled from thin porous nanosheets through a simple one-step hydrothermal route [18]. The study showed that NiO-SnO2 micropowder sensors still exhibit high response characteristics in lower operating temperature regions. Meanwhile, Duoc et al. prepared a highly selective and responsive NO2 gas sensor based on a ZnO-SnO2 heterojunction [19]. Hsu et al. prepared CuO-ZnO heterojunction nanofibers that can be used as gas sensing materials. At the optimal operating temperature, their response to H2S is about 25.79% higher than that of pure ZnO sensors [20].
Based on density functional theory (DFT), this study proposes a metal oxide heterojunction-based gas sensor for dissolved gas in transformer oil detection. The gas sensing mechanism of the metal oxide heterojunction-based gas sensor for H2, CO, and C2H4 has been explored by analyzing the heterojunction model, adsorption structure, adsorption energy, adsorption distance, energy band, charge transfer, density of states (DOS), differential charge density (DCD), and molecular orbitals. This study provides a theoretical foundation for preparing a specific gas sensor for use in transformer defect detection and energy efficiency analysis.

2. Methods

All theoretical calculations are performed based on DFT calculations [21]. The Hirshfeld method was used for atomic charge analysis. The Perdew–Burke–Ernzerhof (PBE) function from the generalized gradient approximation (GGA) was selected to calculate the electron exchange energy and correlation energy [22]. The orbital electrons were calculated using the DFT pseudopotentials method. The Tkatchenko and Scheffler (TS) algorithm was chosen to correct the van der Waals force for more accurate results [23]. The convergence criteria were set according to previous studies [24,25,26]. A 5 × 5 × 1 k point sampling of the Monkhorst Pack scheme to perform was used to deal with the Brillouin zone [27,28]. The supercell model was established by expanding the original cell so that the sizes of the two semiconductors were close to each other to reduce the lattice mismatch. The DFT method was used to calculate the adsorption characteristics of the heterojunction for the dissolved gas in the transformer and the gas sensing potential. We have searched the literature for studies with the same research method in this paper to ensure the consistency of the calculation results with other simulation studies [29,30]. However, there are still some differences between the simulation and experimental data [31,32]. The main reason for this is that the characteristics of the material are affected by the crystal plane.
The formation energy (Eform) of heterojunctions formed by two types of metal oxide semiconductors is defined as Equation (1), where EHeterojunction, Eabove, and Ebelow represent the total energy of the heterostructure, the energy of the upper metal oxide, and the energy of the lower metal oxide, respectively. The adsorption energy (Eads) of target gas molecules on a heterojunction model is defined as Equation (2), where Egas/Heterojunction, EHeterojection, and Egas represent the total energy of gas molecules adsorbed by the heterojunction model, the total energy of the heterojunction structure, and the energy of the gas molecules, respectively. The charge transfer (Qt) between gas molecules and heterojunctions is defined as Equation (3), where Qa and Qb, respectively, represent the net charges carried by gas molecules after adsorption and the net charges carried by gas molecules themselves before adsorption. Based on the frontier orbital theory, the energy gap (Eg) of molecular orbitals is defined as Equation (4), where ELUMO and EHOMO represent the energy of the lowest unoccupied molecular orbital (LUMO) and the highest occupied molecular orbital (HOMO) of the entire heterojunction, respectively. The relationship between Eg and electronic conductivity (σ) can be expressed by Equation (5), where KB is the Boltzmann constant (8.62 × 10⁻⁵ eV/K) and T denotes temperature. It can be seen from Equation (5) that when Eg decreases, the electron conductivity will increase accordingly, and vice versa. Equations (1)–(5) are as follows:
Eform = EHeterojunctionEaboveEbelow
Eads = Egas/HeterojunctionEHeterojunctionEgas
Qt = QaQb
Eg = |ELUMOEHOMO|
σ∝e(−Eg/2KBT)

3. Results and Discussion

3.1. Gas Sensing Properties of the CuO-ZnO Heterojunction for H2, CO, and C2H4

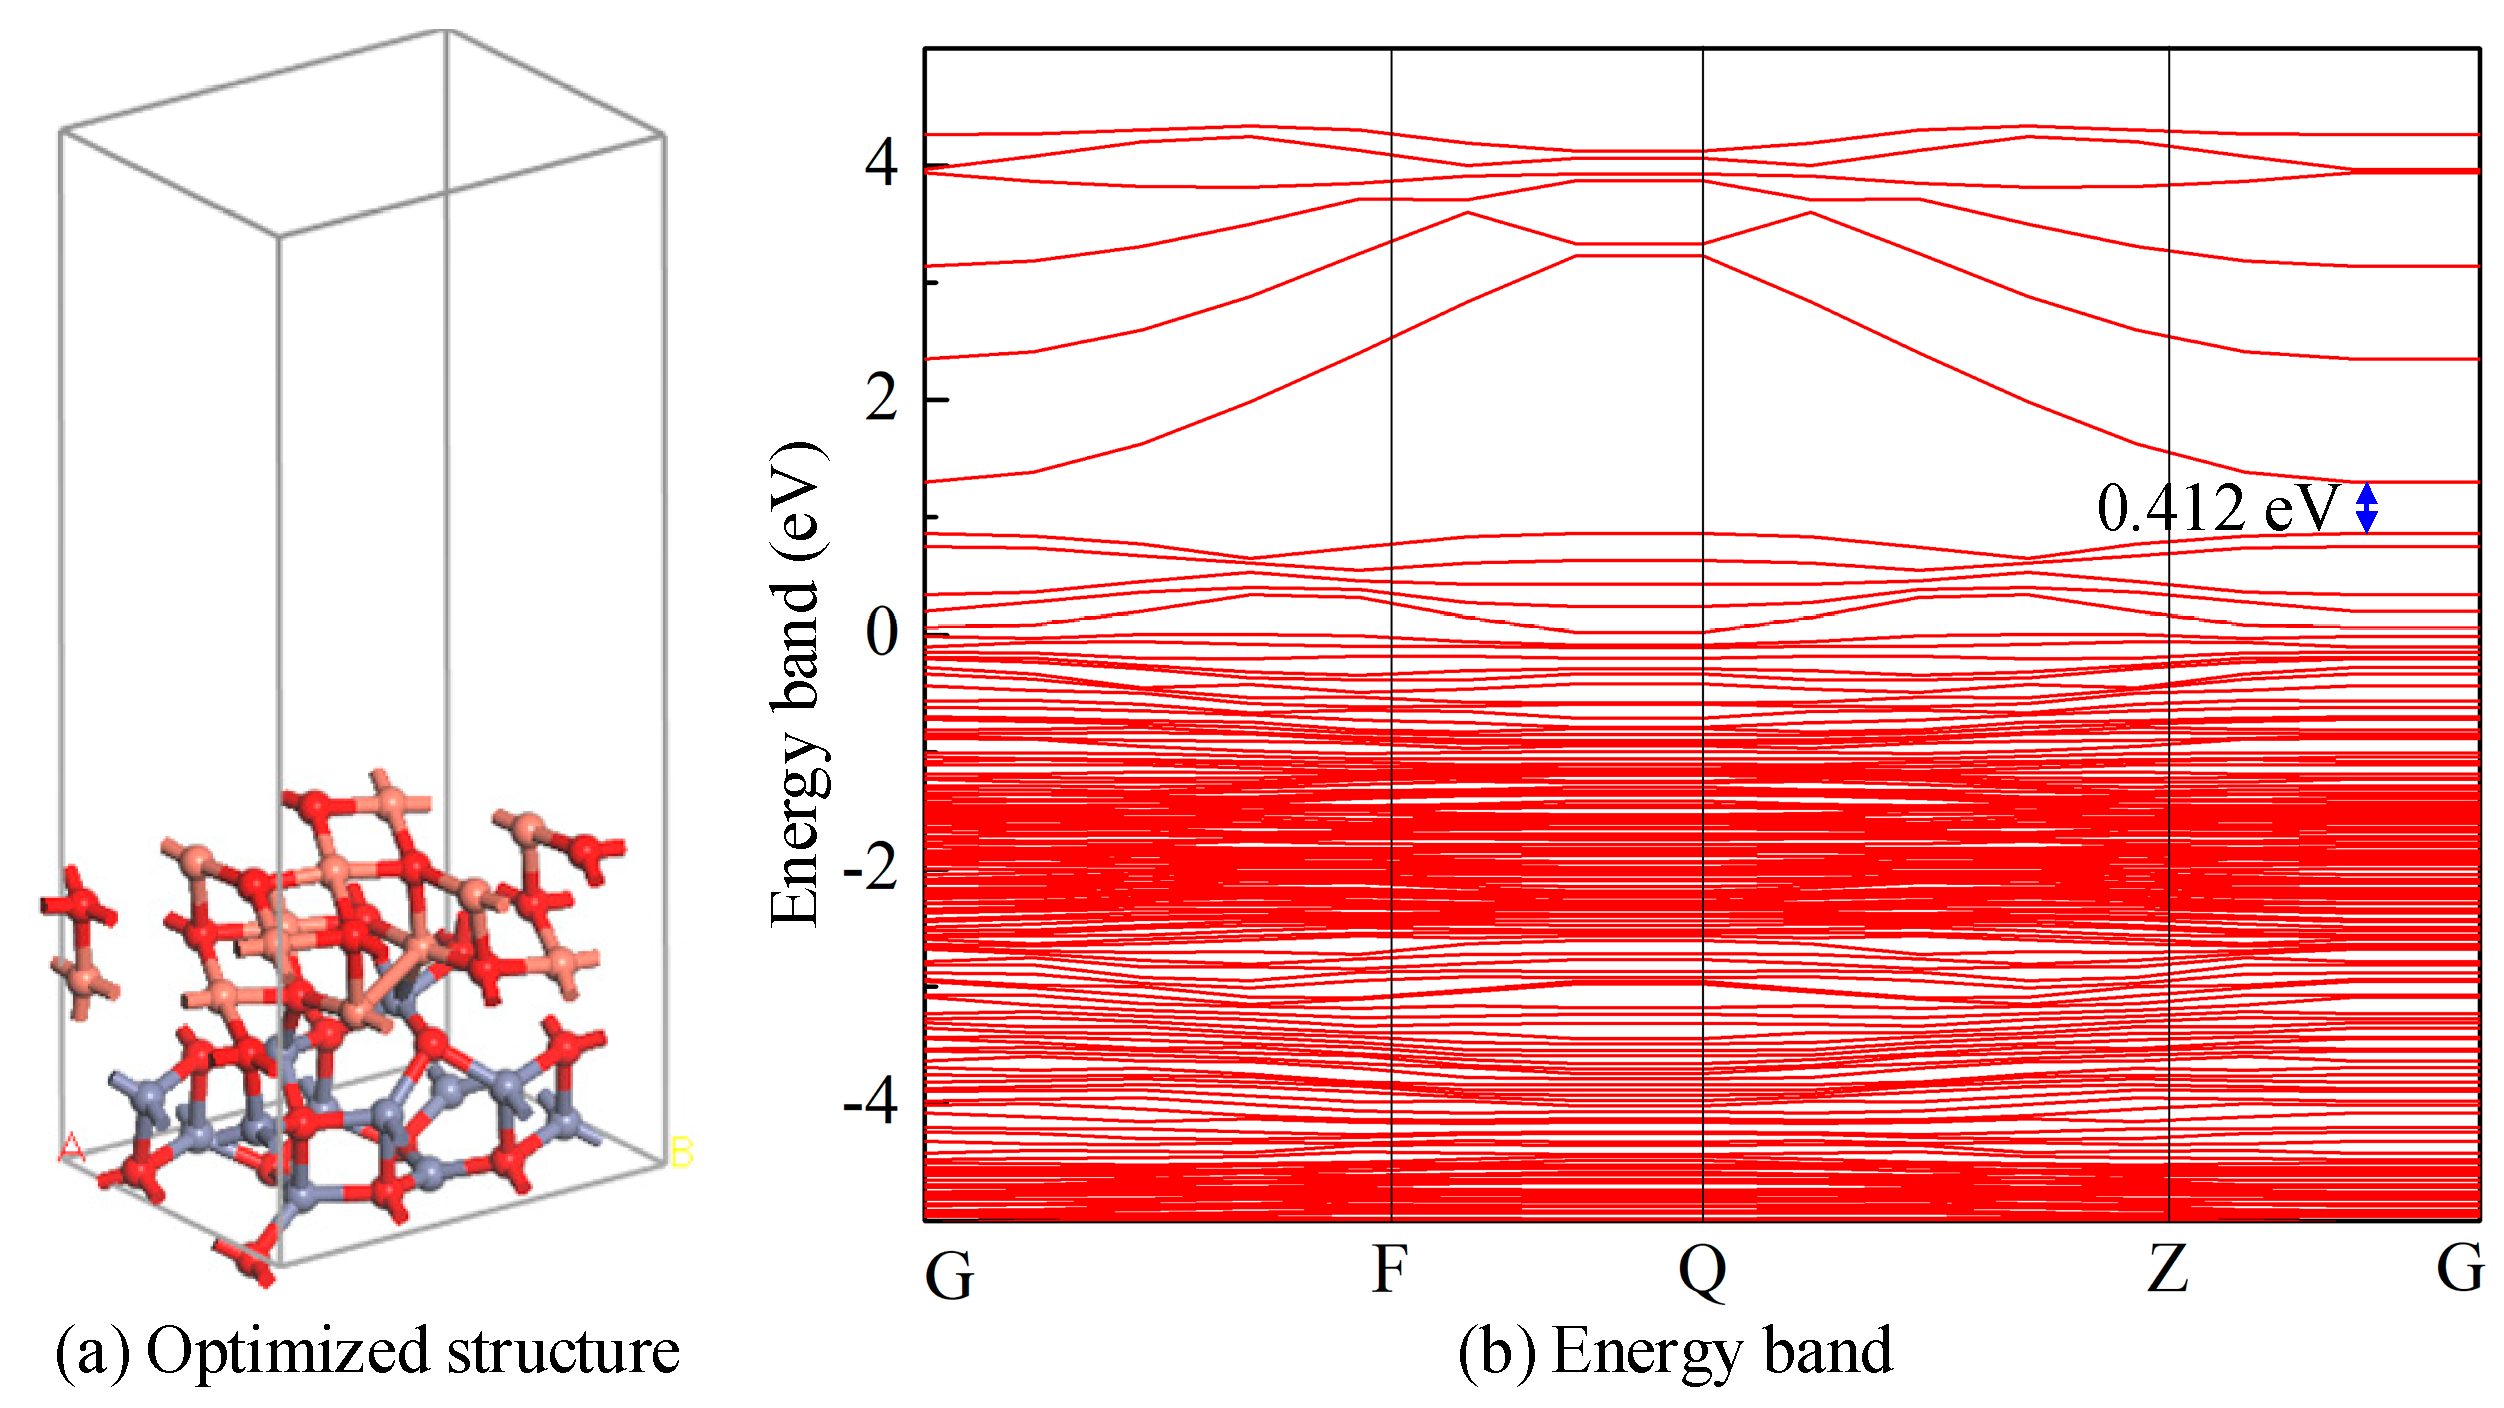
3.1.1. Structure and Electronic Analysis of the CuO-ZnO Heterojunction

A 3 × 2 × 1 CuO-ZnO two-layer heterojunction was constructed, where CuO serves as the upper layer metal oxide, while ZnO serves as the lower layer-based metal oxide. The lattice mismatch of the CuO-ZnO heterojunction is within a 5%. Geometric optimization is performed on the constructed CuO-ZnO heterojunction model, and the most stable structure is obtained after convergence, as shown in Figure 1a. The lattice constants of the CuO-ZnO heterojunction are a = 9.5217 Å, b = 6.3451 Å, and c = 28.9218 Å; γ = 117.8359°, containing 48 atoms. Multiple chemical bonds form between CuO and ZnO metal oxides, with bond lengths ranging from 2.088 Å to 2.706 Å. Meanwhile, the formation energy of the CuO-ZnO heterojunction model is calculated to be −3.513 eV. The energy band of the optimized CuO-ZnO metal oxide heterojunction is shown in Figure 1b. It can be observed that the bandgap width of the CuO-ZnO heterojunction is 0.412 eV. Compared with the bandgap of CuO and ZnO, the energy band of the CuO-ZnO heterojunction becomes significantly denser, and the bandgap width is significantly narrower than that of CuO and ZnO. Therefore, the conductivity of the CuO and ZnO heterojunction increases significantly.

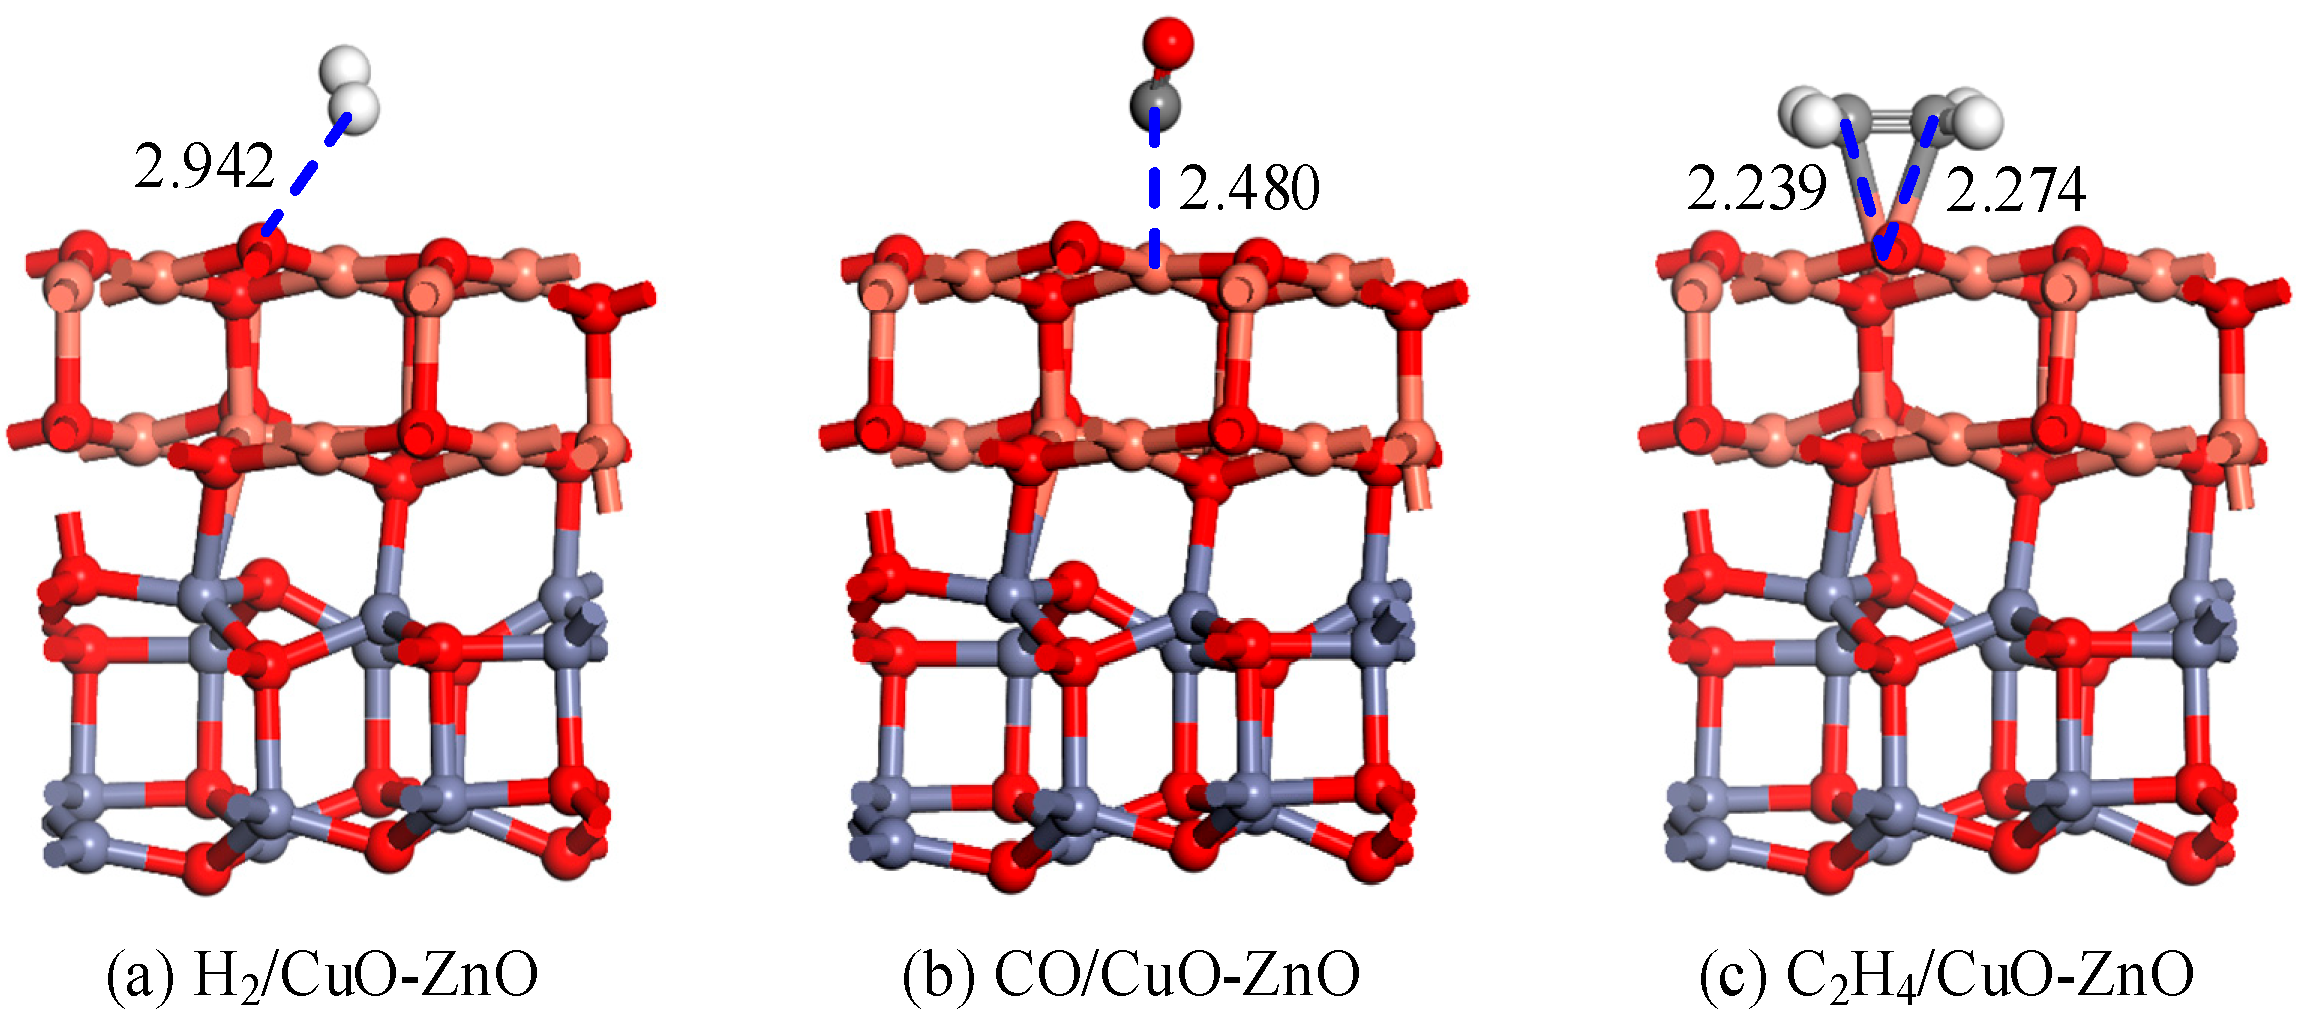
3.1.2. Structure and DCD Analysis of the Gas/CuO-ZnO Heterojunction System

To obtain the most stable gas adsorption structure, the geometric optimization of the established model was carried out by considering a variety of H2, CO, and C2H4 gas molecules approaching the CuO-ZnO heterojunction. Models with horizontal proximity, vertical proximity, and different angles of inclination were considered. When searching for the most stable adsorption models of CO and C2H4, the models of different atomic proximities were also considered. Figure 2 shows the most stable adsorption structure of gas molecules adsorbed on CuO-ZnO heterojunction. In the geometric optimization process involving molecular adsorption, the entire heterostructure was relaxed. For comparison, the adsorption parameters of CuO, ZnO, and CuO-ZnO heterojunction for H2, CO, and C2H4 were calculated, as shown in Table 1. The adsorption energies of the CuO-ZnO heterojunction for H2, CO, and C2H4 gas molecules are ranked as follows in descending order: C2H4 (−0.922 eV) > CO (−0.292 eV) > H2 (−0.161 eV). All adsorption energies were negative, indicating that the adsorption process is an exothermic reaction. Compared with the adsorption of the intrinsic metal oxides CuO and ZnO, the adsorption energy of the CuO-ZnO heterojunction for gas molecules increased to varying degrees compared to CuO and decreased to varying degrees compared to ZnO. For H2 adsorption, the H atom is close to the O atom on the surface of the CuO-ZnO heterojunction, with an adsorption distance of 2.942 Å. For CO adsorption, the C atom in the gas molecule is close to the Cu atom on the heterojunction surface, with an adsorption distance of 2.942 Å. For the adsorption of C2H4, both C atoms in the gas molecule are close to the surface Cu atoms and form two Cu-C bonds with bond lengths of 2.239 Å and 2.274 Å, respectively. Compared with intrinsic CuO adsorption, the heterojunctions have a certain degree of shortened adsorption distance for all three gas molecules. Compared with the intrinsic adsorption of ZnO, the heterojunction not only shortens the adsorption distance of C2H4, but also increases the adsorption distance of the other two gases to a certain extent. Meanwhile, there is no significant change in the structure of the heterojunction before and after gas molecule adsorption, indicating that the CuO-ZnO heterojunction has strong chemical stability.
To analyze the electron transfer during the adsorption process of gas molecules, the DCD of H2-, CO-, and C2H4-adsorbed CuO-ZnO heterojunction systems were calculated. The corresponding DCDs of the three adsorption systems are shown in Figure 3. The red area in the figure indicates a decrease in electron density, while the blue area indicates an increase in electron density. As shown in Figure 3a, after the CuO-ZnO heterojunction adsorbs H2, there is no significant color change around the gas molecules. H2 only transferred 0.011 e of electrons to the surface of the heterojunction, indicating that the charge transfer phenomenon between the gas molecules and the heterojunction surface is very weak during the adsorption process. As shown in Figure 3b, the blue color around the O atom after CO adsorption on the surface indicates that it has obtained electrons, thereby increasing the electron density in this region. On the contrary, the appearance of red around the C atom indicates that it provides electrons as an electron donor, thereby reducing the electron density in that region. The adsorption results in the transfer of 0.090 e electrons from CO to the heterojunction surface. Similarly, as shown in Figure 3c, the C atom in C2H4 is surrounded by blue to show that it is obtaining electrons, while the H atom is surrounded by red to indicate that it is losing electrons. Charge distribution analysis shows that C2H4 transferred 0.326 e electrons to the heterojunction surface. From the above DCD analysis, it can be observed that the two Cu and Zn metal atoms of the CuO-ZnO heterojunction are always surrounded by a red color, indicating that they always act as electron donors, while the O atom is always surrounded by a blue color, indicating that it always acts as an electron acceptor. From the adsorption structure and DCD analysis discussed above, it can be seen that H2 has a long adsorption distance, low adsorption energy, and low electron transfer on the CuO-ZnO heterojunction, indicating a weak physical adsorption. For the adsorption of C2H4, the formation of chemical bonds, high adsorption energy, and intense electron transfer phenomena indicate that it is a highly interacting chemical adsorption.

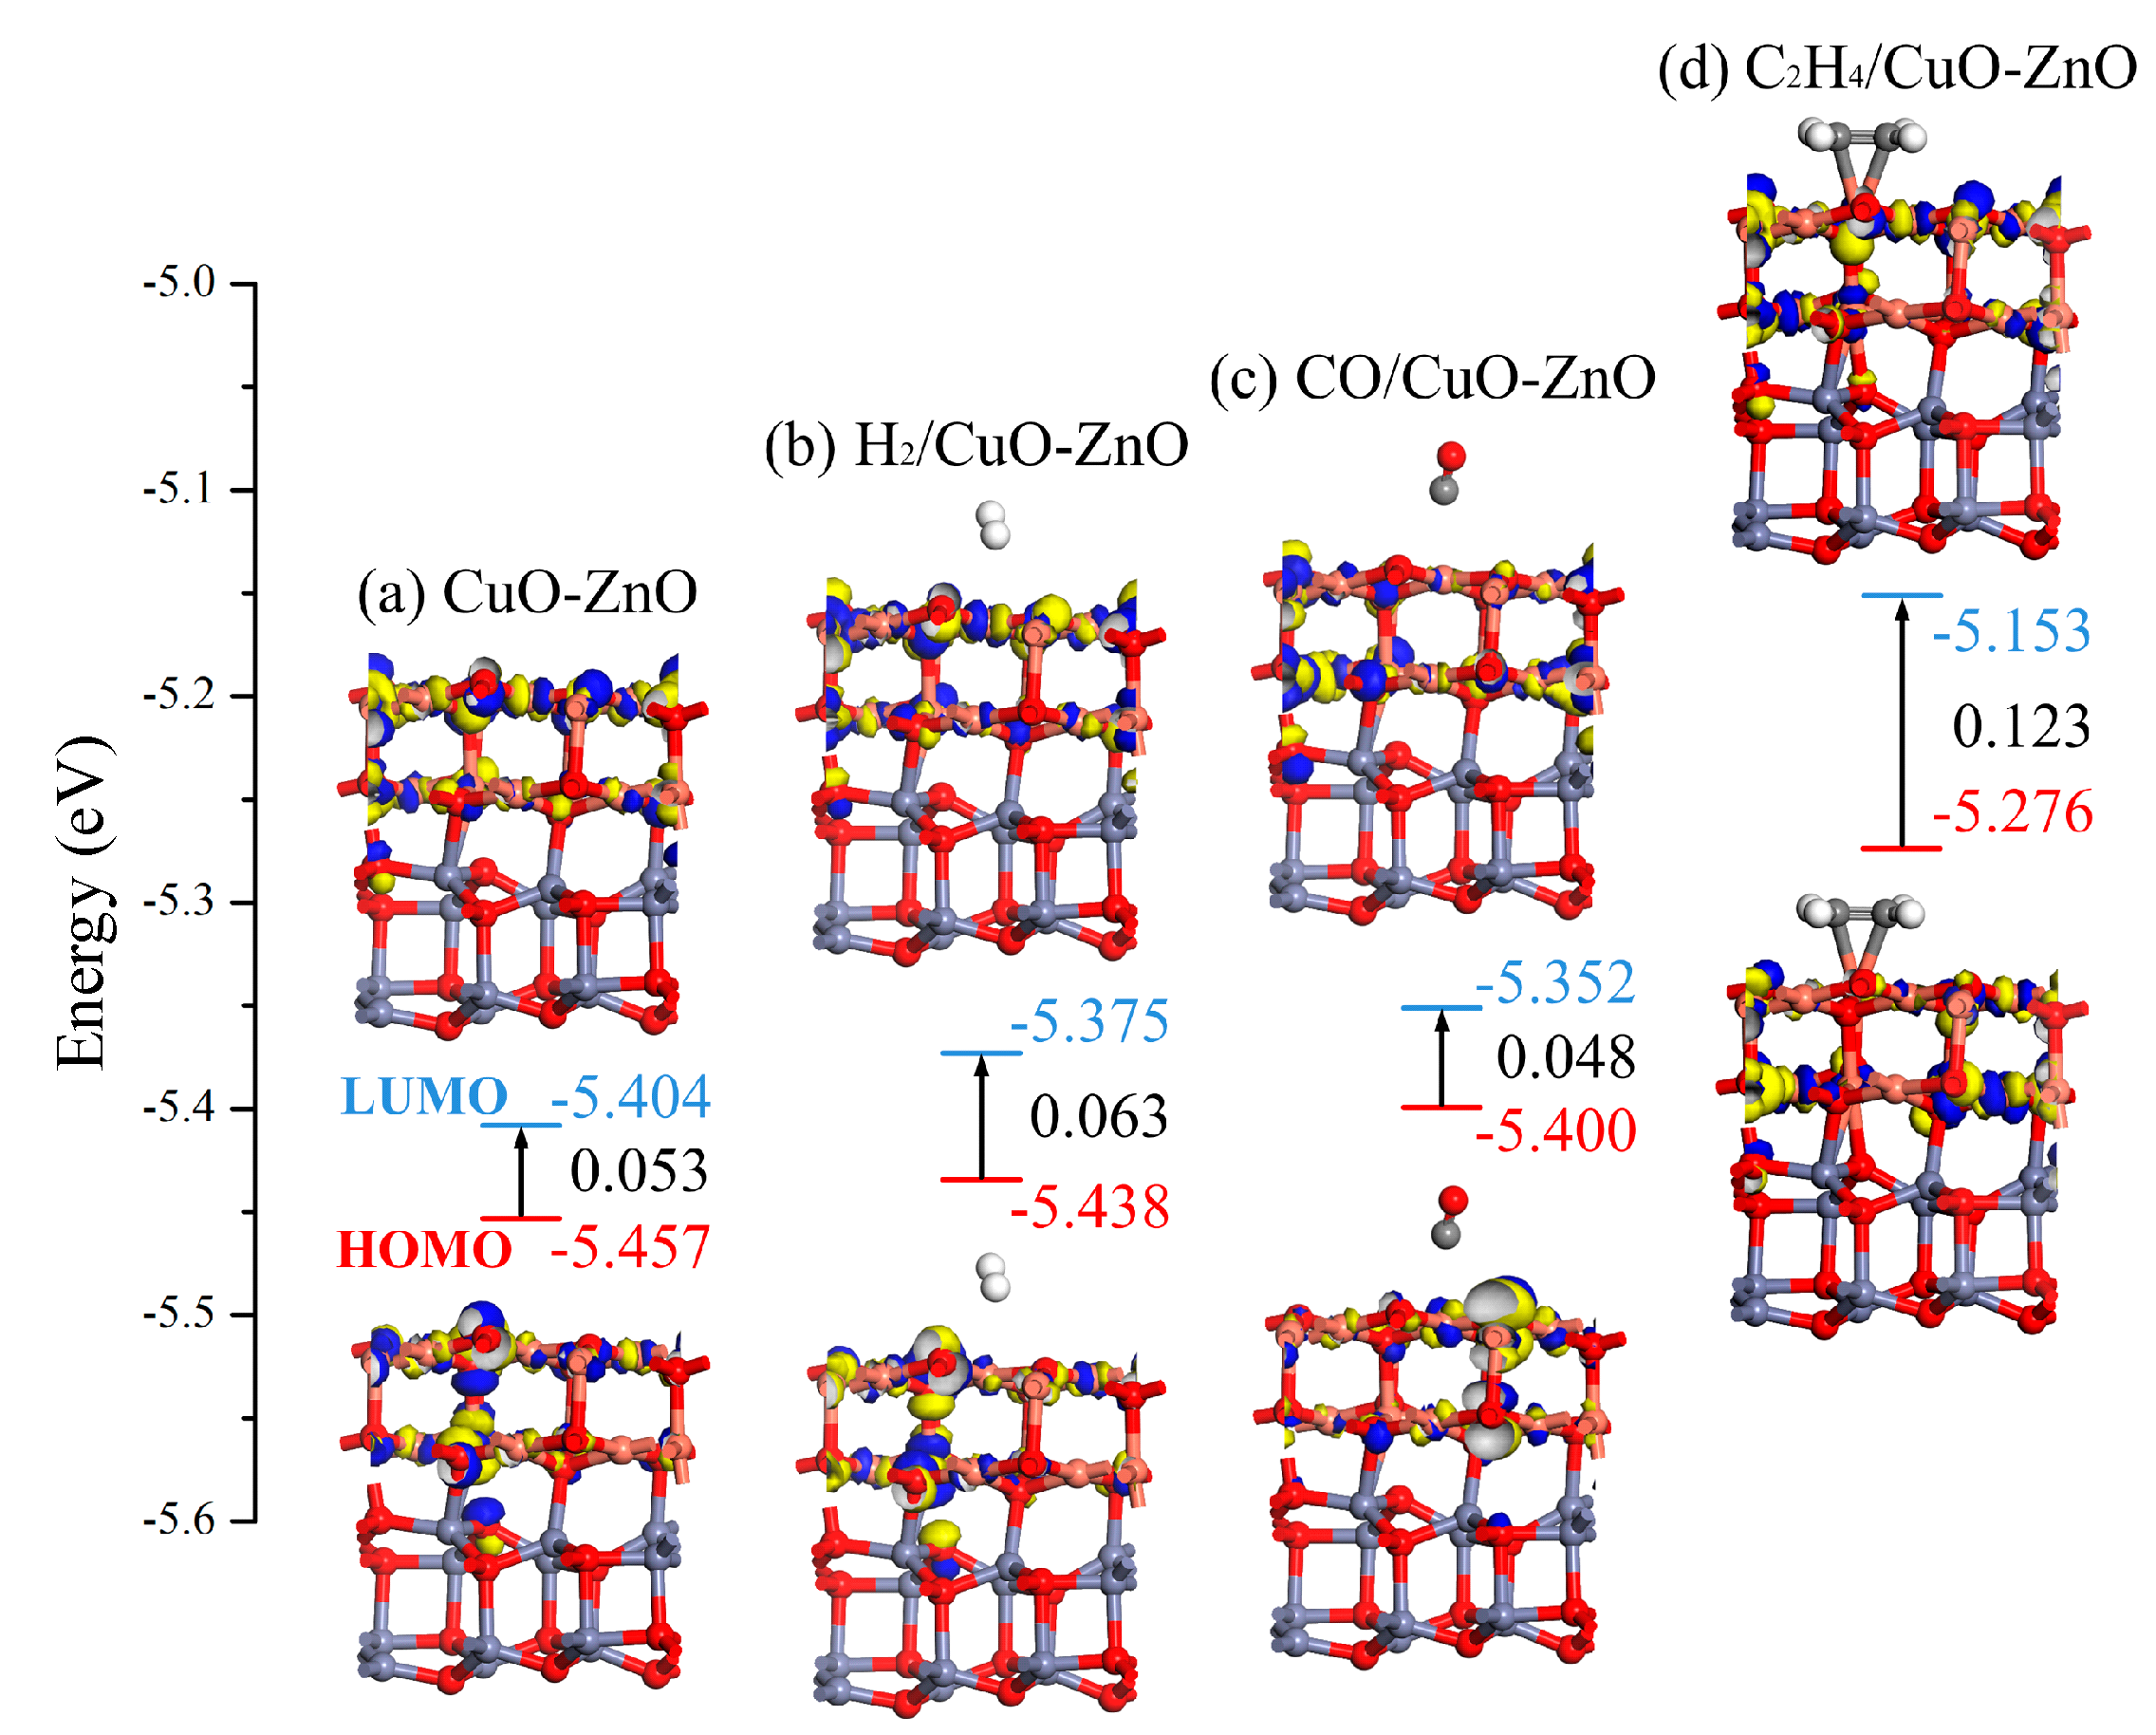
3.1.3. DOS and Molecular Orbital Analysis of the Gas/CuO-ZnO Heterojunction System

To further investigate the adsorption mechanism of CuO-ZnO heterojunctions on different target gases, the total density of states (TDOS) and partial density of states (PDOS) of all adsorption systems were analyzed, and the corresponding results are shown in Figure 4. The position of the Fermi level is near the dotted line in Figure 4. By observing the changes in the TDOS of the adsorption system near the Fermi level, the influence of gas adsorption on the conductivity of heterojunctions can be determined. It can be observed that there is no significant change in the TDOS of the adsorption system after H2 adsorbs on the surface of the heterojunction compared with that before gas adsorption, indicating that the influence of H2 on the conductivity of the CuO-ZnO heterojunction is minimal. For CO adsorption, the TDOS of the adsorption system near the Fermi level decreases, while it shows a significant increase for C2H4 adsorption, reflecting a certain degree of increase in the conductivity of the former adsorption system and a significant decrease in the conductivity of the latter. The reason for the changes in TDOS is due to the redistribution of electrons caused by the interaction between gas molecules and heterojunctions during the adsorption process. For H2 adsorption, the hybridization phenomenon between atomic orbitals is weak, and mainly occurs near the −5 eV level that far from the Fermi level. Therefore, its impact on TDOS and conductivity is minimal. Upon CO adsorption, the peaks of the atomic orbitals Cu-4s and Cu-3d of the C-2p, O-2p, and Cu atoms overlap at the −7 eV, −5 eV, −1 eV, and 3 eV energy levels, respectively, resulting in changes in the TDOS and affecting conductivity. For the adsorption of C2H4, the PDOS of the adsorption system shows that strong orbital hybridization occurs between atomic orbitals in the energy level range of −8 eV to 3 eV. The strong atomic interaction corresponds to the formation of Cu-C chemical bonds in the system, causing significant changes in the corresponding TDOS.
From a molecular orbital perspective, the interaction mechanism between gas molecules and heterojunction surfaces was studied, and the changes in system conductivity during the reaction process were evaluated. Figure 5 shows the distribution of conductivity and LUMO before and after gas adsorption on the CuO-ZnO heterojunction. The corresponding values of ELUMO, EHOMO, and Eg for each system are marked in the figure. It can be observed that the adsorption systems of CO and C2H4 lead to a significant change in the distribution of HOMO and LUMO compared to the CuO-ZnO heterojunction without gas adsorption. Meanwhile, it can be observed that H2 has little effect on the distribution of the heterojunction’s HOMO and LUMO. Without gas adsorption, the Eg of the CuO-ZnO heterojunction is 0.053 eV. Compared with the system after gas adsorption, except for the CO adsorption system where the Eg value decreases to 0.048 eV, the Eg values of H2 and C2H4 adsorption systems increase. Especially for the adsorption of C2H4, the Eg value of the adsorption system increases to 0.123 eV, reflecting a certain degree of decrease in conductivity. The above molecular orbital analysis is consistent with the DOS analysis results.

3.2. Gas Sensing Properties of the Ag2O-ZnO Heterojunction for H2, CO, and C2H4

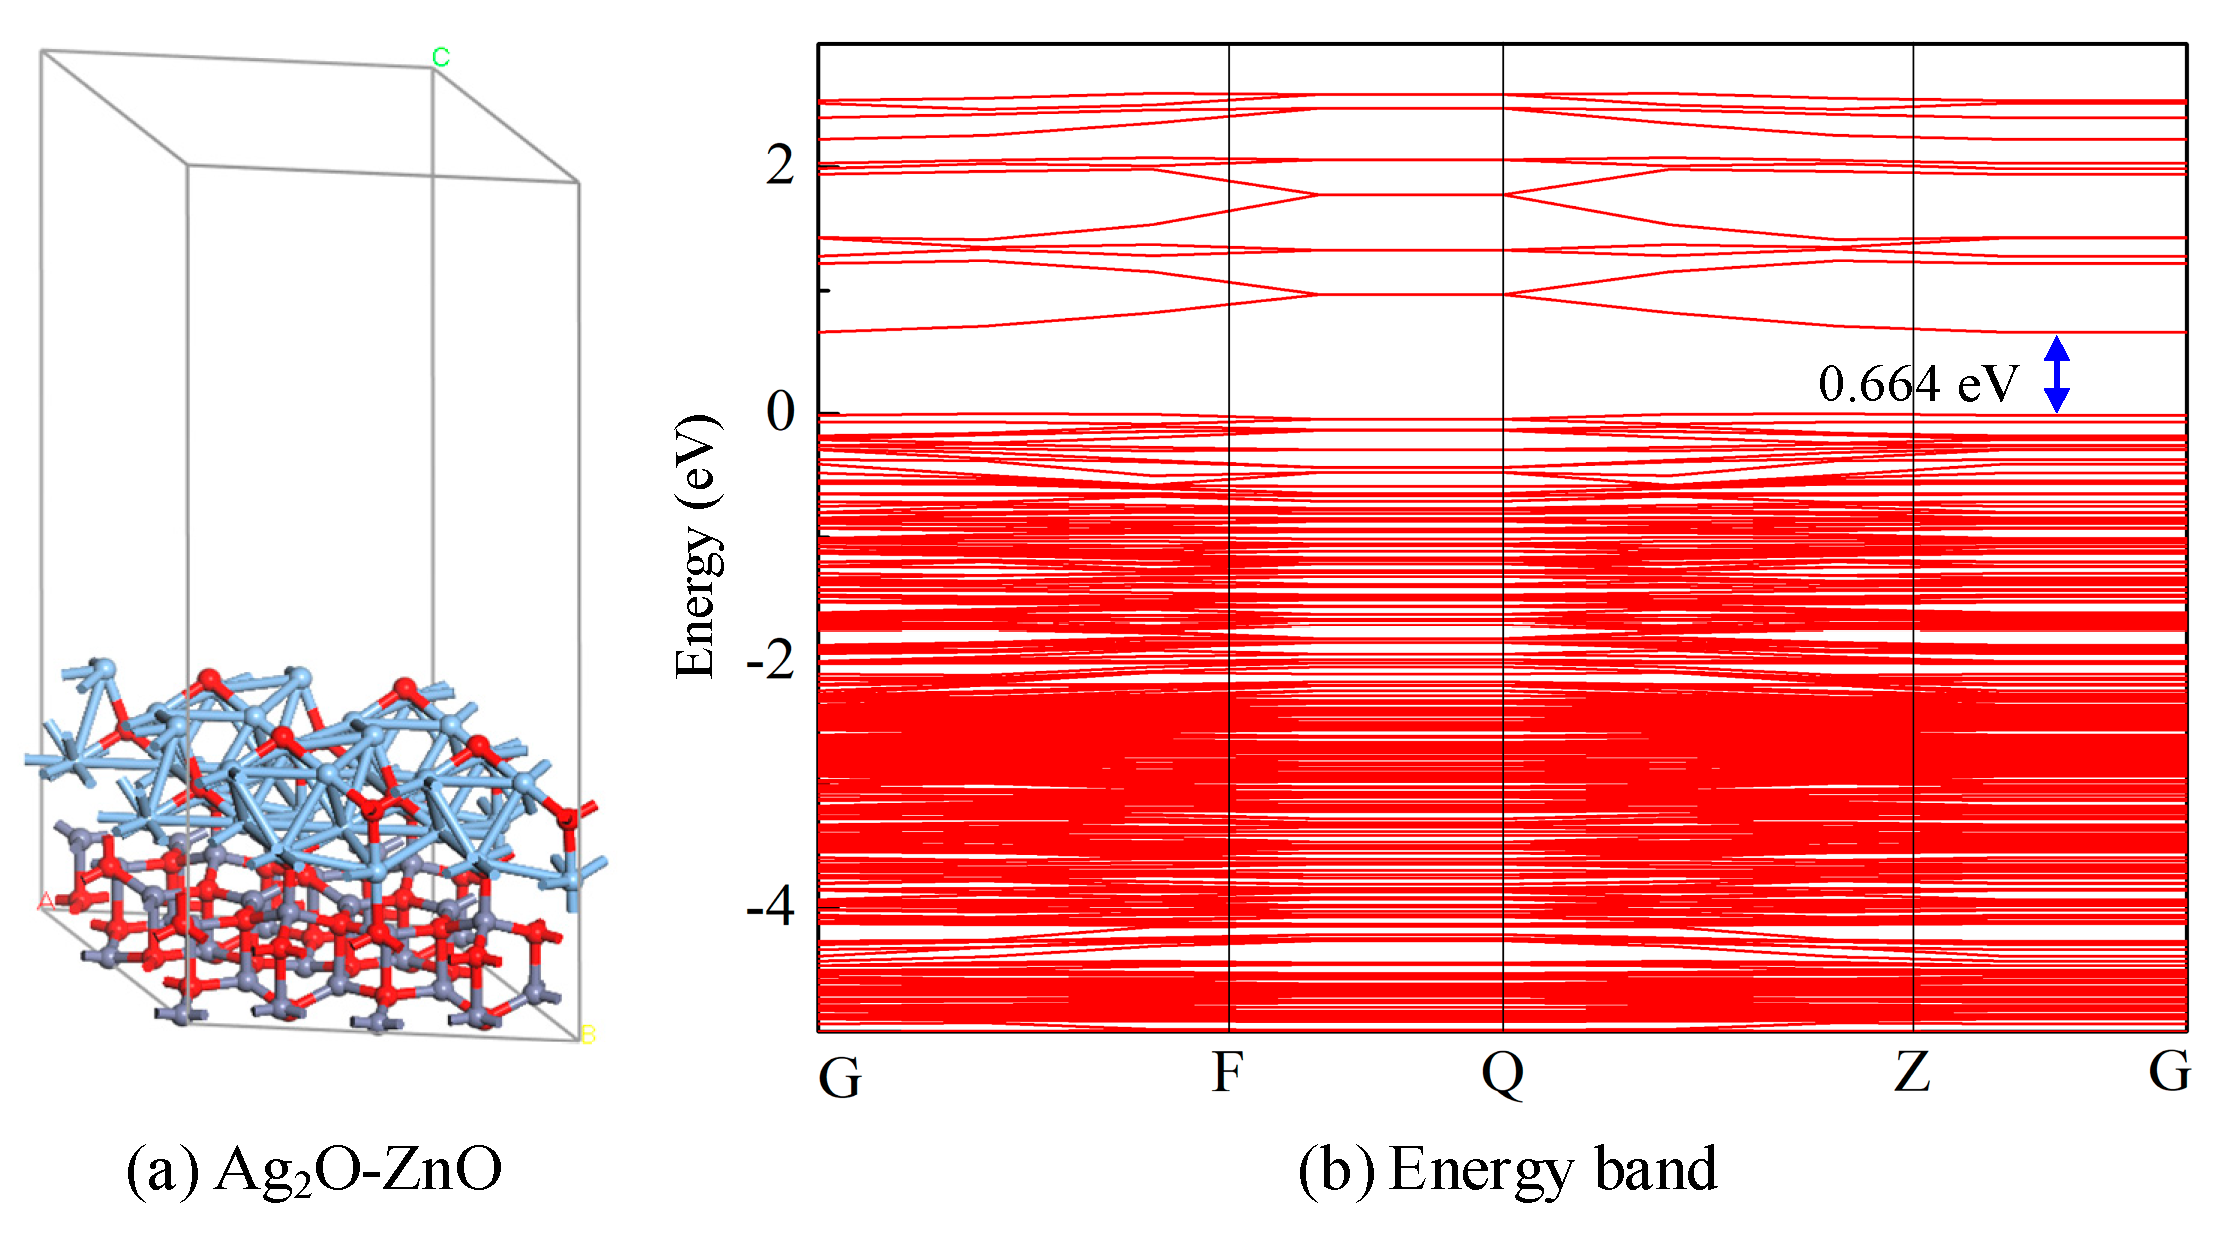
3.2.1. Structure and Electronic Analysis of Ag2O-ZnO Heterojunction

A 3 × 3 × 1 Ag2O-ZnO two-layer heterojunction was constructed. For building the Ag2O-ZnO heterojunction structural model, Ag2O sites were used as the upper layer metal oxide, and ZnO sites were used as the lower layer-based metal oxide. The lattice mismatch of the Ag2O-ZnO heterojunction is within 5%. Geometric optimization was performed on the constructed Ag2O-ZnO heterojunction model, and the most stable structure was obtained, as shown in Figure 6. The supercell of Ag2O-ZnO heterojunction is shown in Figure 6a, with corresponding lattice constants of a = 13.1737 Å, b = 13.1737 Å, and c = 31.1638 Å; γ = at 120.000°, which consists of a total of 112 atoms. From the structural diagram, it can be observed that the Ag2O-ZnO heterojunction forms a highly symmetrical regular geometric structure, and the numerous triangular structures formed by the upper layer of Ag2O are conducive to improving the structural stability of the model. Meanwhile, multiple O-C and Ag-O bonds form between two different metal oxides, namely Ag2O and ZnO, with chemical bond lengths ranging from 1.968 Å to 2.213 Å. The formation energy of the structural model is calculated to be −13.344 eV, and the formation energy is less than 0 eV, indicating that the heterojunction can exist stably. As shown in Figure 6b, the bandgap width of the optimized Ag2O-ZnO metal oxide heterojunction model is 0.664 eV. Compared with the bandgap of intrinsic Ag2O and ZnO metal oxides, the energy band of Ag2O-ZnO heterojunction becomes denser, and the bandgap width is shortened to a certain extent, indicating that the formation of this heterojunction improves the conductivity of the system.

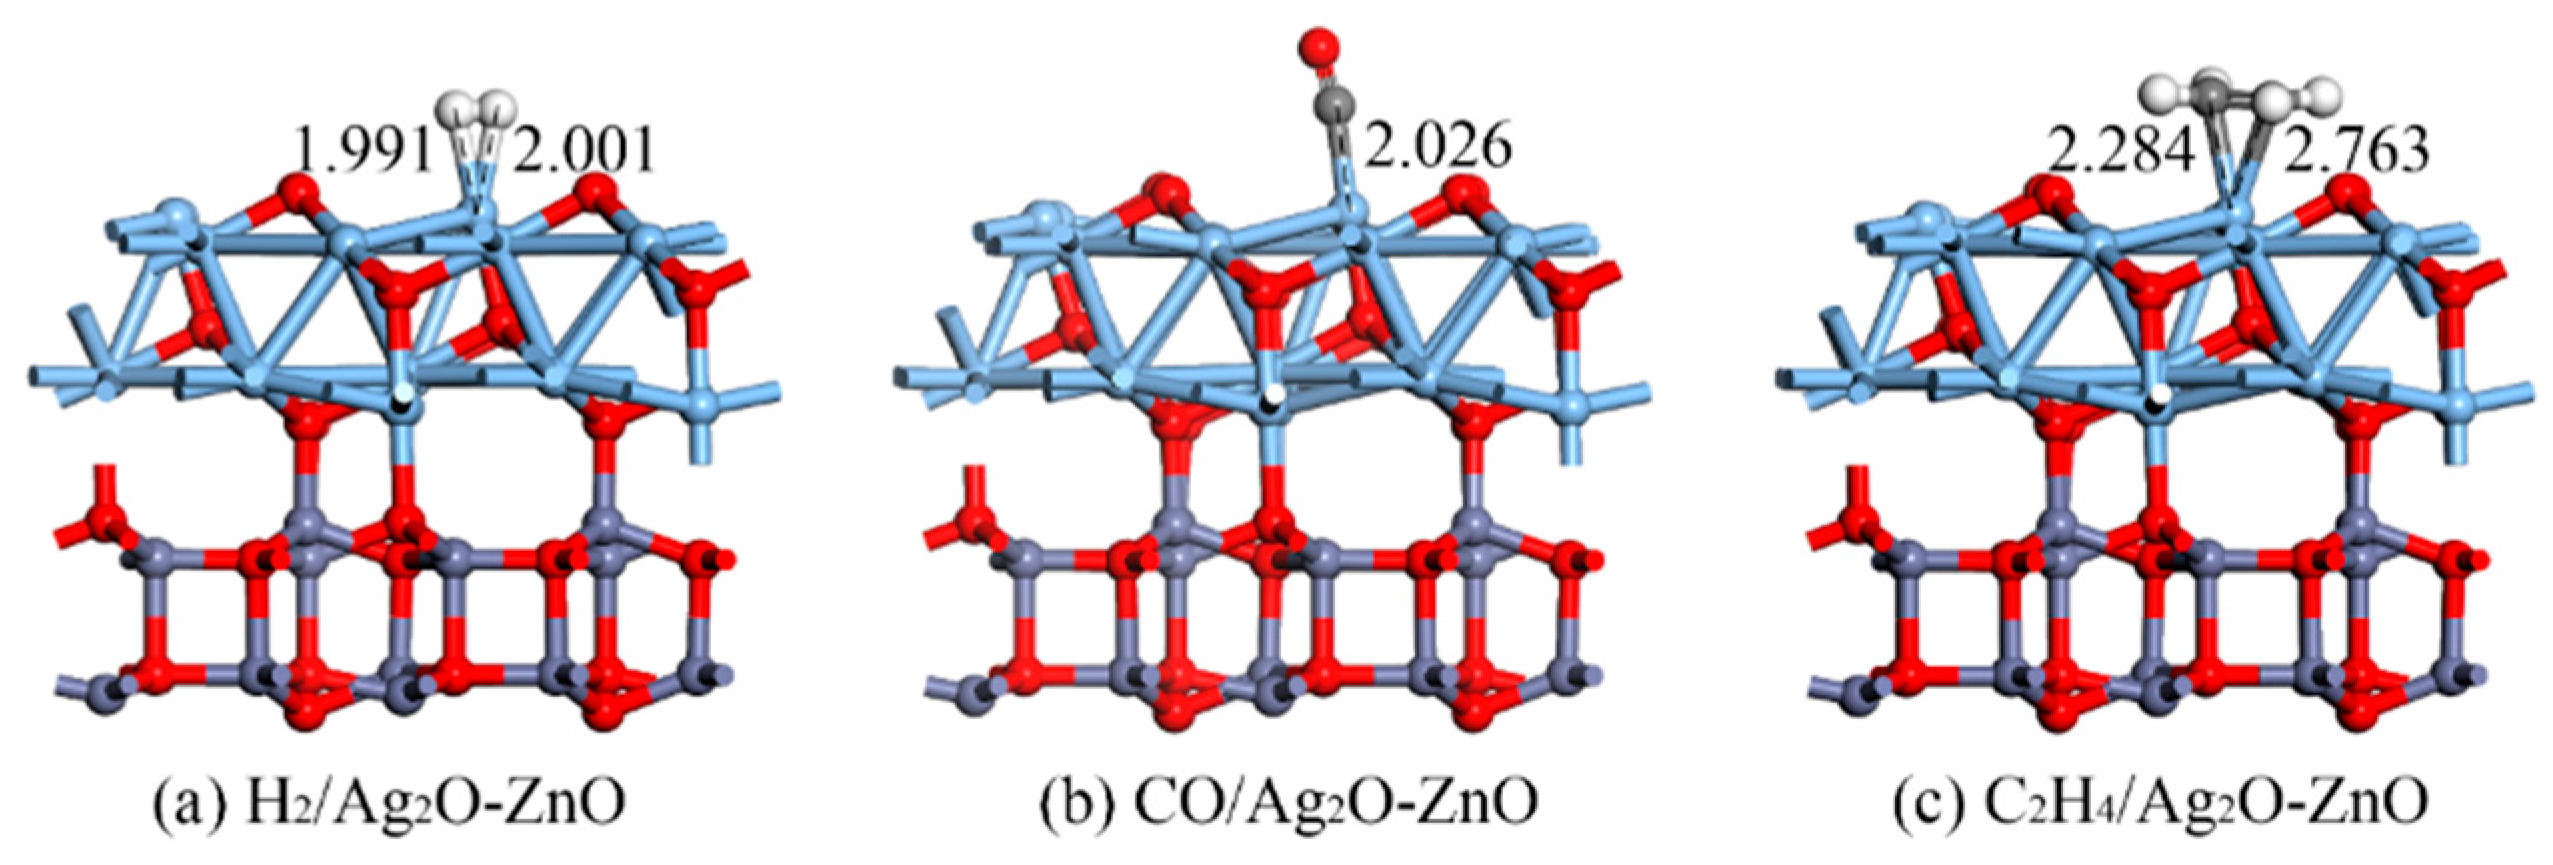
3.2.2. Structure and DCD Analysis of Gas/Ag2O-ZnO Heterojunction System

As in Section 3.1.2, the gas adsorption structures on the Ag2O-ZnO heterojunction were built and optimized by placing H2, CO, and C2H4 gas molecules in different directions and atomic proximity forms onto the surface of the Ag2O-ZnO heterojunction. The most stable adsorption structure of gas molecules adsorbed on the surface of the Ag2O-ZnO heterojunction is shown in Figure 7, and the corresponding adsorption parameters are shown in Table 2. In the geometric optimization process involving molecular adsorption, the entire heterostructure was relaxed. The magnitude of the adsorption energy to some extent reflects the strength of the system’s adsorption capacity. The adsorption capacity of the Ag2O-ZnO heterojunction for the H2, CO, and C2H4 gas molecules is ranked from strong to weak as follows: C2H4 (−1.300 eV) > CO (−1.083 eV) > H2 (−0.346 eV). Similarly, the adsorption distance of the heterojunctions for these three gas molecules exhibits a similar pattern to the adsorption energy, as follows: C2H4 (2.284 Å) > CO (2.026 Å) > H2 (1.991 Å). Compared with the intrinsic adsorption of Ag2O and ZnO, the adsorption distance of heterojunctions for gas molecules is shortened to a certain extent. For H2 adsorption, both H atoms in H2 form two Ag-H bonds with surface Ag atoms with bond lengths of 1.991 Å and 2.001 Å, respectively, resulting in a decrease in adsorption energy compared to Ag2O and ZnO. For CO adsorption, the C atom is close to the surface Ag atom and forms an Ag-C bond with a bond length of 2.026 Å. The adsorption energy is increased compared to the intrinsic substrate ZnO, and decreased compared to Ag2O. For the adsorption of C2H4, two C atoms form two Ag-C bonds with a surface Ag atom with bond lengths of 2.284 Å and 2.763 Å, respectively. The change in the heterojunction adsorption energy is similar to that of CO adsorption, with the adsorption energy smaller than Ag2O and greater than ZnO. At the same time, it can be observed that Ag2O-ZnO does not change its geometric structure for the adsorption of any gas molecule, indicating its strong structural stability.
The DCDs of H2, CO, and C2H4 adsorption on the Ag2O-ZnO heterojunction were analyzed to explore the electron transfer during the adsorption process. The corresponding DCDs of the three adsorption systems are shown in Figure 8. Similarly, the red area indicates a decrease in electron density, while the blue area indicates an increase in electron density. As shown in Figure 8a, the DCD distribution of the H2-adsorbed Ag2O-ZnO heterojunction shows that the surrounding area of H2 is slightly reddish, indicating the transfer of electrons from gas molecules to the heterojunction surface. Charge distribution analysis of the electron transfer amount is calculated to be 0.160 e. The DCD diagram of CO adsorption is shown in Figure 8b. The C and O atoms in the gas molecule are surrounded by red and blue, respectively, indicating that the former loses electrons while the latter gains electrons. Overall, charge distribution analysis shows that electrons transfer from the gas molecule to the heterojunction, with a charge of 0.295 e. Figure 8c shows the adsorption of C2H4, with a red color near the four H atoms, while the two C atoms are surrounded by a blue color. Charge distribution analysis shows that C2H4 ultimately provides electrons with a charge of 0.305 e to the surface atoms of the heterojunction. Similarly, for Ag2O-ZnO heterojunctions, the O atom always acts as an electron acceptor, while the Ag and Zn metal atoms always act as electron donors. Based on the above analysis, it can be concluded that the adsorption of H2, CO, and C2H4 on the surface of the Ag2O-ZnO heterojunction is a highly reactive chemical adsorption according to the analysis of adsorption energy, adsorption distance, electron transfer, and formation of corresponding chemical bonds. The heterojunction has a high sensitivity to detecting these three gases.

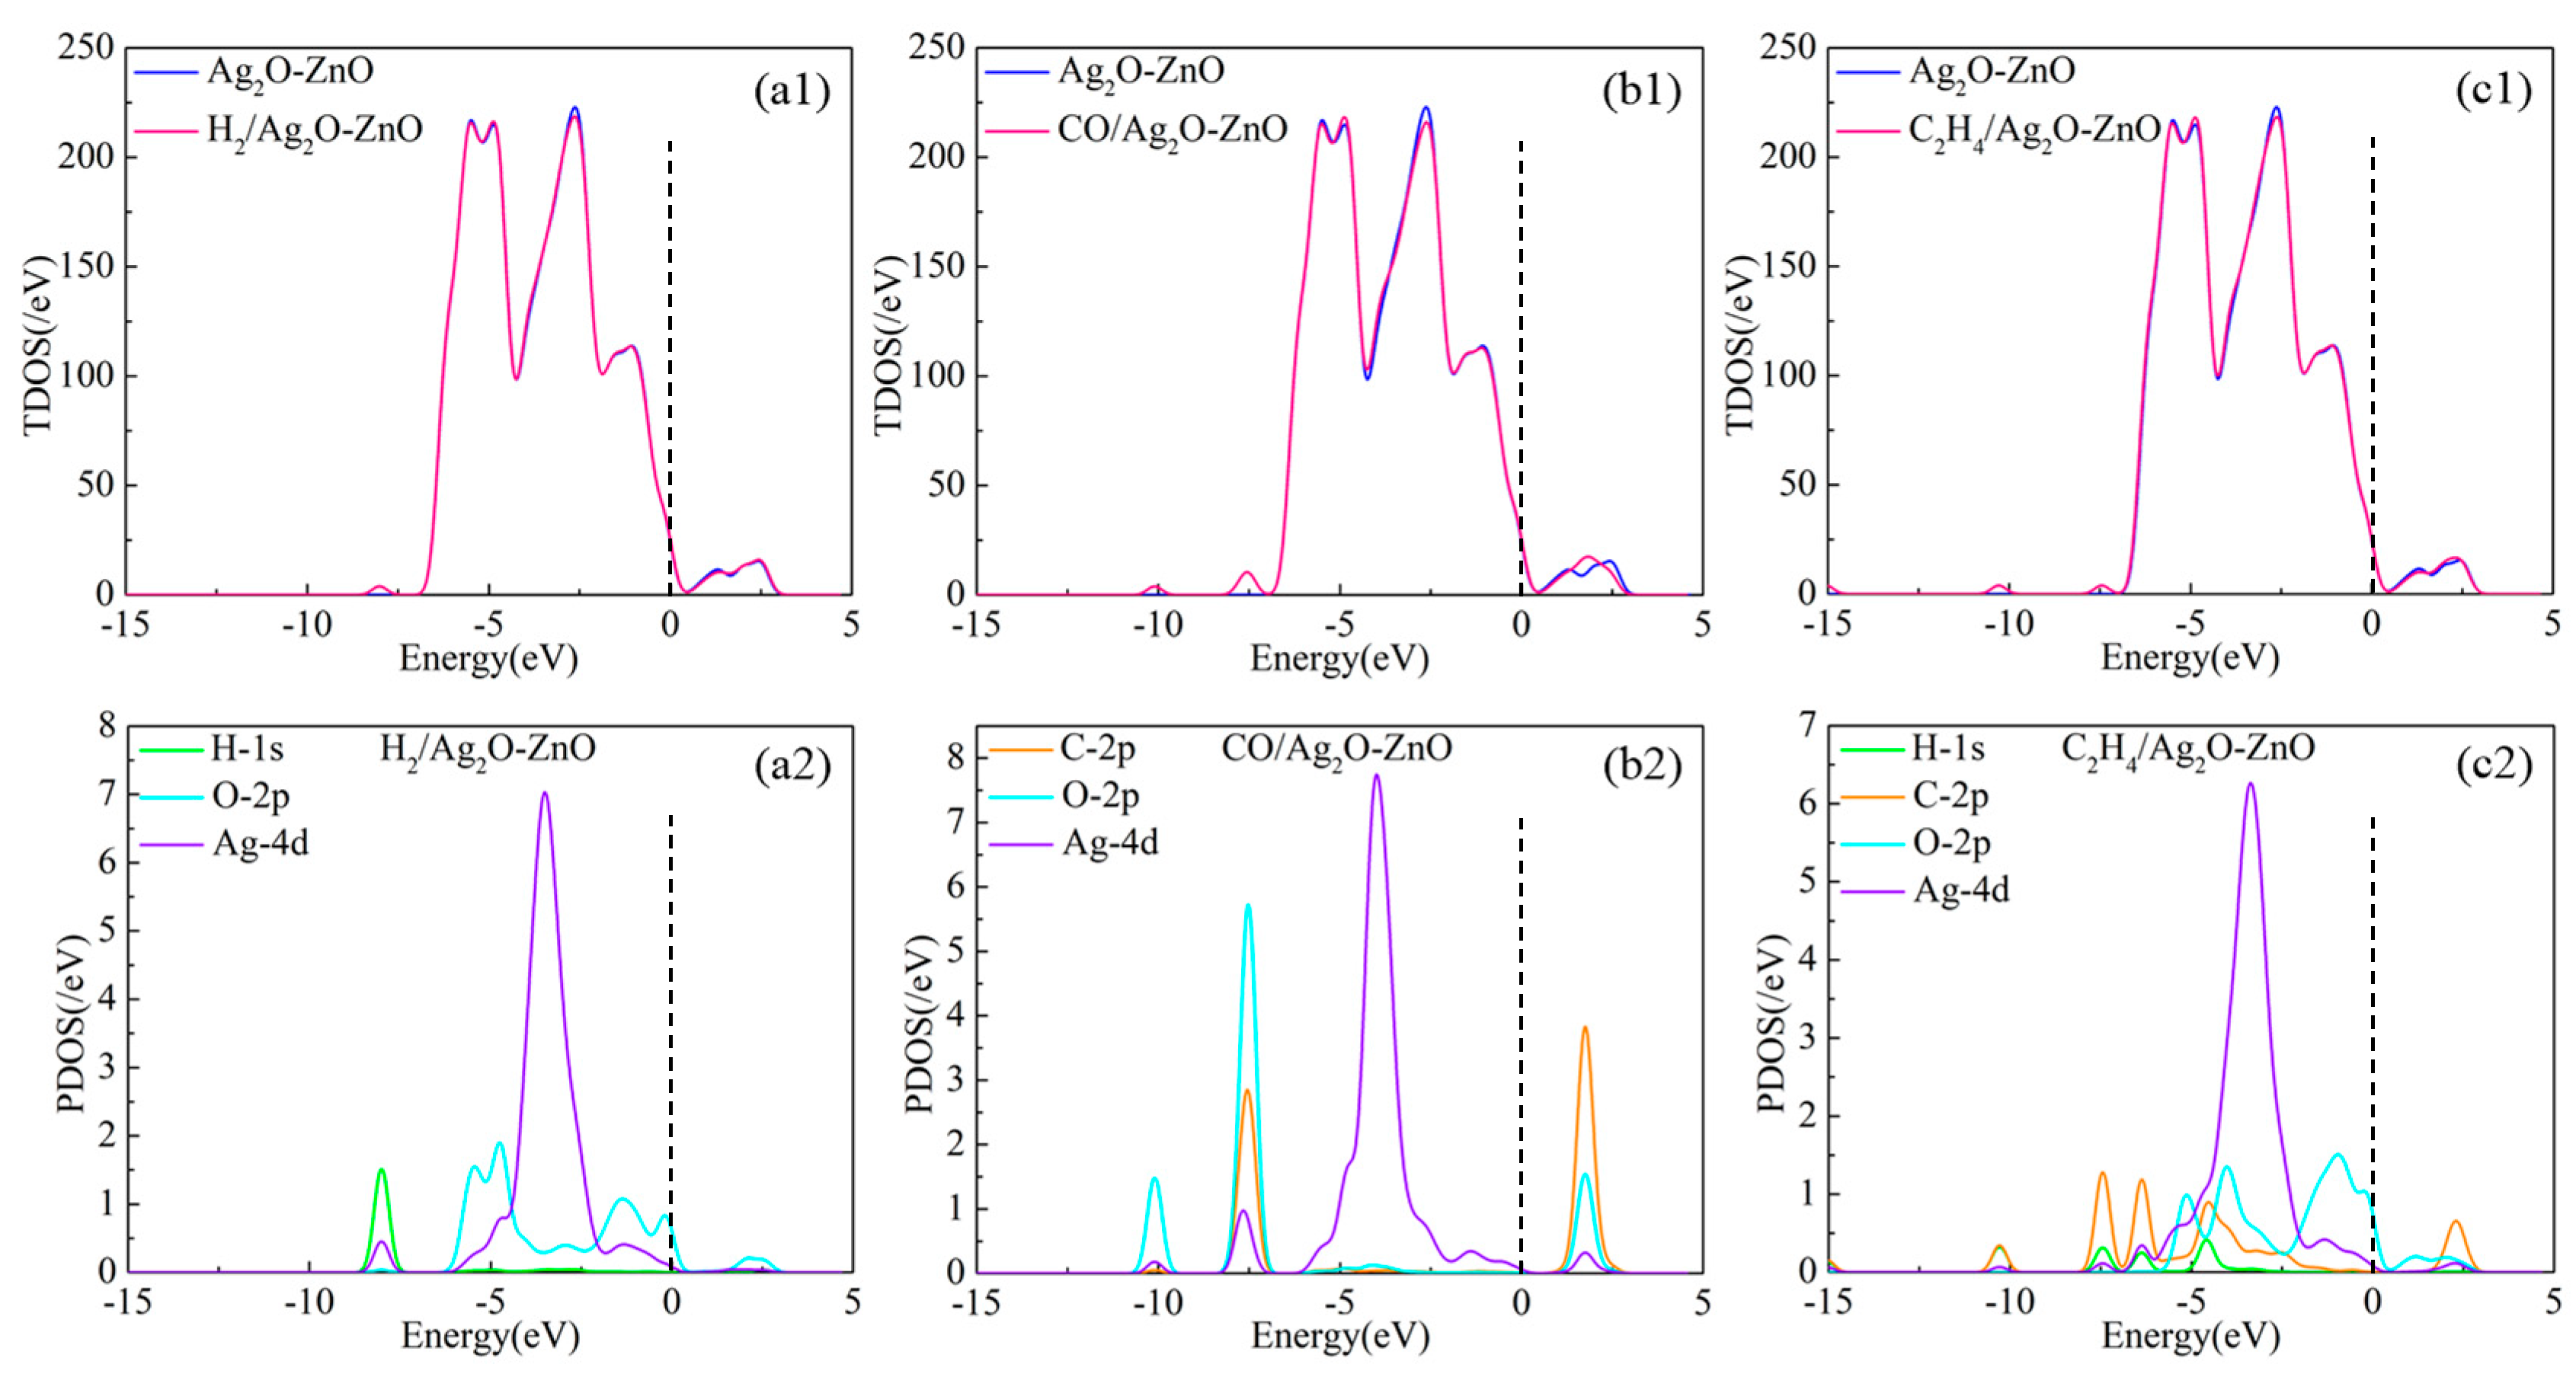
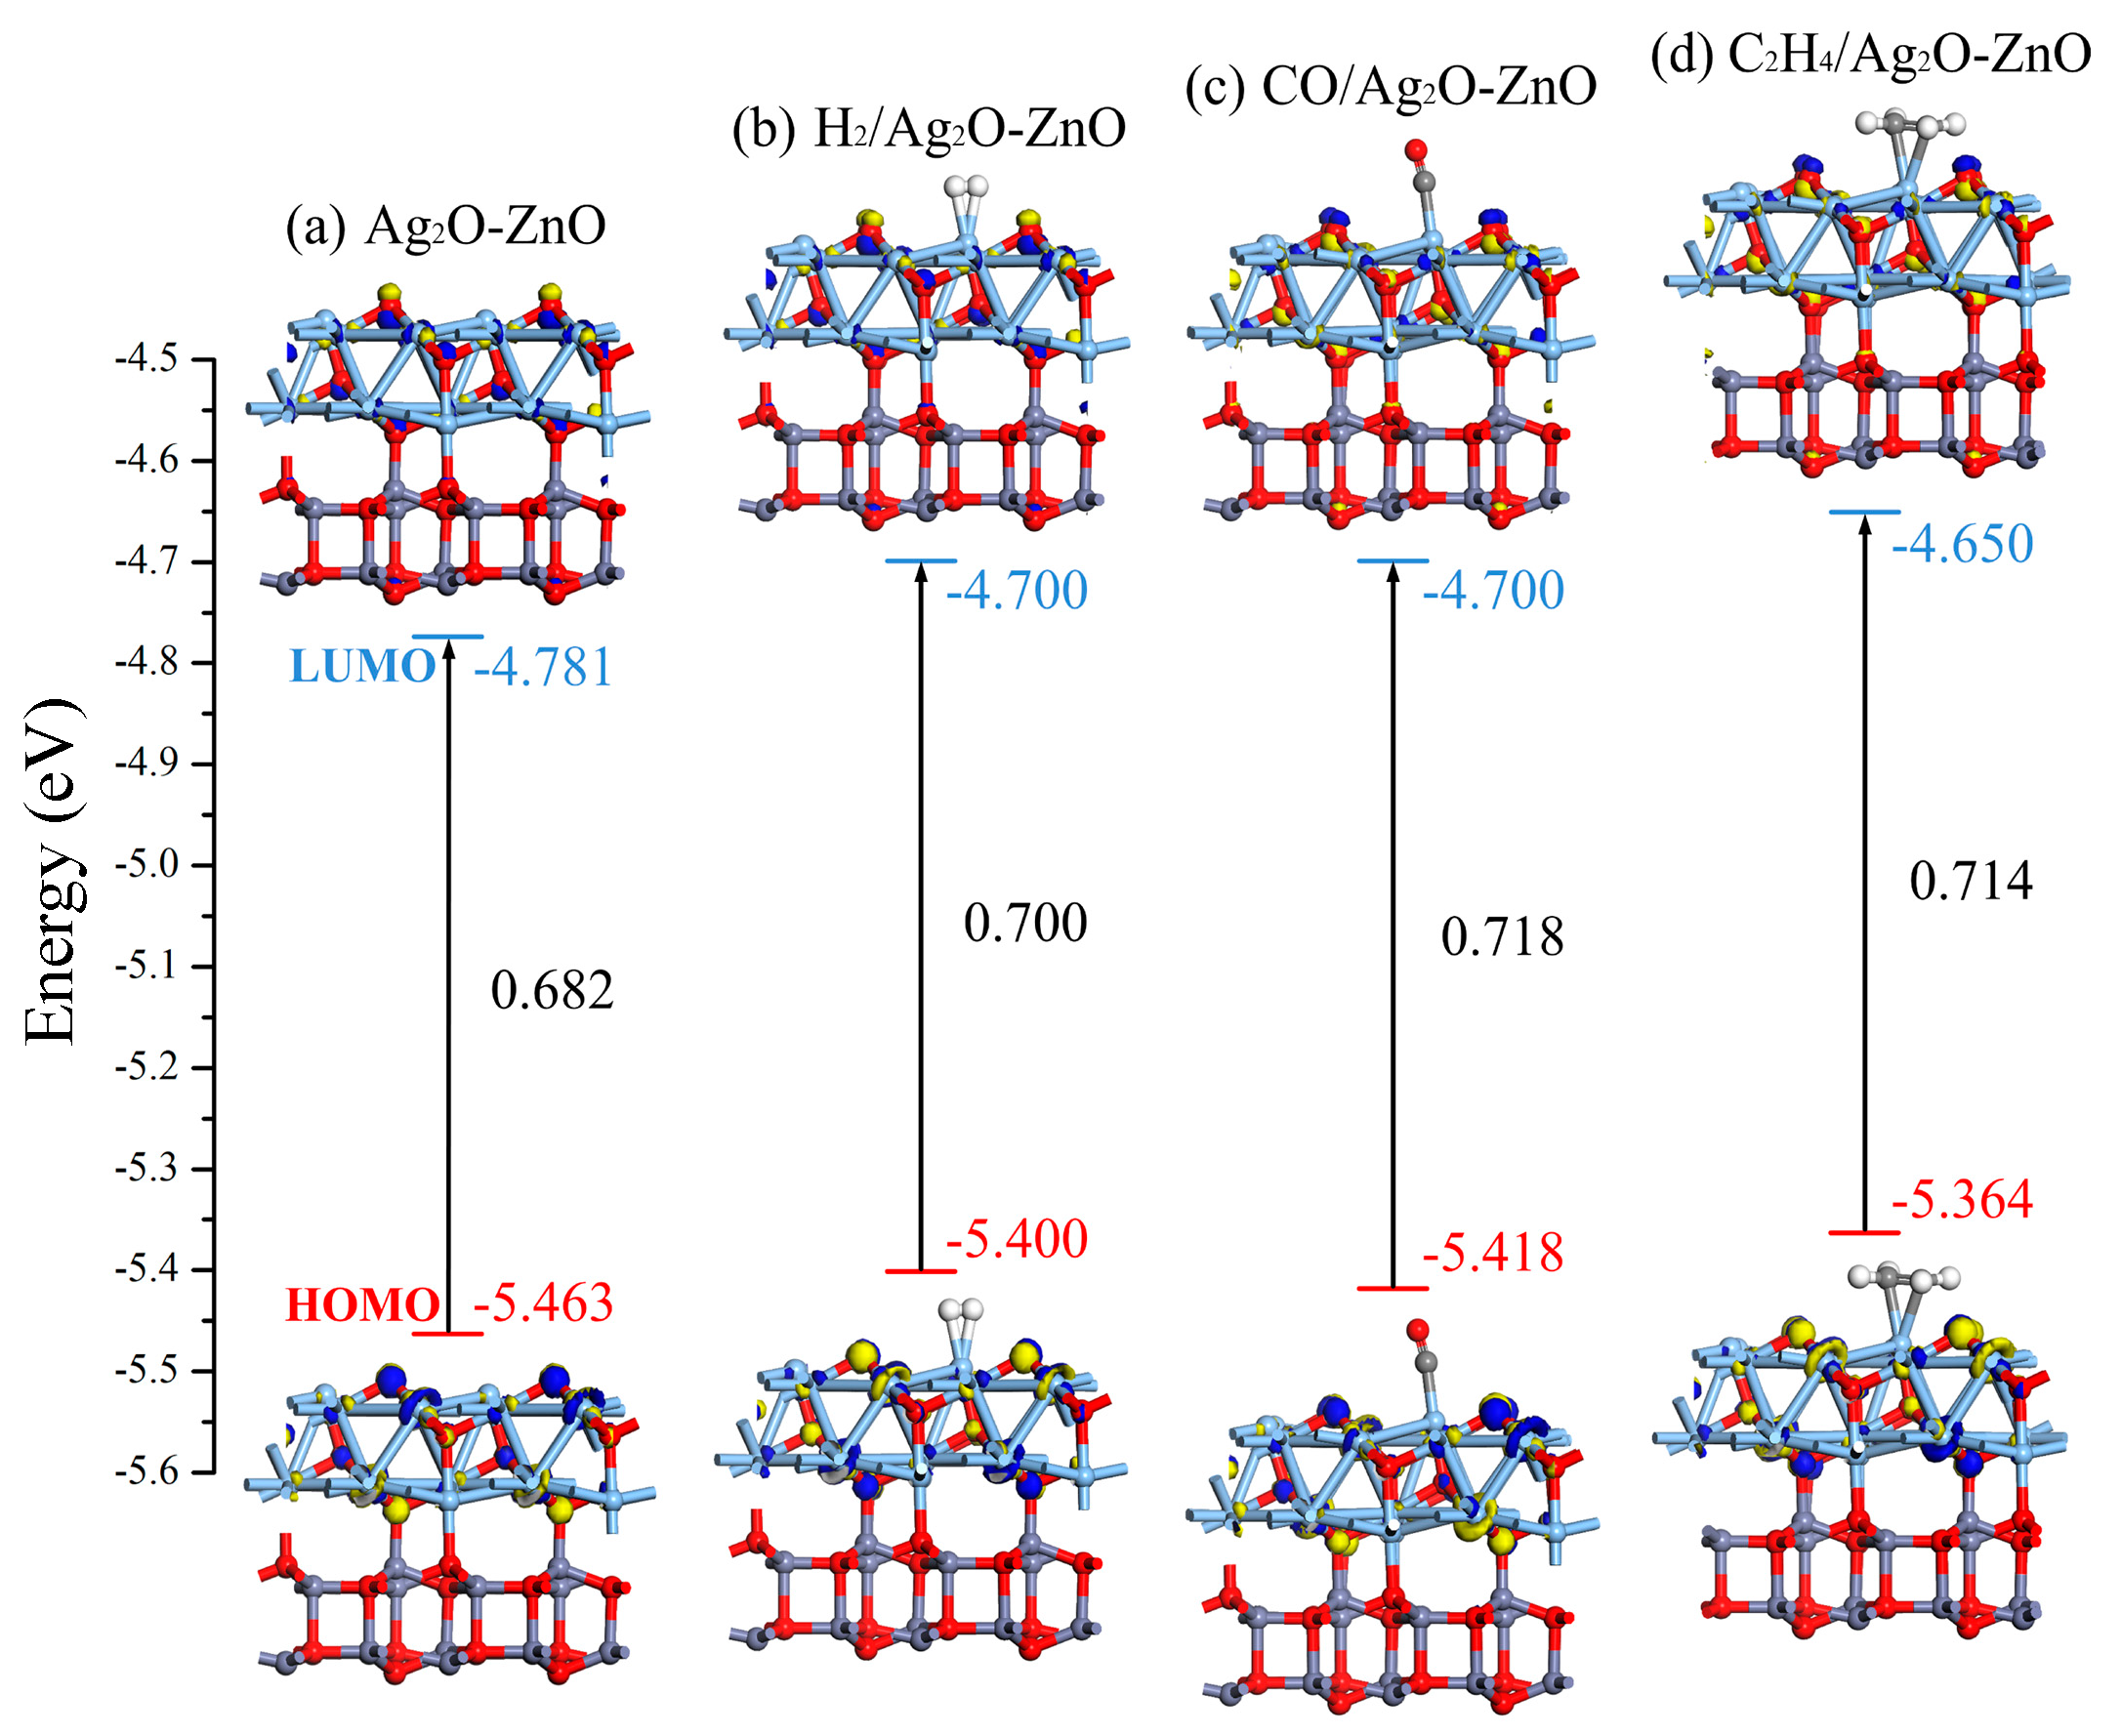
3.2.3. DOS and Molecular Orbital Analysis of Gas/Ag2O-ZnO Heterojunction System

By observing the TDOS of H2, CO, and C2H4 gas molecules adsorbed on the Ag2O-ZnO shown in Figure 9, the position of the Fermi level can be seen to be near the dotted line in Figure 9. It can be found that the TDOS of these three adsorption systems near the Fermi level has increased to varying degrees compared to Ag2O-ZnO without gas adsorption, indicating that the conductivity of the Ag2O-ZnO heterojunction has decreased after adsorbing these three gas molecules. For H2 adsorption, the peak overlap between O-2p and Ag-4d in the energy level range of −6 eV to 0 eV is the main reason affecting the changes in TDOSs. For CO adsorption, the peaks of C-2p, O-2p, and Ag-4d in CO overlap near the −10 eV, −7.5 eV, and −2 eV energy levels, respectively, causing electron redistribution. Especially for the adsorption of C2H4, the atomic orbitals H-1s and C-2p of the gas molecules exhibit strong orbital hybridization with O-2p and Ag-4d in the energy level range of −7.5 eV to 2.5 eV, resulting in an elevation of the TDOS near the Fermi level.
The distribution of HOMO and LUMO in heterojunctions and various adsorption systems were plotted and analyzed, and the values of ELUMO, EHOMO, and Eg were calculated, as shown in Figure 10. It can be observed that among the three gas molecules, C2H4 adsorption had the greatest impact on the distribution of HOMO and LUMO in Ag2O-ZnO heterojunctions. Meanwhile, after adsorbing C2H4, the ELUMO of the system changed from −4.781 eV to −4.650 eV, EHOMO changed from −5.463 eV to −5.364 eV, and Eg increased from 0.682 eV to 0.714 eV, indicating that C2H4 gas adsorption reduced the conductivity of the Ag2O-ZnO heterojunction. For the adsorption of H2 and CO, compared to the Ag2O-ZnO heterojunction, the Eg values of these two adsorption systems also increased to 0.700 eV and 0.718 eV, respectively, resulting in a decrease in conductivity. The above molecular orbital analysis is consistent with the DOS analysis results mentioned earlier.

3.3. Gas Sensing Properties of the Cu2O-ZnO Heterojunction for H2, CO, and C2H4

3.3.1. Structure and Electronic Analysis of the Cu2O-ZnO Heterojunction

A 2 × 1 × 1 Cu2O-ZnO two-layer heterojunction was constructed, where Cu2O serves as the upper layer metal oxide, while ZnO serves as the lower layer-based metal oxide. The lattice mismatch of the Cu2O-ZnO heterojunction is within a 5%. The structure of the Cu2O-ZnO metal oxide heterostructure is optimized as shown in Figure 11a, with lattice constants of a = 12.5367 Å, b = 6.2683 Å, and c = 29.9318 Å; γ = at 120.000°, containing 56 atoms. Meanwhile, by observing the geometric structure of the Cu2O-ZnO heterojunction, it can be observed that Zn-O and Cu-O bonds are formed between the two layers of metal oxides, with the longest bond length being 1.983 Å and the shortest being 1.905 Å. The difference in bond lengths is not significant and remains consistent. The calculated formation energy of the Cu2O-ZnO heterojunction model is −4.344 eV. The energy band of the optimized Cu2O-ZnO metal oxide heterojunction is shown in Figure 11b, with a bandgap width of 0.261 eV. After the formation of heterostructures, the band distribution is denser and the bandgap width is narrower compared to intrinsic Cu2O and ZnO. These phenomena reflect the improved electronic properties and increased carrier mobility of Cu2O-ZnO heterojunctions.

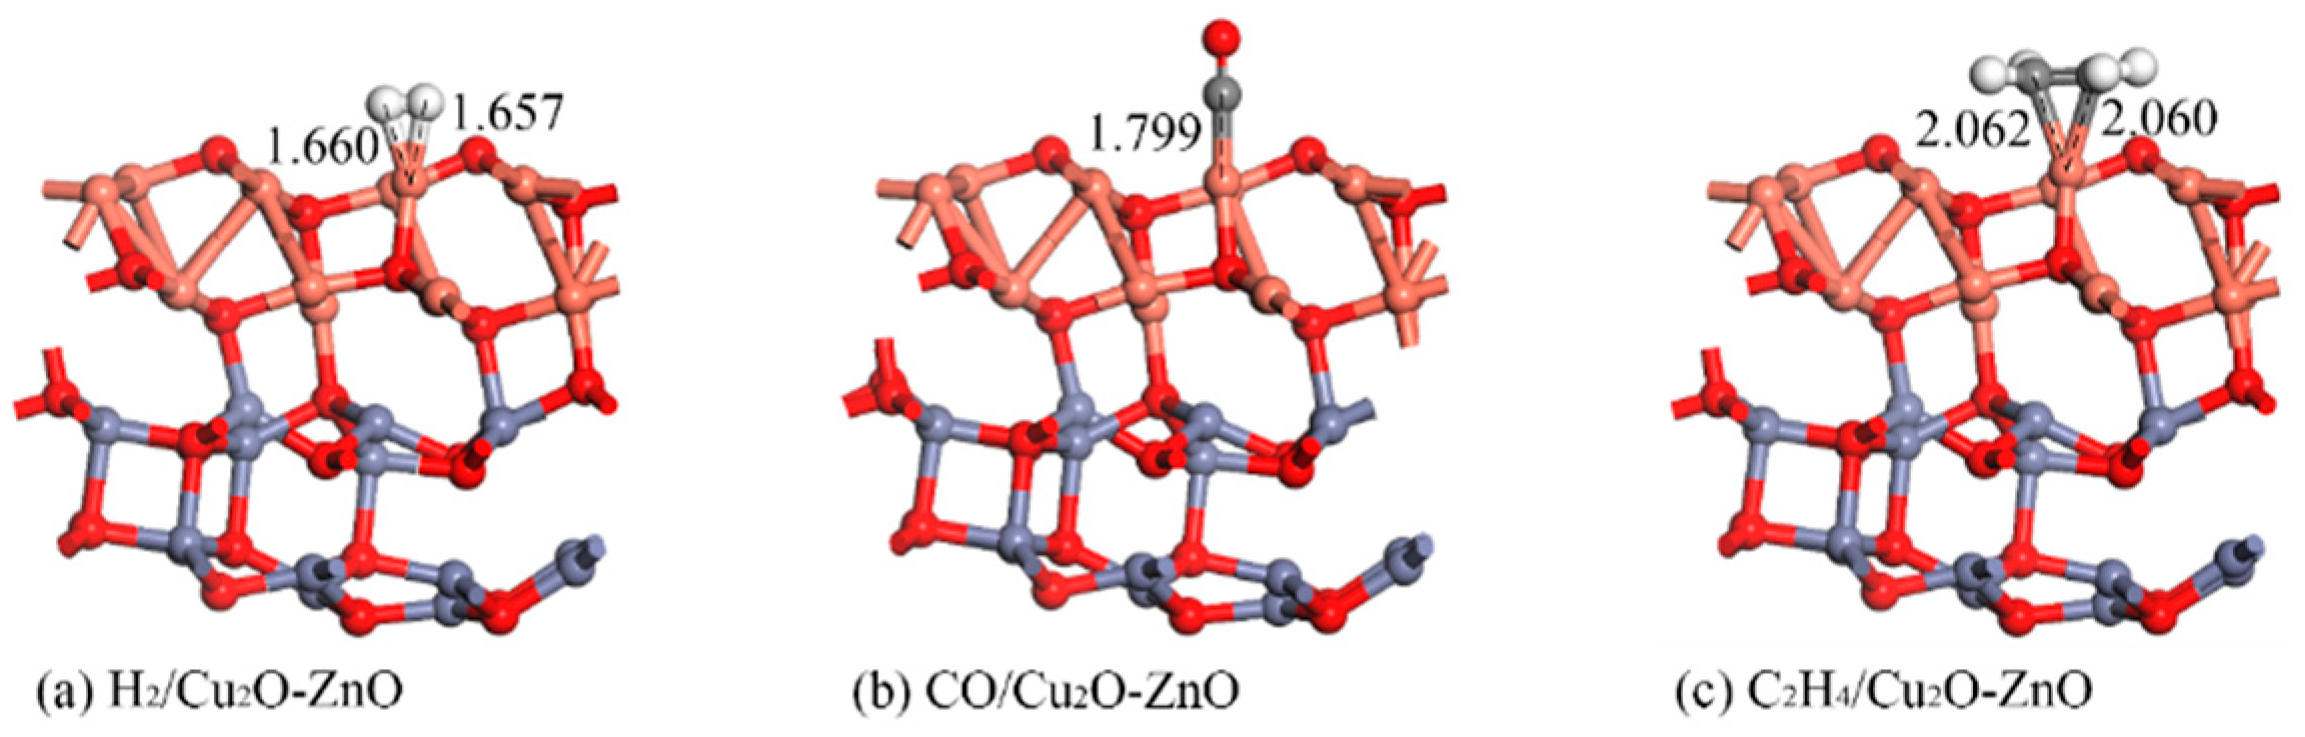
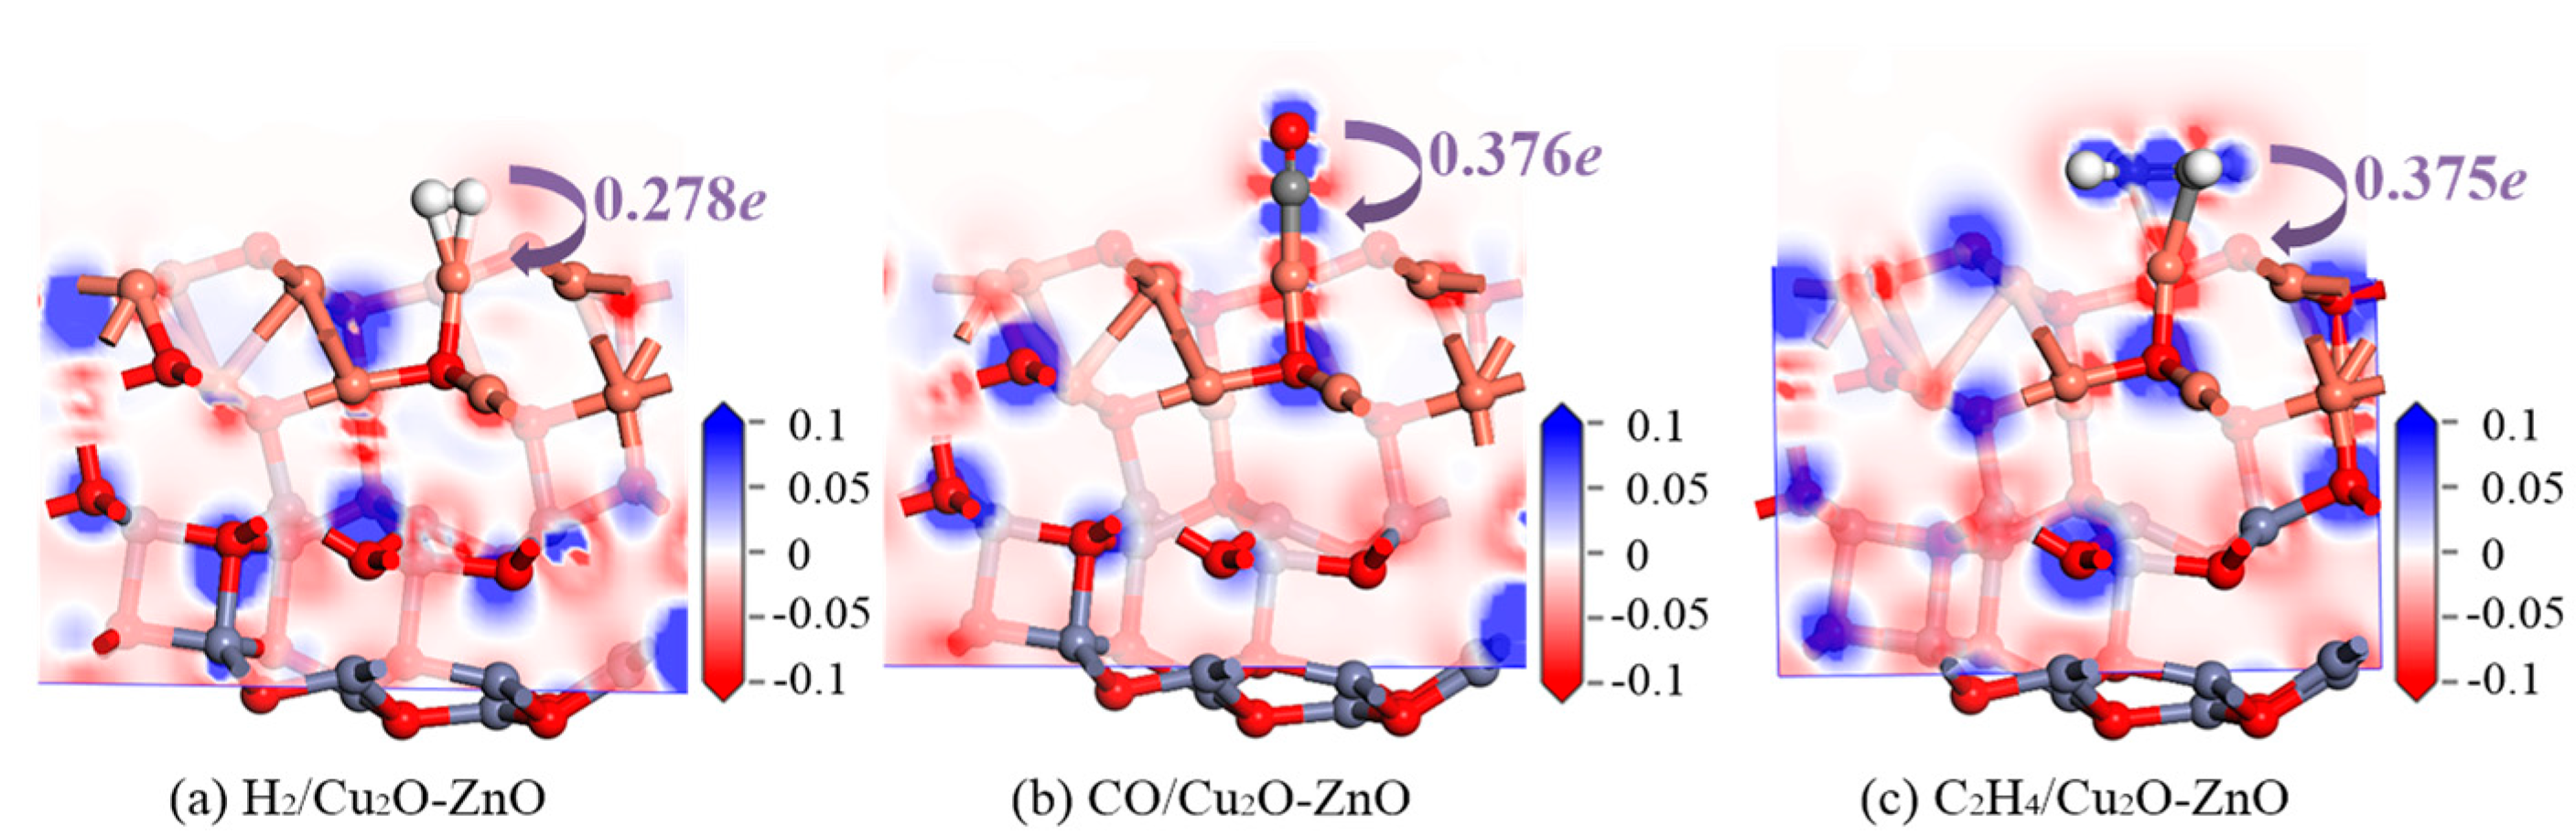
3.3.2. Structure and DCD Analysis of the Gas/Cu2O-ZnO Heterojunction System

As in Section 3.1.2, the optimal adsorption models for the three gas molecules H2, CO, and C2H4 established on the surface of the Cu2O-ZnO heterojunction are shown in Figure 12, and the corresponding adsorption parameters are shown in Table 3. In the geometric optimization process involving molecular adsorption, the entire heterostructure was relaxed. For H2 adsorption, the calculated adsorption energy is −0.592 eV, which is slightly smaller than the adsorption on intrinsic ZnO, and much larger than the adsorption on intrinsic Cu2O. The two H atoms of H2 are close to the Cu atoms on the surface, forming two Cu-H bond lengths of 1.660 Å and 1.657 Å, respectively. For CO adsorption, the adsorption energy is −1.745 eV, which is higher than the that of gas adsorption on intrinsic ZnO and Cu2O. Meanwhile, the C atom is close to the Cu atom, forming a Cu-C bond with a bond length of 1.799 Å. For the adsorption of C2H4, the calculated adsorption energy is −1.649 eV, which is also higher than the adsorption energy of gas adsorption on intrinsic ZnO and Cu2O. The two C atoms of C2H4 are still close to the surface Cu atoms, forming two Cu-C bonds with bond lengths of 2.062 Å and 2.060 Å, respectively. Comparing the adsorption of three gas molecules on the heterojunction with the adsorption of two intrinsic metal oxides, ZnO and Cu2O, it is found that the adsorption distances of H2, CO, and C2H4 on the Cu2O-ZnO heterojunction shorten to a certain extent. Meanwhile, comparing the model diagrams before and after gas adsorption, it can be found that its structure has not changed significantly, indicating that the Cu2O-ZnO heterojunction has strong stability.
Figure 13 shows the DCD distributions of H2, CO, and C2H4 adsorption on the surface of the Cu2O-ZnO heterojunction, with corresponding charge transfer values marked in the figure. As shown in Figure 13a, after H2 adsorbs on the surface of the heterojunction, a red color appears around the two H atoms, indicating a decrease in electron density in this region. Gas molecules transfer electrons to the surface of the heterojunction, and the transfer charge calculated based on charge distribution analysis is 0.278 e. Figure 13b shows the DCD distribution of CO adsorption on the surface. The O atom of the CO molecule is surrounded by a blue color, indicating the reception of foreign electrons, while the C atom appears to have a red color as a donor of electrons. Charge distribution analysis shows that the overall 0.376 e electrons transfer from CO gas molecules to the heterojunction’s surface. The DCD distribution of the C2H4 adsorption on Cu2O-ZnO heterojunction is shown in Figure 13c. The four H atoms of C2H4 are slightly reddish, resulting in a decrease in electron density. On the contrary, the two C atoms appear blue, indicating an increase in electron density in the region. Charge distribution analysis shows that C2H4 provides electrons to the heterojunction surface with a charge of 0.375 e. Similar to the previous discussion, in heterojunctions, O atoms always act as electron acceptors, while the metal atoms Zn and Cu always act as electron donors. Based on the structure and DCD analysis, it can be concluded that the adsorption of H2, CO, and C2H4 on the surface of the Cu2O-ZnO heterojunction is due to chemical adsorption. Especially for CO and C2H4 gas molecules, their interactions with the heterojunction surface are more intense.

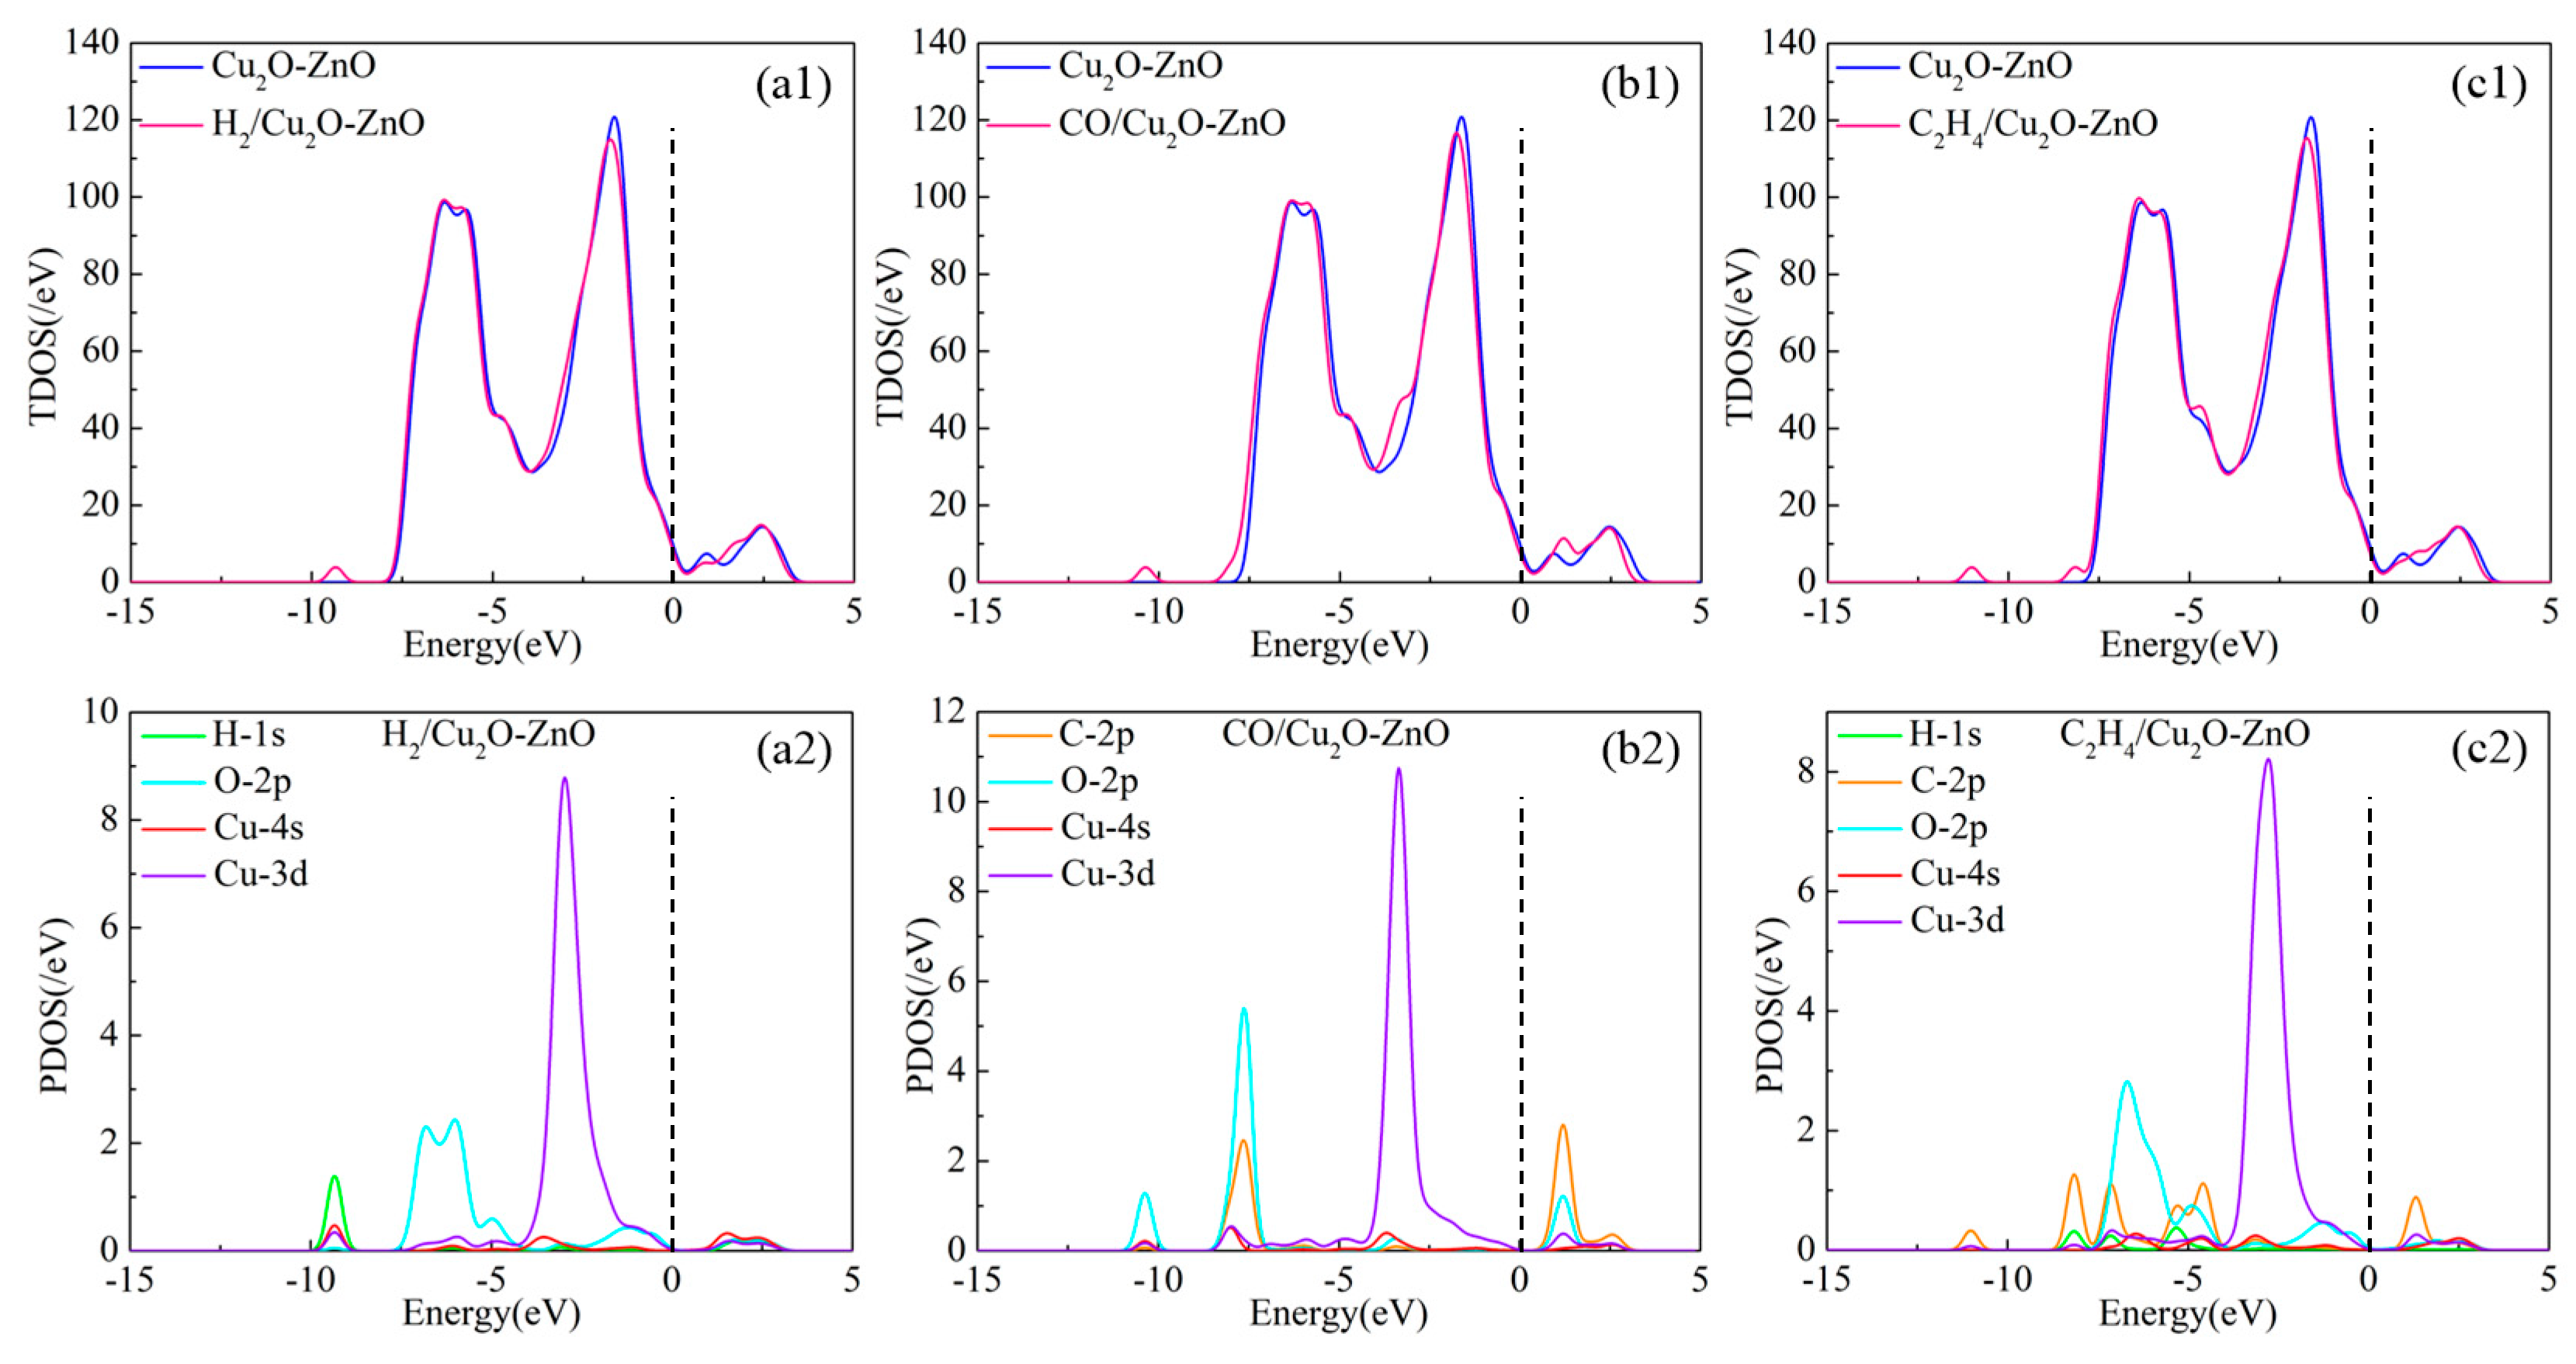
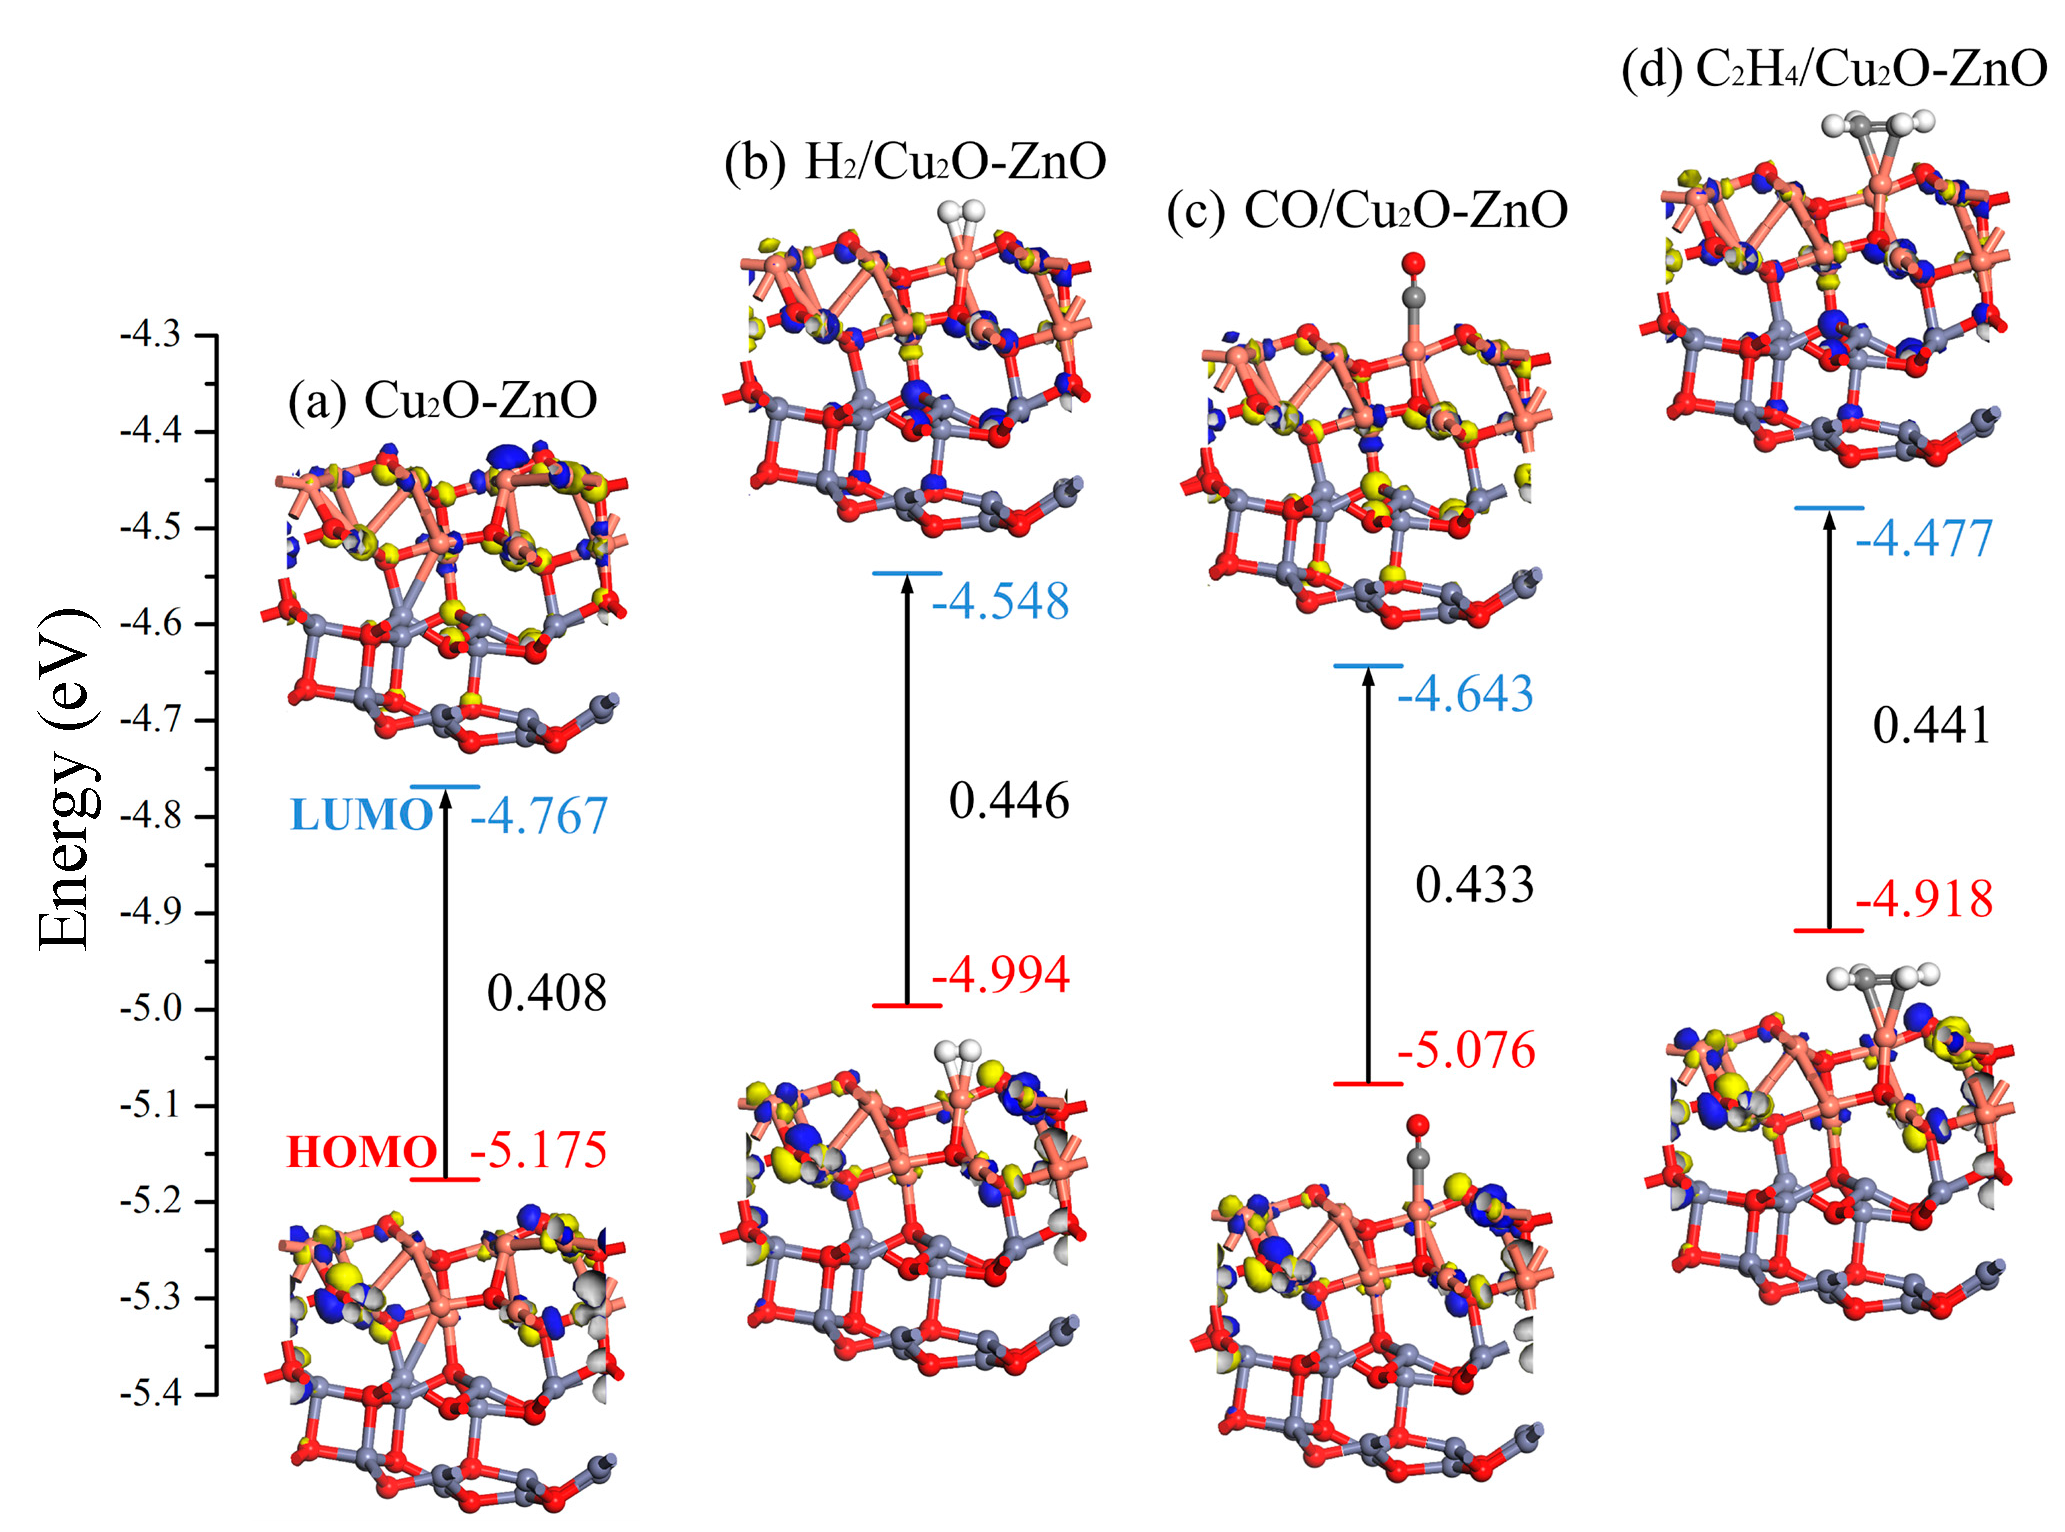
3.3.3. DOS and Molecular Orbital Analysis of the Gas/Cu2O-ZnO Heterojunction System

The TDOS and PDOS of H2, CO, and C2H4 adsorption on Cu2O-ZnO heterojunction are shown in Figure 14. The position of the Fermi level is near the dotted line in Figure 14. By observing the TDOS before and after gas adsorption on the heterojunction, a comparative analysis shows that the TDOS of these three adsorption systems have varying degrees of increase near the Fermi level, indicating that the adsorption of gas molecules on the Cu2O-ZnO heterojunction leads to a decrease in its own conductivity. Specifically, the impact of atomic interactions on TDOS can be analyzed by observing PDOS. For H2 adsorption, H-1s, O-2p, and the atomic orbitals Cu-4s and Cu-3d of Cu atoms undergo orbital hybridization in the energy level ranges of −7.5 eV to 0 eV and 1 eV to 3 eV, respectively, which raises the TDOS curve near the Fermi level. For CO adsorption, the peaks of C-2p and O-2p of gas molecules overlap with those of the Cu-4s and Cu-3d of Cu atoms near the −7.7 eV, −3.5 eV, and 2.5 eV energy levels, while the peaks of C-2p, O-2p, and Cu-3d overlap near the 1.2 eV energy level, thereby affecting the distribution of TDOS. For the adsorption of C2H4, strong orbital hybridization occurs in the energy levels of H-1s, C-2p, O-2p, Cu-4s, and Cu-3d within the range of −8.7 eV to 0 eV and 1 eV to 3 eV, leading to electron redistribution and corresponding changes in the TDOS curve.
From the perspective of molecular orbital analysis, the influence of gas molecule adsorption on the electronic properties of heterojunctions was studied. The HOMO and LUMO distribution of the Cu2O-ZnO heterojunctions before and after gas adsorption were plotted, as shown in Figure 15. The corresponding values of ELUMO, EHOMO, and Eg for each system were marked in the figure. It can be observed that the adsorption of H2, CO, and C2H4 has a significant impact on the HOMO and LUMO distribution of Cu2O-ZnO heterojunctions. In particular, the adsorption of C2H4 has a significant impact on the LUMO distribution of the Cu2O-ZnO heterojunction, and the corresponding ELUMO value increased from −4.767 eV to −4.477 eV. The Eg value of the Cu2O-ZnO heterojunction is 0.408 eV, and the Eg values of H2, CO, and C2H4 adsorbed systems increased to 0.446 eV, 0.433 eV, and 0.441 eV, respectively. Correspondingly, the conductivity of these three adsorption systems decreased. The above molecular orbital analysis is consistent with the DOS analysis results.

4. Conclusions

To track and monitor the running status and energy efficiency level of transformers in operation, this study proposes a TMO-ZnO (CuO-ZnO, Ag2O-ZnO, Cu2O-ZnO) heterojunction-based sensor for transformer dissolved gas (H2, CO, and C2H4) detection. The gas adsorption and sensing mechanism of the gas sensor to the gases were studied by analyzing the heterojunction model, adsorption structure, adsorption energy, adsorption distance, energy band, charge transfer, DOS, DCD, and molecular orbitals. This study explored the interaction mechanism between target gas molecules and TMO-ZnO heterojunction substrates. The main conclusions are as follows:
(1) The structures of TMO-ZnO (CuO-ZnO, Ag2O-ZnO, Cu2O-ZnO) heterojunctions were built and optimized. By observing the structure of the heterojunction model and the formation energies of the heterojunction structure, it can be found that the geometric structures of these three heterojunctions are stable enough. The analysis of the heterojunction energy bands showed that all three heterojunction energy bands had a certain degree of densification compared to the original metal oxides, and the bandgap width became narrower, indicating an improvement in the electrical conductivity of the system.
(2) The adsorption structures for H2, CO, and C2H4 on the TMO-ZnO (CuO-ZnO, Ag2O-ZnO, Cu2O-ZnO) heterojunctions were built and optimized. We analyzed and compared the adsorption energy, adsorption distance, and charge transfer of the adsorption system and conducted DOS and molecular orbital studies. The results indicated that the CuO-ZnO heterojunction has weak gas adsorption and sensing performance for H2, while it exhibits good gas sensing performance for CO and C2H4. Both Ag2O-ZnO and Cu2O-ZnO have significant gas sensing performance for H2, CO, and C2H4. The gas adsorption process does not destroy the original geometric configuration of the heterojunction, making TMO-ZnO heterojunctions suitable as gas sensing materials and as sensors for transformer defect detection and energy efficiency analysis.

Author Contributions

Conceptualization, J.Y. and W.D.; Data curation, J.Y.; Investigation, J.Y. and W.D.; Methodology, J.Y. and Y.G.; Project administration, C.T. and Y.G.; Resources, H.S.; Supervision, Y.G.; Validation, W.D., D.Z. and H.S.; Visualization, D.Z.; Writing–original draft, J.Y.; Writing—review and editing, J.Y., W.D., D.Z., C.T. and Y.G. All authors have read and agreed to the published version of the manuscript.

Funding

The research was funded by the Electric Power Research Institute, Yunnan Power Grid Co., Ltd. (Project No. 0562002024030301GY00007).

Data Availability Statement

Data are contained within the article.

Conflicts of Interest

The authors declare no conflicts of interest.

References

  1. Jin, L.; Kim, D.; Abu-Siada, A. State-of-the-art review on asset management methodologies for oil-immersed power transformers. Electr. Power Syst. Res. 2023, 218, 109194. [Google Scholar] [CrossRef]
  2. Jin, L.; Kim, D. Oil-Immersed Power Transformer Condition Monitoring Methodologies: A Review. Energies 2022, 15, 3379. [Google Scholar] [CrossRef]
  3. Fang, Q.; Ye, Z.; Chen, C. A Review of Power Transformer Vibration and Noise Caused by Silicon Steel Magnetostriction. Electronics 2024, 13, 968. [Google Scholar] [CrossRef]
  4. Battal, F.; Balci, S.; Sefa, I. Power electronic transformers: A review. Measurement 2021, 171, 108848. [Google Scholar] [CrossRef]
  5. Ruiz, F.; Perez, M.A.; Espinosa, J.R.; Gajowik, T.; Stynski, S.; Malinowski, M. Surveying Solid-State Transformer Structures and Controls: Providing Highly Efficient and Controllable Power Flow in Distribution Grids. IEEE Ind. Electron. Mag. 2020, 14, 56–70. [Google Scholar] [CrossRef]
  6. Wani, S.A.; Rana, A.S. Advances in DGA based condition monitoring of transformers: A review. Renew. Sustain. Energy Rev. 2021, 149, 111347. [Google Scholar] [CrossRef]
  7. Taha, I.B.M.; Ibrahim, S.; Mansour, D.E.A. Power Transformer Fault Diagnosis Based on DGA Using a Convolutional Neural Network with Noise in Measurements. IEEE Access 2021, 9, 111162–111170. [Google Scholar] [CrossRef]
  8. Mahajan, S.; Jagtap, S. Metal-oxide semiconductors for carbon monoxide (CO) gas sensing: A review. Appl. Mater. Today 2020, 18, 100483. [Google Scholar] [CrossRef]
  9. Krishna, K.G.; Parne, S.; Pothukanuri, N.; Kathirvelu, V.; Gandi, S. Nanostructured metal oxide semiconductor-based gas sensors: A comprehensive review. Sens. Actuators A Phys. 2022, 341, 113578. [Google Scholar] [CrossRef]
  10. Franco, M.A.; Conti, P.P.; Andre, R.S. A review on chemiresistive ZnO gas sensors. Sens. Actuators Rep. 2022, 4, 100100. [Google Scholar] [CrossRef]
  11. Steinhauer, S.; Brunet, E.; Maier, T.; Mutinati, G.C.; Köck, A.; Freudenberg, O.; Gspan, C.; Grogger, W.; Neuhold, A.; Resel, R. Gas sensing properties of novel CuO nanowire devices. Sens. Actuators B Chem. 2013, 187, 50–57. [Google Scholar] [CrossRef]
  12. Rizi, V.S.; Sharifianjazi, F.; Jafarikhorami, H.; Parvin, N.; Fard, L.S.; Irani, M. Esmaeilkhanian, A. Sol–gel derived SnO2/Ag2O ceramic nanocomposite for H2 gas sensing applications. Mater. Res. Express 2019, 6, 1150g2. [Google Scholar] [CrossRef]
  13. Zhou, L.-J.; Zou, Y.-C.; Zhao, J.; Wang, P.-P.; Feng, L.-L.; Sun, L.-W.; Wang, D.-J.; Li, G.-D. Facile synthesis of highly stable and porous Cu2O/CuO cubes with enhanced gas sensing properties. Sens. Actuators B Chem. 2013, 188, 533–539. [Google Scholar] [CrossRef]
  14. Singh, A.; Sikarwar, S.; Verma, A.; Yadav, B.C. The recent development of metal oxide heterostructures based gas sensor, their future opportunities and challenges: A review. Sens. Actuators A Phys. 2021, 332, 113127. [Google Scholar] [CrossRef]
  15. Zappa, D.; Galstyan, V.; Kaur, N.; Munasinghe-Arachchige, H.M.M.; Sisman, O.; Comini, E. Metal oxide-based heterostructures for gas sensors—A review. Anal. Chim. Acta 2018, 1039, 1–23. [Google Scholar] [CrossRef]
  16. Li, S.; Zhang, Y.; Han, L.; Li, X.; Xu, Y. Highly sensitive and selective triethylamine gas sensor based on hierarchical radial CeO2/ZnO n-n heterojunction. Sens. Actuators B Chem. 2022, 367, 132031. [Google Scholar] [CrossRef]
  17. Yuan, T.; Ma, Z.; Nekouei, F.; Zhang, W.; Xu, J. Zeolitic imidazolate framework-derived n-ZnO/p-Co3O4 heterojunction by ion-etching method for superior CO toxic gas sensor. Sens. Actuators B Chem. 2023, 374, 132717. [Google Scholar] [CrossRef]
  18. Meng, D.; Liu, D.; Wang, G.; Shen, Y.; San, X.; Li, M.; Meng, F. Low-temperature formaldehyde gas sensors based on NiO-SnO2 hetero-junction microflowers assembled by thin porous nanosheets. Sens. Actuators B Chem. 2018, 273, 418–428. [Google Scholar] [CrossRef]
  19. Duoc, V.T.; Hung, C.M.; Nguyen, H.; Duy, N.V.; Hieu, N.V.; Hoa, N.D. Room temperature highly toxic NO2 gas sensors based on root-stock/scion nanowires of SnO2/ZnO, ZnO/SnO2, SnO2/SnO2 and, ZnO/ZnO. Sens. Actuators B Chem. 2021, 348, 130652. [Google Scholar] [CrossRef]
  20. Hsu, K.-C.; Fang, T.-H.; Hsiao, Y.-J.; Li, Z.-J. Rapid detection of low concentrations of H2S using CuO-doped ZnO nanofibers. J. Alloys Compd. 2021, 852, 157014. [Google Scholar] [CrossRef]
  21. Wu, Y.; Chen, X.; Weng, K.; Arramel; Jiang, J.; Ong, W.-J.; Zhang, P.; Zhao, X.; Li, N. Highly sensitive and selective gas sensor using het-eroatom doping graphdiyne: A DFT study. Adv. Electron. Mater. 2021, 7, 2001244. [Google Scholar] [CrossRef]
  22. Madsen, G.K.H. Functional form of the generalized gradient approximation for exchange: The PBE α functional. Phys. Rev. B 2007, 75, 195108. [Google Scholar] [CrossRef]
  23. Bučko, T.; Lebègue, S.; Ángyán, J.G.; Hafner, J. Extending the applicability of the Tkatchenko-Scheffler dispersion correction via iterative Hirshfeld partitioning. J. Chem. Phys. 2014, 141, 034114. [Google Scholar] [CrossRef]
  24. Peng, R.; Zeng, W.; Zhou, Q. Adsorption and gas sensing of dissolved gases in transformer oil onto Ru3-modified SnS2: A DFT study. Appl. Surf. Sci. 2023, 615, 156445. [Google Scholar] [CrossRef]
  25. Liu, H.; Tan, Z.; Niu, Y.; Wang, S.; Wang, Y. Ir-decorated MoS2 monolayer as a promising candidate to detect dissolved gas in transformer oil: A DFT study. Chem. Phys. Lett. 2023, 818, 140410. [Google Scholar] [CrossRef]
  26. Gui, Y.; Shi, J.; Xu, L.; Ran, L.; Chen, X. Aun (n = 1–4) cluster doped MoSe2 nanosheet as a promising gas-sensing material for C2H4 gas in oil-immersed transformer. Appl. Surf. Sci. 2021, 541, 148356. [Google Scholar] [CrossRef]
  27. Choudhary, K.; Tavazza, F. Convergence and machine learning predictions of Monkhorst-Pack k-points and plane-wave cut-off in high-throughput DFT calculations. Comput. Mater. Sci. 2019, 161, 300–308. [Google Scholar] [CrossRef]
  28. Wisesa, P.; McDill, K.A.; Mueller, T. Efficient generation of generalized Monkhorst-Pack grids through the use of informatics. Phys. Rev. 2016, 93, 155109. [Google Scholar] [CrossRef]
  29. Delley, B. DMol3 DFT studies: From molecules and molecular environments to surfaces and solids. Comput. Mater. Sci. 2000, 17, 122–126. [Google Scholar] [CrossRef]
  30. Rahman, N.; Khan, A.; Ullah, R.; Ahmad, R.; Ahmad, I. Selective sensing of NH3 and CH2O molecules by novel 2D porous hexagonal boron oxide (B3O3) monolayer: A DFT approach. Surf. Interfaces 2022, 29, 101767. [Google Scholar] [CrossRef]
  31. Jiang, H. Band gaps from the Tran-Blaha modified Becke-Johnson approach: A systematic investigation. J. Chem. Phys. 2013, 138, 134115. [Google Scholar] [CrossRef] [PubMed]
  32. Wang, Y.; Lany, S.; Ghanbaja, J.; Fagot-Revurat, Y.; Chen, Y.; Soldera, F.; Horwat, D.; Mücklich, F.; Pierson, J.F. Electronic structures of Cu2O, Cu4O3, and CuO: A joint experimental and theoretical study. Phys. Rev. B 2016, 94, 245418. [Google Scholar] [CrossRef]
Figure 1. (a) Optimized structure of the CuO-ZnO heterojunction. (b) Energy band of CuO-ZnO heterojunction.
Nanomaterials 15 00856 g001
Figure 2. Structural models of H2, CO, and C2H4 adsorption on the CuO-ZnO heterojunction. The distance is in Å.
Nanomaterials 15 00856 g002
Figure 3. DCD diagrams of H2-, CO-, and C2H4-adsorbed CuO-ZnO heterojunctions.
Nanomaterials 15 00856 g003
Figure 4. TDOS and PDOS of the H2-, CO-, and C2H4-adsorbed CuO-ZnO heterojunction. (a1) TDOS of H2-adsorbed CuO-ZnO heterojunction; (a2) PDOS of H2-adsorbed CuO-ZnO heterojunction; (b1) TDOS of CO-adsorbed CuO-ZnO heterojunction; (b2) PDOS of CO-adsorbed CuO-ZnO heterojunction; (c1) TDOS of C2H4-adsorbed CuO-ZnO heterojunction; (c2) PDOS of C2H4-adsorbed CuO-ZnO heterojunction.
Nanomaterials 15 00856 g004
Figure 5. HOMO and LUMO distribution before and after gas adsorption on the CuO-ZnO heterojunction.
Nanomaterials 15 00856 g005
Figure 6. (a) Optimized structure of the Ag2O-ZnO heterojunction. (b) Energy band of the Ag2O-ZnO heterojunction.
Nanomaterials 15 00856 g006
Figure 7. Structural models of H2, CO, and C2H4 adsorption on the Ag2O-ZnO heterojunction. The distance is in Å.
Nanomaterials 15 00856 g007
Figure 8. DCD diagrams of H2, CO, and C2H4 adsorbed Ag2O-ZnO heterojunction.
Nanomaterials 15 00856 g008
Figure 9. TDOS and PDOS of H2-, CO-, and C2H4-adsorbed Ag2O-ZnO heterojunctions. (a1) TDOS of H2-adsorbed Ag2O-ZnO heterojunction; (a2) PDOS of H2-adsorbed Ag2O-ZnO heterojunction; (b1) TDOS of CO-adsorbed Ag2O-ZnO heterojunction; (b2) PDOS of CO-adsorbed Ag2O-ZnO heterojunction; (c1) TDOS of C2H4-adsorbed Ag2O-ZnO heterojunction; (c2) PDOS of C2H4-adsorbed Ag2O-ZnO heterojunction.
Nanomaterials 15 00856 g009
Figure 10. HOMO and LUMO distribution before and after gas adsorption on the Ag2O-ZnO heterojunction.
Nanomaterials 15 00856 g010
Figure 11. (a) Optimized structure of the Cu2O-ZnO heterojunction. (b) Energy band of the Cu2O-ZnO heterojunction.
Nanomaterials 15 00856 g011
Figure 12. Structural models of H2, CO, and C2H4 adsorption on the Cu2O-ZnO heterojunction. The distance is in Å.
Nanomaterials 15 00856 g012
Figure 13. DCD diagrams of H2-, CO-, and C2H4-adsorbed Cu2O-ZnO heterojunctions.
Nanomaterials 15 00856 g013
Figure 14. TDOS and PDOS of H2-, CO-, and C2H4-adsorbed Cu2O-ZnO heterojunctions. (a1) TDOS of H2-adsorbed Cu2O-ZnO heterojunction; (a2) PDOS of H2-adsorbed Cu2O-ZnO heterojunction; (b1) TDOS of CO-adsorbed Cu2O-ZnO heterojunction; (b2) PDOS of CO-adsorbed Cu2O-ZnO heterojunction; (c1) TDOS of C2H4-adsorbed Cu2O-ZnO heterojunction; (c2) PDOS of C2H4-adsorbed Cu2O-ZnO heterojunction.
Nanomaterials 15 00856 g014
Figure 15. HOMO and LUMO distribution before and after gas adsorption on Cu2O-ZnO heterojunctions.
Nanomaterials 15 00856 g015
Table 1. Adsorption parameters of H2, CO, and C2H4 gas molecules on the CuO-ZnO heterojunction.
SystemDistance (Å)Eads (eV)Qt (e)
H2/CuO3.018−0.1600.008
CO/CuO2.543−0.2800.070
C2H4/CuO2.590−0.5780.159
H2/ZnO2.938−0.6380.005
CO/ZnO2.151−0.7700.234
C2H4/ZnO2.426−1.0550.227
H2/CuO-ZnO2.942−0.1610.011
CO/CuO-ZnO2.480−0.2920.090
C2H4/CuO-ZnO2.239−0.9220.326
Table 2. Adsorption parameters of H2, CO, and C2H4 gas molecules on the Ag2O-ZnO heterojunction.
SystemDistance (Å)Eads (eV)Qt (e)
H2/Ag2O2.116−1.4360.133
CO/Ag2O2.042−2.1330.306
C2H4/Ag2O2.337−2.3850.323
H2/Ag2O-ZnO1.991−0.3460.160
CO/Ag2O-ZnO2.026−1.0830.305
C2H4/Ag2O-ZnO2.284−1.3000.295
Table 3. Adsorption parameters of H2, CO, and C2H4 gas molecules on the Cu2O-ZnO heterojunction.
SystemDistance (Å)Eads (eV)Qt (e)
H2/Cu2O2.678−0.1440.005
CO/Cu2O1.809−1.4900.380
C2H4/Cu2O2.070−1.3790.382
H2/Cu2O-ZnO1.660−0.5920.278
CO/Cu2O-ZnO1.799−1.7450.376
C2H4/Cu2O-ZnO2.060−1.6490.375
Disclaimer/Publisher’s Note: The statements, opinions and data contained in all publications are solely those of the individual author(s) and contributor(s) and not of MDPI and/or the editor(s). MDPI and/or the editor(s) disclaim responsibility for any injury to people or property resulting from any ideas, methods, instructions or products referred to in the content.

