Article

Probing Acidic and Defective Sites in Sulfated UiO-66 and ZrO2 via Adsorptive FTIR Spectroscopy

by
Vera V. Butova
1,2,*,
Olga A. Burachevskaia
3,
Nikola L. Drenchev
1,
Andrei A. Tereshchenko
3 and
Konstantin I. Hadjiivanov
1,*
1
Institute of General and Inorganic Chemistry, Bulgarian Academy of Sciences, 1113 Sofia, Bulgaria
2
Academy of Biology and Biotechnology, Southern Federal University, 344090 Rostov-on-Don, Russia
3
The Smart Materials Research Institute, Southern Federal University, 344090 Rostov-on-Don, Russia
*
Authors to whom correspondence should be addressed.
Nanomaterials 2025, 15(11), 779; https://doi.org/10.3390/nano15110779
Submission received: 15 April 2025 / Revised: 15 May 2025 / Accepted: 19 May 2025 / Published: 22 May 2025
(This article belongs to the Section Inorganic Materials and Metal-Organic Frameworks)

Abstract

:
Sulfation is a common strategy to enhance the acidity and modify the adsorption properties of metal–organic frameworks (MOFs), yet its impact on the coordination and accessibility of active sites remains unclear. In this study, we investigate two structurally related systems—sulfated UiO-66 (UiO-66-SO4) and sulfated tetragonal zirconia (S-ZrO2)—by FTIR spectroscopy with probe molecules. Isotope exchange experiments on S-ZrO2 reveal that dehydration above 250 °C induces tridentate SO4 coordination, while hydration leads to a reversible transition to a bidentate coordination mode. In UiO-66-SO4, sulfates are coordinated in a bidentate fashion to Zr6O6 clusters, significantly affecting the accessibility of Zr sites in defective pores. This coordination prevents CO adsorption but allows acetonitrile adsorption even after room temperature activation. Unlike S-ZrO2, due to its lower thermal stability, UiO-66-SO4 cannot be evacuated at high temperatures and dehydration at 250 °C does not induce tridentate coordination. The presence of H-bonded hydroxyls in UiO-66-SO4 after activation at 250 °C supports this coordination model, indicating the formation of OH-coordinated Zr sites that are inaccessible to CO but interact with stronger bases like acetonitrile. Overall, this study provides new insights into the coordination chemistry of sulfated UiO-66 and highlights that sulfation can tune acidity and adsorption in MOFs for potential catalytic and adsorption applications.

1. Introduction

Zirconia (ZrO2) is extensively used in catalysis due to its acid–base properties and high thermal stability [1,2]. It serves as an active component in various catalytic processes, including hydrocarbon isomerization, alkylation, esterification, and oxidative dehydrogenation [3,4,5,6]. Moreover, zirconia is commonly employed as a support in heterogeneous catalysis, for example, in hydrodesulfurization catalysts, where it enhances the dispersion and stability of active metal species [7,8]. It is also incorporated into alumina-based catalysts in fluid catalytic cracking to improve thermal stability and acidity, enhancing overall catalytic performance [9,10]. At atmospheric pressure, ZrO2 exists in three different crystalline phases: monoclinic, tetragonal, and cubic. While the monoclinic phase is thermodynamically stable at room temperature, the tetragonal modification can be stabilized through doping or by reducing the particle size to the nanoscale [11,12,13]. The tetragonal phase, in particular, exhibits superior catalytic properties due to its higher surface energy, increased oxygen mobility, and enhanced acid strength. To further improve the catalytic activity of zirconia-based materials, surface modification strategies have been widely explored. One such approach involves the introduction of sulfate groups (SO42−), which significantly enhance the surface acidity [14]. Sulfated zirconia (S-ZrO2) has been extensively studied and applied as a catalyst in various acid-catalyzed reactions, including the isomerization of alkanes, esterification, and biodiesel production [15,16].
UiO-66, a metal-organic framework (MOF) composed of Zr6O4(OH)4 clusters connected by terephthalate linkers, exhibits a structural similarity to tetragonal zirconia [17,18]. The ideal UiO-66 framework is highly stable due to the strong covalent bonding of each Zr6O4(OH)4 cluster with 12 organic linkers, resulting in a low concentration of accessible active sites. Consequently, pristine UiO-66 typically lacks significant catalytic activity. However, structural defects can be introduced during synthesis or post-synthetic treatment when some linkers are removed, leading to the formation of coordinatively unsaturated Zr sites within defective pores [19,20,21]. These Zr centers can act as Lewis acid sites and influence the material’s catalytic behavior.
In our previous work, we studied the accessibility of zirconium sites in defective UiO-66 and found that using benzoic acid as a modulator during synthesis promoted defect formation [20]. However, the resulting Zr sites were blocked by strongly bound benzoate anions, making them inaccessible. This material, referred to as UiO-66-BA, served as a reference for defective UiO-66 with blocked Zr sites. To make the Zr centers accessible, we applied a post-synthetic acid treatment that removed the benzoate anions. The resulting material, denoted as UiO-66-FA, retained the defective pore structure but had open Zr sites, making it suitable for further catalytic applications and post-synthetic modifications. In the present study, we use this approach to functionalize UiO-66 with sulfate groups and investigate their coordination and impact on active site accessibility.
Several studies have reported the incorporation of sulfate groups into zirconium-based MOFs, including UiO-66 (see examples in Table S1) [22,23,24,25,26,27,28,29]. For example, UiO-66 functionalized with sulfate groups demonstrated superior performance in gas-phase isobutene dimerization [22]. Similarly, the introduction of sulfate groups into MOF-808 resulted in the formation of a superacid due to the presence of Zr-bound sulfate species [23]. Treating UiO-66 with sulfuric acid led to simultaneous etching and the incorporation of SO4 groups, yielding materials that exhibited five times higher catalytic activity in the acetalization of benzaldehyde with methanol compared to untreated UiO-66 [30]. Despite the advantages that sulfation brings to UiO-66, the exact structure of sulfated materials remains unknown. The complexity of MOFs, composed of inorganic clusters and organic linkers, is further influenced by defects and guest molecules. For example, the IR spectrum of UiO-66 is dominated by linker bands, which obscure the identification of sulfate groups. Additionally, adsorbed water and residual solvents further complicate spectral analysis. Moreover, UiO-66 has lower thermal stability compared to zirconia, making some experimental approaches used for ZrO2 inapplicable for UiO-66.
Advanced characterization techniques such as X-ray photoelectron spectroscopy (XPS) and X-ray absorption near-edge structure (XANES) have been employed to study the structure and properties of S-ZrO2 [31,32,33]. In particular, infrared (IR) spectroscopy is a powerful tool for investigating the structural and chemical properties of solid surfaces. It enables the identification of surface functional groups, coordination environments, and adsorbed species, making it essential for understanding the behavior of catalysts and other functional materials [34,35]. However, the technique has limitations, particularly when it comes to detecting minor surface species or resolving overlapping vibrational bands. These challenges are especially pronounced when surface features are disordered or present at low concentrations.
An important example of surface modification where such complexities arise is sulfation, a widely used strategy to enhance the acidity and catalytic performance of materials. Even at low concentrations, sulfate groups can significantly influence the nature and accessibility of active sites, yet their detection and characterization can be difficult due to their weak or overlapping IR signals. To overcome these limitations, FTIR analysis can be complemented by advanced techniques such as the use of probe molecules, which interact selectively with specific surface sites, or isotopic substitution, which shifts vibrational bands and helps to distinguish between overlapping features. These approaches greatly improve the sensitivity and specificity of FTIR measurements, enabling a deeper understanding of how surface modifications influence material performance. Particularly, FTIR spectroscopy with probe molecules provided valuable insights into the nature of active sites and the interaction of sulfate groups with the zirconia surface [14,35,36]. Given the structural similarity between tetragonal zirconia and the inorganic clusters in UiO-66, findings from S-ZrO2 studies can offer useful insights into understanding the structure of sulfated UiO-66.
In this study, we apply IR spectroscopy to analyze the structure of S-ZrO2 and compare the obtained data with UiO-66-SO4. By probing the nature and accessibility of the active sites in these materials, we provide insights into their structural and catalytic properties.

2. Materials and Methods

2.1. Synthesis

The starting materials, zirconium tetrachloride (ZrCl4), zirconyl chloride (ZrOCl2), 1,4-benzene dicarboxylic acid (H2BDC), N, N-dimethylformamide (DMF), benzoic acid (BA), hydrochloric acid (37%), ammonium sulfate, ammonium hydroxide, acetone, and methanol, were purchased from Alfa Aesar (Ward Hill, MA, USA) and used without additional purification. Distilled water was purified via a Simplicity UV ultrapure water system (Millipore SAS, Molsheim, France).
Sulfated zirconia. Zirconia was prepared by adding 12% NH3 solution to 0.07 M ZrOCl2 solution until the pH reached 7. The resulting precipitate was filtered, thoroughly washed with water, dried, and calcined at 550 °C for 1 h. The obtained material was then suspended in 0.1 M H2SO4 for 20 h, washed with 0.01 M H2SO4, and finally calcined at 500 °C.
UiO-66-BA. We used the original procedure to obtain the UiO-66-BA sample [37]. Briefly, ZrCl4 was dissolved in DMF, and deionized water was added to the solution. BA was mixed in and stirred at room temperature until a clear solution was achieved. H2BDC was added and dissolved. The molar ratio of ZrCl4:H2BDC:H2O:DMF:BA was 1:1:3:300:10. The reaction mixture was then placed in an oven and heated at 120 °C for 24 h. After synthesis, a white precipitate formed and was collected by centrifugation. Then, it was washed twice with pure DMF and methanol. Finally, the washed precipitate was dried at 60 °C overnight to obtain the UiO-66-BA sample.
UiO-66-FA. We employed a modified procedure based on published data [20,38] for the post-synthetic treatment of the UiO-66-BA sample. In this process, 50 mg of UiO-66-BA sample was combined with 15 mL of DMF and 0.625 mL of 8M HCl. The mixture was stirred thoroughly and loosely covered with a watch glass. Subsequently, the flask and its contents were heated at 100 °C for 24 h in a preheated oven. After the treatment, a microcrystalline powder formed, which was separated from the mixture via centrifugation. The powder was then washed three times with fresh DMF. Lastly, the precipitate was separated from the solvent by centrifugation and dried overnight in an oven set to 60 °C. As shown below, formate ions were generated due to DMF hydrolysis, modifying the UiO-66-BA sample. Therefore, this modified sample is referred to as UiO-66-FA in the text.
UiO-66-SO4. Briefly, 50 mg of UiO-66-FA was mixed with ammonium sulfate solution (33 mg of (NH4)2SO4 in 2.5 mL of H2O). The suspension was mixed at room temperature for 72 h. After this, the precipitate was collected via centrifugation and washed twice with acetone. Finally, the powder was dried at 60 °C for 24 h.

2.2. Characterization

X-ray powder diffraction (XRD) patterns were recorded using a Bruker D2 PHASER diffractometer (Bruker AXS Inc., Fitchburg, WI, USA) over a 2θ range of 5–90°, with a step size of 0.01°, employing CuKα radiation (λ = 1.5417 Å). The obtained diffraction profiles were analyzed using Jana 2006 software (version 30/11/2014) [39].
Attenuated total reflection infrared (ATR-IR) spectra were acquired ex situ using a Bruker Vertex 70 spectrometer (Bruker Optik GmbH, Ettlingen, Germany). The measurements covered a spectral range of 4000–500 cm−1 with a resolution of 1 cm−1. Data collection was performed over 64 scans using an MCT detector and a Bruker Platinum ATR attachment (Bruker Optik GmbH, Ettlingen, Germany).
Raman spectroscopy was performed using Renishaw inVia Raman microscope (Enhanced Spectrometry Inc., Meridian, MS, USA) with a 532 nm (green) diode laser as the excitation source. Spectra were recorded within the 100–1700 cm−1 range and analyzed using Origin 9 software. Additionally, micro X-ray fluorescence (XRF) analysis was conducted using a Bruker M4 TORNADO 2D Micro-XRF spectrometer (Bruker, Billerica, MA, USA).

2.3. In Situ FTIR Experiments

In situ Fourier-transform infrared (FTIR) spectroscopy of self-supporting pellets was carried out using a Nicolet 6700 FTIR spectrometer (Thermo Fisher Scientific, Waltham, MA, USA), where each spectrum was obtained by accumulating 64 scans at a resolution of 2 cm−1. The pellets were prepared from sample powders and examined within a custom-designed IR cell, which allowed measurements at ambient conditions as well as at low temperature (−173 °C). The IR cell was connected to a vacuum adsorption system, maintaining a residual pressure below 10−3 Pa.
Activation. The S-ZrO2 sample was initially calcined in air at 470 °C for 3 h to remove potential organic impurities and then cooled to room temperature in an open vessel. It was subsequently evacuated during gradual heating from room temperature to 470 °C. The UiO-66 samples underwent stepwise evacuation under a dynamic vacuum, with heating from 25 °C to 250 °C. At selected temperatures, each sample was heated under a dynamic vacuum, cooled to room temperature, and then analyzed. After activation, the samples were rehydrated by exposure to 5 mbar of water vapor for 15 min, followed by evacuation at room temperature under a residual pressure below 10−3 Pa for 15 min.
Adsorption experiments. Before the adsorption studies, the activated and rehydrated samples were evacuated at 25 °C and then at 250 °C (for the UiO-66 samples) or 450 °C (for the S-ZrO2 sample). Adsorption experiments were performed by introducing 5 mbar of either CO (Merck, Darmstadt, Germany, 99.5% purity) or CD3CN (Merck, Darmstadt, Germany, deuteration degree 99.96%) into the IR cell. After exposure, the adsorbed gases were gradually diluted, followed by controlled step-wise evacuation. CO adsorption experiments were carried out at liquid nitrogen temperature, while CD3CN was adsorbed at room temperature.
Isotopic substitution. To substitute 16O with 18O in the S-ZrO2 sample, the material was first evacuated at 470 °C for 3 h to ensure complete dehydration. It was then exposed to 20 mbar of H218O vapor (isotopic purity of 97 atom% 18O) at 470 °C for 3 h, followed by evacuation at the same temperature for 2 h. The sample was subsequently cooled under a dynamic vacuum, and its IR spectrum was recorded. This procedure was repeated to achieve a stepwise exchange of oxygen isotopes.

3. Results

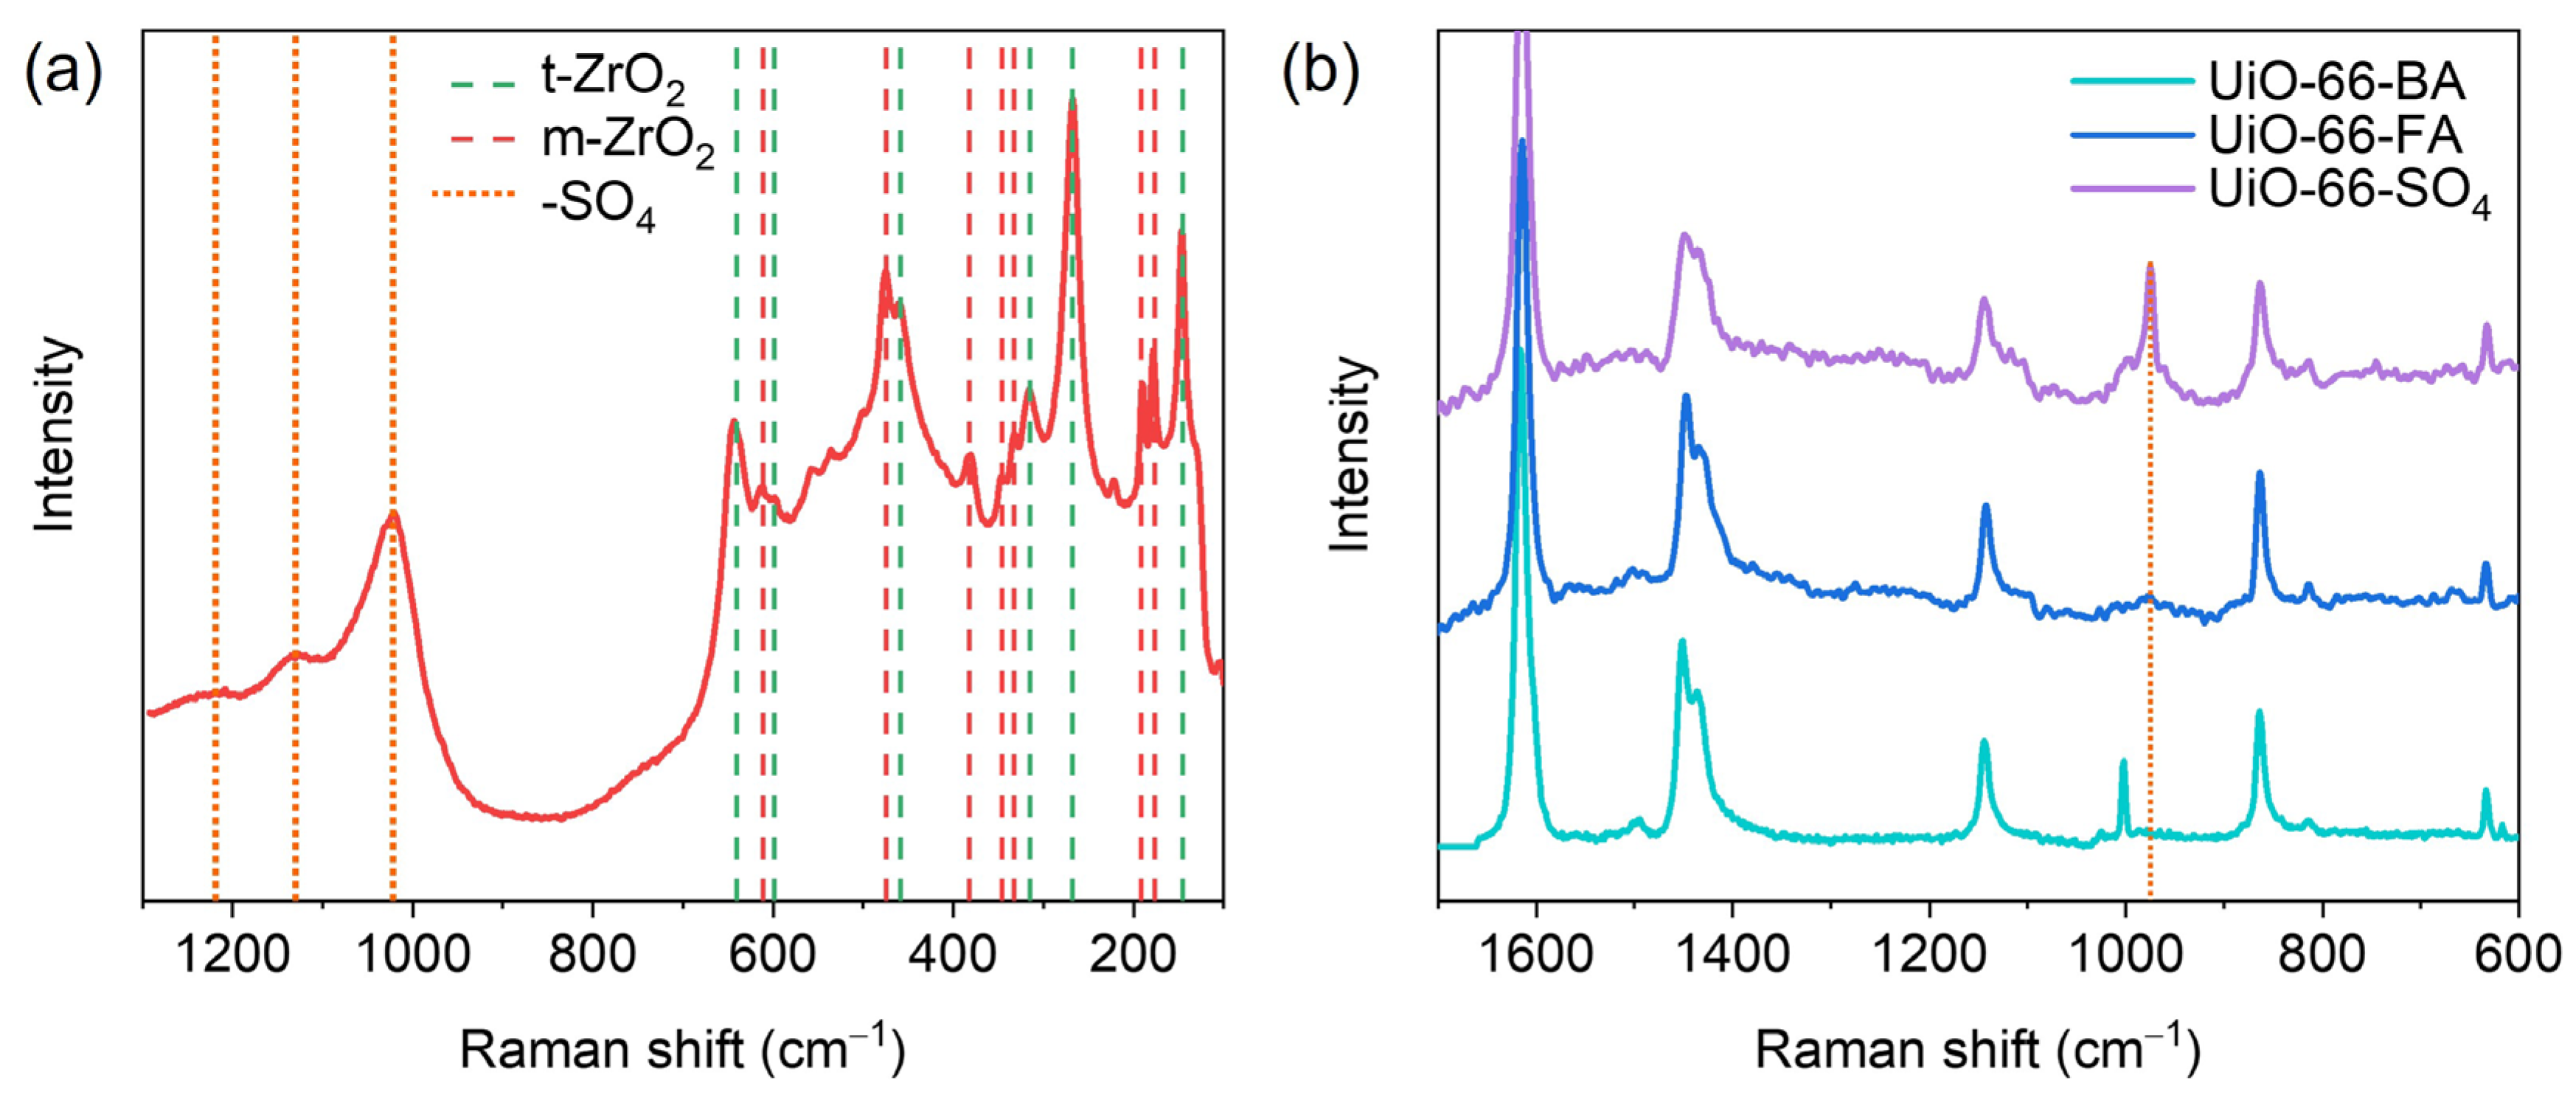
3.1. Basic Characterization

Powder XRD analysis revealed that the S-ZrO2 sample consisted of a pure tetragonal ZrO2 phase, with reflections fitting the P 42/nmc (137) space group (Figure 1a). The unit cell parameters were determined as follows: a = b = 3.5970(8) Å and c = 5.1841(15) Å (see Tables S2 and S3 for further details) [11,40,41,42]. Peak broadening analysis suggested that the sample consisted of nanoparticles with an average size of approximately 15 nm (Table S4).
The UiO-66-BA, UiO-66-FA, and UiO-66-SO4 samples exhibited a single-phase UiO-66 structure, as confirmed by XRD analysis (Figure 1b and Figure S1b, Tables S2 and S3) [43,44,45]. All reflections were indexed to a cubic symmetry with the space group Fm-3m. Despite undergoing post-synthetic treatments, the samples retained their structural integrity, showing no evidence of structural collapse or the formation of new phases.
The Raman spectrum of the S-ZrO2 sample is shown in Figure 2a. The most intense bands at 267, 315, 457, 600, and 644 cm−1 corresponded to the tetragonal ZrO2 phase. Additionally, the spectrum featured bands at 192, 335, 346, 382, 475, 612, and 636 (shoulder) cm−1, which were characteristic of the monoclinic ZrO2 phase [46]. While the presence of a minor monoclinic phase cannot be ruled out—possibly in an amorphous form or in an amount too small for XRD detection—the surface modification of zirconia with sulfate groups may also have contributed to these spectral features. Sulfation introduces structural distortions and surface species that can alter zirconia’s vibrational modes. The tetragonal phase has higher symmetry than the monoclinic phase, but sulfate coordination can lower this symmetry, producing vibrational characteristics similar to those of monoclinic ZrO2. Since these effects are surface-localized, they are detectable by Raman spectroscopy, a surface-sensitive technique, whereas XRD primarily reflects the bulk structure. Therefore, we concluded that the dominant phase in the S-ZrO2 sample was tetragonal, with surface-localized features of reduced symmetry likely arising from sulfation.
The Raman spectra of the UiO-66 samples aligned well with data reported in the literature [19,47]. In the case of the UiO-66-BA sample, an additional band at 1000 cm−1 was observed, which was attributed to benzoate ions. After treatment with HCl, these benzoate residues were removed, as evidenced by the absence of this band in the spectrum of the UiO-66-FA sample (Figure 2b).
Sulfate groups exhibit characteristic bands in Raman spectra, reflecting their vibrational modes: the S-ZrO2 sample showed three broad bands at 1020, 1135, and 1240 cm−1, and the UiO-66-SO4 sample displayed a sharp band at 975 cm−1 [48]. XRF analysis of the S-ZrO2 sample, conducted without any pre-treatment such as heating or evacuation, revealed an S:Zr ratio of approximately 0.08:1, confirming the presence of sulfate species. Similarly, the UiO-66-SO4 samples, also analyzed without pre-treatment, exhibited an S:Zr ratio of 0.4:1.
The IR spectrum of the as-prepared S-ZrO2 sample, recorded in ATR geometry, contained bands attributed to Zr–O bonds in ZrO2, as well as a band at 1620 cm−1 corresponding to water molecules [49,50] (Figure S2a). Figure 3a highlights the spectral region of S-ZrO2 associated with SO4 groups. A complex feature appeared in the 1300–900 cm−1 range, consisting of at least five bands. These bands were characteristic of surface-bonded SO42− ions, with a symmetric S–O stretching band at 998 cm−1 and asymmetric S–O stretching bands at 1047, 1070, 1126, and 1215 cm−1 [48,50].
The positions of the bands attributed to SO4 groups in the UiO-66-SO4 and S-ZrO2 spectra were similar, with only small shifts likely caused by adsorbed water molecules or linker effects (Figure S2b). Therefore, we propose that insights gained from studying sulfated zirconia can be applied to UiO-66-SO4. This approach aids in identifying key spectral features, despite strong linker bands overlapping with the fingerprint region in the IR spectrum.
In summary, the S-ZrO2 sample primarily consisted of tetragonal ZrO2 nanoparticles, with their surface decorated by SO4 groups, as confirmed by Raman, IR, and XRF analyses. XRD analysis verified that the UiO-66-BA, UiO-66-FA, and UiO-66-SO4 samples retained their single-phase UiO-66 structure despite undergoing post-synthetic treatments. The Raman and IR spectra aligned with the literature data, showing that UiO-66-BA exhibited a characteristic band from benzoate ions, which disappeared after HCl treatment in UiO-66-FA. Based on the analytical results and our recent findings, UiO-66-BA contained defective pores where zirconium ions were coordinated with benzoate residues [20]. Treatment with HCl in DMF led to the replacement of benzoate residues with formate ions. The hydrolysis of DMF in the presence of HCl resulted in formic acid formation, which contributed to the incorporation of formate species. Since formate ions are smaller and bind more weakly to Zr ions, thermal activation at 250 °C partially removed them, creating accessible Zr sites in defect pores within the UiO-66-FA sample. The introduction of sulfate groups into the UiO-66-FA sample, which contained accessible Zr ions in defect pores, led to the formation of UiO-66-SO4. The successful functionalization of UiO-66-FA with sulfate groups was confirmed by XRF, Raman, and IR spectroscopy analyses of the UiO-66-SO4 sample.

3.2. In Situ FTIR Background

Evacuation at different temperatures can influence surface properties by removing guest molecules. To study this effect, we conducted a stepwise evacuation of both S-ZrO2 and UiO-66-SO4 samples, tailoring the procedure to account for their differing thermal stabilities. For the in situ FTIR experiments, the S-ZrO2 sample was evacuated at the desired temperature up to 470 °C (Figure 4a and Figure S3 in SI). By contrast, UiO-66-SO4, which had lower thermal stability, was subjected to evacuation during gradual heating from 25 °C to 250 °C. This process effectively removed guest molecules from the MOF’s pores (see Figures S4 and S5 in SI). Following this, the sample was rehydrated in water vapor for 15 min at room temperature and then evacuated at the desired temperature for analysis.
After room temperature outgassing, both samples exhibited a broad band around 3345 cm−1 in their FTIR spectra due to ν(OH) modes of H-bonded hydroxyls (Figure 4a,b). At least part of this band was associated with adsorbed water molecules, as indicated by the appearance of δ(H2O) deformation modes at 1630 cm−1 in the spectra of the S-ZrO2 sample. Upon evacuation at higher temperatures, the intensity of these bands decreased significantly, indicating dehydration of the samples. Notably, the UiO-66-SO4 sample adsorbed more water than pristine UiO-66 and retained a significant amount of H2O even at 250 °C. Moreover, broad bands around 3300–3400 cm−1 in the spectrum of UiO-66-SO4 evacuated at 250 °C indicated the presence of H-bonded hydroxyl groups (Figure 4b and Figure S5). These bands were observed only in the spectrum of sulfated UiO-66, while the spectra of UiO-66-BA and UiO-66-FA did not exhibit such features. Thus, the presence of H-bonded hydroxyl groups in UiO-66-SO4 was the result of the sulfation process (see the Section 4 for more details).
As dehydration progressed, isolated OH groups became more pronounced. In the S-ZrO2 sample, this was indicated by the emergence of a band at 3640 cm−1, corresponding to OH groups [51,52]. The very broad band observed in the 2300–3300 cm−1 region of the S-ZrO2 spectrum was attributed to acidic protons formed due to the substitution of terminal OH groups with HSO4 anions [52]. For the UiO-66-SO4 sample, characteristic μ3-OH bands were observed at 3670 cm−1 after evacuation at room temperature but disappeared upon heating to 250 °C. Notably, this process was reversible, as rehydration with water vapor restored the intensity of the OH band.
The bands associated with sulfate groups in UiO-66-SO4 overlapped with those of the linker, complicating their analysis. However, in the case of S-ZrO2, the effects of dehydration were clearly observable. Specifically, the sulfate band at around 1200 cm−1 shifted to 1390 cm−1 after dehydration [50].

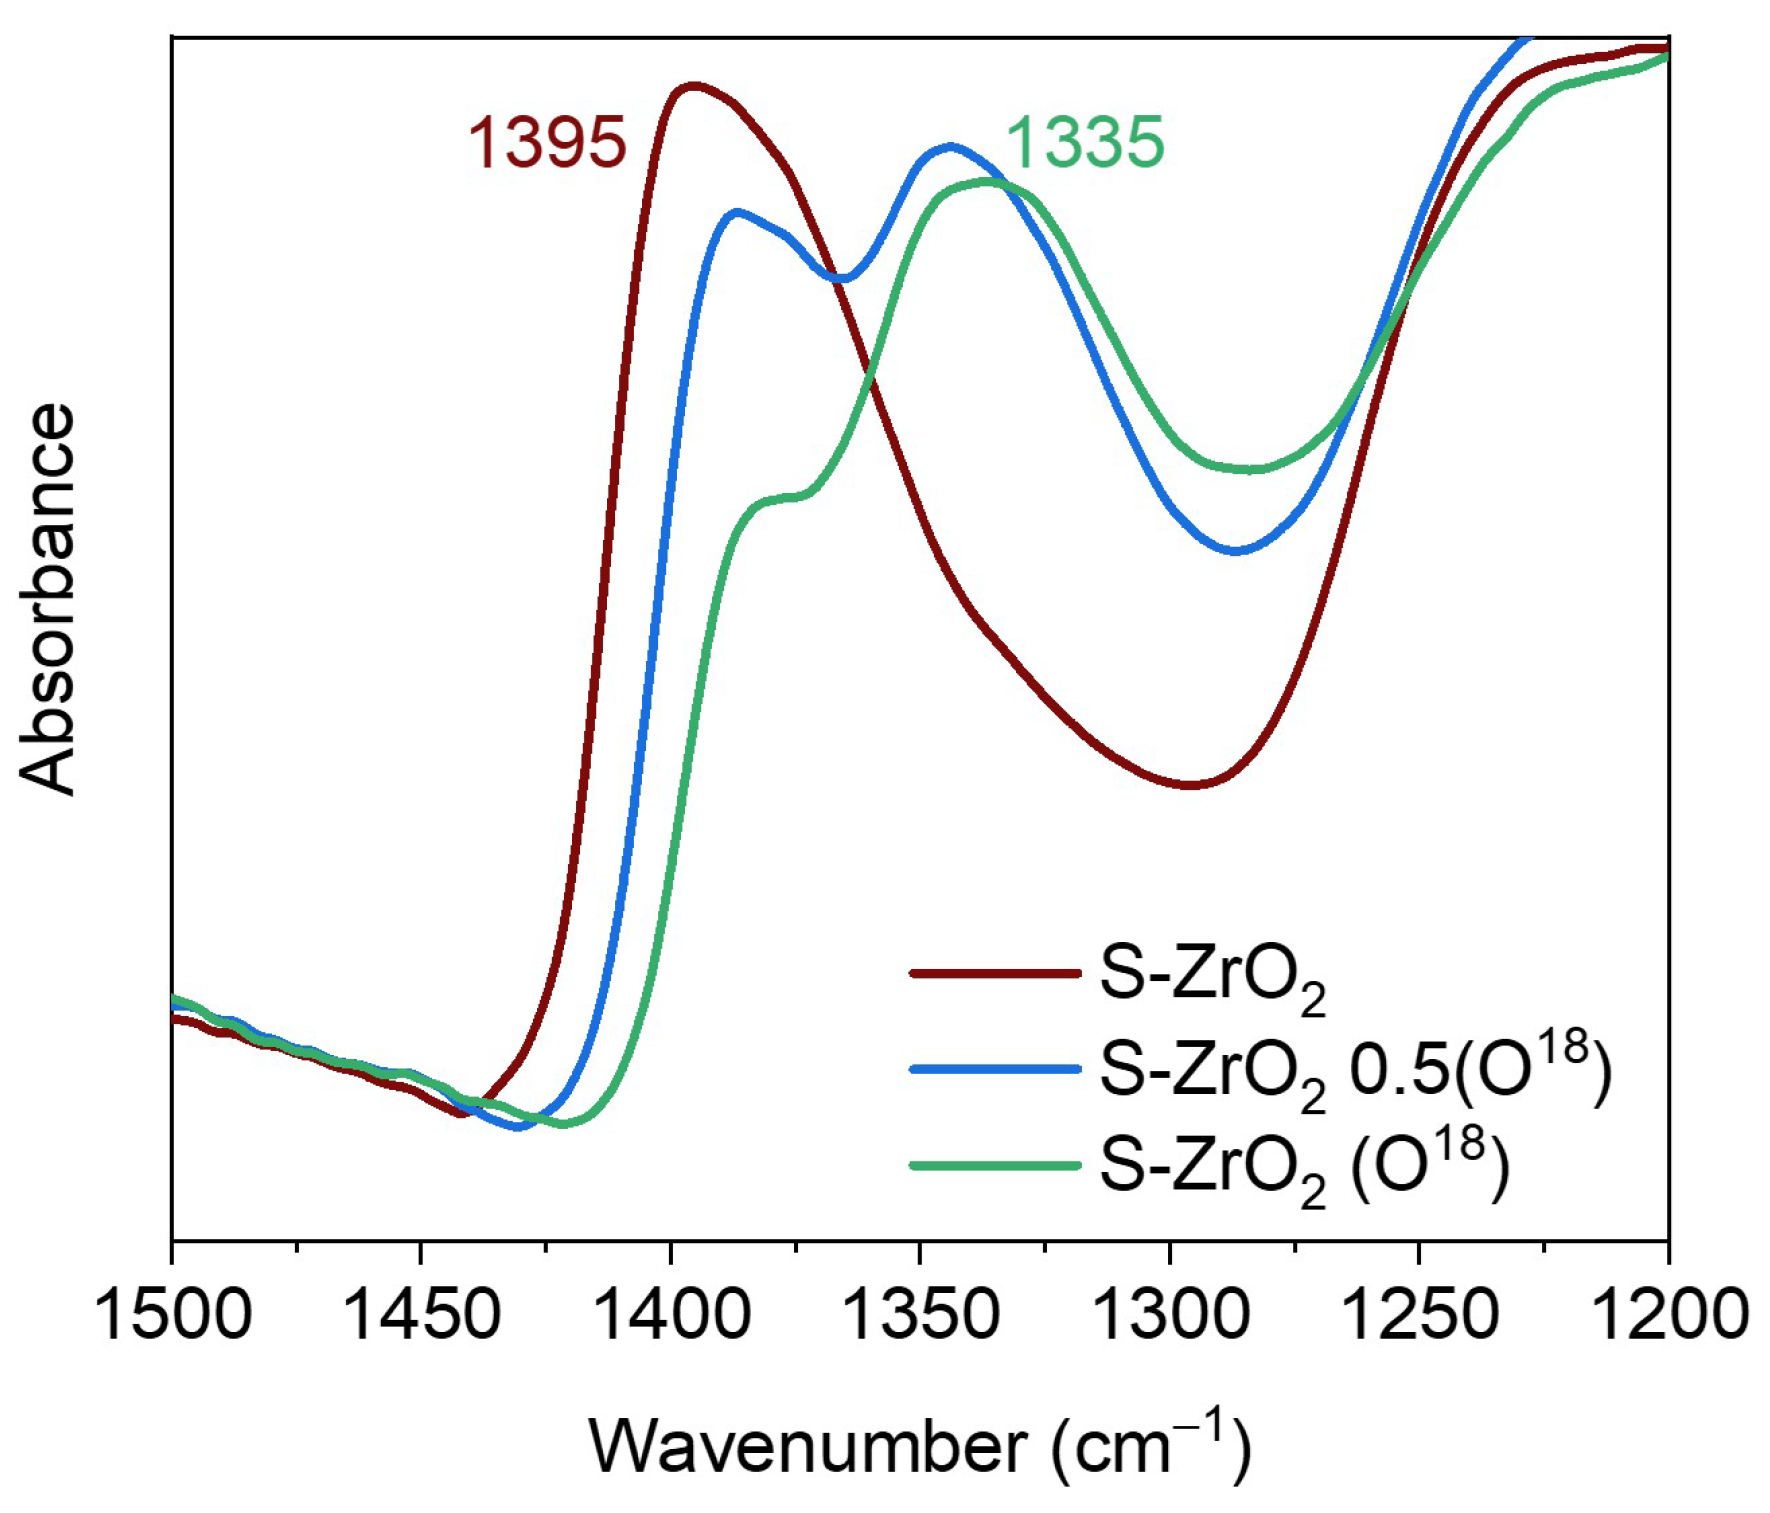
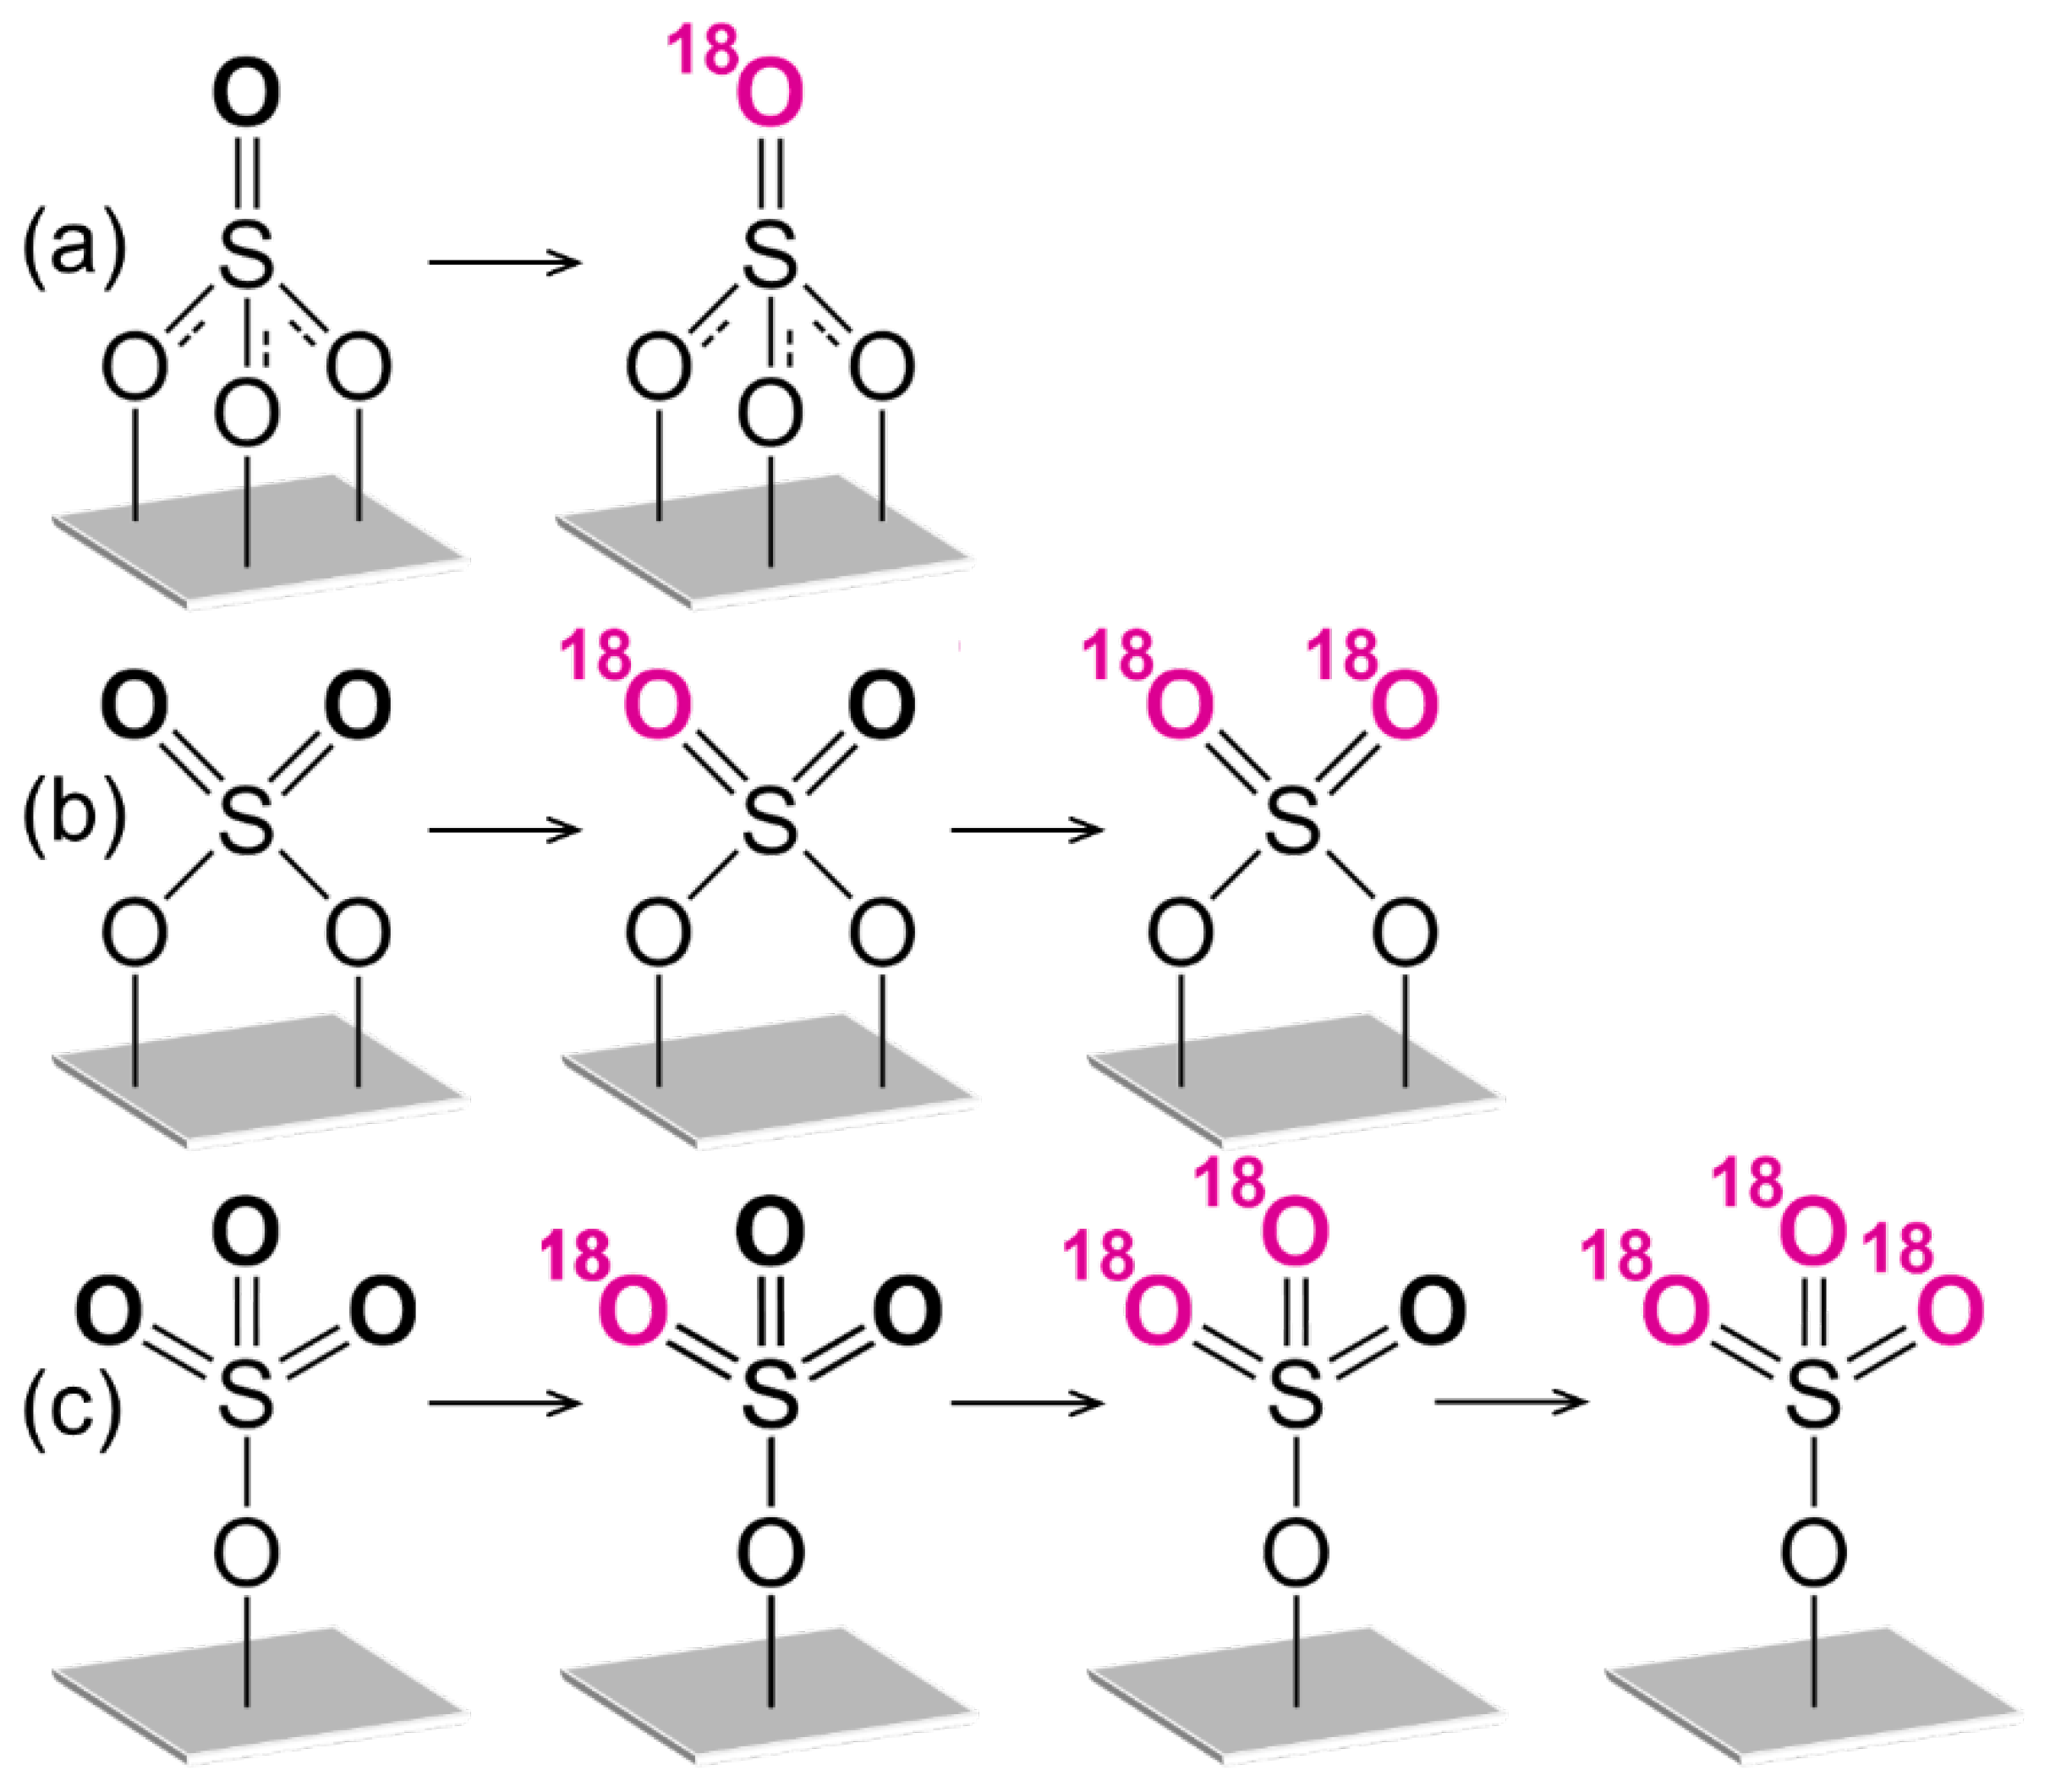
3.3. Oxygen Isotopic Exchange
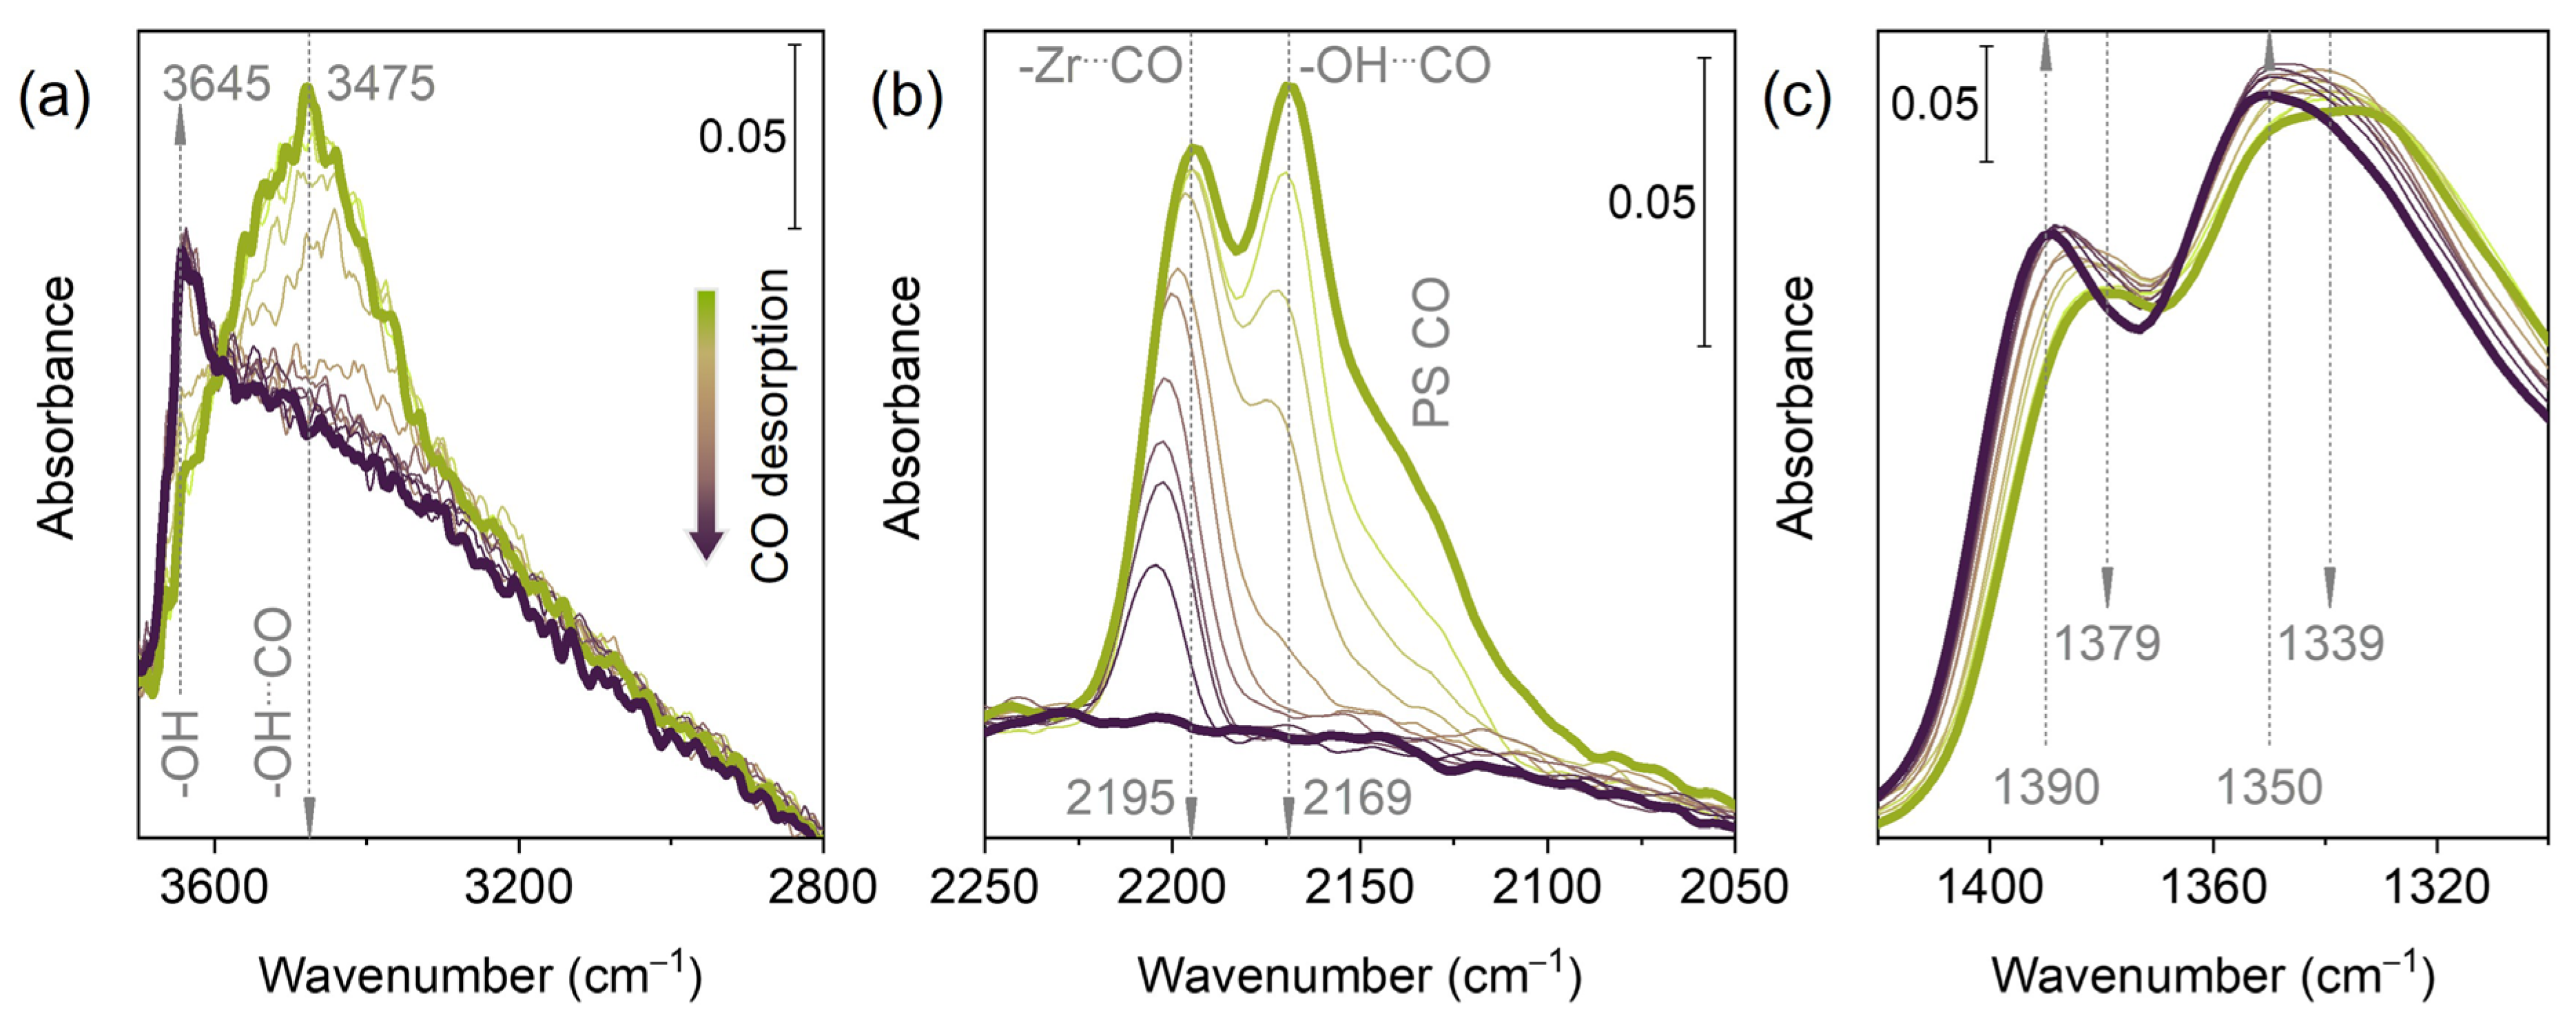
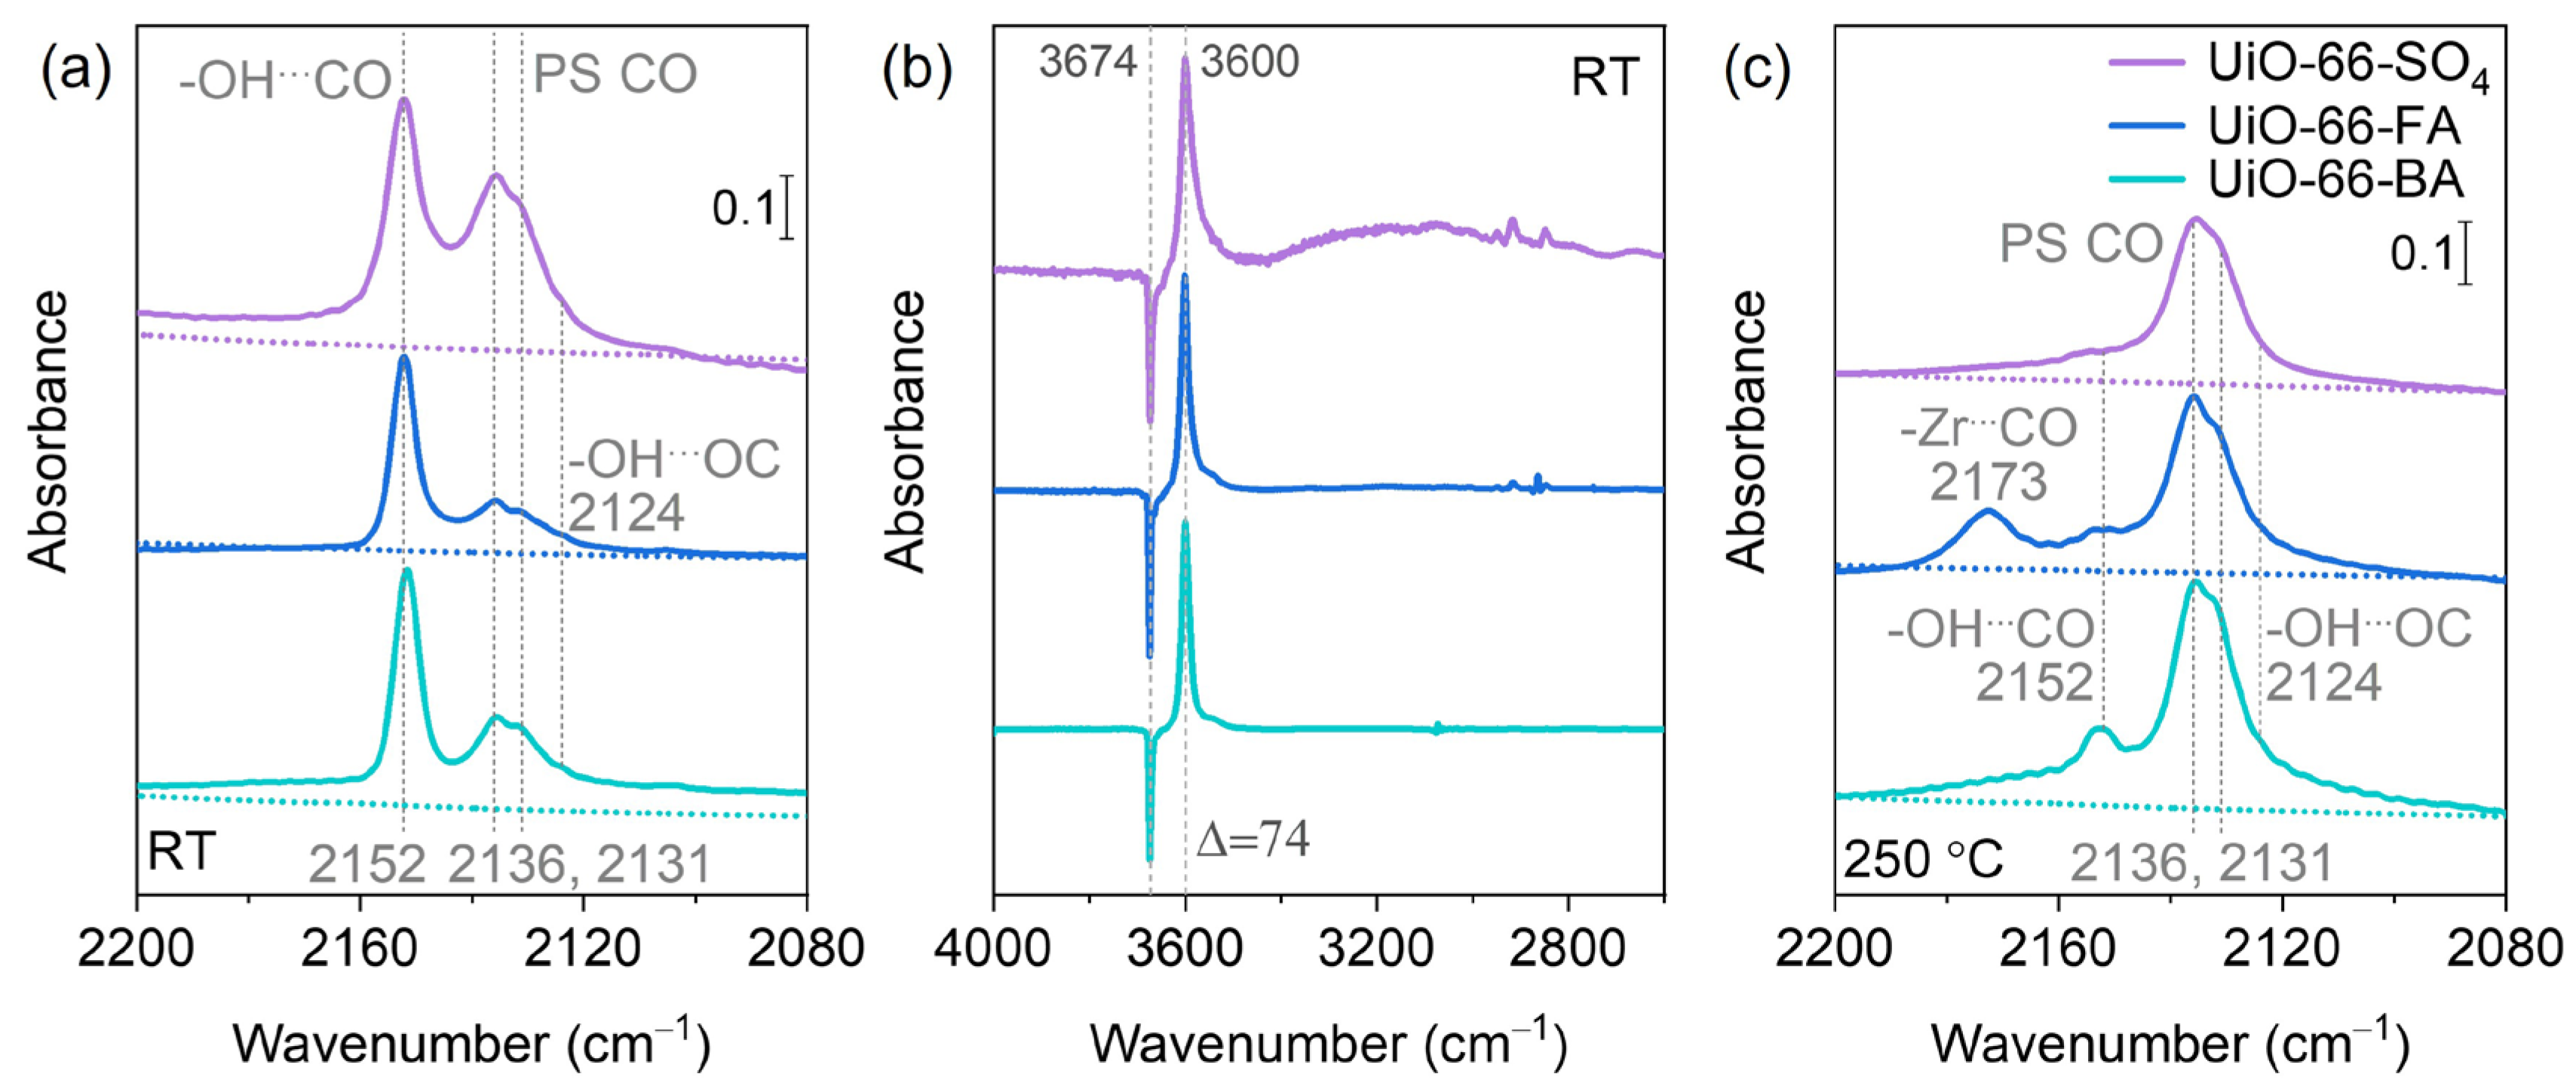
Sulfate groups contain four oxygen atoms and can bond to the zirconia surface through one, two, or three of them [46,49,52,53]. Consequently, depending on the coordination mode, sulfate groups on the surface of the S-ZrO2 sample may have had one, two, or three unbonded oxygen atoms. To investigate the bonding configuration of the SO4 groups, we applied 18O → 16O isotopic substitution.
Figure 5 shows the spectra of activated S-ZrO2 before and after the isotopic exchange. After the first 18O → 16O substitution procedure, the band at 1395 cm−1 declined and partly shifted to 1385 cm−1. At the same time, a new band emerged at 1345 cm−1. The shift coincided well with the theoretical expectations for an S–O bond. The second isotopic exchange resulted in additional erosion and a red shift of the band at 1395 cm−1, as well as the further development of the lower-frequency band. Noticeably, no intermediate band was observed. Therefore, our results unambiguously proved that the 1395 cm−1 band corresponded to isolated S=O moieties, which was consistent with a tridentate coordination of the sulfate ion in the S-ZrO2 sample (see more details in the Section 4).

3.4. CO Adsorption

Carbon monoxide (CO) is a widely used probe molecule in IR experiments because of its weak basic properties, which make it effective for identifying acidic sites on solid surfaces [36,54]. In this study, we employed CO as a probe to investigate the S-ZrO2 and UiO-66 samples.
Figure 6 represents the IR spectrum of the S-ZrO2-18O sample obtained during CO desorption. Two main bands at 2195 and 2169 cm−1 appeared together with an ill-defined shoulder around 2138 cm−1. In the OH region, the band at 3645 cm−1 almost disappeared, and a new, broader, and more intense band at 3475 cm−1 emerged, evidencing OH–CO interaction. The shoulder at 2138 cm−1 was very sensitive to the equilibrium pressure and quickly disappeared at low pressures. Consequently, it was attributed to physically adsorbed CO. The next band to disappear upon evacuation was that at 2169 cm−1. It changed in concert with the OH band at 3475 cm−1, which allowed it to be attributed to OH⋯CO adducts. The CO-induced shift of the OH modes was 170 cm−1. By comparison, non-sulfated ZrO2 showed a smaller OH band shift of about 90 cm−1 upon CO adsorption [55]. The larger shift observed in the sulfated samples indicated that sulfation enhanced the acidity of the OH groups, resulting in stronger interactions with CO. The band at 2195 cm−1 was attributed to CO adsorption on Zr4+ sites. Notably, this band was observed only after the S-ZrO2 sample was activated at 450 °C, while no such band appeared for the sample activated at room temperature (SI Figure S6). This difference was due to the presence of adsorbed water molecules on the sample evacuated at room temperature, which remained coordinated to Zr4+ sites and blocked CO adsorption. High-temperature activation led to dehydration of the surface, exposing previously inaccessible Zr4+ sites and enabling CO adsorption.
In the IR spectrum of the S-ZrO218O sample, bands at 1390 and 1350 cm−1 were attributed to sulfate groups. Upon exposure to CO, these bands gradually shifted to 1379 and 1339 cm−1. A similar effect has been reported for sulfated titania [56]. This shift of the ν(S–O) modes upon CO adsorption was likely due to electronic inductive effects.
After room temperature activation, all three UiO-66 samples—UiO-66-BA, UiO-66-FA, and UiO-66-SO4—contained μ3-OH groups with Brønsted acidic properties. Adsorption of CO onto the μ3-OH groups of Zr6O4(OH)4 clusters in all UiO-66 samples resulted in the appearance of a C–O stretching band at 2152 cm−1 (Figure 7a). This band corresponded to the stretching vibration of CO molecules hydrogen-bonded to the μ3-OH group via the carbon atom (μ3-OH⋯C≡O). Additionally, bands at 2131 and 2136 cm−1 were attributed to physically adsorbed CO [21]. A weak band at 2124 cm−1, assigned to CO bonded to the μ3-OH group via its oxygen atom (μ3-OH⋯O≡C), was also detected [21,57]. The much lower intensity of this band compared to the μ3-OH⋯C≡O adducts showed that CO preferentially formed hydrogen bonds through its carbon atom. CO adsorption also caused a shift of the μ3-O–H stretching band (Figure 7b), confirming the formation of μ3-OH⋯C≡O adducts. All three UiO-66 samples exhibited a similar shift of approximately 74 cm−1 upon CO adsorption.
A careful inspection of the spectra revealed a low-intensity, broad band extending from 3400 to 2900 cm−1, which appeared only with the UiO-66-SO4 sample (Figure 7b). This band indicated the presence of H-bonded hydroxyls. The corresponding negative band was likely unidentifiable due to its low intensity and broad linewidth. In any case, this band suggested the existence of OH groups with enhanced acidity, which were likely associated with the presence of sulfate groups. However, the intensity of this band was not high, as most of the strongly acidic hydroxyls were already involved in H-bond formation before CO adsorption.
Evacuating the samples at 250 °C led to a significant reduction in the intensity of the μ3-OH bands around 3674 cm−1, suggesting that most of the Zr6O4(OH)4 clusters had been converted to Zr6O6 (Figure S7 in SI). Figure 7c presents the spectra of CO adsorbed on UiO-66-BA, UiO-66-FA, and UiO-66-SO4 after evacuation at 250 °C. At this stage, the most intense bands corresponded to physically adsorbed CO (2131 and 2136 cm−1) [21]. Low-intensity bands at 2152 cm−1 were still visible, indicating residual μ3-OH groups. No prominent peaks were detected in the 3500–3700 cm−1 region in the UiO-66-SO4 spectrum, likely due to the signal being at the noise level (Figure S7 in SI).
The spectrum of CO adsorbed on the UiO-66-FA sample revealed a new band at 2173 cm−1, which was absent in the spectra of the UiO-66-BA and UiO-66-SO4 samples. This band was attributed to CO interacting with coordinatively unsaturated Zr4+ sites in defect pores [21,57] (see Section 4).

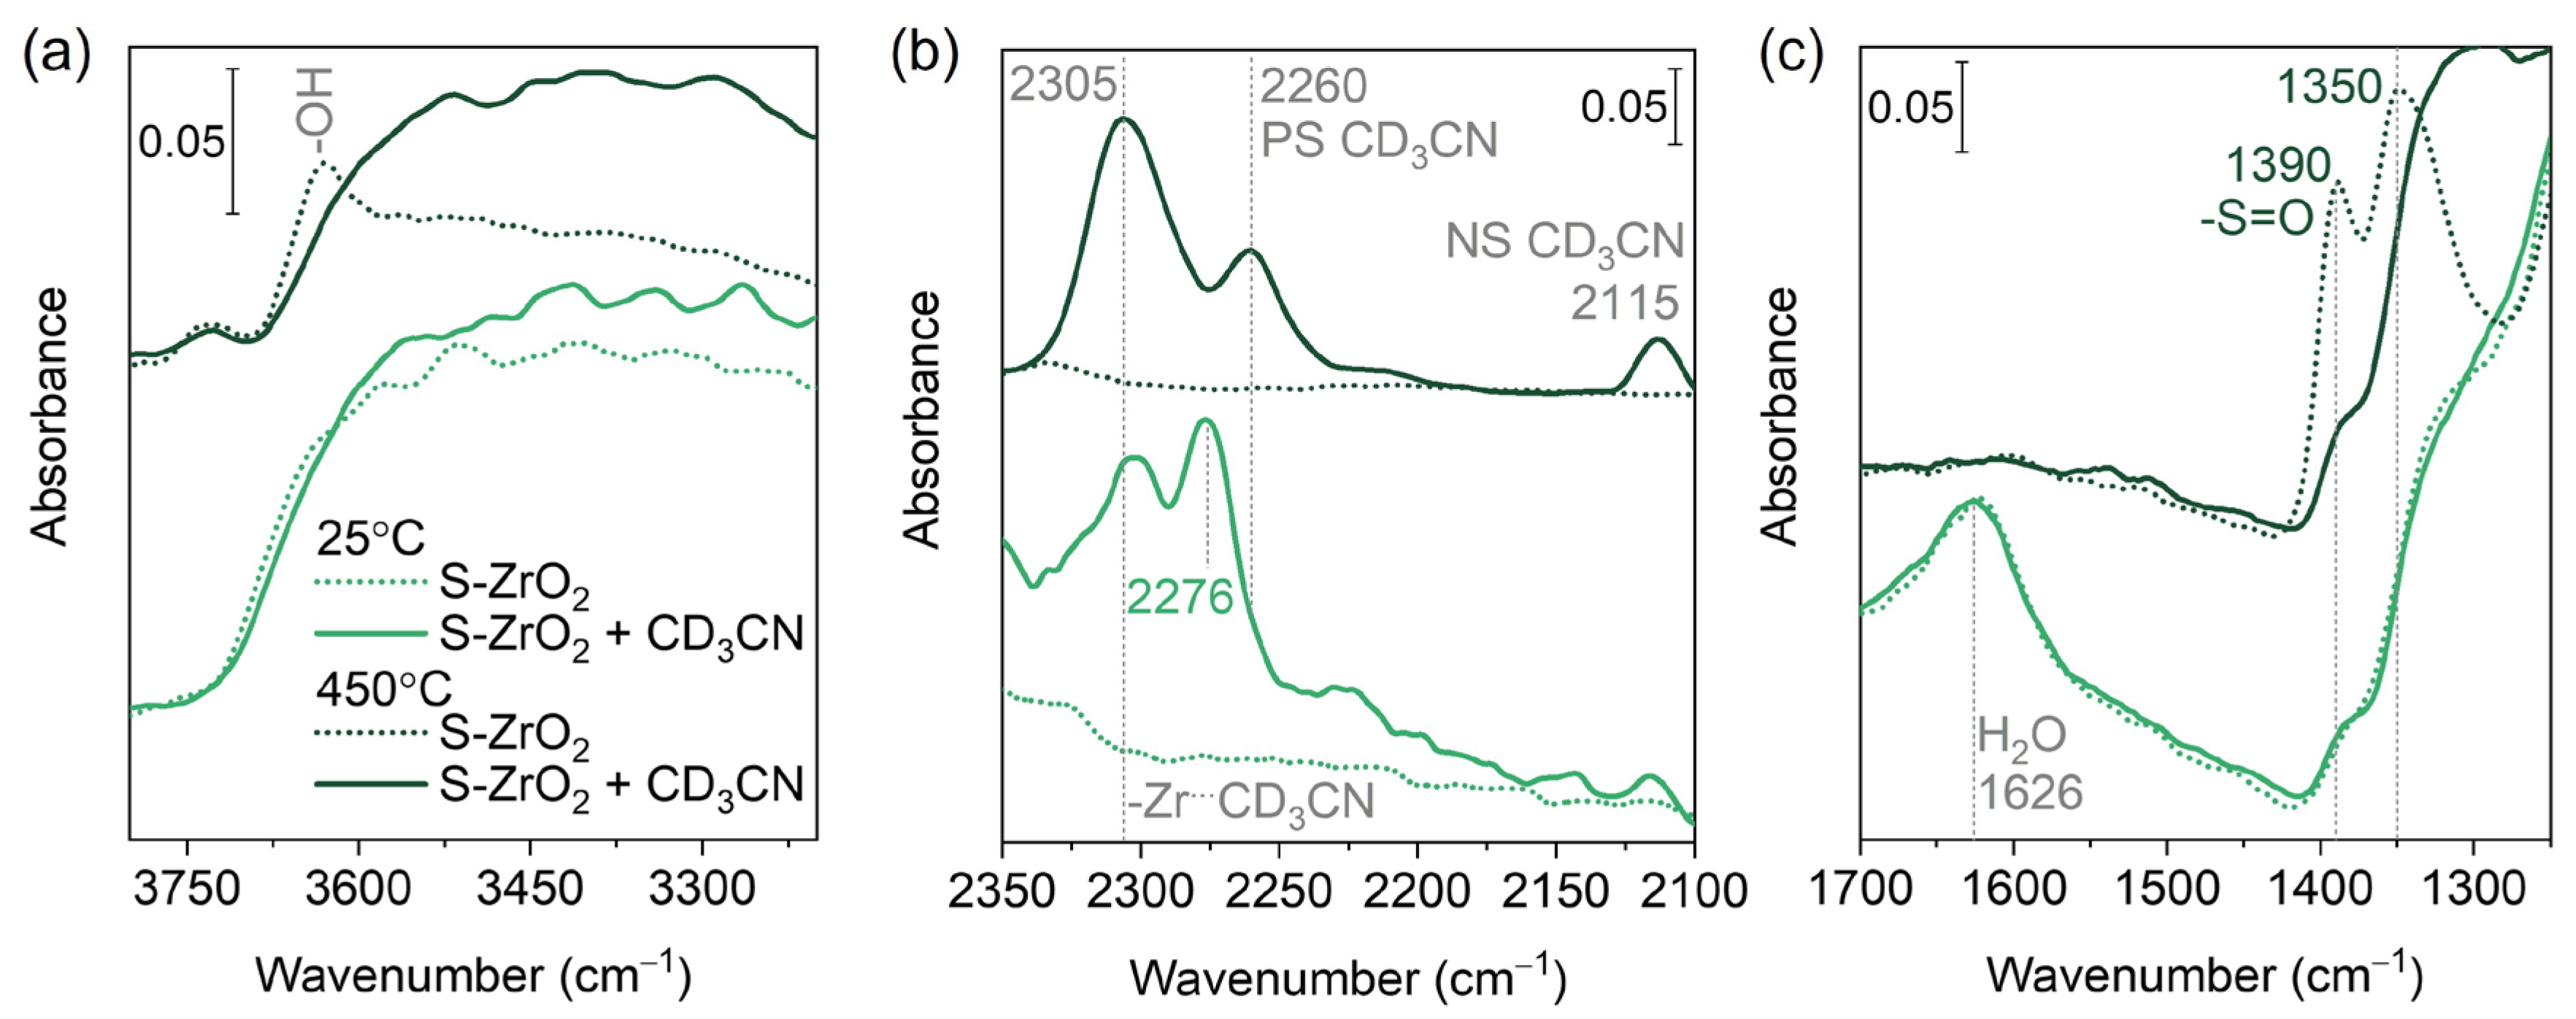
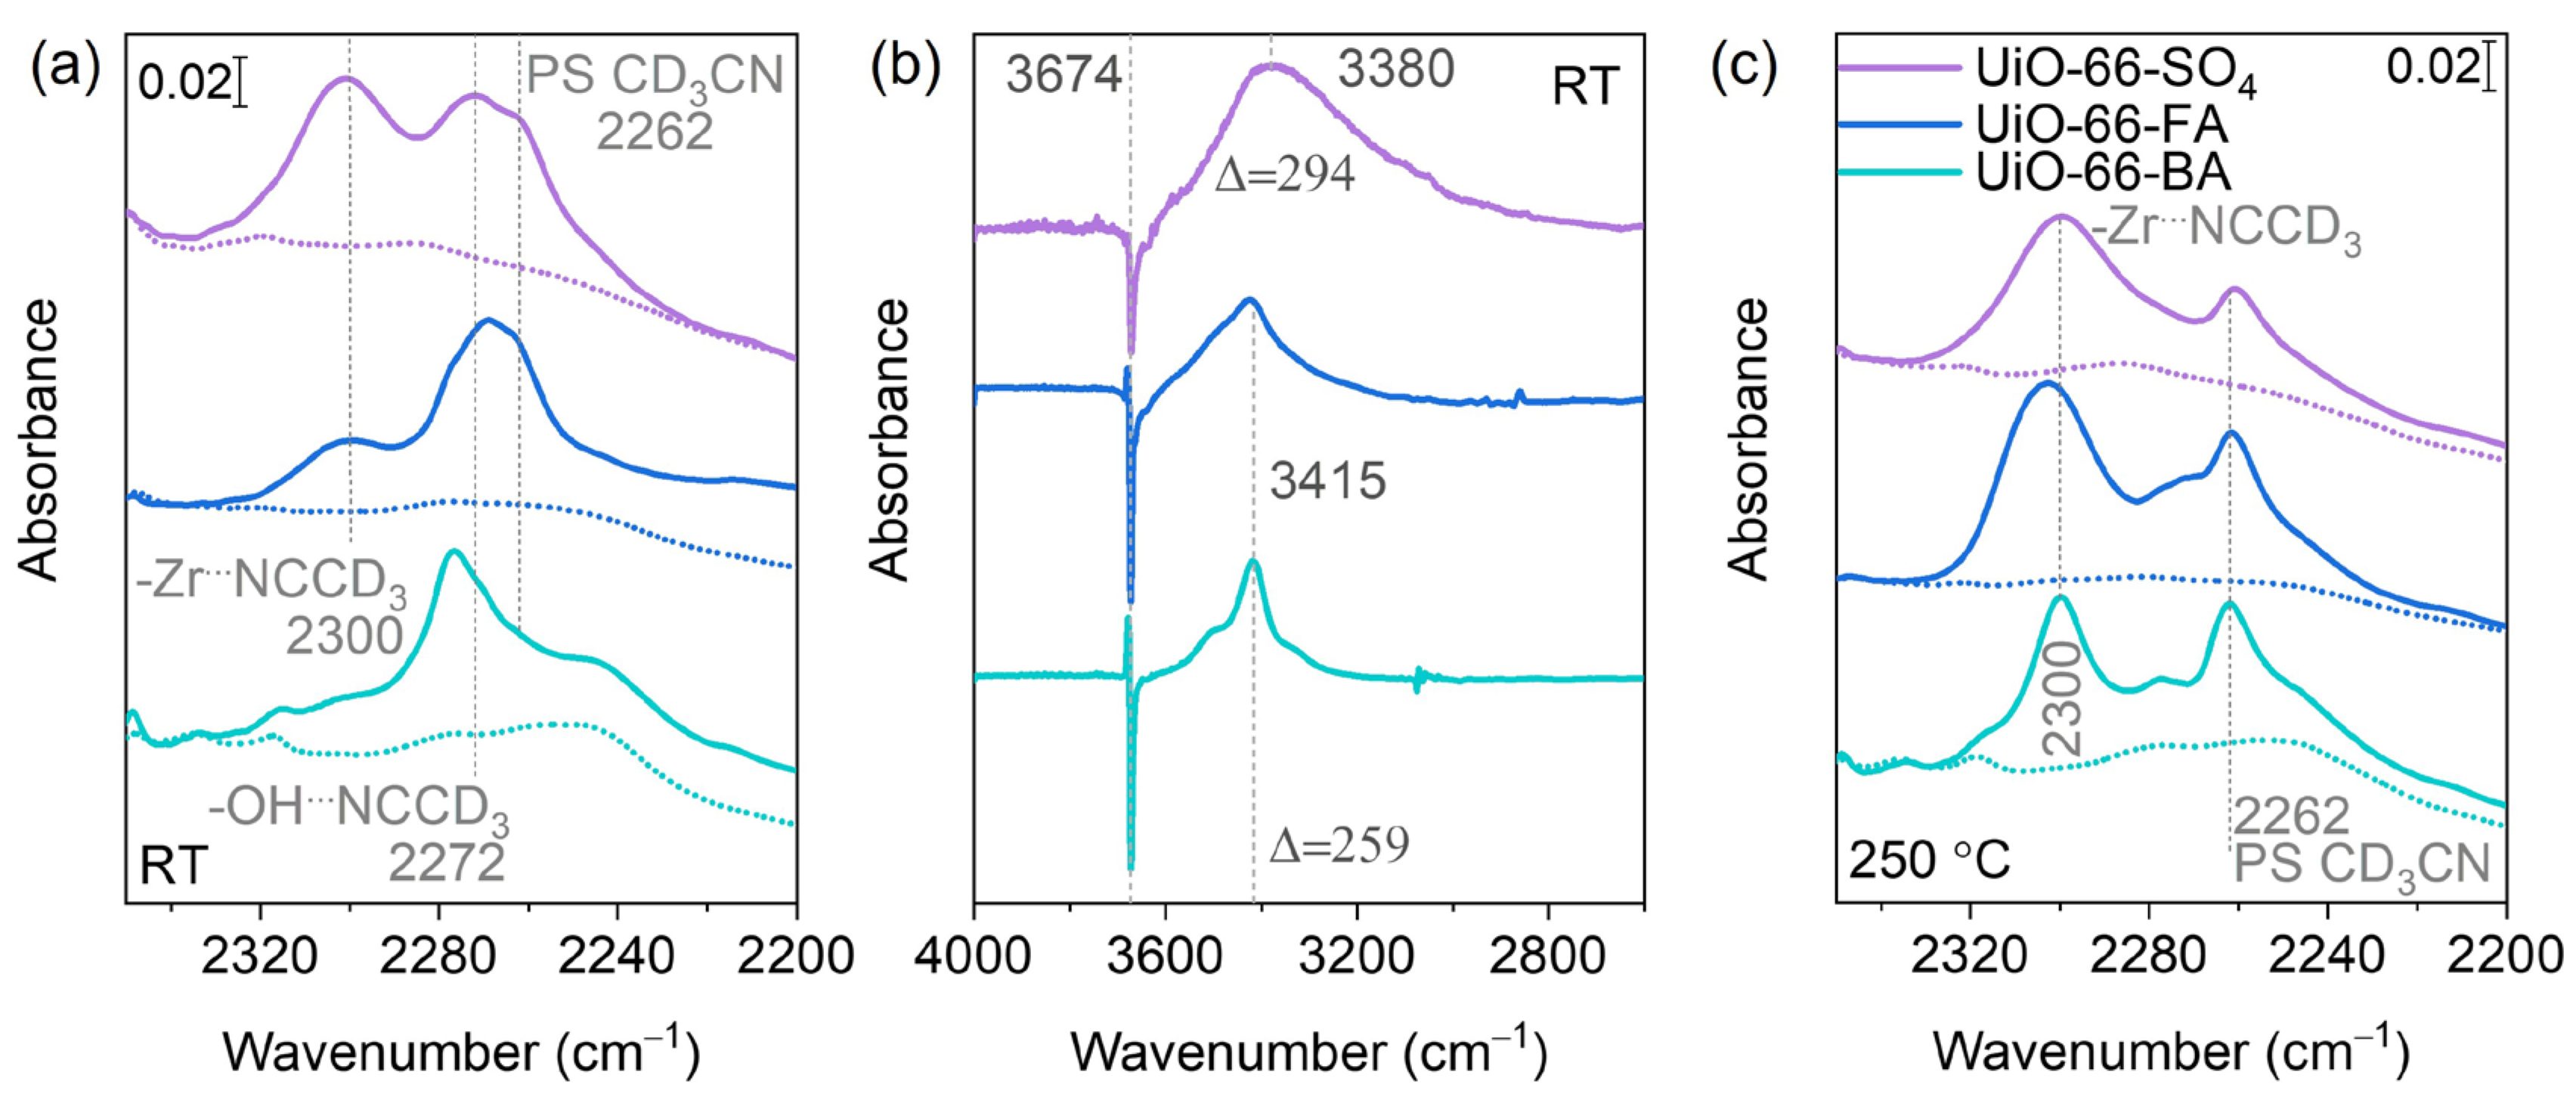
3.5. CD3CN Adsorption

Compared to carbon monoxide, acetonitrile exhibits a stronger basic character, making it particularly suitable for probing acidic surface sites. In our experiments, we used deuterated acetonitrile (CD3CN) instead of regular acetonitrile (CH3CN) to avoid the splitting of C–N vibrational modes due to Fermi resonance [36].
Figure 8a presents the OH region of S-ZrO2 samples after vacuum thermal activation (dotted lines) and after exposure to 1 mbar of CD3CN (solid lines). Additional spectra recorded during evacuation from 5 mbar are provided in the Supporting Information. After room temperature activation, the S-ZrO2 sample contained a significant amount of physisorbed water, as indicated by a broad band in the 3200–3600 cm−1 region and a band at 1626 cm−1 (see the light green lines in Figure 8). Evacuation at 450 °C removed most of the physisorbed water, revealing a band at 3630 cm−1, which corresponded to OH groups (see dark green lines in Figure 8). Upon CD3CN adsorption, the 3630 cm−1 band shifted, confirming the Brønsted acidity of the corresponding hydroxyls, as they formed hydrogen bonds with CD3CN.
CD3CN adsorption on the hydrated sample hardly affected the S–O bands (Figure 8c), suggesting that, in this case, the symmetry of the sulfate anions was practically preserved. By contrast, drastic changes were observed for the activated sample. In particular, the high-frequency S=O stretching band shifted downward by approximately 60 cm−1, indicating a change in symmetry. The spectra suggested that the state of the sulfates after CD3CN adsorption was similar to that of the hydrated sample.
In the νCN region, CD3CN adsorption on S-ZrO2 resulted in the appearance of several new bands (Figure 8b). The band at 2260 cm−1 corresponded to hydrogen-bonded and/or physisorbed CD3CN. The band at 2115 cm−1 was assigned to the νs(CD3) vibration of all adsorbed acetonitrile species. Bands at 2300–2305 cm−1 indicated the coordination of CD3CN to Zr4+ Lewis acid sites, observed on both room temperature and 450 °C–activated S-ZrO2 samples. The band at 2275 cm−1 appeared only for hydrated S-ZrO2 samples and was associated with OH groups exhibiting medium-low Brønsted acidity [51]. These OH species were linked to hydrated sulfate groups, which contributed to the overall surface acidity.
Figure 9a presents the spectra of CD3CN adsorbed on UiO-66 samples activated at room temperature (see also Figure S8a). The spectra of all three UiO-66 samples exhibited a band at 2262 cm−1, which corresponded to the C≡N stretching mode of physically adsorbed acetonitrile. The adsorption of CD3CN on μ3-OH groups in Zr6O4(OH)4 clusters gave rise to a band at approximately 2272 cm−1 [20,21,54].
The interaction between μ3-OH groups and CD3CN was further evidenced by a red shift of the μ3-OH band upon CD3CN exposure (Figure 9b). This shift, which was greater than that observed for CO adsorption, highlighted the stronger basicity of acetonitrile. Moreover, the shift for the UiO-66-SO4 sample was larger, and the shifted band included components at lower frequencies, suggesting an additional fraction of more acidic hydroxyls. This was in general agreement with the results obtained with CO as a probe, indicating the existence of some OH groups on the sulfated sample that were more acidic than the μ3-OH groups.
Additionally, a band at 2303 cm−1 appeared in the spectra of the UiO-66-FA and UiO-66-SO4 samples (Figure 9a), signifying CD3CN interaction with Zr4+ ions. This band was nearly absent in the spectrum of UiO-66-BA, suggesting that these adsorption sites on the hydrated sample corresponded to bare Zr4+ ions located in defect pores, created by the removal of modulator anions or affected by sulfate species. Under normal conditions, such sites would be blocked by adsorbed water. However, due to its relatively high proton affinity (779.2 kJ mol−1) compared to H2O (691 kJ mol−1) [19,35], acetonitrile can effectively replace pre-adsorbed water. Notably, the spectrum of the UiO-66-SO4 sample displayed a more intense band at 2303 cm−1, suggesting a greater abundance of these exposed Zr4+ sites.
Following activation at 250 °C, dehydration and the loss of μ3-OH groups occurred, resulting in only weak peaks at 2272 cm−1 (Figure 9c and Figure S8b). Meanwhile, bands in the 2300–2305 cm−1 region became more prominent in all three samples. In our previous studies, we attributed these bands to CD3CN adsorption on bare Zr4+ sites within regular pores [20].
UiO-66-SO4 and S-ZrO2 exhibited notable similarities in their interaction with CD3CN. In their hydrated states, both materials adsorbed acetonitrile through interactions with surface OH groups and Zr sites. This behavior contrasted with CO adsorption, as the higher basicity of acetonitrile enabled it to displace adsorbed water molecules and access Zr sites. Upon dehydration, only residual OH groups remained, and both materials adsorbed CD3CN primarily through coordination to Zr4+ ions. Notably, the IR bands associated with Zr⋯CD3CN interactions appeared in the same spectral region (2300–2305 cm−1) for both UiO-66-SO4 and S-ZrO2, indicating similar acidity of the Zr4+ sites. Additionally, dehydrated S-ZrO2 showed clear spectral changes related to CD3CN interaction with surface sulfate groups. By contrast, no similar changes were noticed with the hydrated S-ZrO2 and UiO-66-SO4.

4. Discussion

In this study, we compared tetragonal sulfated zirconia (S-ZrO2) and sulfated UiO-66. While these materials belong to different classes, they share a common structural motif—SO42− connected to Zr-O clusters. Observing trends in ZrO2 can provide valuable insights into the behavior of UiO-66. This MOF is well known for its structural tolerance to defects, which significantly influences its properties. To explore these effects, we used three UiO-66 samples (Figure 10):
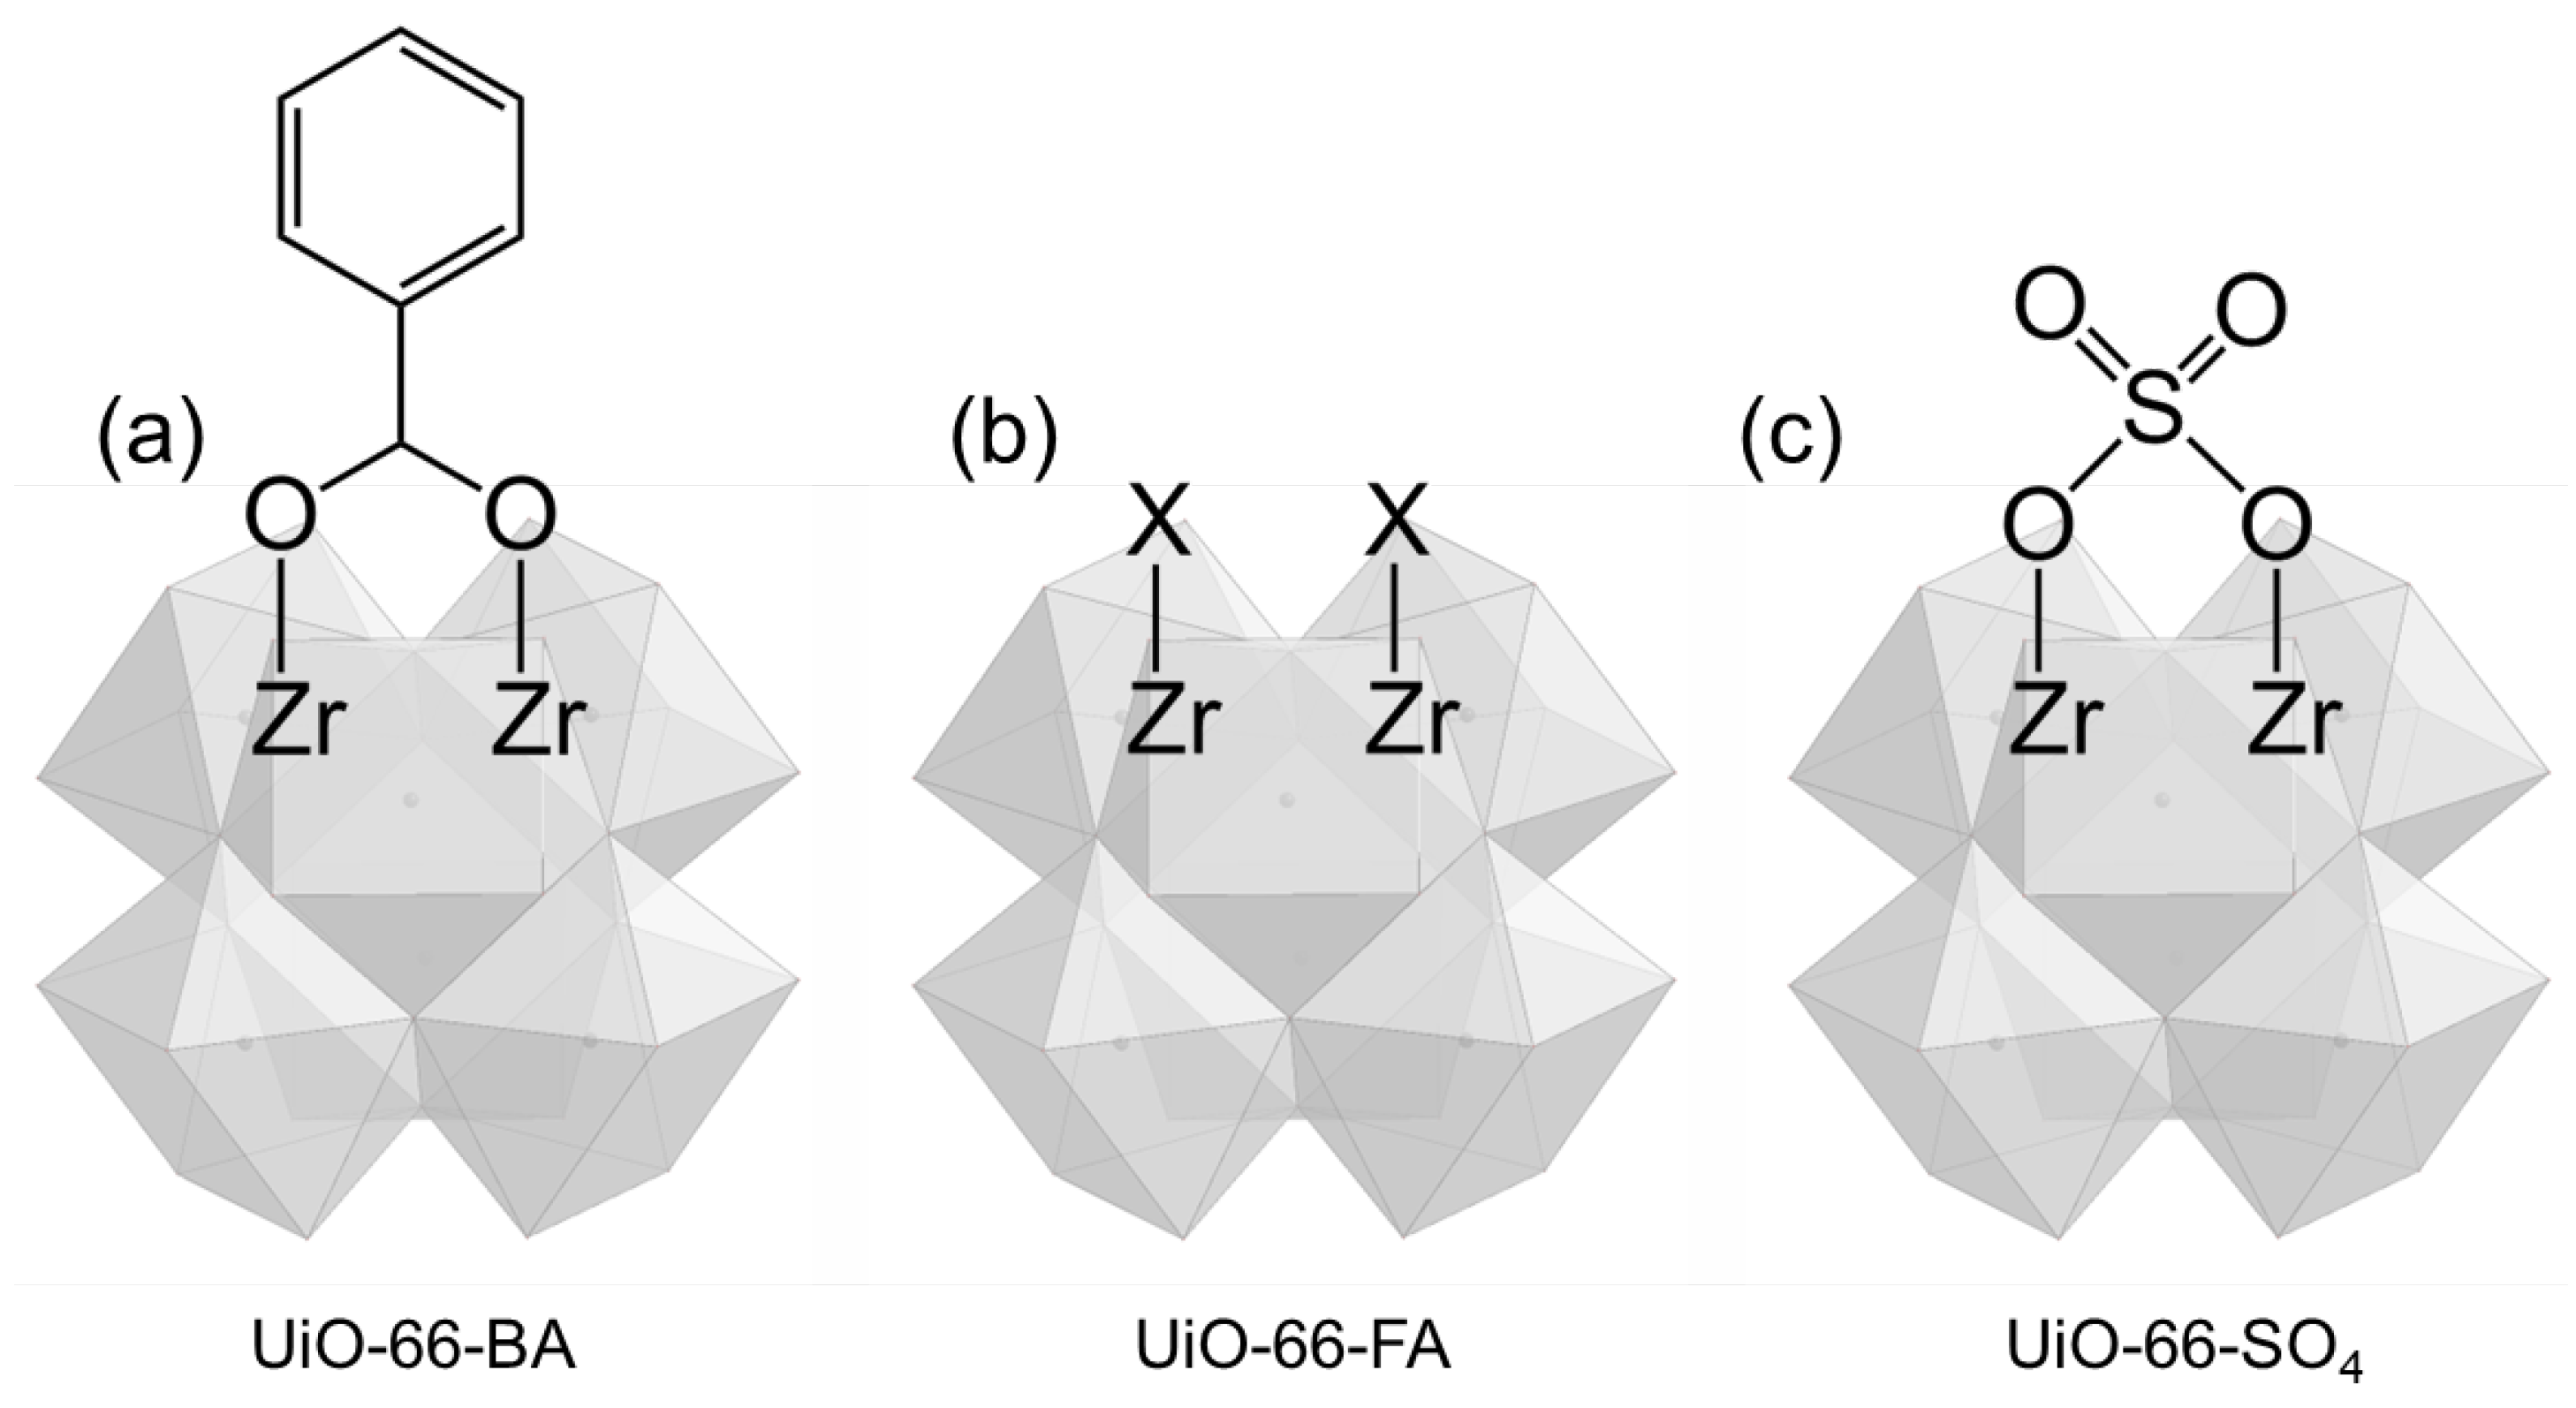
  • UiO-66-BA—contains defects, but they are coordinated with benzoate ions, making the Zr sites inaccessible.
  • UiO-66-FA—the benzoate ions have been removed, exposing Zr sites in defect pores.
  • UiO-66-SO4—derived from UiO-66-FA by modifying it with sulfate (SO4) groups.
A central question in the study of sulfated zirconia concerns the coordination mode of SO4 groups on the zirconia surface. While some reports attribute the observed vibrational bands to bidentate bridging coordination, others suggest the presence of monodentate or tridentate configurations [46,49,52,53]. This discrepancy arises from the inherent complexity of solid surfaces modified with sulfate groups, where the ions may be unevenly distributed and exhibit multiple coordination modes simultaneously.
In its free state, the sulfate ion (SO42−) exhibits Td symmetry, with four equivalent S–O bonds arranged in a perfect tetrahedral geometry [58]. This high symmetry gives rise to four fundamental vibrational modes: two stretching modes—symmetric (ν1) and antisymmetric (ν3)—and two bending modes, also symmetric (ν2) and antisymmetric (ν4) [58,59].
The bending vibrations (ν2 and ν4) typically appear in the 680–450 cm−1 region. However, in vibrational studies involving solid surfaces, these low-frequency modes are often obscured by strong absorptions from the substrate itself and thus are generally not considered useful for surface vibrational spectroscopy.
The S–O stretching modes are of greater importance in such studies. In the free ion, selection rules dictate that the ν1 mode is only Raman-active, while the ν3 mode is also IR-active, appearing at 1104 cm−1. Upon coordination of sulfate ions to metal cations, molecular symmetry is reduced—commonly to C3v, C2v, or Cs—relaxing the selection rules. As a result, the ν1 mode becomes IR-active, and the degenerate ν3 mode splits into two or more components, depending on the coordination [59].
Coordination also causes shifts in the vibrational frequencies. Monodentate coordination generally results in minor frequency shifts and limited band splitting. By contrast, bidentate coordination—either bridging or chelating—leads to more significant shifts and pronounced splitting, reflecting the stronger perturbation of the sulfate structure. While tridentate coordination of sulfate anions has not been reported in bulk crystalline compounds, if present, it would likely lead to a further increase in S–O stretching frequencies due to enhanced bonding asymmetry.
Organic sulfate esters, by contrast, exhibit distinct vibrational features arising from their characteristic O=S=O moiety. These species typically show symmetric and asymmetric S–O stretching bands in the 1450–1350 cm−1 and 1230–1150 cm−1 regions, respectively [60].
Representative examples of bulk sulfates and their vibrational signatures are summarized in Table 1.
The high-frequency band at 1390 cm−1 observed in the spectrum of dehydrated S-ZrO2 is close to that typically found in sulfate esters, which initially supported the hypothesis of bidentate coordination of the sulfate anion on the zirconia surface. However, this band may also correspond to isolated S=O stretching modes associated with tridentate sulfate species (see Figure 10). To determine the coordination mode in our S-ZrO2 sample, we performed 16O to 18O isotope exchange and monitored the changes using FTIR spectroscopy. If the band around 1390 cm−1 characterized an isolated S=O bond, it should be shifted directly by a factor of 0.98 (characteristic of the S–O bond). However, with a bidentate structure, a two-step shift should be observed with the appearance of an intermediate band corresponding to 18O-S-16O moieties (Figure 10b). Similar is the case with monodentate species, where, however, two intermediate bands should be observed. We observed a shift of the band at 1390 cm−1 without splitting, indicating the tridentate coordination of the SO4 groups.
After adsorption of CD3CN on Lewis acid sites of sulfated zirconia, the band at 1390 cm−1 shifted to lower frequencies. This shift occurred simultaneously with the formation of CD3CN-Zr4+ complexes, indicating the occupation of Lewis acid sites. These observations suggest that the coordination of acetonitrile to Zr4+ induces significant changes in the S=O bond. A similar effect was previously reported in the literature, where sulfate rearrangement was proposed as a possible explanation [56]. These findings can be interpreted based on the assumption that acetonitrile adsorption on the Zr4+ site triggers a structural rearrangement of the sulfate group, as illustrated in Scheme 1.
CO, being a weaker base, cannot induce significant structural changes in sulfate groups and only causes a slight shift of the S=O band. However, the presence of this effect suggests that at least one of the Zr4+ sites bound to the sulfate anion is coordinatively unsaturated and can function as a Lewis acid site. By contrast, acetonitrile, a much stronger base than CO, facilitates the breaking of one S–O–Zr bond.
Additionally, we observed a red shift of the 1390 cm−1 band associated with S=O vibrations upon hydration. In the spectrum of the hydrated S-ZrO2 sample, multiple bands emerged in the 1000–1200 cm−1 region. This effect closely resembled that observed upon CD3CN adsorption, though the red shift appeared more pronounced. Based on this observation, we propose the following scheme for the process, where an OH group and a delocalized proton are formed (Scheme 2). Notably, the OH group is also involved in hydrogen bonding (not depicted in Scheme 2), as no band corresponding to isolated hydroxyls was observed in the IR spectra.
The proposed structure of sulfates on the hydrated S-ZrO2 is also supported by the IR and Raman spectra shown in Figure 2 and Figure 3. A comparison with the data presented in Table 1 shows that the spectra are consistent with bidentate coordination. The proposed scheme also aligns with the observation that CO does not adsorb on the hydrated sample. Moreover, bidentate coordination of sulfate to Zr clusters was observed by single-crystal XRD in MOF-808, which featured the same Zr node structure [23]. NU-1000 exhibited a dynamic sulfate binding motif that transitions from monodentate to bidentate and eventually to tridentate coordination, depending on the degree of hydration [28]. This behavior was confirmed by single-crystal XRD and supported by DFT calculations.
To better understand the structure of UiO-66-SO4, we begin by comparing it with its UiO-66-BA and UiO-66-FA counterparts (Figure 11). For our in situ studies, we combined two probe molecules—CO and CD3CN.
Carbon monoxide is a very weak base. When adsorbed at a low temperature, it probes the state of active sites without inducing structural rearrangements. CO adsorption revealed the absence of accessible Zr4+ sites on the pristine UiO-66-BA sample, even after evacuation at 250 °C (Table 2). This indicated that these sites were coordinatively saturated—bonded to terephthalate ligands in regular pores and to benzoate ions in defective pores (Figure 11a). By contrast, CO adsorption on the activated UiO-66-FA sample revealed the presence of Zr4+ Lewis acid sites associated with cations in defective pores, which become accessible after removal of a temporary ligand (Figure 11b). These sites were not detected in the unactivated sample because they were blocked by water molecules. Similarly, for UiO-66-SO4, no accessible Zr4+ sites were observed, indicating a situation similar to that of UiO-66-BA (Figure 11c). CD3CN is a stronger base than CO and may induce structural rearrangements to form stable complexes. It can also displace pre-adsorbed water. As previously reported [20,54], CD3CN detects Zr4+ sites in regular pores, but only after the μ3-OH groups are removed by sample dehydroxylation. Evidently, the same situation applied to the Zr4+ sites from the defective pores in the UiO-66-BA sample (Table 2).
Adsorption of CD3CN on the UiO-66-FA sample revealed the presence of Lewis acid sites even on the 25 °C evacuated sample. Since no such sites were observed with UiO-66-BA, we could confidently attribute them to Zr4+ cations located in defective pores. These sites were not detected by CO because they were blocked by H2O molecules. However, as previously noted, CD3CN is capable of displacing pre-adsorbed water. The number of Lewis acid sites increased following activation at 250 °C, as CD3CN then also interacted with Zr4+ cations in dehydroxylated Zr clusters within the regular pores.
With UiO-66-SO4, we found Lewis acid sites even with the sample activated at 25 °C, which was an important difference compared to the UiO-66-BA sample. It was evident that the inorganic cluster in the sulfated sample was more prone to reconstruction, which was most likely due to the ionic nature of the Zr–sulfate bond.
To evaluate how SO4 groups coordinate within the UiO-66 framework, we compared these findings with the behavior of S-ZrO2. The experimental results revealed similarities between UiO-66-SO4 and hydrated S-ZrO2—both samples exhibited accessible Zr sites for acetonitrile but not for CO. Based on this, we propose that SO4 groups in UiO-66-SO4 are coordinated in a bidentate fashion to the Zr6O4(OH)4 clusters.
In the S-ZrO2 sample, dehydration led to tridentate coordination, while rehydration resulted in the breaking of one S–O–Zr bond, reverting to bidentate SO4 bonding. This process was reversible in S-ZrO2. However, the less stable UiO-66 framework did not allow for reproduction of this process, as activation at 450 °C (the temperature used for S-ZrO2) would lead to structural collapse. The presence of OH bands in the spectrum of UiO-66-SO4 after activation at 250 °C further supported this proposed coordination scheme (Figure S5).
Thus, UiO-66-SO4 contains Zr sites in defective pores, which are linked to OH groups formed due to bidentate SO4 coordination. These Zr sites are inaccessible to CO because CO, being a weak base, cannot displace OH groups (Scheme 3a). By contrast, acetonitrile, as a stronger base, is capable of replacing OH groups (forming H2O with H+) and binding to Zr in defective pores (Scheme 3b).

5. Conclusions

In this study, we investigated the effect of sulfation on the structural and adsorption properties of UiO-66 using FTIR spectroscopy with probe molecules. To better understand sulfate coordination, we used sulfated tetragonal zirconia as a model system, given its structural similarity to Zr6O6 clusters in UiO-66. However, even for sulfated zirconia, the precise coordination of sulfate groups remains an open question. Through isotope exchange experiments, we confirmed that dehydrated S-ZrO2 predominantly features tridentate SO4 groups, while hydration leads to the breaking of one S–O–Zr bond, resulting in bidentate sulfate coordination.
Extending this analysis to UiO-66, we found that sulfation significantly alters the accessibility of Zr sites in defective pores and modifies the framework’s coordination environment. The incorporation of SO4 groups in UiO-66 prevents CO adsorption at Zr sites, in contrast to UiO-66-FA, which exhibits accessible Lewis acid sites. However, UiO-66-SO4 readily adsorbs acetonitrile, even after room temperature activation, suggesting that sulfate groups modify, but do not completely block, access to Zr centers. A careful comparison of UiO-66 samples with defective pores that were either blocked, free, or sulfated confirmed that SO4 groups are primarily located inside defective pores.
By drawing parallels with S-ZrO2, we propose that SO4 groups in UiO-66-SO4 adopt a bidentate coordination mode to the Zr6O6 clusters. Unlike in S-ZrO2, where dehydration can reversibly induce tridentate coordination, this process does not occur in UiO-66-SO4 due to the lower thermal stability of the MOF framework. The presence of H-bonded hydroxyls in UiO-66-SO4 after activation at 250 °C further supports this model, indicating that SO4 groups promote the formation of Zr-OH groups. These sites remain inaccessible to CO due to its weaker basicity, whereas acetonitrile, as a stronger base, can displace OH groups and bind to Zr centers in defect pores.
Overall, our findings provide new insights into the coordination chemistry of sulfated UiO-66 and the role of sulfate groups in modifying adsorption properties. This study contributes to a deeper understanding of defect chemistry in MOFs and suggests that sulfation can serve as a strategy for tuning the acidity and adsorption behavior of UiO-66-based materials, with potential applications in catalysis and adsorption processes.

Supplementary Materials

The following supporting information can be downloaded at: https://www.mdpi.com/article/10.3390/nano15110779/s1, Table S1: Selected examples of MOFs containing sulfate or sulfite groups and their applications; Table S2: Main results of XRD profile analysis; Table S3: Refined structural data alongside crystallographic reference data from the literature for comparison; Table S4: Particle size was calculated using the Scherrer equation; Figure S1: XRD patterns of the S-ZrO2 (a) and UiO-66-SO4 (b) samples; Figure S2: IR spectra of S-ZrO2 sample (a) and UiO-66 samples (b) in ATR geometry; Figure S3: FTIR spectra of S-ZrO2 sample during evacuation from room temperature (brown) up to 470 °C (green); Figure S4: Regions from 1800 to 1000 cm−1 (a) and from 4000 to 2500 cm−1 (b) of IR spectra measured for UiO-66-SO4 sample during the activation process; Figure S5: FTIR spectra recorded after evacuation of UiO-66-BA, UiO-66-FA, and UiO-66-SO4 samples at room temperature (a) and at 250 °C (b); Figure S6: FTIR spectra of the S-ZrO218O sample after the introduction of CO (5 mbar), followed by stepwise evacuation. Before the experiment, the sample was evacuated at 25 °C (red) or 450 °C (brown); Figure S7: FTIR spectra of the UiO-66-SO4 sample after CO introduction (5 mbar), followed by stepwise evacuation. Before the experiment, the sample was evacuated at 25 °C (a) and 250 °C (b); Figure S8: FTIR spectra of the UiO-66-SO4 sample after the introduction of CD3CN (5 mbar), followed by stepwise evacuation. Before the experiment, the sample was evacuated at 25 °C (a) and 250 °C (b).

Author Contributions

Conceptualization, V.V.B. and K.I.H.; methodology, V.V.B. and K.I.H.; validation, O.A.B.; formal analysis, O.A.B., N.L.D. and A.A.T.; investigation, O.A.B.; data curation, V.V.B.; writing—original draft preparation, V.V.B.; writing—review and editing, K.I.H.; visualization, V.V.B.; supervision, K.I.H. and V.V.B.; project administration, K.I.H. All authors have read and agreed to the published version of the manuscript.

Funding

The research was financially supported by the Bulgarian Science Fund under grant number KΠ-06-ДB-1. OAB and AAT acknowledge the Ministry of Science and Higher Education of the Russian Federation (state assignment in the field of scientific activity, No. FENW-2023–0019).

Data Availability Statement

Data will be made available upon request.

Conflicts of Interest

The authors declare no conflicts of interest. The funders had no role in the design of the study; in the collection, analyses, or interpretation of data; in the writing of the manuscript; or in the decision to publish the results.

References

  1. Fatimah, I.; Yanti, I.; Suharto, T.E.; Sagadevan, S. ZrO2-based catalysts for biodiesel production: A review. Inorg. Chem. Commun. 2022, 143, 109808. [Google Scholar] [CrossRef]
  2. Mittal, A.; Kumar, G.; Saroha, B.; Peppel, T.; Kumar, V.; Kumar, S.; Kumar, N. ZrO2 based nanostructures: A sustainable, economical, green and efficient organocatalyst. J. Mol. Liq. 2024, 398, 124223. [Google Scholar] [CrossRef]
  3. Bugrova, T.A.; Dutov, V.V.; Svetlichnyi, V.A.; Cortés Corberán, V.; Mamontov, G.V. Oxidative dehydrogenation of ethane with CO2 over CrOx catalysts supported on Al2O3, ZrO2, CeO2 and CexZr1−xO2. Catal. Today 2019, 333, 71–80. [Google Scholar] [CrossRef]
  4. Kunamalla, A.; Maity, S.K. Production of green jet fuel from furanics via hydroxyalkylation-alkylation over mesoporous MoO3-ZrO2 and hydrodeoxygenation over Co/γ-Al2O3: Role of calcination temperature and MoO3 content in MoO3-ZrO2. Fuel 2023, 332, 125977. [Google Scholar] [CrossRef]
  5. Soultanidis, N.; Zhou, W.; Psarras, A.C.; Gonzalez, A.J.; Iliopoulou, E.F.; Kiely, C.J.; Wachs, I.E.; Wong, M.S. Relating n-pentane isomerization activity to the tungsten surface density of WOx/ZrO2. J. Am. Chem. Soc. 2010, 132, 13462–13471. [Google Scholar] [CrossRef]
  6. Yu, S.; Wu, S.; Li, L.; Ge, X. Upgrading bio-oil from waste cooking oil by esterification using SO42−/ZrO2 as catalyst. Fuel 2020, 276, 118019. [Google Scholar] [CrossRef]
  7. Brunet, S.; Lebeau, B.; Naboulsi, I.; Michelin, L.; Comparot, J.D.; Marichal, C.; Rigolet, S.; Bonne, M.; Blin, J.L. Effect of mesostructured zirconia support on the activity and selectivity of 4,6-dimethydibenzothiophene hydrodesulfurization. Catalysts 2020, 10, 1162. [Google Scholar] [CrossRef]
  8. Hanafi, S.A.; El-Syed, H.A.; Elmelawy, M.S.; Sultan, E.S.A. Characterization and catalytic activities of ZrO2-TiO2 supported hydrodesulfurization catalysts. Petrol. Sci. Technol. 2009, 27, 83–95. [Google Scholar] [CrossRef]
  9. Hongloi, N.; Rahman, T.; Feyzbar-Khalkhali-Nejad, F.; Prapainainar, C.; Wongsurakul, P.; Aransiola, E.; Zhang, L.; Bargiela, P.; Baltrusaitis, J.; Prapainainar, P.; et al. Palm oil deoxygenation with glycerol as a hydrogen donor for renewable fuel production using nickel-molybdenum catalysts: The effect of support. Fuel Process. Technol. 2025, 270, 108196. [Google Scholar] [CrossRef]
  10. Wang, P.; Zhang, M.; Zhang, W.; Yang, C.; Li, C. Isomerization of n-Butane over SO42-/Al2O3-ZrO2 in a Circulated Fluidized Bed Reactor: Prospects for Commercial Application. Ind. Eng. Chem. Res. 2017, 56, 8456–8464. [Google Scholar] [CrossRef]
  11. Bouvier, P.; Djurado, E.; Ritter, C.; Dianoux, A.J.; Lucazeau, G. Low temperature phase transformation of nanocrystalline tetragonal ZrO2 by neutron and Raman scattering studies. Int. J. Inorg. Mater. 2001, 3, 647–654. [Google Scholar] [CrossRef]
  12. Valmalette, J.C.; Isa, M. Size Effects on the Stabilization of Ultrafine Zirconia Nanoparticles. Chem. Mater. 2002, 14, 5098–5102. [Google Scholar] [CrossRef]
  13. Marin, R.; Sponchia, G.; Back, M.; Riello, P. Determining europium compositional fluctuations in partially stabilized zirconia nanopowders: A non-line-broadening-based method. Acta Crystallogr. B 2016, 72, 29–38. [Google Scholar] [CrossRef]
  14. Hadjiivanov, K.; Avreyska, V.; Klissurski, D.; Marinova, T. Surface species formed after NO adsorption and NO + O2 coadsorption on ZrO2 and sulfated ZrO2: An FTIR spectroscopic study. Langmuir 2002, 18, 1619–1625. [Google Scholar] [CrossRef]
  15. Bardin, B.B.; Davis, R.J. A comparison of cesium-containing heteropolyacid and sulfated zirconia catalysts for isomerization of light alkanes. Top. Catal. 1998, 6, 77–86. [Google Scholar] [CrossRef]
  16. Yan, G.X.; Wang, A.; Wachs, I.E.; Baltrusaitis, J. Critical review on the active site structure of sulfated zirconia catalysts and prospects in fuel production. Appl. Catal. A 2019, 572, 210–225. [Google Scholar] [CrossRef]
  17. Cavka, J.H.; Jakobsen, S.; Olsbye, U.; Guillou, N.; Lamberti, C.; Bordiga, S.; Lillerud, K.P. A new zirconium inorganic building brick forming metal organic frameworks with exceptional stability. J. Am. Chem. Soc. 2008, 130, 13850–13851. [Google Scholar] [CrossRef]
  18. Butova, V.V.; Budnyk, A.P.; Charykov, K.M.; Vetlitsyna-Novikova, K.S.; Lamberti, C.; Soldatov, A.V. Water as a structure-driving agent between the UiO-66 and MIL-140A metal-organic frameworks. Chem. Commun. 2019, 55, 901–904. [Google Scholar] [CrossRef] [PubMed]
  19. Atzori, C.; Shearer, G.C.; Maschio, L.; Civalleri, B.; Bonino, F.; Lamberti, C.; Svelle, S.; Lillerud, K.P.; Bordiga, S. Effect of benzoic acid as a modulator in the structure of UiO-66: An experimental and computational study. J. Phys. Chem. C 2017, 121, 9312–9324. [Google Scholar] [CrossRef]
  20. Butova, V.V.; Zdravkova, V.R.; Burachevskaia, O.A.; Gorban, I.E.; Soldatov, M.A.; Hadjiivanov, K.I. FTIR traced modification of defect-engineered UiO-66 for enhanced accessibility of zirconium sites. Microporous Mesoporous Mater. 2025, 382, 113372. [Google Scholar] [CrossRef]
  21. Butova, V.V.; Zdravkova, V.R.; Burachevskaia, O.A.; Tereshchenko, A.A.; Shestakova, P.S.; Hadjiivanov, K.I. In situ FTIR spectroscopy for scanning accessible active sites in defect-engineered UiO-66. Nanomaterials 2023, 13, 1675. [Google Scholar] [CrossRef] [PubMed]
  22. Fernández-Morales, J.M.; Lozano, L.A.; Castillejos-López, E.; Rodríguez-Ramos, I.; Guerrero-Ruiz, A.; Zamaro, J.M. Direct sulfation of a Zr-based metal-organic framework to attain strong acid catalysts. Microporous Mesoporous Mater. 2019, 290, 109686. [Google Scholar] [CrossRef]
  23. Jiang, J.; Gándara, F.; Zhang, Y.-B.; Na, K.; Yaghi, O.M.; Klemperer, W.G. Superacidity in sulfated metal–organic framework-808. J. Am. Chem. Soc. 2014, 136, 12844–12847. [Google Scholar] [CrossRef] [PubMed]
  24. Jiang, Y.; Zhou, R.; Ye, B.; Hou, Z. Acetalization of glycerol over sulfated UiO-66 under mild condition. J. Ind. Eng. Chem. 2022, 110, 357–366. [Google Scholar] [CrossRef]
  25. Li, H.; Wang, T.; Chu, H.; Rokhum, S.L.; Zhang, Y.; Yu, H.; Xiao, Q.; Guo, M.; Ma, X.; Li, S.; et al. In–situ modification of UiO–66(Zr) organic ligand to synthesize highly recyclable solid acid for biodiesel production. Chem. Eng. Res. Des. 2024, 205, 713–721. [Google Scholar] [CrossRef]
  26. Nazari, M.; Amini, A.; Eden, N.T.; Duke, M.C.; Cheng, C.; Hill, M.R. Highly-Efficient Sulfonated UiO-66(Zr) Optical Fiber for Rapid Detection of Trace Levels of Pb2+. Int. J. Mol. Sci. 2021, 22, 6053. [Google Scholar] [CrossRef]
  27. Raveendran, S.R.D.; Teh, L.P.; Othaman, R.; Chia, C.H. Enhanced carbon dioxide adsorption performance of UiO-66-SO3H with a mixed ligand strategy. J. Environ. Chem. Eng. 2024, 12, 113404. [Google Scholar] [CrossRef]
  28. Syed, Z.H.; Mian, M.R.; Patel, R.; Xie, H.; Pengmei, Z.; Chen, Z.; Son, F.A.; Goetjen, T.A.; Chapovetsky, A.; Fahy, K.M.; et al. Sulfated Zirconium Metal–Organic Frameworks as Well-Defined Supports for Enhancing Organometallic Catalysis. J. Am. Chem. Soc. 2022, 144, 16883–16897. [Google Scholar] [CrossRef]
  29. Tahir, Z.; Aslam, M.; Gilani, M.A.; Bilad, M.R.; Anjum, M.W.; Zhu, L.-P.; Khan, A.L. SO3H functionalized UiO-66 nanocrystals in Polysulfone based mixed matrix membranes: Synthesis and application for efficient CO2 capture. Sep. Purif. Technol. 2019, 224, 524–533. [Google Scholar] [CrossRef]
  30. Shi, Q.; Wu, Q.; Li, H.; Shi, D.; Zhao, Y.; Jiao, Q. Enhanced catalytic performance of UiO-66 via a sulfuric acid post-synthetic modification strategy with partial etching. Appl. Catal. A 2020, 602, 117733. [Google Scholar] [CrossRef]
  31. Chadwick, A.V.; Mountjoy, G.; Nield, V.M.; Poplett, I.J.F.; Smith, M.E.; Strange, J.H.; Tucker, M.G. Solid-state NMR and X-ray studies of the structural evolution of nanocrystalline zirconia. Chem. Mater. 2001, 13, 1219–1229. [Google Scholar] [CrossRef]
  32. Jentoft, F.C.; Hahn, A.; Kröhnert, J.; Lorenz, G.; Jentoft, R.E.; Ressler, T.; Wild, U.; Schlögl, R.; Häßner, C.; Köhler, K. Incorporation of manganese and iron into the zirconia lattice in promoted sulfated zirconia catalysts. J. Catal. 2004, 224, 124–137. [Google Scholar] [CrossRef]
  33. Jentoft, R.E.; Hahn, A.H.P.; Jentoft, F.C.; Ressler, T. In situ XANES study of Mn in promoted sulfated zirconia catalysts. Phys. Chem. Chem. Phys. 2005, 7, 2830–2838. [Google Scholar] [CrossRef] [PubMed]
  34. Hadjiivanov, K. Use of overtones and combination modes for the identification of surface NOx anionic species by IR spectroscopy. Catal. Lett. 2000, 68, 157–161. [Google Scholar] [CrossRef]
  35. Hadjiivanov, K.; Lavalley, J.C. FT-IR spectroscopic study of CO adsorption on monoclinic zirconia of different hydroxylation degrees. Catal. Commun. 2001, 2, 129–133. [Google Scholar] [CrossRef]
  36. Hadjiivanov, K.I.; Panayotov, D.A.; Mihaylov, M.Y.; Ivanova, E.Z.; Chakarova, K.K.; Andonova, S.M.; Drenchev, N.L. Power of infrared and raman spectroscopies to characterize metal-organic frameworks and investigate their interaction with guest molecules. Chem. Rev. 2021, 121, 1286–1424. [Google Scholar] [CrossRef]
  37. Butova, V.V.; Burachevskaya, O.A.; Ozhogin, I.V.; Borodkin, G.S.; Starikov, A.G.; Bordiga, S.; Damin, A.; Lillerud, K.P.; Soldatov, A.V. UiO-66 type MOFs with mixed-linkers—1,4-benzenedicarboxylate and 1,4-naphthalenedicarboxylate: Effect of the modulator and post-synthetic exchange. Microporous Mesoporous Mater. 2020, 305, 110324. [Google Scholar] [CrossRef]
  38. Shearer, G.C.; Vitillo, J.G.; Bordiga, S.; Svelle, S.; Olsbye, U.; Lillerud, K.P. Functionalizing the defects: Postsynthetic ligand exchange in the metal organic framework UiO-66. Chem. Mater. 2016, 28, 7190–7193. [Google Scholar] [CrossRef]
  39. Petříček, V.; Dušek, M.; Palatinus, L. Crystallographic computing system JANA2006: General features. Z. Krist. 2014, 229, 345–352. [Google Scholar] [CrossRef]
  40. Bhagwat, M.; Ramaswamy, V. Synthesis of nanocrystalline zirconia by amorphous citrate route: Structural and thermal (HTXRD) studies. Mater. Res. Bull. 2004, 39, 1627–1640. [Google Scholar] [CrossRef]
  41. Igawa, N.; Ishii, Y. Crystal Structure of Metastable Tetragonal Zirconia up to 1473 K. J. Am. Chem. Soc. 2001, 84, 1169–1171. [Google Scholar] [CrossRef]
  42. Lutterotti, L.; Scardi, P. Simultaneous structure and size-strain refinement by the rietveld method. J. Appl. Crystallog. 1990, 23, 246–252. [Google Scholar] [CrossRef]
  43. Butova, V.V.; Aboraia, A.M.; Solayman, M.; Yahia, I.S.; Zahran, H.Y.; Abd El-Rehim, A.F.; Algarni, H.; Khabiri, G.; Soldatov, A.V. The joint effect of naphthalene-system and defects on dye removal by UiO-66 derivatives. Microporous Mesoporous Mater. 2021, 325, 111314. [Google Scholar] [CrossRef]
  44. Butova, V.V.; Burachevskaya, O.A.; Muratidi, M.A.; Surzhikova, I.I.; Zolotukhin, P.V.; Medvedev, P.V.; Gorban, I.E.; Kuzharov, A.A.; Soldatov, M.A. Loading of the Model Amino Acid Leucine in UiO-66 and UiO-66-NH2: Optimization of Metal-Organic Framework Carriers and Evaluation of Host-Guest Interactions. Inorg. Chem. 2021, 60, 5694–5703. [Google Scholar] [CrossRef]
  45. Øien, S.; Wragg, D.; Reinsch, H.; Svelle, S.; Bordiga, S.; Lamberti, C.; Lillerud, K.P. Detailed Structure Analysis of Atomic Positions and Defects in Zirconium Metal–Organic Frameworks. Cryst. Growth Des. 2014, 14, 5370–5372. [Google Scholar] [CrossRef]
  46. Noda, L.K.; Gonçalves, N.S.; de Borba, S.M.; Silveira, J.A. Raman spectroscopy and thermal analysis of sulfated ZrO2 prepared by two synthesis routes. Vib. Spectrosc. 2007, 44, 101–107. [Google Scholar] [CrossRef]
  47. Butova, V.V.; Budnyk, A.P.; Charykov, K.M.; Vetlitsyna-Novikova, K.S.; Bugaev, A.L.; Guda, A.A.; Damin, A.; Chavan, S.M.; Øien-ØDegaard, S.; Lillerud, K.P.; et al. Partial and complete substitution of the 1,4-benzenedicarboxylate linker in UiO-66 with 1,4-naphthalenedicarboxylate: Synthesis, characterization, and H2—Adsorption properties. Inorg. Chem. 2019, 58, 1607–1620. [Google Scholar] [CrossRef]
  48. Marlowe, J.; Acharya, S.; Zuber, A.; Tsilomelekis, G. Characterization of sulfated SnO2-ZrO2 catalysts and their catalytic performance on the tert-butylation of phenol. Catalysts 2020, 10, 726. [Google Scholar] [CrossRef]
  49. Adeeva, V.; Dehaan, J.W.; Janchen, J.; Lei, G.D.; Schunemann, V.; Vandeven, L.J.M.; Sachtler, W.M.H.; Vansanten, R.A. Acid sites in sulfated and metal-promoted zirconium dioxide catalysts. J. Catal. 1995, 151, 364–372. [Google Scholar] [CrossRef]
  50. Babou, F.; Coudurier, G.; Vedrine, J.C. Acidic properties of sulfated zirconia: An infrared spectroscopic study. J. Catal. 1995, 152, 341–349. [Google Scholar] [CrossRef]
  51. Morterra, C.; Peñarroya Mentruit, M.; Cerrato, G. Acetonitrile adsorption as an IR spectroscopic probe for surface acidity/basicity of pure and modified zirconias. Phys. Chem. Chem. Phys. 2002, 4, 676–687. [Google Scholar] [CrossRef]
  52. Kustov, L.M.; Kazansky, V.B.; Figueras, F.; Tichit, D. Investigation of the acidic properties of ZrO2 modified by SO42− anions. J. Catal. 1994, 150, 143–149. [Google Scholar] [CrossRef]
  53. Bensitel, M.; Saur, O.; Lavalley, J.C.; Morrow, B.A. An infrared study of sulfated zirconia. Mater. Chem. Phys. 1988, 19, 147–156. [Google Scholar] [CrossRef]
  54. Chakarova, K.; Strauss, I.; Mihaylov, M.; Drenchev, N.; Hadjiivanov, K. Evolution of acid and basic sites in UiO-66 and UiO-66-NH2 metal-organic frameworks: FTIR study by probe molecules. Microporous Mesoporous Mater. 2019, 281, 110–122. [Google Scholar] [CrossRef]
  55. Escalona Platero, E.; Peñarroya Mentruit, M.; Otero Areán, C.; Zecchina, A. FTIR studies on the acidity of sulfated zirconia prepared by thermolysis of zirconium sulfate. J. Catal. 1996, 162, 268–276. [Google Scholar] [CrossRef]
  56. Lange, F.; Hadjiivanov, K.; Schmelz, H.; Knözinger, H. Low temperature infrared study of carbon monoxide adsorption on sulfated titania. Catal. Lett. 1992, 16, 97–107. [Google Scholar] [CrossRef]
  57. Torbina, V.V.; Salaev, M.A.; Paukshtis, E.A.; Liotta, L.F.; Vodyankina, O.V. Effect of linker substituent nature on performance of active sites in UiO-66: Combined FT-IR and DFT study. Int. J. Mol. Sci. 2023, 24, 14893. [Google Scholar] [CrossRef]
  58. Smith, B.C. Infrared Spectral Interpretation: A Systematic Approach; Taylor & Francis: Abingdon, UK, 1998. [Google Scholar]
  59. Nakamoto, K. Applications in Inorganic Chemistry. In Infrared and Raman Spectra of Inorganic and Coordination Compounds; John Wiley & Sons, Inc.: Hoboken, NJ, USA, 2008; pp. 149–354. [Google Scholar]
  60. Socrates, G. Infrared and Raman Characteristic Group Frequencies: Tables and Charts, 3rd ed.; John Wiley & Sons, Ltd.: Hoboken, NJ, USA, 2004; p. 368. [Google Scholar]
  61. Degenhardt, J.; McQuillan, A.J. In Situ ATR-FTIR spectroscopic study of adsorption of perchlorate, sulfate, and thiosulfate ions onto chromium(III) oxide hydroxide thin films. Langmuir 1999, 15, 4595–4602. [Google Scholar] [CrossRef]
  62. Schnaars, D.D.; Wilson, R.E. Uranium(IV) sulfates: Investigating structural periodicity in the tetravalent actinides. Inorg. Chem. 2012, 51, 9481–9490. [Google Scholar] [CrossRef]
  63. Fry, A.M.; Sweeney, O.T.; Adam Phelan, W.; Drichko, N.; Siegler, M.A.; McQueen, T.M. Unique edge-sharing sulfate-transition metal coordination in Na2M(SO4)2 (M=Ni and Co). J. Solid State Chem. 2015, 222, 129–135. [Google Scholar] [CrossRef]
  64. Majzlan, J.; Alpers, C.; Bender Koch, C.; McCleskey, R.; Myneni, S.; Neil, J. Vibrational, X-ray absorption, and Mössbauer spectra of sulfate minerals from the weathered massive sulfide deposit at Iron Mountain, California. Chem. Geol. 2011, 284, 296–305. [Google Scholar] [CrossRef]
Figure 1. The experimental XRD pattern of the S-ZrO2 sample (a) and UiO-66 samples (b). The calculated powder pattern of ZrO2 with refined lattice constants is shown in black. Miller indices are provided below the calculated pattern for reference.
Nanomaterials 15 00779 g001
Figure 2. Raman spectra of S-ZrO2 (a) and UiO-66 samples (b). Dashed lines show bands assigned to ZrO2 phases (red for monoclinic and green for tetragonal), while orange dotted lines highlight bands assigned to SO4 groups.
Nanomaterials 15 00779 g002
Figure 3. Ex situ IR spectra of the S-ZrO2 sample (a) and UiO-66 samples (b) recorded in ATR geometry. In (a), the gray curve represents the second derivative of the band in the S-ZrO2 spectrum attributed to SO4 groups. Its intensity was scaled by a factor of 15,000 for better visualization. In (b), blue arrows indicate bands associated with benzoate ions, while violet arrows mark bands corresponding to SO4 vibrations.
Nanomaterials 15 00779 g003
Figure 4. In situ FTIR spectra of the S-ZrO2 samples (a) and the UiO-66-SO4 samples (b). The spectra were recorded for samples that were activated, rehydrated, and subsequently evacuated at 25 °C (red spectrum in (a) and violet spectrum in (b)), as well as after additional evacuation at 250 °C (brown spectrum in (a) and dark violet spectrum in (b)).
Nanomaterials 15 00779 g004
Figure 5. In situ FTIR spectra of the S-ZrO2 sample after evacuation at 470 °C (brown), after interaction with H218O (20 mbar) at 470 °C for 3 h followed by evacuation at the same temperature (blue), and after repeating the treatment with H218O (green). Spectra are provided in the 1500–1200 cm−1 region.
Nanomaterials 15 00779 g005
Figure 6. In situ FTIR spectra of the S-ZrO218O sample after the introduction of CO (5 mbar), followed by stepwise evacuation. Before the experiment, the sample was evacuated at 450 °C. Spectra are provided in the 3650–2800 cm−1 (a), 2250–2050 cm−1 (b), and 1420–1300 cm−1 (c) regions. PS stands for physisorbed.
Nanomaterials 15 00779 g006
Figure 7. In situ FTIR spectra recorded after low-temperature CO adsorption (3 mbar equilibrium pressure) on UiO-66-BA, UiO-66-FA, and UiO-66-SO4 samples evacuated at 25 °C (a,b) and at 250 °C (c). Part (b) shows the difference spectrum, highlighting changes before and after CO exposure (1 mbar) at liquid nitrogen temperature for samples evacuated at room temperature. The intensities were scaled by factors of 0.5 for UiO-66-FA and 0.9 for UiO-66-BA to improve comparability, as tablet thickness was not consistent across the experiments. PS stands for physically adsorbed.
Nanomaterials 15 00779 g007
Figure 8. In situ IR spectra of the S-ZrO218O sample before (dotted) and after (solid) exposure to 1 mbar of CD3CN. Prior to recording the spectra, the S-ZrO2 sample was treated twice with H218O and evacuated at 25 °C (light green) or 450 °C (dark green). Spectra are provided in the 3800–3200 cm−1 (a), 2350–2100 cm−1 (b), and 1700–1250 cm−1 (c) regions. PS stands for physisorbed; NS designates non-specific.
Nanomaterials 15 00779 g008
Figure 9. In situ FTIR spectra recorded after room temperature CD3CN adsorption (2 mbar equilibrium pressure) on UiO-66-BA, UiO-66-FA, and UiO-66-SO4 samples evacuated at 25 °C (a,b) and at 250 °C (c). Part (b) shows the difference spectrum, highlighting changes before and after CD3CN exposure (2 mbar) for samples evacuated at room temperature. PS stands for physisorbed.
Nanomaterials 15 00779 g009
Figure 10. Stepwise exchange of 16O by 18O in different possible surface sulfates. Part (a) illustrates the tridentate coordination of SO4, part (b) depicts bidentate coordination, and part (c) demonstrates the monodentate binding variant of SO4. The zirconium oxide surface is schematically represented by gray rectangles.
Nanomaterials 15 00779 g010
Scheme 1. Effect of CD3CN adsorption on the surface of S-ZrO2.
Nanomaterials 15 00779 sch001
Scheme 2. Proposed scheme illustrating the interaction of the S-ZrO2 surface with adsorbed water.
Nanomaterials 15 00779 sch002
Figure 11. Schematic representation of UiO-66-BA (a), UiO-66-FA (b), and UiO-66-SO4 (c) samples. The figure provides a schematic view of three Zr ions within a defective pore. Light gray polyhedra illustrate the coordination of Zr with oxygen. In part (c), ion X represents a temporary ion compensating for charge after post-synthetic treatment and activation.
Nanomaterials 15 00779 g011
Scheme 3. Proposed scheme illustrating the interaction of the UiO-66-SO4 structure with CO (a) and CD3CN (b). See the text for details.
Nanomaterials 15 00779 sch003
Table 1. Positions of the S–O stretching modes in the IR spectra of some sulfates.
SampleCoordinationνs, cm−1νas, cm−1Ref.
Free SO42−noinactive1104[58]
[Co(NH3)6]SO4Brmonodentate9701044–10321143–1117[59]
[Cr(H2O)5SO4Cl]·0.5H2O97810401130[61]
[U(SO4)2(H2O)7]·2H2O99610421144[62]
[Co2(NH3)8(NH2)(SO4)](NO3)3bidentate99511701060–10501105[59]
Na2Co(SO4)2970122010801160[63]
Fe3+0.67Fe3+4(SO4)6(OH)2·20H2O (Ferricopiapite)993121310191125[64]
Organic sulfatesC-O-(SO2)-O-C1450–13501230–1150[60]
Table 2. Positions of bands assigned to CO and CD3CN coordinated to Zr4+ sites (cm−1). “ND” indicates that the band was not detected.
SampleS-ZrO2UiO-66-BAUiO-66-FAUiO-66-SO4
Activation temperature25 °C450 °C25 °C250 °C25 °C250 °C25 °C250 °C
COND2195NDNDND2173NDND
CD3CN23002305ND23002303230323032300
Disclaimer/Publisher’s Note: The statements, opinions and data contained in all publications are solely those of the individual author(s) and contributor(s) and not of MDPI and/or the editor(s). MDPI and/or the editor(s) disclaim responsibility for any injury to people or property resulting from any ideas, methods, instructions or products referred to in the content.

