

Polystyrene Nano- and Microplastic Particles Induce an Inflammatory Gene Expression Profile in Rat Neural Stem Cell-Derived Astrocytes In Vitro


Abstract
1. Introduction
2. Materials and Methods
2.1. Polystyrene Microspheres
2.2. Cell Culture
2.3. Cytotoxicity Assay
2.4. Flow Cytometry
2.5. Immunofluorescence
2.6. RNA Extraction
2.7. RNA Sequencing
2.8. Pathways Analysis
2.9. Statistical Analysis
3. Results
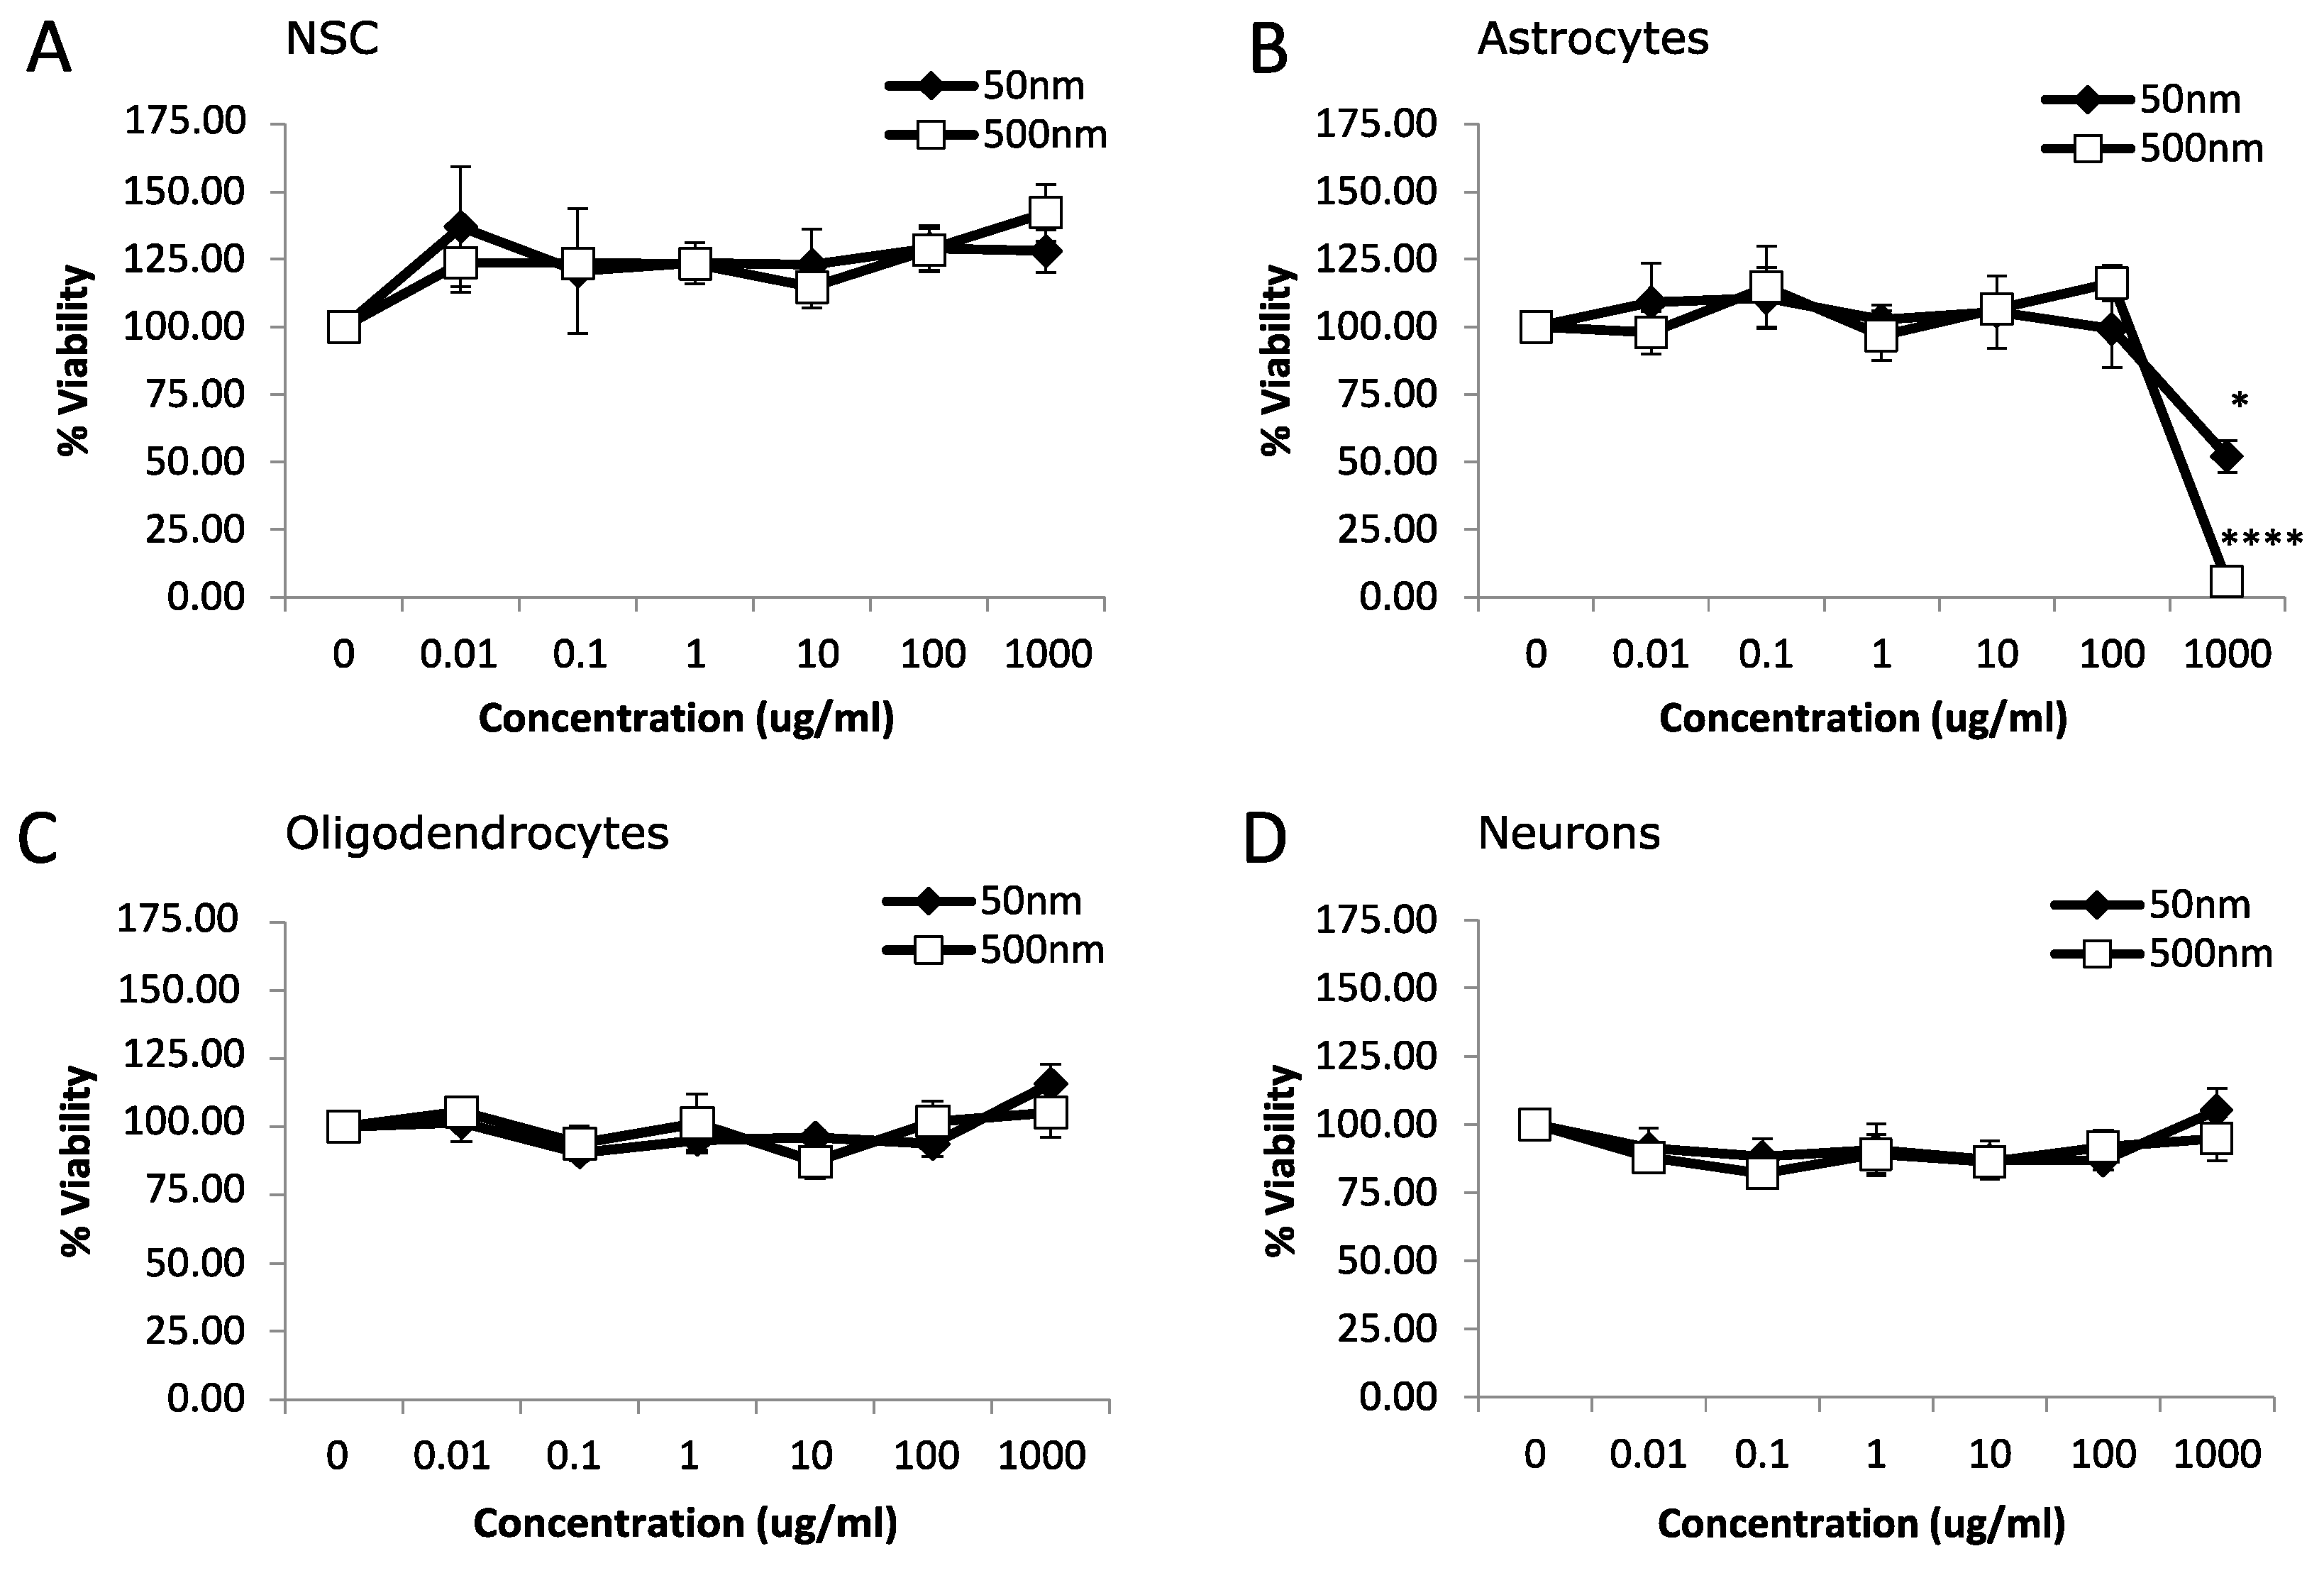
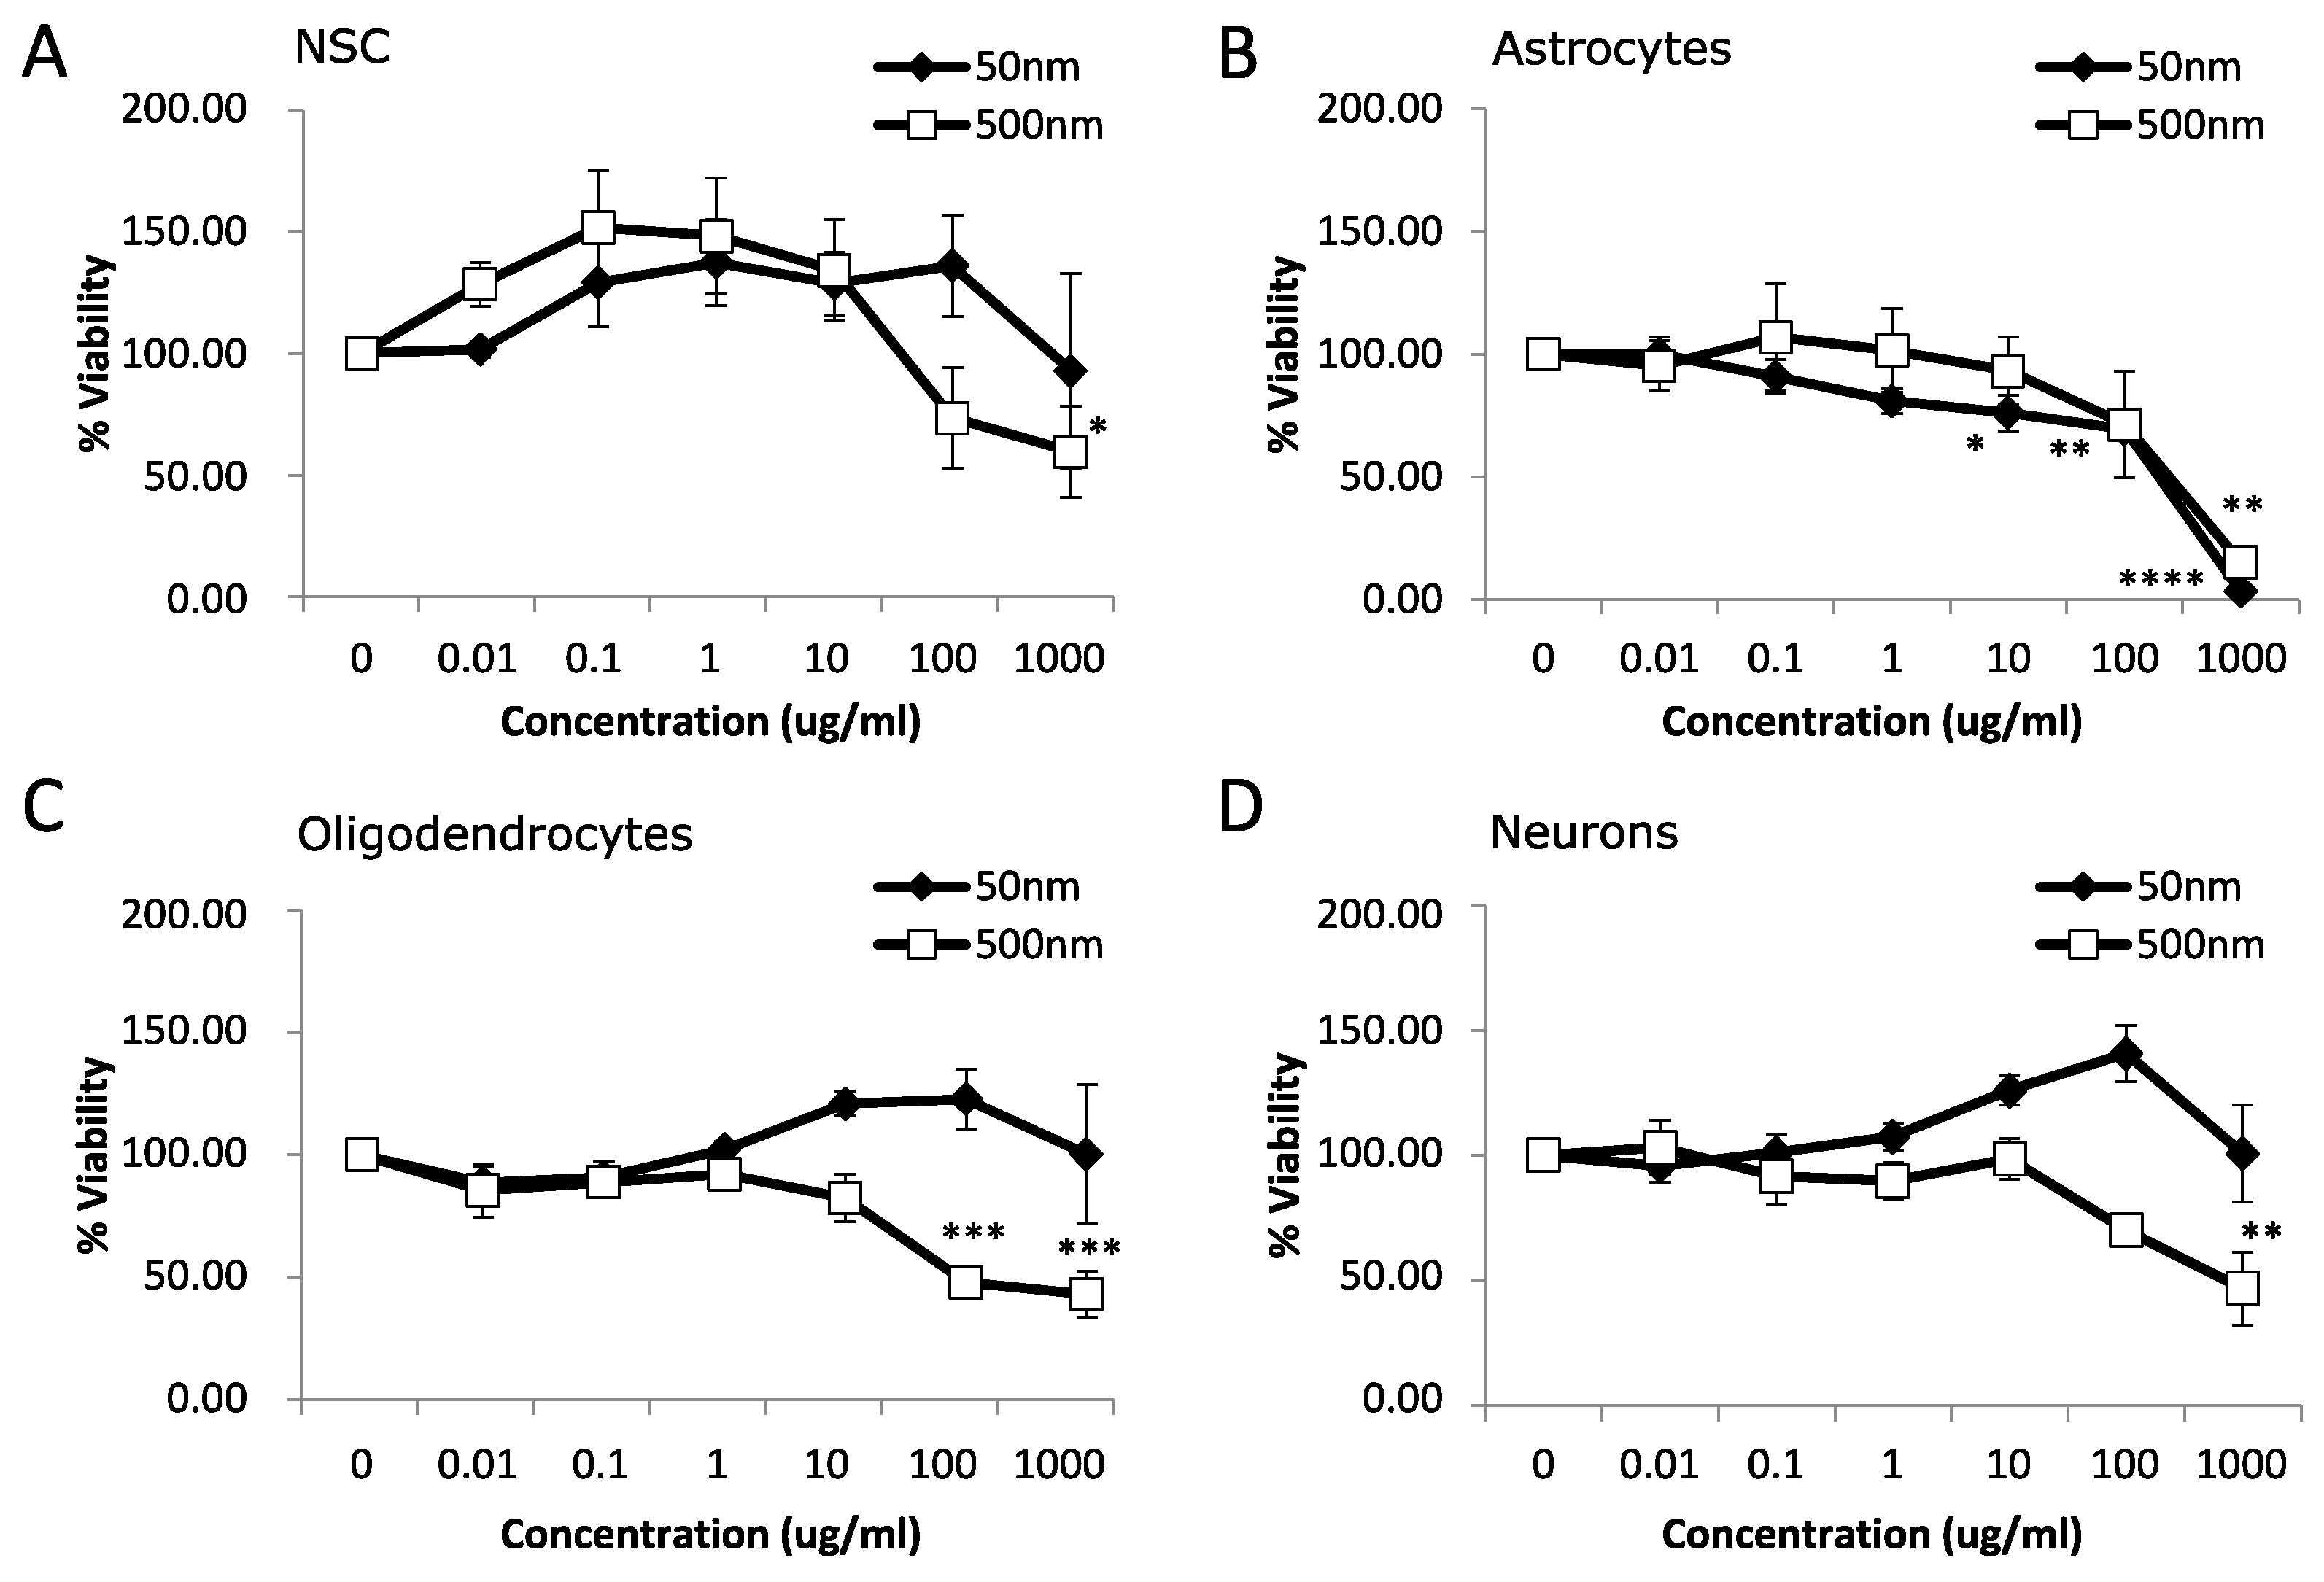
3.1. Cytotoxicity
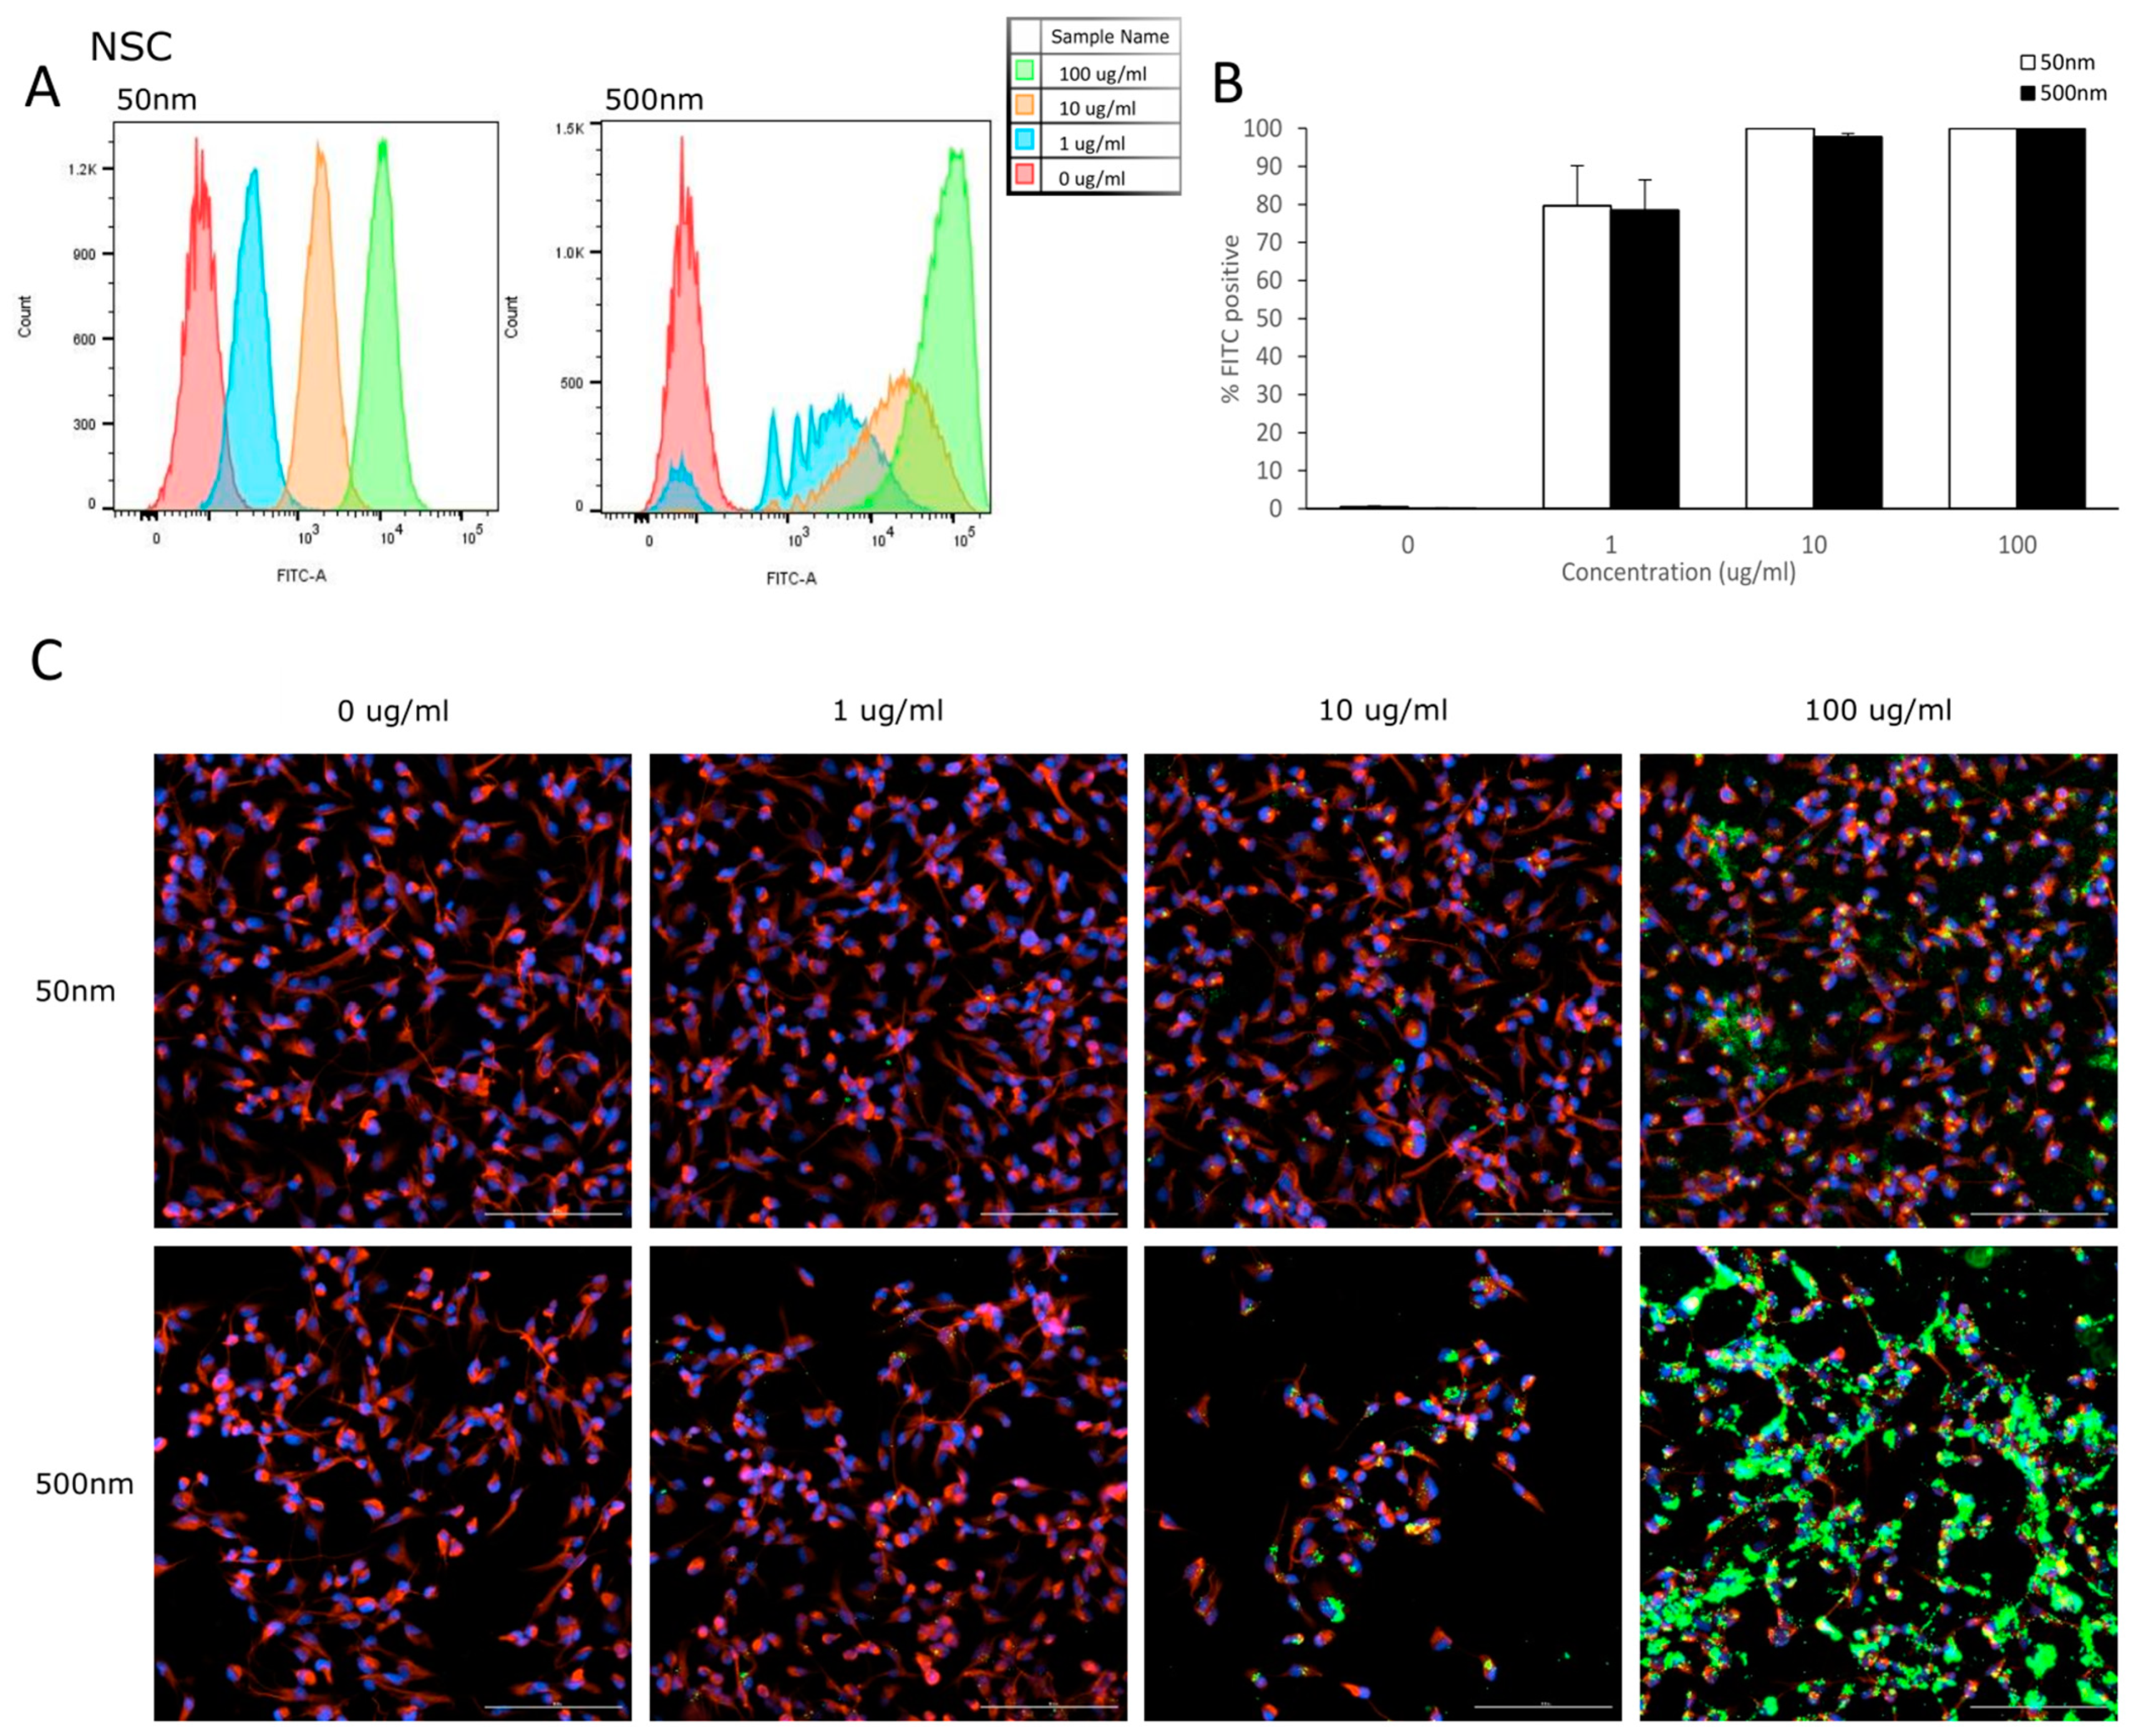
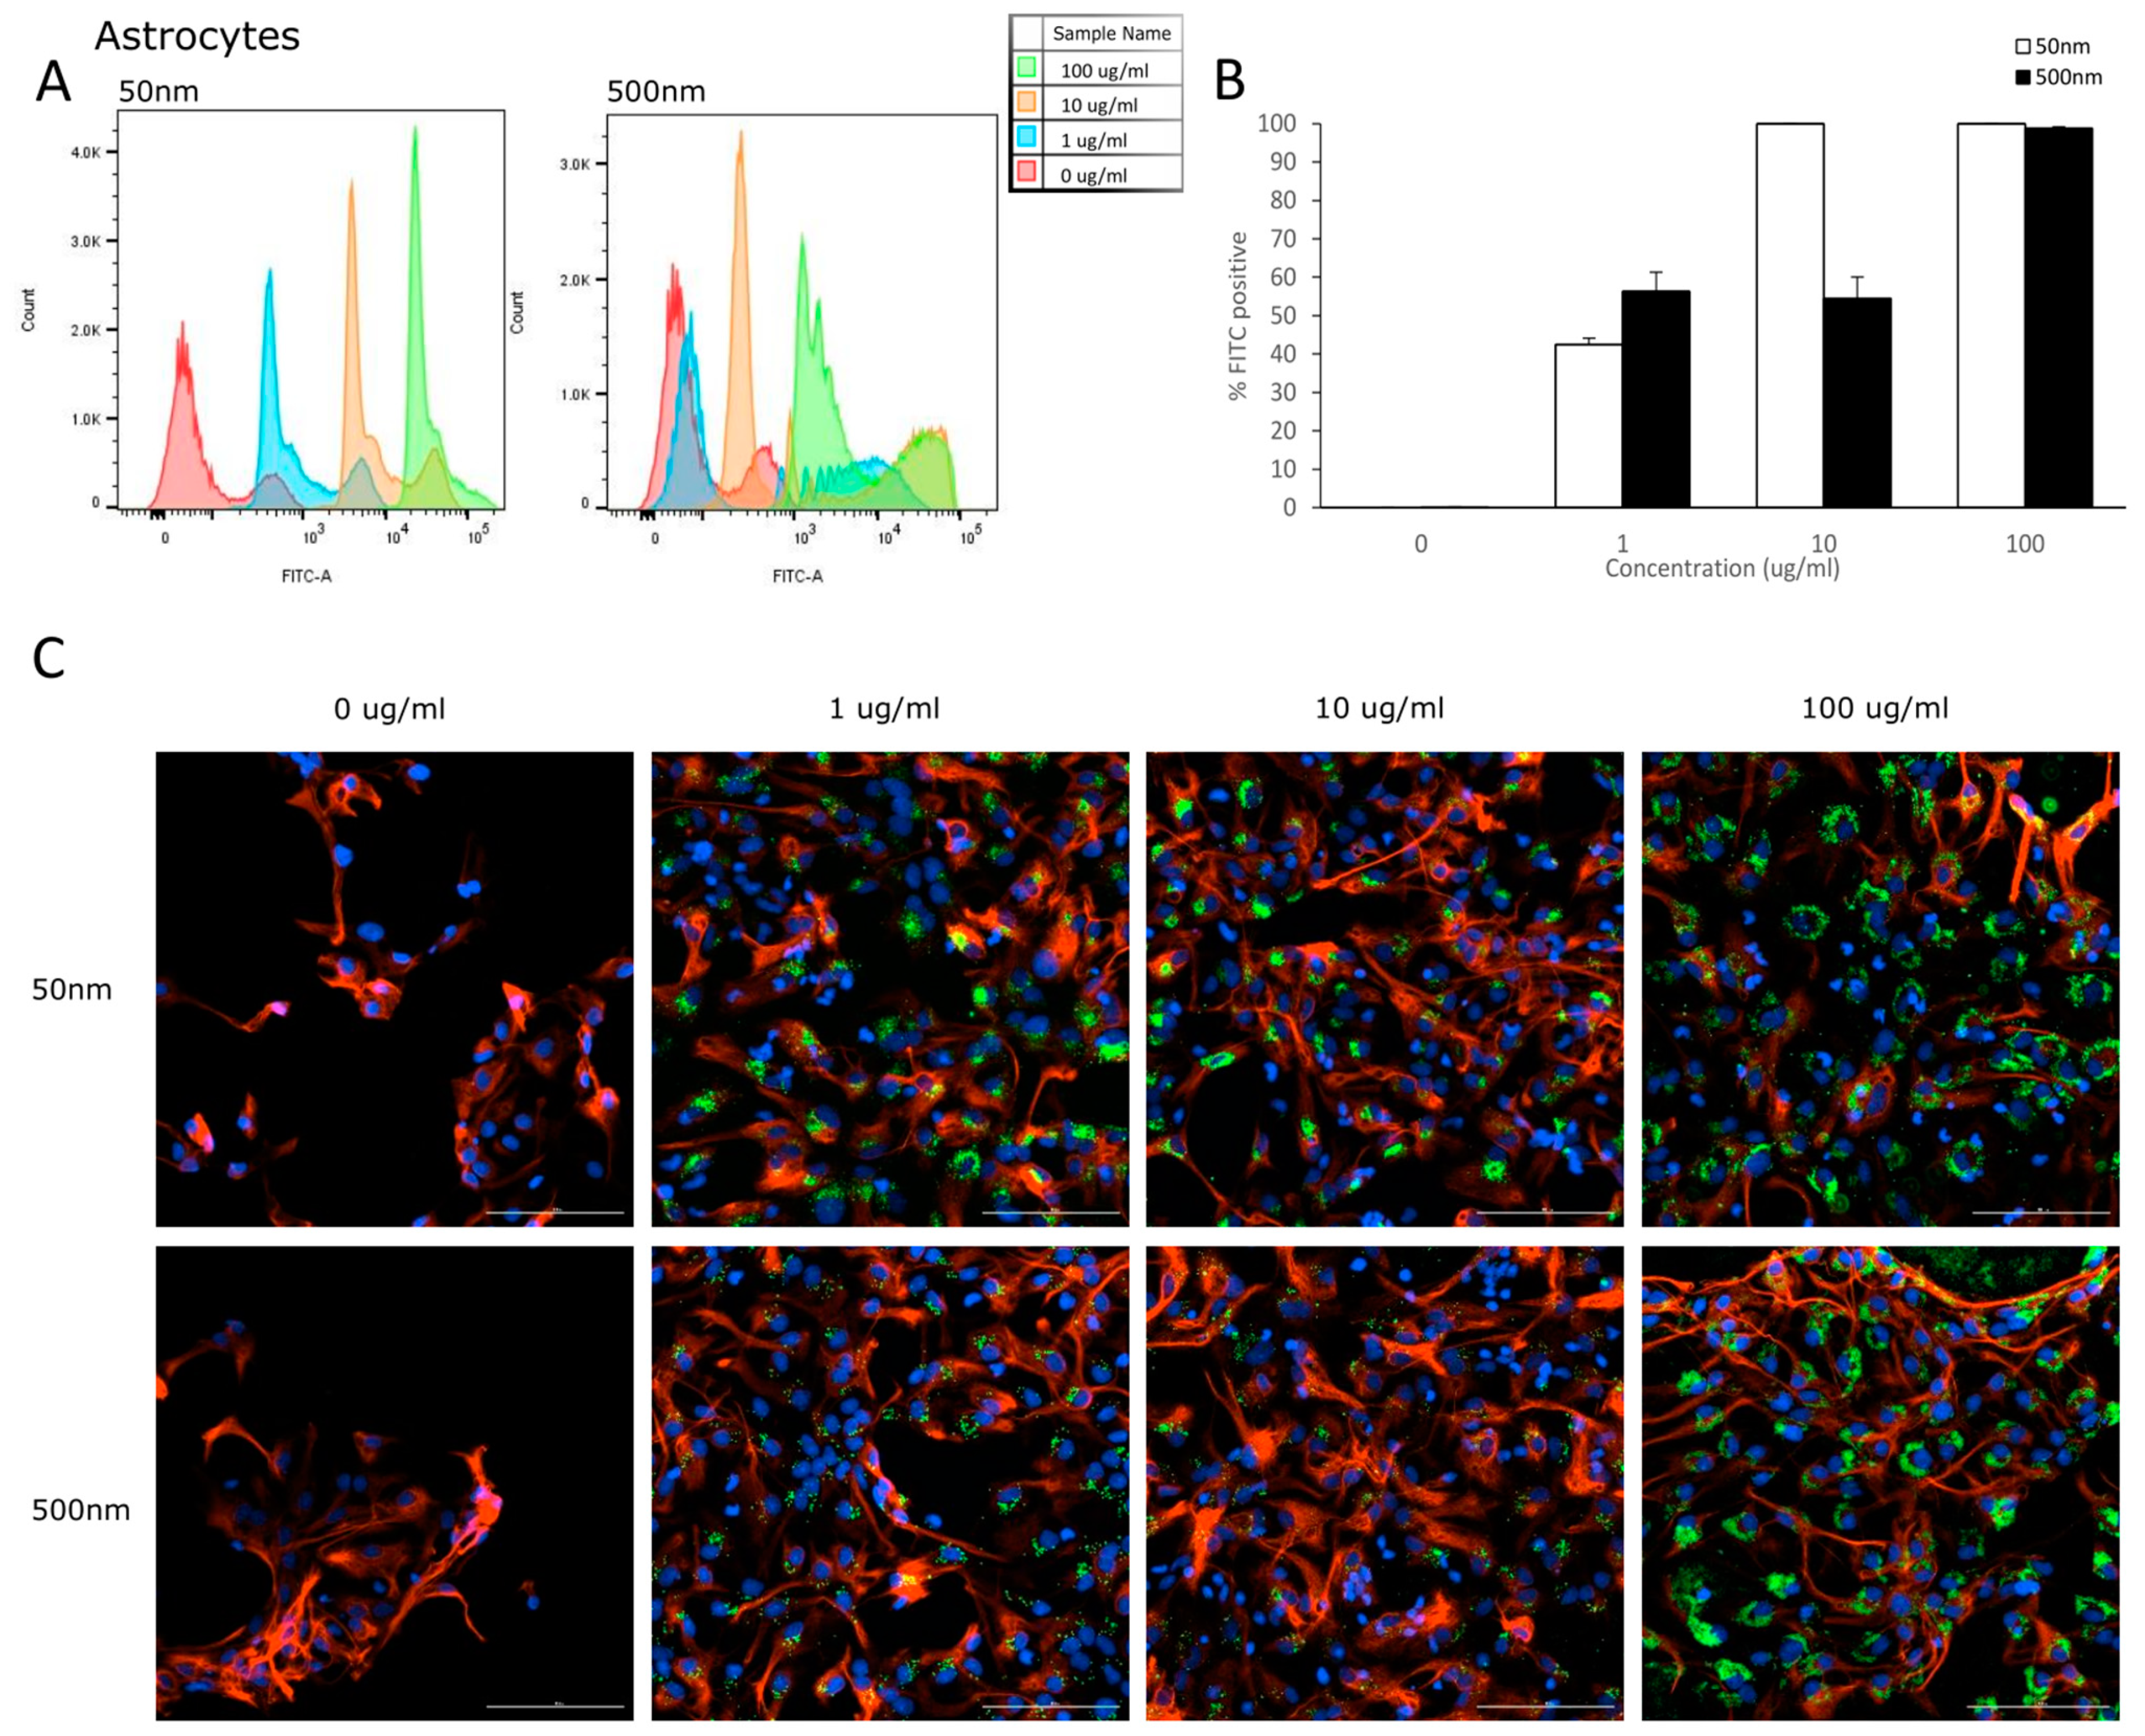
3.2. Cellular Uptake
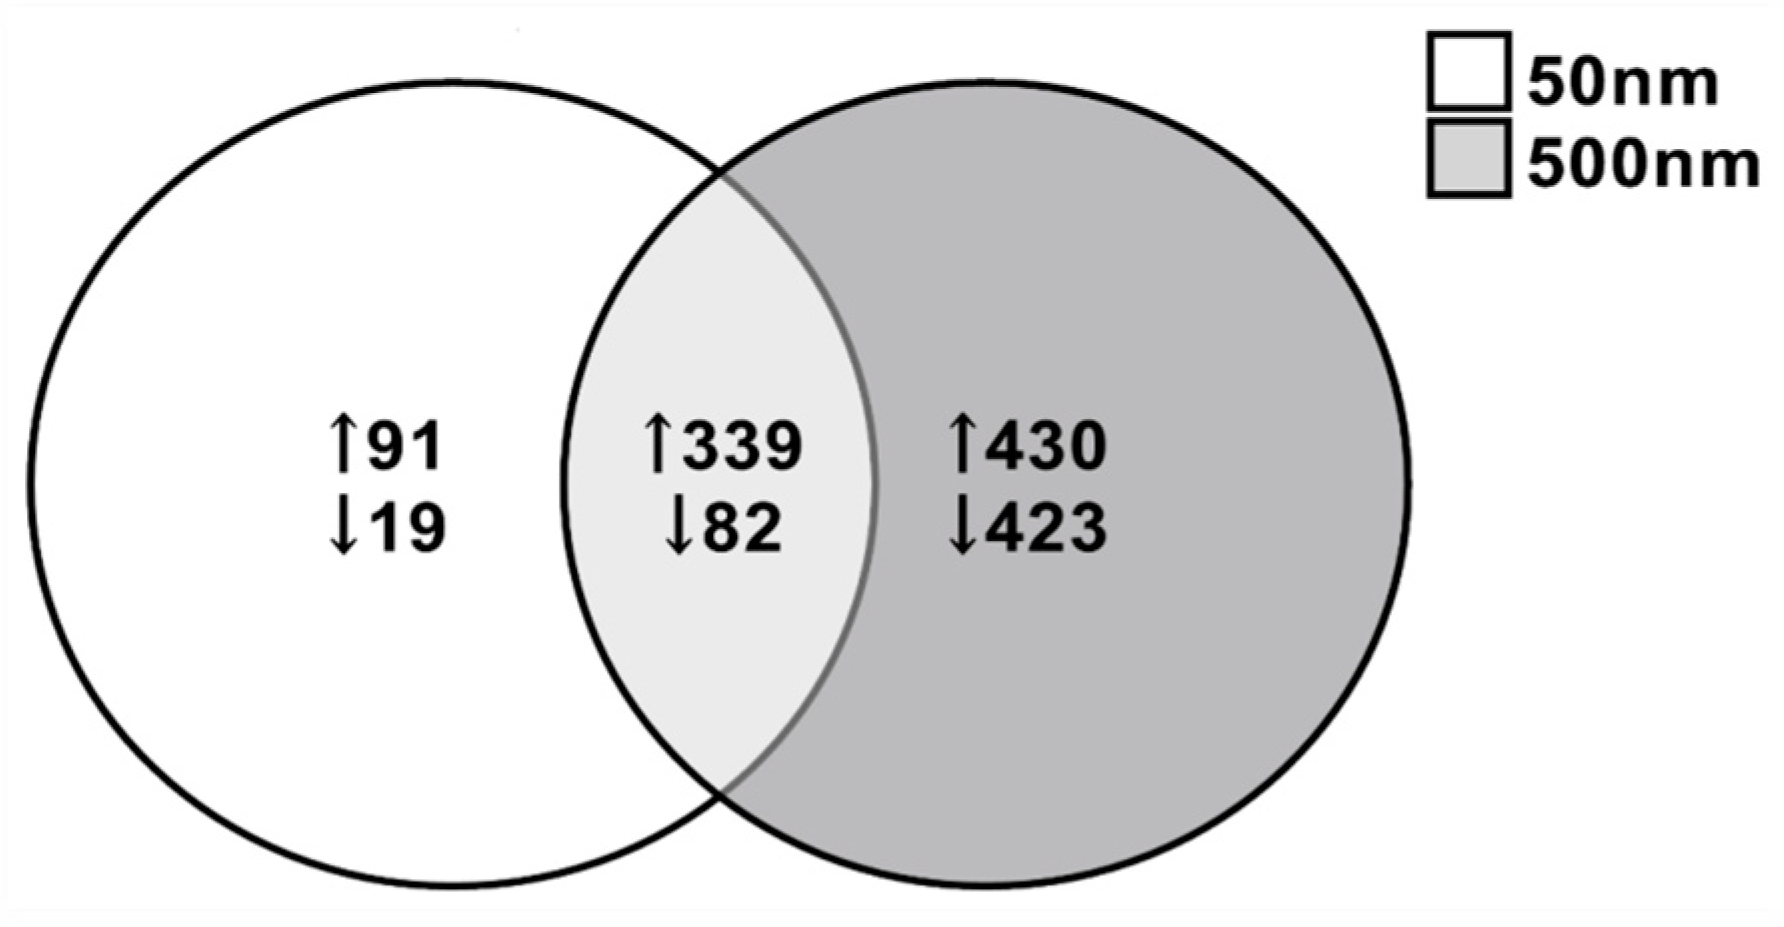
3.3. Differentially Expressed Genes (DEGs)
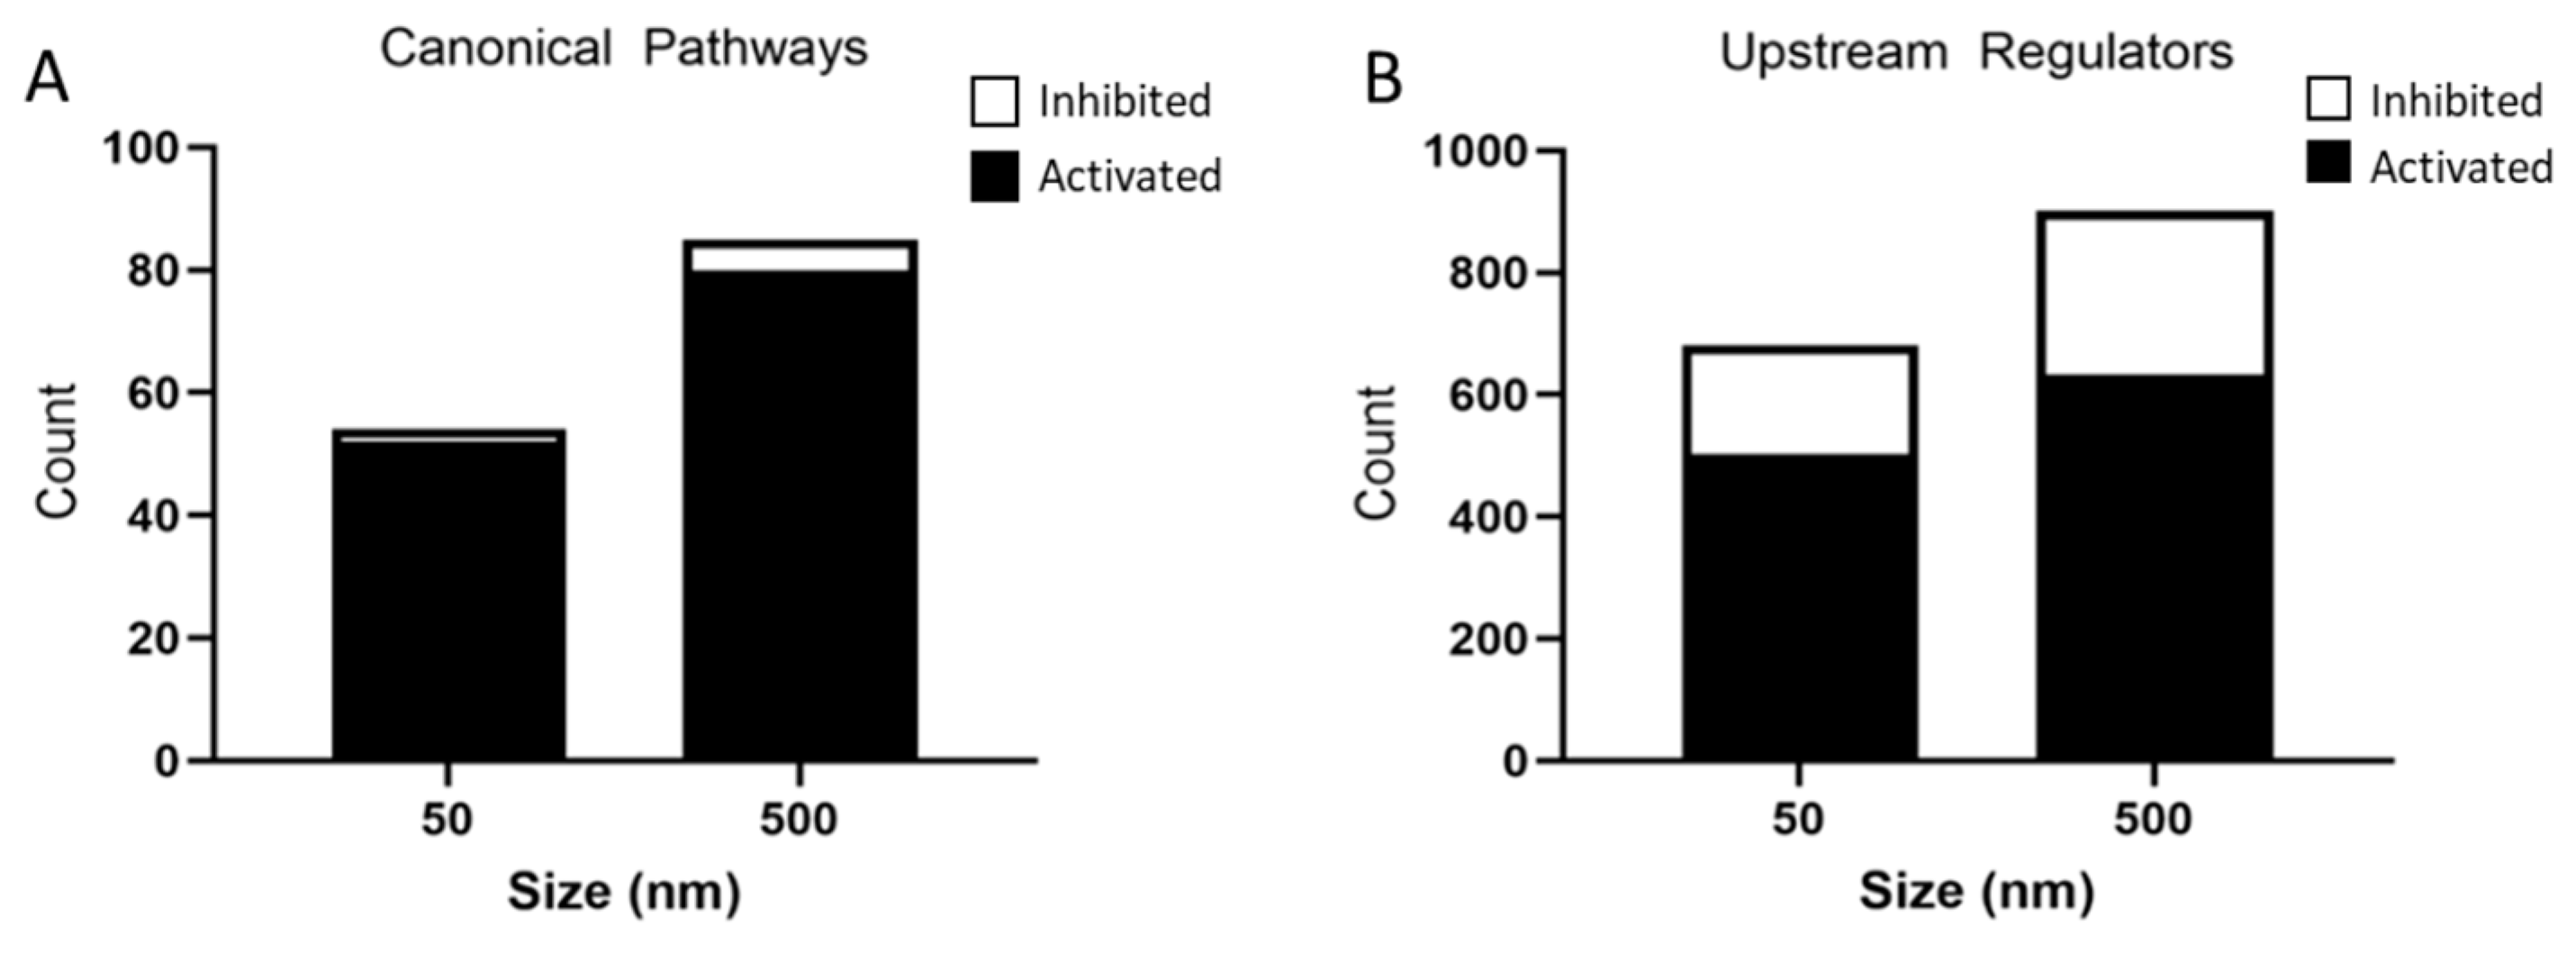
3.4. Predicted Activated and Inhibited Regulators
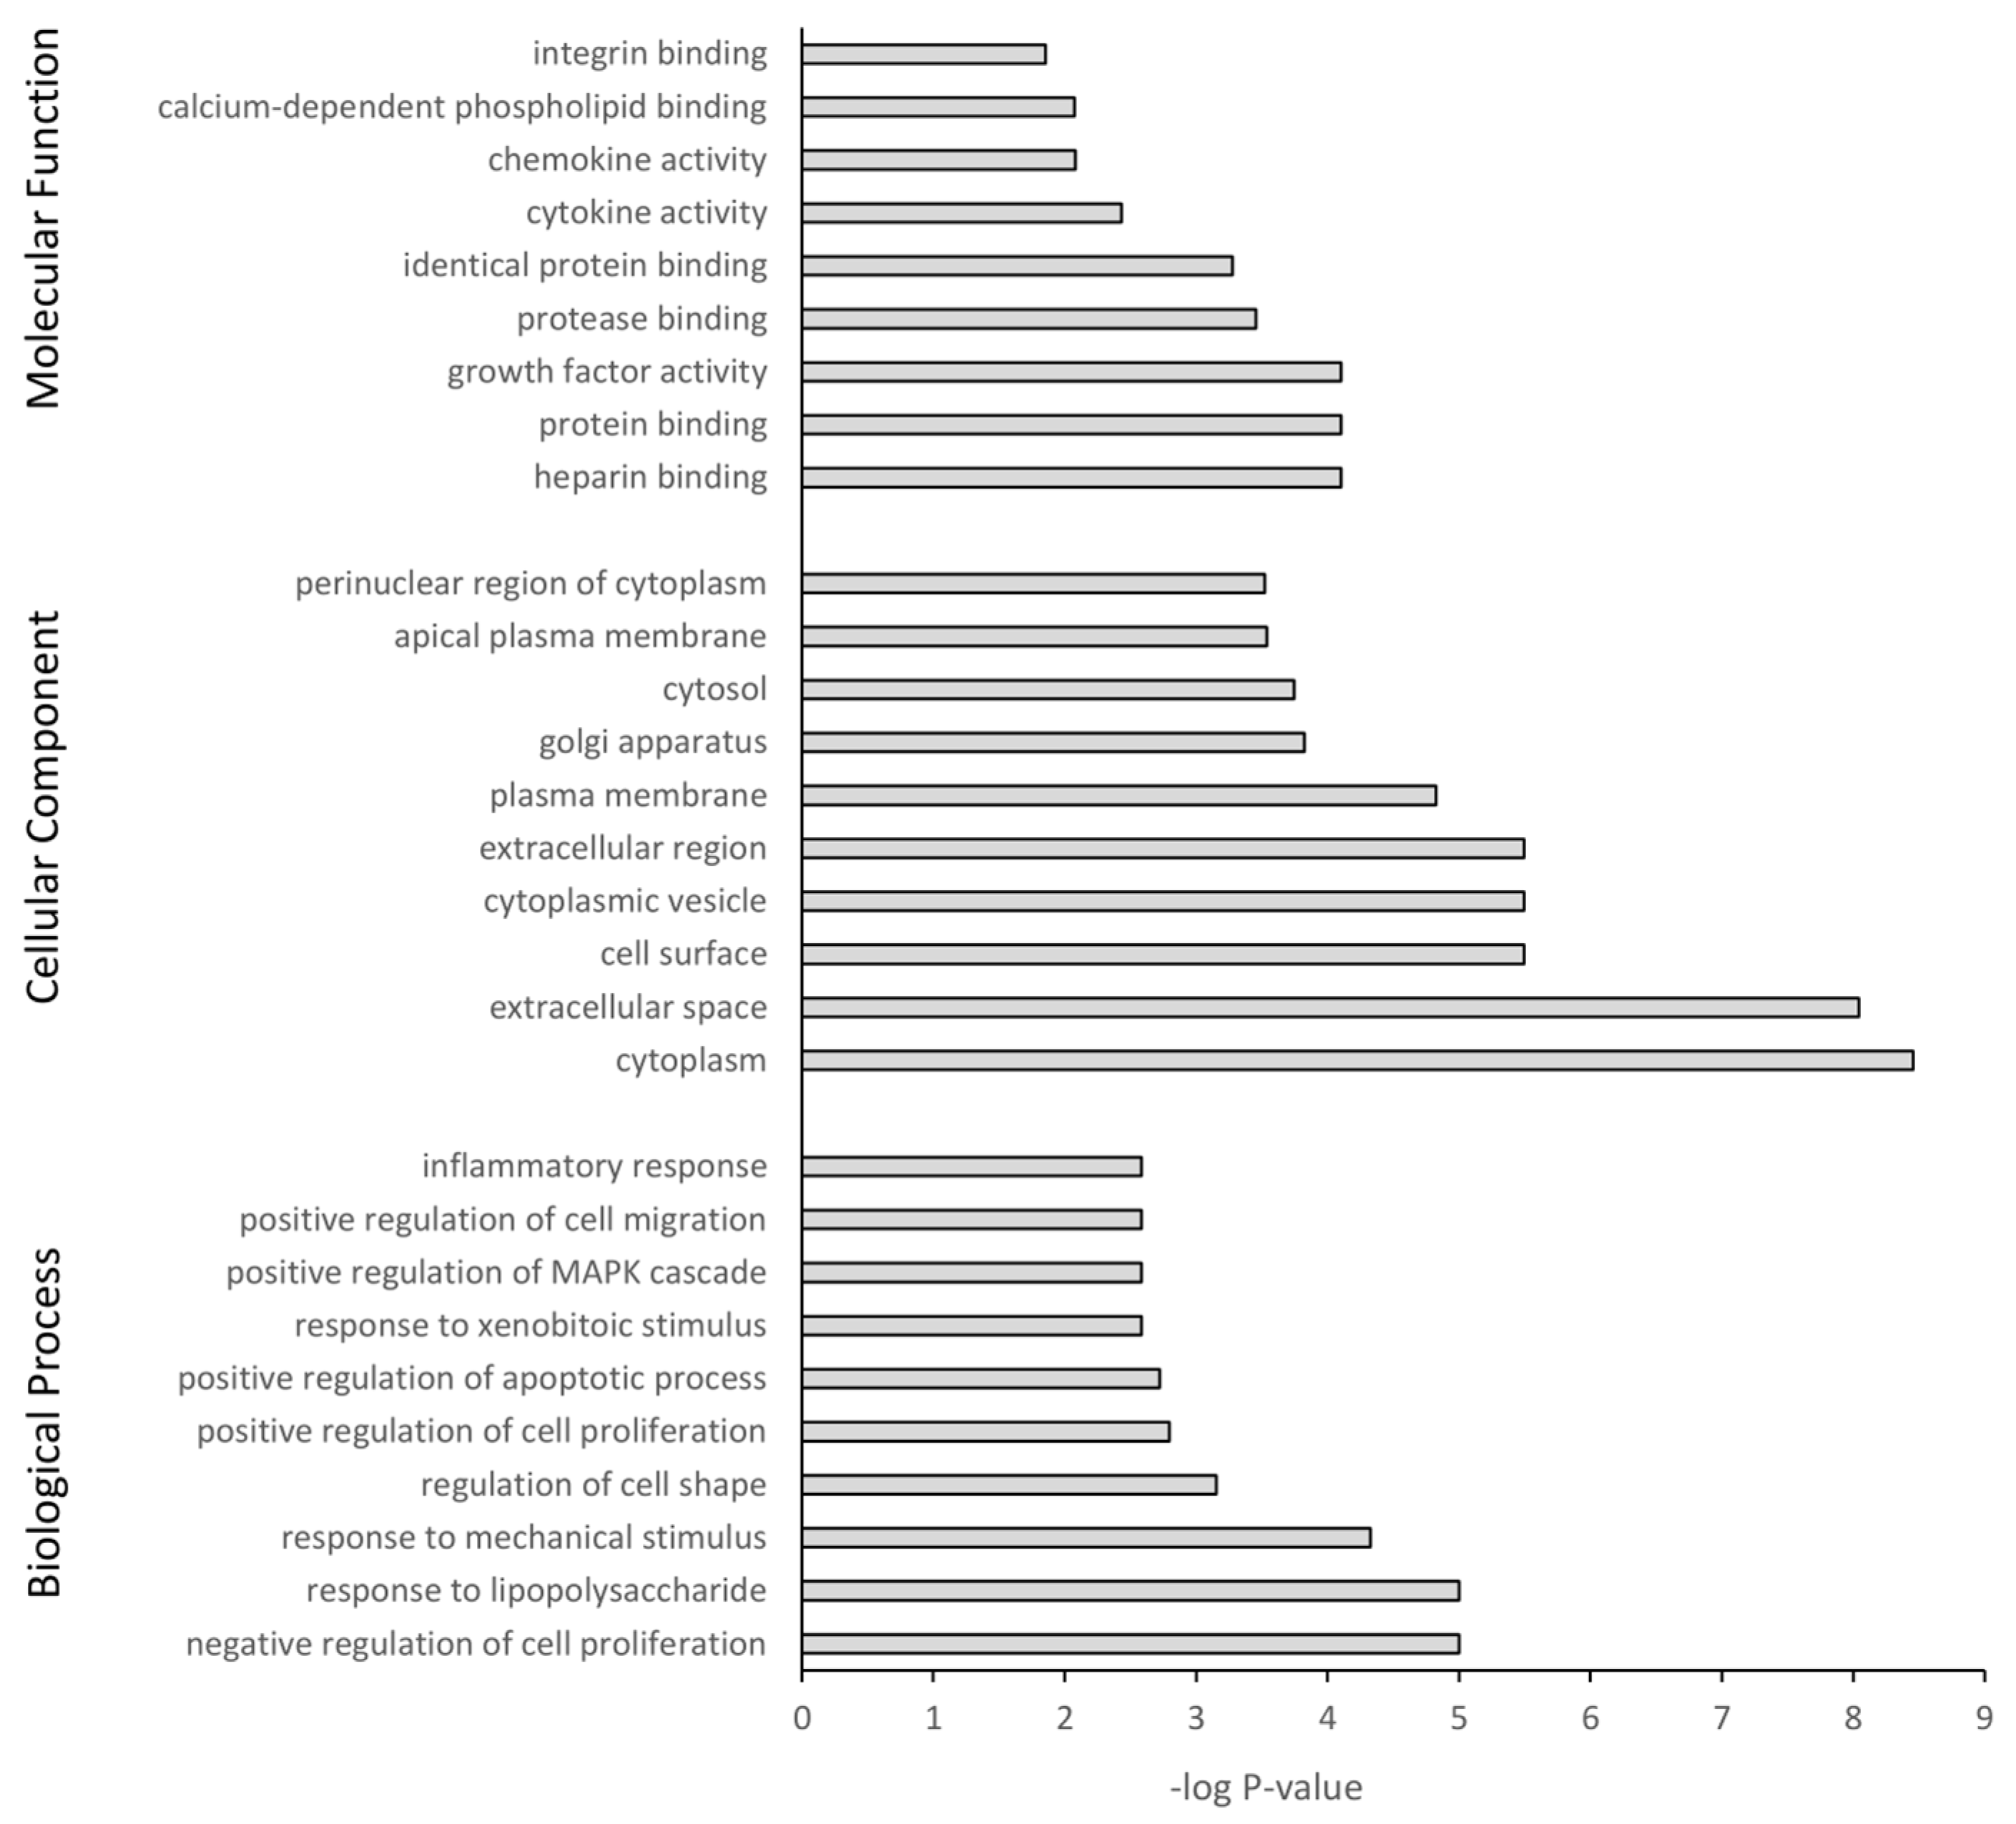
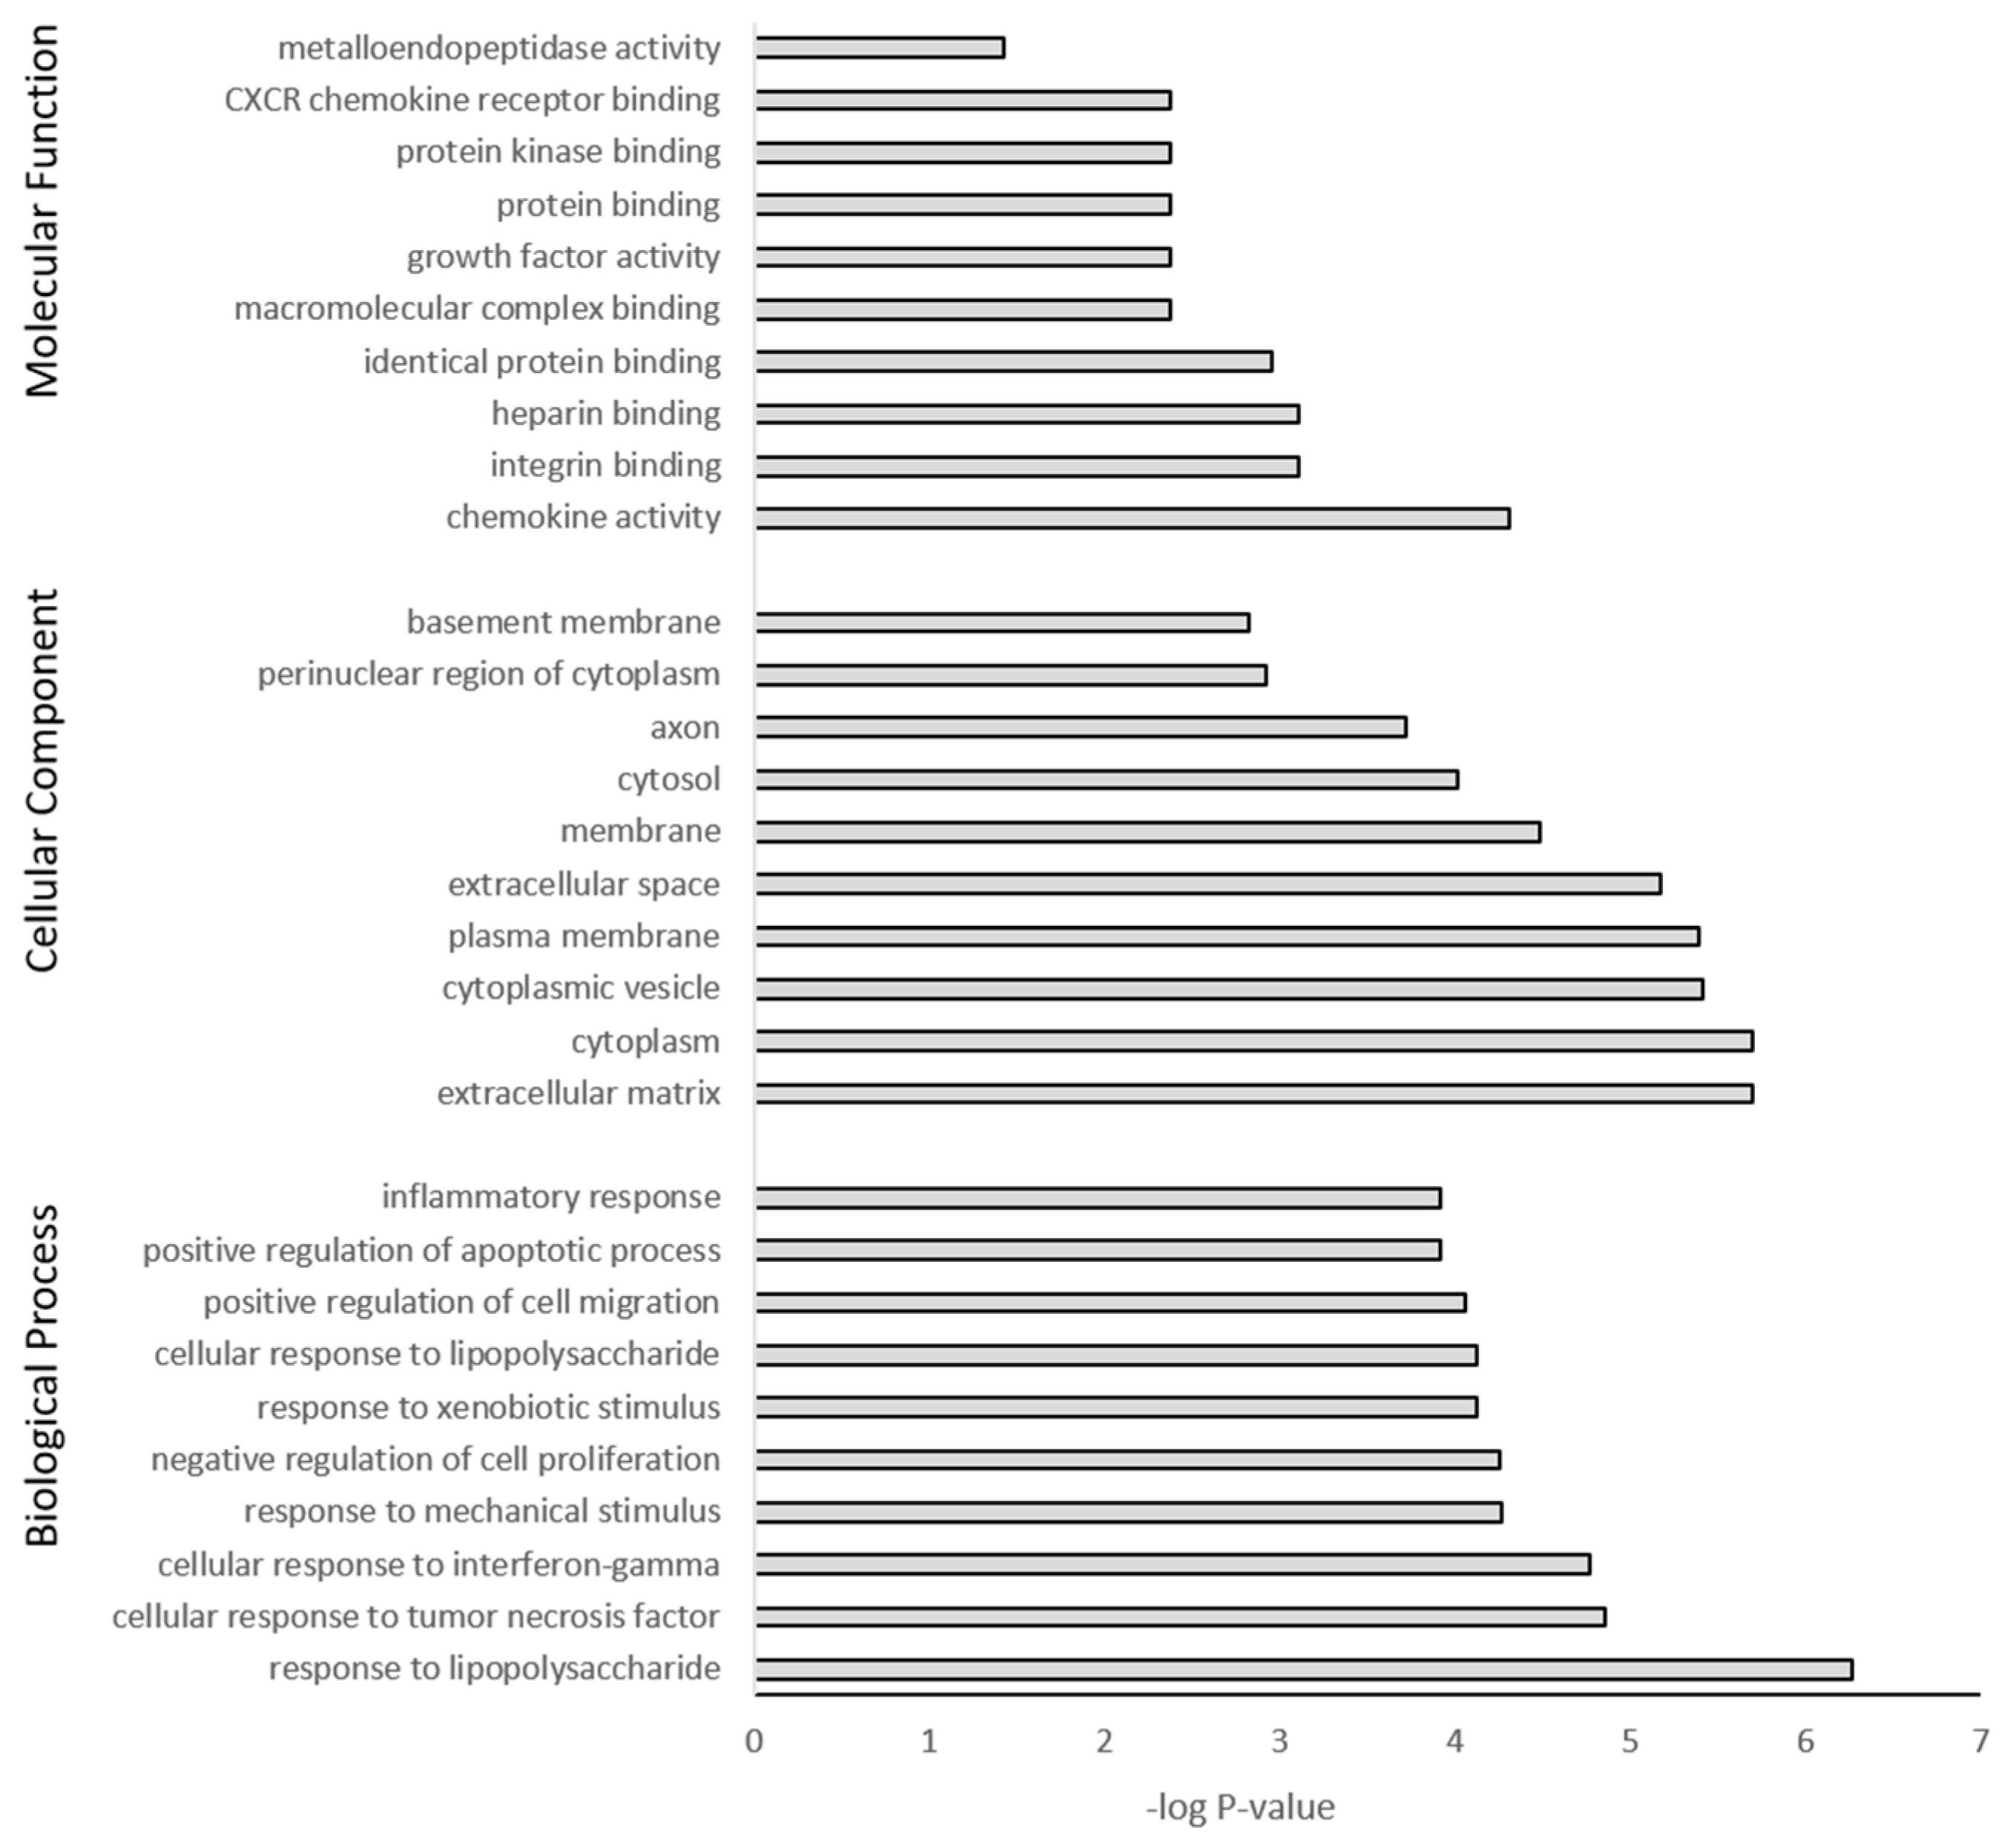
3.5. GO Term Enrichment and KEGG Analysis
3.6. Distinct Pathways
4. Discussion
4.1. Cytotoxicity
4.2. Internalization
4.3. RNA-Seq Analysis
4.3.1. Inflammation
4.3.2. Cytoskeleton and Cell Migration
4.3.3. Ubiquitin Proteasome System
4.3.4. p53 Signaling, Apoptosis, Cellular Senescence
4.3.5. Downregulated Lipid Metabolism
5. Conclusions
Supplementary Materials
Author Contributions
Funding
Data Availability Statement
Acknowledgments
Conflicts of Interest
References
- Cortés, C.; Domenech, J.; Salazar, M.; Pastor, S.; Marcos, R.; Hernández, A. Nanoplastics as a Potential Environmental Health Factor: Effects of Polystyrene Nanoparticles on Human Intestinal Epithelial Caco-2 Cells. Environ. Sci. Nano 2020, 7, 272–285. [Google Scholar] [CrossRef]
- Rubio-Armendáriz, C.; Alejandro-Vega, S.; Paz-Montelongo, S.; Gutiérrez-Fernández, Á.J.; Carrascosa-Iruzubieta, C.J.; Hardisson-de La Torre, A. Microplastics as Emerging Food Contaminants: A Challenge for Food Safety. Int. J. Environ. Res. Public Health 2022, 19, 1174. [Google Scholar] [CrossRef] [PubMed]
- Lee, C.-W.; Hsu, L.-F.; Wu, I.-L.; Wang, Y.-L.; Chen, W.-C.; Liu, Y.-J.; Yang, L.-T.; Tan, C.-L.; Luo, Y.-H.; Wang, C.-C.; et al. Exposure to Polystyrene Microplastics Impairs Hippocampus-Dependent Learning and Memory in Mice. J. Hazard. Mater. 2022, 430, 128431. [Google Scholar] [CrossRef] [PubMed]
- OECD. Global Plastics Outlook: Economic Drivers, Environmental Impacts and Policy Options; OECD Publishing: Paris, France, 2022. [Google Scholar] [CrossRef]
- Llorca, M.; Farré, M. Current Insights into Potential Effects of Micro-Nanoplastics on Human Health by in-Vitro Tests. Front. Toxicol. 2021, 3, 752140. [Google Scholar] [CrossRef]
- Barbosa, F.; Adeyemi, J.A.; Bocato, M.Z.; Comas, A.; Campiglia, A. A Critical Viewpoint on Current Issues, Limitations, and Future Research Needs on Micro- and Nanoplastic Studies: From the Detection to the Toxicological Assessment. Environ. Res. 2020, 182, 109089. [Google Scholar] [CrossRef] [PubMed]
- Visalli, G.; Facciolà, A.; Pruiti Ciarello, M.; De Marco, G.; Maisano, M.; Di Pietro, A. Acute and Sub-Chronic Effects of Microplastics (3 and 10 Μm) on the Human Intestinal Cells HT-29. Int. J. Environ. Res. Public Health 2021, 18, 5833. [Google Scholar] [CrossRef]
- Rahman, A.; Sarkar, A.; Yadav, O.P.; Achari, G.; Slobodnik, J. Potential Human Health Risks Due to Environmental Exposure to Nano- and Microplastics and Knowledge Gaps: A Scoping Review. Sci. Total Environ. 2021, 757, 143872. [Google Scholar] [CrossRef] [PubMed]
- DeLoid, G.M.; Cao, X.; Bitounis, D.; Singh, D.; Llopis, P.M.; Buckley, B.; Demokritou, P. Toxicity, Uptake, and Nuclear Translocation of Ingested Micro-Nanoplastics in an in Vitro Model of the Small Intestinal Epithelium. Food Chem. Toxicol. 2021, 158, 112609. [Google Scholar] [CrossRef]
- Evangeliou, N.; Grythe, H.; Klimont, Z.; Heyes, C.; Eckhardt, S.; Lopez-Aparicio, S.; Stohl, A. Atmospheric Transport Is a Major Pathway of Microplastics to Remote Regions. Nat. Commun. 2020, 11, 3381. [Google Scholar] [CrossRef]
- Parolini, M.; Antonioli, D.; Borgogno, F.; Gibellino, M.C.; Fresta, J.; Albonico, C.; De Felice, B.; Canuto, S.; Concedi, D.; Romani, A.; et al. Microplastic Contamination in Snow from Western Italian Alps. Int. J. Environ. Res. Public Health 2021, 18, 768. [Google Scholar] [CrossRef]
- Wu, B.; Wu, X.; Liu, S.; Wang, Z.; Chen, L. Size-Dependent Effects of Polystyrene Microplastics on Cytotoxicity and Efflux Pump Inhibition in Human Caco-2 Cells. Chemosphere 2019, 221, 333–341. [Google Scholar] [CrossRef]
- Mei, T.; Wang, J.; Xiao, X.; Lv, J.; Li, Q.; Dai, H.; Liu, X.; Pi, F. Identification and Evaluation of Microplastics from Tea Filter Bags Based on Raman Imaging. Foods 2022, 11, 2871. [Google Scholar] [CrossRef] [PubMed]
- Blackburn, K.; Green, D. The Potential Effects of Microplastics on Human Health: What Is Known and What Is Unknown. Ambio 2022, 51, 518–530. [Google Scholar] [CrossRef] [PubMed]
- Da Costa Filho, P.A.; Andrey, D.; Eriksen, B.; Peixoto, R.P.; Carreres, B.M.; Ambühl, M.E.; Descarrega, J.B.; Dubascoux, S.; Zbinden, P.; Panchaud, A.; et al. Detection and Characterization of Small-Sized Microplastics (≥5 Μm) in Milk Products. Sci. Rep. 2021, 11, 24046. [Google Scholar] [CrossRef] [PubMed]
- Jung, B.-K.; Han, S.-W.; Park, S.-H.; Bae, J.-S.; Choi, J.; Ryu, K.-Y. Neurotoxic Potential of Polystyrene Nanoplastics in Primary Cells Originating from Mouse Brain. NeuroToxicology 2020, 81, 189–196. [Google Scholar] [CrossRef] [PubMed]
- Liang, B.; Huang, Y.; Zhong, Y.; Li, Z.; Ye, R.; Wang, B.; Zhang, B.; Meng, H.; Lin, X.; Du, J.; et al. Brain Single-Nucleus Transcriptomics Highlights That Polystyrene Nanoplastics Potentially Induce Parkinson’s Disease-like Neurodegeneration by Causing Energy Metabolism Disorders in Mice. J. Hazard. Mater. 2022, 430, 128459. [Google Scholar] [CrossRef] [PubMed]
- Li, Q.; Feng, Z.; Zhang, T.; Ma, C.; Shi, H. Microplastics in the Commercial Seaweed Nori. J. Hazard. Mater. 2020, 388, 122060. [Google Scholar] [CrossRef] [PubMed]
- Schwabl, P.; Köppel, S.; Königshofer, P.; Bucsics, T.; Trauner, M.; Reiberger, T.; Liebmann, B. Detection of Various Microplastics in Human Stool: A Prospective Case Series. Ann. Intern. Med. 2019, 171, 453–457. [Google Scholar] [CrossRef] [PubMed]
- Zhang, J.; Wang, L.; Trasande, L.; Kannan, K. Occurrence of Polyethylene Terephthalate and Polycarbonate Microplastics in Infant and Adult Feces. Environ. Sci. Technol. Lett. 2021, 8, 989–994. [Google Scholar] [CrossRef]
- Ragusa, A.; Svelato, A.; Santacroce, C.; Catalano, P.; Notarstefano, V.; Carnevali, O.; Papa, F.; Rongioletti, M.C.A.; Baiocco, F.; Draghi, S.; et al. Plasticenta: First Evidence of Microplastics in Human Placenta. Environ. Int. 2021, 146, 106274. [Google Scholar] [CrossRef]
- Amato-Lourenço, L.F.; Carvalho-Oliveira, R.; Júnior, G.R.; Dos Santos Galvão, L.; Ando, R.A.; Mauad, T. Presence of Airborne Microplastics in Human Lung Tissue. J. Hazard. Mater. 2021, 416, 126124. [Google Scholar] [CrossRef]
- Hua, T.; Kiran, S.; Li, Y.; Sang, Q.-X.A. Microplastics Exposure Affects Neural Development of Human Pluripotent Stem Cell-Derived Cortical Spheroids. J. Hazard. Mater. 2022, 435, 128884. [Google Scholar] [CrossRef]
- Wang, Y.-L.; Lee, Y.-H.; Hsu, Y.-H.; Chiu, I.-J.; Huang, C.C.-Y.; Huang, C.-C.; Chia, Z.-C.; Lee, C.-P.; Lin, Y.-F.; Chiu, H.-W. The Kidney-Related Effects of Polystyrene Microplastics on Human Kidney Proximal Tubular Epithelial Cells HK-2 and Male C57BL/6 Mice. Environ. Health Perspect. 2021, 129, 057003. [Google Scholar] [CrossRef]
- EFSA CONTAM Panel (EFSA Panel on Contaminants in the Food Chain). Statement on the presence of microplastics and nanoplastics in food, with particular focus on seafood. EFSA J. 2016, 14, 4501. [Google Scholar] [CrossRef]
- Lusher, A.; Hollman, P.C.H.; Mendoza-Hill, J. Microplastics in Fisheries and Aquaculture: Status of Knowledge on Their Occurrence and Implications for Aquatic Organisms and Food Safety; FAO Fisheries and Aquaculture Technical Paper; Food and Agriculture Organization of the United Nations: Rome, Italy, 2017; Available online: https://api.semanticscholar.org/CorpusID:133681074 (accessed on 25 August 2023).
- Wright, S.L.; Kelly, F.J. Plastic and Human Health: A Micro Issue? Environ. Sci. Technol. 2017, 51, 6634–6647. [Google Scholar] [CrossRef]
- Fleury, J.-B.; Baulin, V.A. Microplastics Destabilize Lipid Membranes by Mechanical Stretching. Proc. Natl. Acad. Sci. USA 2021, 118, e2104610118. [Google Scholar] [CrossRef]
- Kiran, B.R.; Kopperi, H.; Venkata Mohan, S. Micro/Nano-Plastics Occurrence, Identification, Risk Analysis and Mitigation: Challenges and Perspectives. Rev. Environ. Sci. Biotechnol. 2022, 21, 169–203. [Google Scholar] [CrossRef]
- Kopatz, V.; Wen, K.; Kovács, T.; Keimowitz, A.S.; Pichler, V.; Widder, J.; Vethaak, A.D.; Hollóczki, O.; Kenner, L. Micro- and Nanoplastics Breach the Blood–Brain Barrier (BBB): Biomolecular Corona’s Role Revealed. Nanomaterials 2023, 13, 1404. [Google Scholar] [CrossRef] [PubMed]
- Kannan, K.; Vimalkumar, K. A Review of Human Exposure to Microplastics and Insights Into Microplastics as Obesogens. Front. Endocrinol. 2021, 12, 724989. [Google Scholar] [CrossRef] [PubMed]
- Wick, P.; Malek, A.; Manser, P.; Meili, D.; Maeder-Althaus, X.; Diener, L.; Diener, P.-A.; Zisch, A.; Krug, H.F.; von Mandach, U. Barrier Capacity of Human Placenta for Nanosized Materials. Environ. Health Perspect. 2010, 118, 432–436. [Google Scholar] [CrossRef] [PubMed]
- Zhang, X.; Wen, K.; Ding, D.; Liu, J.; Lei, Z.; Chen, X.; Ye, G.; Zhang, J.; Shen, H.; Yan, C.; et al. Size-Dependent Adverse Effects of Microplastics on Intestinal Microbiota and Metabolic Homeostasis in the Marine Medaka (Oryzias melastigma). Environ. Int. 2021, 151, 106452. [Google Scholar] [CrossRef]
- Wang, C.; Hou, M.; Shang, K.; Wang, H.; Wang, J. Microplastics (Polystyrene) Exposure Induces Metabolic Changes in the Liver of Rare Minnow (Gobiocypris rarus). Molecules 2022, 27, 584. [Google Scholar] [CrossRef] [PubMed]
- Schmidt, A.; Mühl, M.; Brito, W.A.D.S.; Singer, D.; Bekeschus, S. Antioxidant Defense in Primary Murine Lung Cells Following Short- and Long-Term Exposure to Plastic Particles. Antioxidants 2023, 12, 227. [Google Scholar] [CrossRef] [PubMed]
- Wang, S.; Han, Q.; Wei, Z.; Wang, Y.; Xie, J.; Chen, M. Polystyrene Microplastics Affect Learning and Memory in Mice by Inducing Oxidative Stress and Decreasing the Level of Acetylcholine. Food Chem. Toxicol. 2022, 162, 112904. [Google Scholar] [CrossRef] [PubMed]
- Prüst, M.; Meijer, J.; Westerink, R.H.S. The Plastic Brain: Neurotoxicity of Micro- and Nanoplastics. Part. Fibre Toxicol. 2020, 17, 24. [Google Scholar] [CrossRef]
- Sökmen, T.Ö.; Sulukan, E.; Türkoğlu, M.; Baran, A.; Özkaraca, M.; Ceyhun, S.B. Polystyrene Nanoplastics (20 Nm) Are Able to Bioaccumulate and Cause Oxidative DNA Damages in the Brain Tissue of Zebrafish Embryo (Danio rerio). NeuroToxicology 2020, 77, 51–59. [Google Scholar] [CrossRef]
- Shan, S.; Zhang, Y.; Zhao, H.; Zeng, T.; Zhao, X. Polystyrene Nanoplastics Penetrate across the Blood-Brain Barrier and Induce Activation of Microglia in the Brain of Mice. Chemosphere 2022, 298, 134261. [Google Scholar] [CrossRef]
- Kwon, W.; Kim, D.; Kim, H.-Y.; Jeong, S.W.; Lee, S.-G.; Kim, H.-C.; Lee, Y.-J.; Kwon, M.K.; Hwang, J.-S.; Han, J.E.; et al. Microglial Phagocytosis of Polystyrene Microplastics Results in Immune Alteration and Apoptosis In Vitro and In Vivo. Sci. Total Environ. 2022, 807, 150817. [Google Scholar] [CrossRef]
- Murali, K.; Kenesei, K.; Li, Y.; Demeter, K.; Környei, Z.; Madarász, E. Uptake and Bio-Reactivity of Polystyrene Nanoparticles Is Affected by Surface Modifications, Ageing and LPS Adsorption: In Vitro Studies on Neural Tissue Cells. Nanoscale 2015, 7, 4199–4210. [Google Scholar] [CrossRef]
- Zakrzewski, W.; Dobrzyński, M.; Szymonowicz, M.; Rybak, Z. Stem Cells: Past, Present, and Future. Stem Cell Res. Ther. 2019, 10, 68. [Google Scholar] [CrossRef]
- Jendelova, P.; Sykova, E.; Erceg, S. Neural Stem Cells Derived from Human-Induced Pluripotent Stem Cells and Their Use in Models of CNS Injury. In Human Neural Stem Cells: From Generation to Differentiation and Application; Buzanska, L., Ed.; Results and Problems in Cell Differentiation; Springer International Publishing: Cham, Switzerland, 2018; pp. 89–102. [Google Scholar] [CrossRef]
- Chojnacki, A.; Weiss, S. Production of Neurons, Astrocytes and Oligodendrocytes from Mammalian CNS Stem Cells. Nat. Protoc. 2008, 3, 935–940. [Google Scholar] [CrossRef] [PubMed]
- Homem, C.C.F.; Repic, M.; Knoblich, J.A. Proliferation Control in Neural Stem and Progenitor Cells. Nat. Rev. Neurosci. 2015, 16, 647–659. [Google Scholar] [CrossRef] [PubMed]
- Pekny, M.; Pekna, M. Astrocyte Reactivity and Reactive Astrogliosis: Costs and Benefits. Physiol. Rev. 2014, 94, 1077–1098. [Google Scholar] [CrossRef] [PubMed]
- Jurga, A.M.; Paleczna, M.; Kadluczka, J.; Kuter, K.Z. Beyond the GFAP-Astrocyte Protein Markers in the Brain. Biomolecules 2021, 11, 1361. [Google Scholar] [CrossRef] [PubMed]
- Moulson, A.J.; Squair, J.W.; Franklin, R.J.M.; Tetzlaff, W.; Assinck, P. Diversity of Reactive Astrogliosis in CNS Pathology: Heterogeneity or Plasticity? Front. Cell. Neurosci. 2021, 15, 703810. [Google Scholar] [CrossRef] [PubMed]
- Sofroniew, M.V. Astrocyte Reactivity: Subtypes, States, and Functions in CNS Innate Immunity. Trends Immunol. 2020, 41, 758–770. [Google Scholar] [CrossRef]
- Colombo, E.; Farina, C. Astrocytes: Key Regulators of Neuroinflammation. Trends Immunol. 2016, 37, 608–620. [Google Scholar] [CrossRef]
- Kumara, G. Detecting Neurodevelopmental Toxicity of Domoic Acid and Ochratoxin A Using Rat Fetal Neural Stem Cells. Mar. Drugs 2019, 17, 566. [Google Scholar] [CrossRef]
- Dobin, A.; Davis, C.A.; Schlesinger, F.; Drenkow, J.; Zaleski, C.; Jha, S.; Batut, P.; Chaisson, M.; Gingeras, T.R. STAR: Ultrafast Universal RNA-Seq Aligner. Bioinformatics 2013, 29, 15–21. [Google Scholar] [CrossRef] [PubMed]
- Love, M.I.; Huber, W.; Anders, S. Moderated Estimation of Fold Change and Dispersion for RNA-Seq Data with DESeq2. Genome Biol. 2014, 15, 550. [Google Scholar] [CrossRef] [PubMed]
- Huang, D.W.; Sherman, B.T.; Lempicki, R.A. Bioinformatics Enrichment Tools: Paths toward the Comprehensive Functional Analysis of Large Gene Lists. Nucleic Acids Res. 2009, 37, 1–13. [Google Scholar] [CrossRef]
- Huang, D.W.; Sherman, B.T.; Lempicki, R.A. Systematic and Integrative Analysis of Large Gene Lists Using DAVID Bioinformatics Resources. Nat. Protoc. 2009, 4, 44–57. [Google Scholar] [CrossRef]
- Xiong, F.; Liu, J.; Xu, K.; Huang, J.; Wang, D.; Li, F.; Wang, S.; Zhang, J.; Pu, Y.; Sun, R. Microplastics Induce Neurotoxicity in Aquatic Animals at Environmentally Realistic Concentrations: A Meta-Analysis. Environ. Pollut. 2023, 318, 120939. [Google Scholar] [CrossRef]
- Barboza, L.G.A.; Vieira, L.R.; Branco, V.; Figueiredo, N.; Carvalho, F.; Carvalho, C.; Guilhermino, L. Microplastics Cause Neurotoxicity, Oxidative Damage and Energy-Related Changes and Interact with the Bioaccumulation of Mercury in the European Seabass, Dicentrarchus labrax (Linnaeus, 1758). Aquat. Toxicol. 2018, 195, 49–57. [Google Scholar] [CrossRef] [PubMed]
- Anguissola, S.; Garry, D.; Salvati, A.; O’Brien, P.J.; Dawson, K.A. High Content Analysis Provides Mechanistic Insights on the Pathways of Toxicity Induced by Amine-Modified Polystyrene Nanoparticles. PLoS ONE 2014, 9, e108025. [Google Scholar] [CrossRef] [PubMed]
- Bexiga, M.G.; Varela, J.A.; Wang, F.; Fenaroli, F.; Salvati, A.; Lynch, I.; Simpson, J.C.; Dawson, K.A. Cationic Nanoparticles Induce Caspase 3-, 7- and 9-Mediated Cytotoxicity in a Human Astrocytoma Cell Line. Nanotoxicology 2011, 5, 557–567. [Google Scholar] [CrossRef] [PubMed]
- Wang, F.; Bexiga, M.G.; Anguissola, S.; Boya, P.; Simpson, J.C.; Salvati, A.; Dawson, K.A. Time Resolved Study of Cell Death Mechanisms Induced by Amine-Modified Polystyrene Nanoparticles. Nanoscale 2013, 5, 10868. [Google Scholar] [CrossRef] [PubMed]
- Schirinzi, G.F.; Pérez-Pomeda, I.; Sanchís, J.; Rossini, C.; Farré, M.; Barceló, D. Cytotoxic Effects of Commonly Used Nanomaterials and Microplastics on Cerebral and Epithelial Human Cells. Environ. Res. 2017, 159, 579–587. [Google Scholar] [CrossRef] [PubMed]
- Domenech, J.; De Britto, M.; Velázquez, A.; Pastor, S.; Hernández, A.; Marcos, R.; Cortés, C. Long-Term Effects of Polystyrene Nanoplastics in Human Intestinal Caco-2 Cells. Biomolecules 2021, 11, 1442. [Google Scholar] [CrossRef] [PubMed]
- Dos Santos, T.; Varela, J.; Lynch, I.; Salvati, A.; Dawson, K.A. Effects of Transport Inhibitors on the Cellular Uptake of Carboxylated Polystyrene Nanoparticles in Different Cell Lines. PLoS ONE 2011, 6, e24438. [Google Scholar] [CrossRef] [PubMed]
- Varela, J.A.; Bexiga, M.G.; Åberg, C.; Simpson, J.C.; Dawson, K.A. Quantifying Size-Dependent Interactions between Fluorescently Labeled Polystyrene Nanoparticles and Mammalian Cells. J. Nanobiotechnol. 2012, 10, 39. [Google Scholar] [CrossRef] [PubMed]
- Banerjee, A.; Shelver, W.L. Micro- and Nanoplastic Induced Cellular Toxicity in Mammals: A Review. Sci. Total Environ. 2021, 755, 142518. [Google Scholar] [CrossRef]
- Sofroniew, M.V. Astrogliosis. Cold Spring Harb. Perspect. Biol. 2015, 7, a020420. [Google Scholar] [CrossRef] [PubMed]
- Escartin, C.; Galea, E.; Lakatos, A.; O’Callaghan, J.P.; Petzold, G.C.; Serrano-Pozo, A.; Steinhäuser, C.; Volterra, A.; Carmignoto, G.; Agarwal, A.; et al. Reactive Astrocyte Nomenclature, Definitions, and Future Directions. Nat. Neurosci. 2021, 24, 312–325. [Google Scholar] [CrossRef] [PubMed]
- Cragnolini, A.B.; Montenegro, G.; Friedman, W.J.; Mascó, D.H. Brain-Region Specific Responses of Astrocytes to an in Vitro Injury and Neurotrophins. Mol. Cell. Neurosci. 2018, 88, 240–248. [Google Scholar] [CrossRef]
- Linnerbauer, M.; Rothhammer, V. Protective Functions of Reactive Astrocytes Following Central Nervous System Insult. Front. Immunol. 2020, 11, 573256. [Google Scholar] [CrossRef]
- Lazic, A.; Balint, V.; Stanisavljevic Ninkovic, D.; Peric, M.; Stevanovic, M. Reactive and Senescent Astroglial Phenotypes as Hallmarks of Brain Pathologies. Int. J. Mol. Sci. 2022, 23, 4995. [Google Scholar] [CrossRef]
- Hamby, M.E.; Coppola, G.; Ao, Y.; Geschwind, D.H.; Khakh, B.S.; Sofroniew, M.V. Inflammatory Mediators Alter the Astrocyte Transcriptome and Calcium Signaling Elicited by Multiple G-Protein-Coupled Receptors. J. Neurosci. 2012, 32, 14489–14510. [Google Scholar] [CrossRef]
- Giovannoni, F.; Quintana, F.J. The Role of Astrocytes in CNS Inflammation. Trends Immunol. 2020, 41, 805–819. [Google Scholar] [CrossRef]
- Roh, J.S.; Sohn, D.H. Damage-Associated Molecular Patterns in Inflammatory Diseases. Immune Netw. 2018, 18, e27. [Google Scholar] [CrossRef]
- Lattke, M.; Reichel, S.; Baumann, B. NF-κB-Mediated Astrocyte Dysfunction Initiates Neurodegeneration. Oncotarget 2017, 8, 50329–50330. [Google Scholar] [CrossRef]
- Gorji, A. Neuroinflammation: The Pathogenic Mechanism of Neurological Disorders. Int. J. Mol. Sci. 2022, 23, 5744. [Google Scholar] [CrossRef]
- DiSabato, D.J.; Quan, N.; Godbout, J.P. Neuroinflammation: The Devil Is in the Details. J. Neurochem. 2016, 139, 136–153. [Google Scholar] [CrossRef] [PubMed]
- Hata, K.; Andoh, A.; Shimada, M.; Fujino, S.; Bamba, S.; Araki, Y.; Okuno, T.; Fujiyama, Y.; Bamba, T. IL-17 Stimulates Inflammatory Responses via NF-κB and MAP Kinase Pathways in Human Colonic Myofibroblasts. Am. J. Physiol. Gastrointest. Liver Physiol. 2002, 282, G1035–G1044. [Google Scholar] [CrossRef] [PubMed]
- Shih, R.-H.; Wang, C.-Y.; Yang, C.-M. NF-kappaB Signaling Pathways in Neurological Inflammation: A Mini Review. Front. Mol. Neurosci. 2015, 8, 77. [Google Scholar] [CrossRef] [PubMed]
- Chen, R.; Xue, G.; Holscher, C. The Role of the TNFα-Mediated Astrocyte Signaling Pathway in Epilepsy. Acta Epileptol. 2021, 3, 24. [Google Scholar] [CrossRef]
- Martorana, F.; Foti, M.; Virtuoso, A.; Gaglio, D.; Aprea, F.; Latronico, T.; Rossano, R.; Riccio, P.; Papa, M.; Alberghina, L.; et al. Differential Modulation of NF-κB in Neurons and Astrocytes Underlies Neuroprotection and Antigliosis Activity of Natural Antioxidant Molecules. Oxidative Med. Cell. Longev. 2019, 2019, 8056904. [Google Scholar] [CrossRef] [PubMed]
- Murao, A.; Aziz, M.; Wang, H.; Brenner, M.; Wang, P. Release Mechanisms of Major DAMPs. Apoptosis 2021, 26, 152–162. [Google Scholar] [CrossRef]
- Wang, M.; Gauthier, A.; Daley, L.; Dial, K.; Wu, J.; Woo, J.; Lin, M.; Ashby, C.; Mantell, L.L. The Role of HMGB1, a Nuclear Damage-Associated Molecular Pattern Molecule, in the Pathogenesis of Lung Diseases. Antioxid. Redox Signal. 2019, 31, 954–993. [Google Scholar] [CrossRef] [PubMed]
- Ge, Y.; Huang, M.; Yao, Y. The Effect and Regulatory Mechanism of High Mobility Group Box-1 Protein on Immune Cells in Inflammatory Diseases. Cells 2021, 10, 1044. [Google Scholar] [CrossRef]
- Chen, R.; Kang, R.; Tang, D. The Mechanism of HMGB1 Secretion and Release. Exp. Mol. Med. 2022, 54, 91–102. [Google Scholar] [CrossRef] [PubMed]
- Linnerbauer, M.; Wheeler, M.A.; Quintana, F.J. Astrocyte Crosstalk in CNS Inflammation. Neuron 2020, 108, 608–622. [Google Scholar] [CrossRef] [PubMed]
- Soung, A.; Klein, R.S. Astrocytes: Initiators of and Responders to Inflammation. In Glia in Health and Disease; Spohr, T., Ed.; IntechOpen: Rijeka, Croatia, 2020. [Google Scholar] [CrossRef]
- Borena, B.M.; Martens, A.; Broeckx, S.Y.; Meyer, E.; Chiers, K.; Duchateau, L.; Spaas, J.H. Regenerative Skin Wound Healing in Mammals: State-of-the-Art on Growth Factor and Stem Cell Based Treatments. Cell. Physiol. Biochem. 2015, 36, 1–23. [Google Scholar] [CrossRef]
- Zhan, J.S.; Gao, K.; Chai, R.C.; Jia, X.H.; Luo, D.P.; Ge, G.; Jiang, Y.W.; Fung, Y.W.; Li, L.; Yu, A.C.H. Astrocytes in Migration. Neurochem. Res. 2017, 42, 272–282. [Google Scholar] [CrossRef]
- Wilkinson, H.N.; Hardman, M.J. Wound Healing: Cellular Mechanisms and Pathological Outcomes. Open Biol. 2020, 10, 200223. [Google Scholar] [CrossRef]
- Elad, N.; Volberg, T.; Patla, I.; Hirschfeld-Warneken, V.; Grashoff, C.; Spatz, J.P.; Fässler, R.; Geiger, B.; Medalia, O. The Role of Integrin-Linked Kinase in the Molecular Architecture of Focal Adhesions. J. Cell Sci. 2013, 126, 4099–4107. [Google Scholar] [CrossRef]
- Cho, S.; Muthukumar, A.K.; Stork, T.; Coutinho-Budd, J.C.; Freeman, M.R. Focal Adhesion Molecules Regulate Astrocyte Morphology and Glutamate Transporters to Suppress Seizure-like Behavior. Proc. Natl. Acad. Sci. USA 2018, 115, 11316–11321. [Google Scholar] [CrossRef] [PubMed]
- Chen, S.; He, T.; Zhong, Y.; Chen, M.; Yao, Q.; Chen, D.; Shao, Z.; Xiao, G. Roles of Focal Adhesion Proteins in Skeleton and Diseases. Acta Pharm. Sin. B 2023, 13, 998–1013. [Google Scholar] [CrossRef]
- Seetharaman, S.; Etienne-Manneville, S. Cytoskeletal Crosstalk in Cell Migration. Trends Cell Biol. 2020, 30, 720–735. [Google Scholar] [CrossRef]
- McCaffrey, L.M.; Macara, I.G. Signaling Pathways in Cell Polarity. Cold Spring Harb. Perspect. Biol. 2012, 4, a009654. [Google Scholar] [CrossRef]
- Schaks, M.; Giannone, G.; Rottner, K. Actin Dynamics in Cell Migration. Essays Biochem. 2019, 63, 483–495. [Google Scholar] [CrossRef] [PubMed]
- Iglesias, J.; Morales, L.; Barreto, G.E. Metabolic and Inflammatory Adaptation of Reactive Astrocytes: Role of PPARs. Mol. Neurobiol. 2017, 54, 2518–2538. [Google Scholar] [CrossRef] [PubMed]
- Xiong, X.-Y.; Tang, Y.; Yang, Q.-W. Metabolic Changes Favor the Activity and Heterogeneity of Reactive Astrocytes. Trends Endocrinol. Metab. 2022, 33, 390–400. [Google Scholar] [CrossRef] [PubMed]
- Cárdenas, A.; Kong, M.; Alvarez, A.; Maldonado, H.; Leyton, L. Signaling Pathways Involved in Neuron-Astrocyte Adhesion and Migration. Curr. Mol. Med. 2014, 14, 275–290. [Google Scholar] [CrossRef]
- Jansen, A.H.P.; Reits, E.A.J.; Hol, E.M. The Ubiquitin Proteasome System in Glia and Its Role in Neurodegenerative Diseases. Front. Mol. Neurosci. 2014, 7, 73. [Google Scholar] [CrossRef] [PubMed]
- Schmidt, M.F.; Gan, Z.Y.; Komander, D.; Dewson, G. Ubiquitin Signalling in Neurodegeneration: Mechanisms and Therapeutic Opportunities. Cell Death Differ. 2021, 28, 570–590. [Google Scholar] [CrossRef]
- Su, H.; Qin, M.; Liu, Q.; Jin, B.; Shi, X.; Xiang, Z. Ubiquitin-Like Protein UBD Promotes Cell Proliferation in Colorectal Cancer by Facilitating P53 Degradation. Front. Oncol. 2021, 11, 691347. [Google Scholar] [CrossRef]
- Bellaye, P.-S.; Burgy, O.; Causse, S.; Garrido, C.; Bonniaud, P. Heat Shock Proteins in Fibrosis and Wound Healing: Good or Evil? Pharmacol. Ther. 2014, 143, 119–132. [Google Scholar] [CrossRef]
- Dukay, B.; Walter, F.R.; Vigh, J.P.; Barabási, B.; Hajdu, P.; Balassa, T.; Migh, E.; Kincses, A.; Hoyk, Z.; Szögi, T.; et al. Neuroinflammatory Processes Are Augmented in Mice Overexpressing Human Heat-Shock Protein B1 Following Ethanol-Induced Brain Injury. J. Neuroinflamm. 2021, 18, 22. [Google Scholar] [CrossRef]
- Baonza, A.; Tur-Gracia, S.; Pérez-Aguilera, M.; Estella, C. Regulation and Coordination of the Different DNA Damage Responses in Drosophila. Front. Cell Dev. Biol. 2022, 10, 993257. [Google Scholar] [CrossRef]
- Ruiz-Losada, M.; González, R.; Peropadre, A.; Gil-Gálvez, A.; Tena, J.J.; Baonza, A.; Estella, C. Coordination between Cell Proliferation and Apoptosis after DNA Damage in Drosophila. Cell Death Differ. 2022, 29, 832–845. [Google Scholar] [CrossRef]
- Zaidi, M.R.; Liebermann, D.A. (Eds.) Gadd45 Stress Sensor Genes; Advances in Experimental Medicine and Biology; Springer International Publishing: Cham, Switzerland, 2022; Volume 1360. [Google Scholar] [CrossRef]
- Bertheloot, D.; Latz, E.; Franklin, B.S. Necroptosis, Pyroptosis and Apoptosis: An Intricate Game of Cell Death. Cell Mol. Immunol. 2021, 18, 1106–1121. [Google Scholar] [CrossRef]
- Umamaheswari, S.; Priyadarshinee, S.; Kadirvelu, K.; Ramesh, M. Polystyrene Microplastics Induce Apoptosis via ROS-Mediated P53 Signaling Pathway in Zebrafish. Chem. Biol. Interact. 2021, 345, 109550. [Google Scholar] [CrossRef]
- Ko, S.; Kim, J.Y.; Jeong, J.; Lee, J.E.; Yang, W.I.; Jung, W.H. The Role and Regulatory Mechanism of 14-3-3 Sigma in Human Breast Cancer. J. Breast Cancer 2014, 17, 207. [Google Scholar] [CrossRef]
- Wang, L.; Lankhorst, L.; Bernards, R. Exploiting Senescence for the Treatment of Cancer. Nat. Rev. Cancer 2022, 22, 340–355. [Google Scholar] [CrossRef]
- Vetuschi, A.; Cappariello, A.; Onori, P.; Gaudio, E.; Latella, G.; Pompili, S.; Sferra, R. Ferroptosis Resistance Cooperates with Cellular Senescence in the Overt Stage of Nonalcoholic Fatty Liver Disease/Nonalcoholic Steatohepatitis. Eur. J. Histochem. 2022, 66, 3391. [Google Scholar] [CrossRef]
- Birch, J.; Gil, J. Senescence and the SASP: Many Therapeutic Avenues. Genes Dev. 2020, 34, 1565–1576. [Google Scholar] [CrossRef]
- Chambers, C.R.; Ritchie, S.; Pereira, B.A.; Timpson, P. Overcoming the Senescence-associated Secretory Phenotype (SASP): A Complex Mechanism of Resistance in the Treatment of Cancer. Mol. Oncol. 2021, 15, 3242–3255. [Google Scholar] [CrossRef]
- Xue, Y.-H.; Jia, T.; Yang, N.; Sun, Z.-X.; Xu, Z.-Y.; Wen, X.-L.; Feng, L.-S. Transcriptome Alterations in Zebrafish Gill after Exposure to Different Sizes of Microplastics. J. Environ. Sci. Health Part A 2022, 57, 347–356. [Google Scholar] [CrossRef]
- Luo, H.; Xiao, T.; Sun, X.; Song, Y.; Shi, W.; Lu, K.; Chen, D.; Sun, C.; Bian, Q. The Regulation of circRNA_kif26b on Alveolar Epithelial Cell Senescence via miR-346-3p Is Involved in Microplastics-Induced Lung Injuries. Sci. Total Environ. 2023, 882, 163512. [Google Scholar] [CrossRef]
- Shiwakoti, S.; Ko, J.-Y.; Gong, D.; Dhakal, B.; Lee, J.-H.; Adhikari, R.; Gwak, Y.; Park, S.-H.; Jun Choi, I.; Schini-Kerth, V.B.; et al. Effects of Polystyrene Nanoplastics on Endothelium Senescence and Its Underlying Mechanism. Environ. Int. 2022, 164, 107248. [Google Scholar] [CrossRef]
- Dixon, E.D.; Nardo, A.D.; Claudel, T.; Trauner, M. The Role of Lipid Sensing Nuclear Receptors (PPARs and LXR) and Metabolic Lipases in Obesity, Diabetes and NAFLD. Genes 2021, 12, 645. [Google Scholar] [CrossRef]
- Chinetti, G.; Fruchart, J.-C.; Staels, B. Peroxisome Proliferator-Activated Receptors (PPARs): Nuclear Receptors at the Crossroads between Lipid Metabolism and Inflammation. Inflamm. Res. 2000, 49, 497–505. [Google Scholar] [CrossRef]
- Chistyakov, D.; Aleshin, S.; Astakhova, A.; Sergeeva, M.; Reiser, G. Regulation of Peroxisome Proliferator-Activated Receptors (PPAR) α and -γ of Rat Brain Astrocytes in the Course of Activation by Toll-like Receptor Agonists. J. Neurochem. 2015, 134, 113–124. [Google Scholar] [CrossRef]
- Kidani, Y.; Bensinger, S.J. Liver X Receptor and Peroxisome Proliferator-Activated Receptor as Integrators of Lipid Homeostasis and Immunity. Immunol. Rev. 2012, 249, 72–83. [Google Scholar] [CrossRef]
- Qian, L.; Chai, A.B.; Gelissen, I.C.; Brown, A.J. Balancing Cholesterol in the Brain: From Synthesis to Disposal. Explor. Neuroprotective Ther. 2022, 2, 1–27. [Google Scholar] [CrossRef]
- Ferris, H.A.; Perry, R.J.; Moreira, G.V.; Shulman, G.I.; Horton, J.D.; Kahn, C.R. Loss of Astrocyte Cholesterol Synthesis Disrupts Neuronal Function and Alters Whole-Body Metabolism. Proc. Natl. Acad. Sci. USA 2017, 114, 1189–1194. [Google Scholar] [CrossRef]
- Gamba, P.; Staurenghi, E.; Testa, G.; Giannelli, S.; Sottero, B.; Leonarduzzi, G. A Crosstalk Between Brain Cholesterol Oxidation and Glucose Metabolism in Alzheimer’s Disease. Front. Neurosci. 2019, 13, 556. [Google Scholar] [CrossRef]
- Mutemberezi, V.; Buisseret, B.; Masquelier, J.; Guillemot-Legris, O.; Alhouayek, M.; Muccioli, G.G. Oxysterol Levels and Metabolism in the Course of Neuroinflammation: Insights from in Vitro and in Vivo Models. J. Neuroinflamm. 2018, 15, 74. [Google Scholar] [CrossRef]


| Gene Symbol | Gene Annotation | Fold Change | Adjusted p-Value |
|---|---|---|---|
| Ubd | Ubiquitin D | 597.1 | 8.90 × 10⁻⁴ |
| Mir675 | Micro RNA 675 | 171.8 | 2.74 × 10⁻⁷ |
| Ccl7 | C-C Motif Chemokine Ligand 7 | 70.8 | 2.53 × 10⁻⁷ |
| Ccl2 | C-C Motif Chemokine Ligand 2 | 69.4 | 1.44 × 10⁻¹³ |
| Ifit3 | Interferon Induced Protein with Tetratricopeptide Repeats 3 | 53 | 1.97 × 10⁻⁴ |
| Aldh1a3 | Aldehyde Dehydrogenase 1 Family Member A3 | 39.6 | 3.61 × 10⁻⁵ |
| Fgf10 | Fibroblast Growth Factor 10 | 37.5 | 1.34 × 10⁻⁴ |
| Slfn2 | Schlafen Family Member 12 Like | 35.7 | 9.08 × 10⁻⁵ |
| Cxcl10 | C-X-C Motif Chemokine Ligand 10 | 35.1 | 4.15 × 10⁻⁶ |
| Cxcl11 | C-X-C Motif Chemokine Ligand 11 | 26.5 | 1.90 × 10⁻³ |
| Scube2 | Signal Peptide, CUB Domain And EGF Like Domain Containing 2 | −2.7 | 6.80 × 10⁻⁵ |
| Veph1 | Ventricular Zone Expressed PH Domain Containing 1 | −2.8 | 1.94 × 10⁻⁴ |
| Cfap100 | Cilia And Flagella Associated Protein 100 | −3 | 3.07 × 10⁻³ |
| Psd4 | Pleckstrin And Sec7 Domain Containing 4 | −3 | 1.21 × 10⁻⁴ |
| Slc27a5 | Solute Carrier Family 27 Member 5 | −3.1 | 3.33 × 10⁻⁴ |
| Mroh7 | Maestro Heat Like Repeat Family Member 7 | −3.3 | 6.27 × 10⁻³ |
| Fgfr4 | Fibroblast Growth Factor Receptor 4 | −3.3 | 2.29 × 10⁻³ |
| Kcng1 | Potassium Voltage-Gated Channel Modifier Subfamily G Member1 | −3.7 | 9.19 × 10⁻⁴ |
| Nmb | Neuromedin B | −4.1 | 6.34 × 10⁻³ |
| Fmo1 | Flavin Containing Dimethylaniline Monooxygenase 1 | −4.3 | 2.45 × 10⁻⁸ |
| Gene Symbol | Gene Annotation | Fold Change | Adjusted p-Value |
|---|---|---|---|
| Ubd | Ubiquitin D | 3909.9 | 1.15 × 10⁻⁸ |
| Cxcl3 | C-X-C Motif Chemokine Ligand 3 | 1036.1 | 6.82 × 10⁻⁵ |
| Ccl5 | C-C Motif Chemokine Ligand 5 | 403.2 | 7.09 × 10⁻⁹ |
| Ccl2 | C-C Motif Chemokine Ligand 2 | 242.1 | 3.39 × 10⁻⁹ |
| Ccl7 | C-C Motif Chemokine Ligand 7 | 152.9 | 1.94 × 10⁻⁹ |
| Tfpi2 | Tissue Factor Pathway Inhibitor 2 | 127.6 | 2.86 × 10⁻³ |
| Trabd2b | TraB Domain Containing 2B | 109.8 | 5.87 × 10⁻⁶ |
| Atp6v0d2 | ATPase H+ Transporting V0 Subunit D2 | 93.7 | 1.76 × 10⁻³ |
| Slfn2 | Schlafen Family Member 12 Like | 93.3 | 1.05 × 10⁻⁷ |
| Cxcl1 | C-X-C Motif Chemokine Ligand 1 | 88 | 5.98 × 10⁻⁸ |
| Dcdc2 | Doublecortin Domain Containing 2 | −7.8 | 1.50 × 10⁻⁵ |
| P2rx6 | Purinergic Receptor P2X 6 | −8.6 | 1.05 × 10⁻¹⁸ |
| Gm45623 | Small Integral Membrane Protein 32 (Smim32) | −9.2 | 7.02 × 10⁻⁵ |
| Trpm5 | Transient Receptor Potential Cation Channel Subfamily M Member 5 | −9.6 | 6.22 × 10⁻⁴ |
| Slc27a5 | Solute Carrier Family 27 Member 5 | −11.3 | 4.56 × 10⁻⁹ |
| Fmo1 | Flavin Containing Dimethylaniline Monooxygenase 1 | −12 | 4.60 × 10⁻¹³ |
| LOC689725 | Open Reading Frame (ORF) | −14.1 | 9.19 × 10⁻⁴ |
| Ankfn1 | Ankyrin Repeat and Fibronectin Type III Domain Containing 1 | −14.5 | 1.72 × 10⁻⁸ |
| Mroh7 | Maestro Heat Like Repeat Family Member 7 | −15.6 | 2.64 × 10⁻⁵ |
| Fmo2 | Flavin Containing Dimethylaniline Monooxygenase 2 | −24.5 | 1.96 × 10⁻³ |
| Activated Canonical Pathway | Z-Score | −log p-Value |
| Cardiac Hypertrophy Signaling (Enhanced) | 3.8 | 4.65 |
| Signaling by Rho Family GTPases | 3.77 | 5.53 |
| Hepatic Fibrosis Signaling Pathway | 3.67 | 6.16 |
| Neuroinflammation Signaling Pathway | 3.55 | 7.36 |
| PI3K Signaling in B Lymphocytes | 3.46 | 4.41 |
| Cardiac Hypertrophy Signaling | 3.16 | 1.72 |
| Acute Phase Response Signaling | 3.15 | 7.29 |
| Wound Healing Signaling Pathway | 3.13 | 6.56 |
| RHOA Signaling | 3 | 3.63 |
| Role of NFAT in Cardiac Hypertrophy | 3 | 2.21 |
| Inhibited Canonical Pathway | Z-Score | −log p-Value |
| PPAR Signaling | −2.33 | 3.46 |
| RHOGDI Signaling | −2.11 | 3.30 |
| Activated Canonical Pathway | Z-Score | −log p-Value |
| Neuroinflammation Signaling Pathway | 4.16 | 7.06 |
| Signaling by Rho Family GTPases | 3.92 | 7.04 |
| Wound Healing Signaling Pathway | 3.78 | 4.43 |
| HMGB1 Signaling | 3.64 | 4.73 |
| HER-2 Signaling in Breast Cancer | 3.58 | 2.14 |
| Hepatic Fibrosis Signaling Pathway | 3.57 | 7.03 |
| IL-13 Signaling Pathway | 3.5 | 3.84 |
| IL-6 Signaling | 3.5 | 4.36 |
| Role of Hypercytokinemia/Hyperchemokinemia in the Pathogenesis of Influenza | 3.46 | 3.07 |
| RAC Signaling | 3.46 | 3.92 |
| Inhibited Canonical Pathway | Z-Score | −log p-Value |
| LXR/RXR Activation | −2.71 | 2.61 |
| PPARα/RXRα Activation | −2.67 | 2.53 |
| PPAR Signaling | −2.50 | 3.72 |
| RHOGDI Signaling | −2.14 | 3.12 |
| Apelin Cardiac Fibroblast Signaling Pathway | −2 | 1.64 |
| 50 nm | Z-Score | −log p-Value | 500 nm | Z-Score | −log p-Value |
|---|---|---|---|---|---|
| Lipopolysaccharide | 9.33 | 32.48 | Lipopolysaccharide | 9.94 | 33.17 |
| TNF | 7.68 | 43.67 | TNF | 8.58 | 44.88 |
| IL1B | 7.46 | 38.28 | poly rI:rC-RNA | 7.70 | 11.98 |
| IFNG | 7 | 41.36 | IL1B | 7.67 | 32.25 |
| poly rI:rC-RNA | 6.90 | 23.02 | tetradecanoylphorbol acetate | 7.67 | 23.94 |
| NFkB (complex) | 6.78 | 31.96 | NFkB (complex) | 7.46 | 25.81 |
| tetradecanoylphorbol acetate | 6.74 | 22.83 | IFNG | 6.78 | 31.81 |
| IL6 | 6.26 | 23.43 | F2 | 6.55 | 21.78 |
| Cisplatin | 5.76 | 17.26 | KLF6 | 6.37 | 21.29 |
| E. coli B5 lipopolysaccharide | 5.75 | 20.55 | MYD88 | 6.27 | 12.40 |
| 50 nm | Z-Score | −log p-Value | 500 nm | Z-Score | −log p-Value |
|---|---|---|---|---|---|
| U0126 | −5.59 | 20.67 | U0126 | −6.40 | 21.40 |
| SB203580 | −5.53 | 18.75 | PD98059 | −5.94 | 21.83 |
| LY294002 | −5.35 | 19.12 | SB203580 | −5.60 | 18.21 |
| PD98059 | −5.25 | 24.29 | CITED2 | −5.56 | 7.28 |
| CITED2 | −5.01 | 12.10 | SP600125 | −5.54 | 17.59 |
| TSC2 | −4.78 | 12.71 | LY294002 | −5.25 | 18.41 |
| Alpha catenin | −4.26 | 13.62 | Alpha catenin | −4.52 | 13.16 |
| TREX1 | −4.23 | 15.27 | Irgm1 | −4.40 | 7.07 |
| N-acetyl-l-cysteine | −4.10 | 8.77 | SIRT1 | −4.39 | 8.75 |
| SN-011 | −3.71 | 9.52 | SB-431542 | −4.32 | 8.25 |
| KEGG Pathways Associated with Upregulated Genes | Count | % | Adjusted p-Value |
|---|---|---|---|
| MAPK signaling pathway | 24 | 6 | 7.90 × 10⁻⁵ |
| Apoptosis | 16 | 4 | 7.90 × 10⁻⁵ |
| Cytokine-cytokine receptor interaction | 22 | 5.5 | 1.00 × 10⁻⁴ |
| NF-kappa B signaling pathway | 13 | 3.2 | 1.30 × 10⁻⁴ |
| NOD-like receptor signaling pathway | 17 | 4.2 | 1.50 × 10⁻⁴ |
| Cellular senescence | 16 | 4 | 8.00 × 10⁻⁴ |
| IL-17 signaling pathway | 11 | 2.7 | 1.20 × 10⁻³ |
| TNF signaling pathway | 11 | 2.7 | 4.70 × 10⁻³ |
| p53 signaling pathway | 9 | 2.2 | 4.70 × 10⁻³ |
| Lipid and atherosclerosis | 15 | 3.7 | 5.60 × 10⁻³ |
| KEGG Pathways Associated with Upregulated Genes | Count | % | Adjusted p-Value |
| TNF signaling pathway | 23 | 3.1 | 9.20 × 10⁻⁸ |
| IL-17 signaling pathway | 19 | 2.6 | 2.40 × 10⁻⁶ |
| Focal adhesion | 27 | 3.7 | 5.20 × 10⁻⁶ |
| MAPK signaling pathway | 33 | 4.5 | 8.90 × 10⁻⁶ |
| NOD-like receptor signaling pathway | 24 | 3.3 | 2.30 × 10⁻⁵ |
| p53 signaling pathway | 15 | 2 | 3.00 × 10⁻⁵ |
| Cytokine-cytokine receptor interaction | 30 | 4.1 | 3.00 × 10⁻⁵ |
| Apoptosis | 20 | 2.7 | 4.90 × 10⁻⁵ |
| NF-kappa B signaling pathway | 16 | 2.2 | 1.50 × 10⁻⁴ |
| Chemokine signaling pathway | 22 | 3 | 2.10 × 10⁻⁴ |
| KEGG Pathways Associated with Downregulated Genes | Count | % | Adjusted p-Value |
| Metabolic pathways | 68 | 14.5 | 1.00 × 10⁻⁵ |
| Valine, leucine and isoleucine degradation | 9 | 1.9 | 2.50 × 10⁻³ |
| GABAergic synapse | 11 | 2.4 | 2.50 × 10⁻³ |
| Calcium signaling pathway | 16 | 3.4 | 1.50 × 10⁻² |
Disclaimer/Publisher’s Note: The statements, opinions and data contained in all publications are solely those of the individual author(s) and contributor(s) and not of MDPI and/or the editor(s). MDPI and/or the editor(s) disclaim responsibility for any injury to people or property resulting from any ideas, methods, instructions or products referred to in the content. |
© 2024 by the authors. Licensee MDPI, Basel, Switzerland. This article is an open access article distributed under the terms and conditions of the Creative Commons Attribution (CC BY) license (https://creativecommons.org/licenses/by/4.0/).
Share and Cite
Marcellus, K.A.; Bugiel, S.; Nunnikhoven, A.; Curran, I.; Gill, S.S. Polystyrene Nano- and Microplastic Particles Induce an Inflammatory Gene Expression Profile in Rat Neural Stem Cell-Derived Astrocytes In Vitro. Nanomaterials 2024, 14, 429. https://doi.org/10.3390/nano14050429
Marcellus KA, Bugiel S, Nunnikhoven A, Curran I, Gill SS. Polystyrene Nano- and Microplastic Particles Induce an Inflammatory Gene Expression Profile in Rat Neural Stem Cell-Derived Astrocytes In Vitro. Nanomaterials. 2024; 14(5):429. https://doi.org/10.3390/nano14050429
Chicago/Turabian StyleMarcellus, Kristen A., Steven Bugiel, Andrée Nunnikhoven, Ivan Curran, and Santokh S. Gill. 2024. "Polystyrene Nano- and Microplastic Particles Induce an Inflammatory Gene Expression Profile in Rat Neural Stem Cell-Derived Astrocytes In Vitro" Nanomaterials 14, no. 5: 429. https://doi.org/10.3390/nano14050429
APA StyleMarcellus, K. A., Bugiel, S., Nunnikhoven, A., Curran, I., & Gill, S. S. (2024). Polystyrene Nano- and Microplastic Particles Induce an Inflammatory Gene Expression Profile in Rat Neural Stem Cell-Derived Astrocytes In Vitro. Nanomaterials, 14(5), 429. https://doi.org/10.3390/nano14050429