Abstract
Detailed analysis covered the optical and structural properties of Eu3+-doped NaY9Si6O26 oxyapatite phosphors, which were obtained via hydrothermal synthesis. X-ray diffraction patterns of NaY9Si6O26:xEu3+ (x = 0, 1, 5, 7, 10 mol% Eu3+) samples proved a single-phase hexagonal structure (P63/m (176) space group). Differential thermal analysis showed an exothermic peak at 995 °C attributed to the amorphous to crystalline transformation of NaY9Si6O26. Electron microscopy showed agglomerates composed of round-shaped nanoparticles ~53 nm in size. Room temperature photoluminescent emission spectra consisted of emission bands in the visible spectral region corresponding to 5D0 → 7FJ (J = 0, 1, 2, 3, 4) f-f transitions of Eu3+. Lifetime measurements showed that the Eu3+ concentration had no substantial effect on the rather long 5D0-level lifetime. The Eu3+ energy levels in the structure were determined using room-temperature excitation/emission spectra. Using the 7F1 manifold, the Nv-crystal field strength parameter was calculated to be 1442.65 cm−1. Structural, electronic, and optical properties were calculated to determine the band gap value, density of states, and index of refraction. The calculated direct band gap value was 4.665 eV (local density approximation) and 3.765 eV (general gradient approximation). Finally, the complete Judd–Ofelt analysis performed on all samples confirmed the experimental findings.
1. Introduction
Compounds with the general formula Me10(TO4)6O2 belong to apatite-type materials with a specific arrangement of metal cations, tetrahedral units, and oxygen atoms. In these materials, Me stands for metal cations, usually alkali and alkaline metals and/or rare earth elements; (TO4)6 refers to six tetrahedral units where T is a tetrahedral metal (like silicon or germanium) each surrounded by four oxygen atoms; and O2 represents two additional oxygen atoms that are not part of the tetrahedral units. Depending on the metal cations and the tetrahedral element T, this group of materials can find applications in: (i) materials science where such compounds might be of interest for their structural properties, which can be useful in high-temperature ceramics or advanced materials; (ii) catalysis where they may be used as catalysts or catalyst supports due to their stable and unique crystal structures; and/or (iii) phosphors for lighting in LEDs, OLEDs, and other display technologies if the material is luminescent. Their multiple combinations lead to the design of complex materials that are studied for important applications such as high oxide ion conductivity and photoluminescence, immobilizing radioactive waste, laser research, solid-state lighting, oxide fuel cell development, biomaterials, etc. [1,2,3,4,5,6].
Alkaline metal/rare earth orthosilicates are a family of apatite oxide materials called oxyapatites that have gained interest, especially for their luminescent properties. Among them, sodium yttrium orthosilicate is an oxyapatite of the NaY9Si6O26 general formula featuring a structure where yttrium is incorporated into the apatite-like framework, and sodium ions are included to balance the charge. The presence of trivalent yttrium ions in the structure makes this host suitable for activation with other rare earths and optically active luminescent materials design. Only a few studies have published the synthesis and characterization of NaY9Si6O26 doped with activating ions. Chuai et al. investigated the luminescence of Eu3+-, Tb3+-, Dy3+-, and Pb2+-doped NaY9Si6O26 obtained through the sol–gel technique [7]. The authors concluded that lanthanides occupy both sites in the oxyapatite structure and that white light emission of Dy3+-doped samples improve when combined with Pb2+ and Gd3+ co-dopants. Kang et al. reported the conventional solid-state synthesis of NaY9Si6O26 doped with Yb3+, an NIR-emitting material serving as a potential state of the art candidate for advanced anti-counterfeiting utilization [8]. Zheng et al. reported color-tunable emission of Eu3+-, Ce3+-, and Eu3+/Ce3+-doped NaY9Si6O26 obtained with a conventional solid-state reaction [9]. The authors reported emission in the blue wavelength range for the Ce3+-doped sample, and in the reddish-orange wavelength for the Eu3+-doped sample while the emission of the Eu3+/Ce3+ sample changed from blue to orange-reddish by changing the Eu3+ concentration. Zheng et al. also reported color tuning in Bi3+- and Eu3+-doped/co-doped NaY9Si6O26 obtained via a solid-state reaction as a solution to obtain phosphors with white light emission. The proper concentration and ratio of Bi3+/Eu3+ activating ions resulted in white light emission, while different concentrations of solely added Bi3+ and Eu3+ could alter the emission from blue to an orange-red color [10]. In addition, Brgoch et al. reported rapid microwave preparation of blue-emitting cerium-substituted NaY9Si6O26 using active carbon as a microwave susceptor [11].
The correlation between structure and optical properties is essential when defining the host material and related efficiency for phosphor applications. Therefore, this research aims to investigate and present detailed structural and optical properties of Eu3+-doped NaY9Si6O26 oxyapatite phosphor obtained by hydrothermal synthesis. The hydrothermal technique offers several advantages over other synthesis methods, such as: (1) a controlled environment—the high temperature and pressure in hydrothermal conditions allow for better control over the reaction environment, leading to more uniform products; (2) higher solubility—unlike the solid-state method that struggles with complex materials or a precipitation method limited to materials that can be precipitated from solution, materials that are difficult to dissolve at room temperature can be effectively synthesized in a hydrothermal setup, enabling the formation of complex compounds; (3) good crystallinity—due to slow growth rates hydrothermal synthesis often results in high crystallinity of the final product compared to room/mild temperature techniques like precipitation; (4) versatility—this method can be used to synthesize a wide range of complex materials, making it more versatile when compared to solid-state or precipitation; (5) eco-friendly—hydrothermal processes often use water as a solvent, reducing the need for harmful organic surfactants usually needed in precipitation; (6) scalability—unlike solid-state and precipitation methods where quality can vary significantly with the batch, hydrothermal synthesis can be scaled up easily for industrial applications, allowing for the production of larger quantities of good quality materials; and (7) low energy consumption—compared to other methods, especially solid-state reactions, hydrothermal synthesis is more energy-efficient.
Thermal analysis was performed to determine the proper calcination temperature for oxyapatite phase transformation. Structural and photoluminescent measurements were analyzed and correlated. Structural, electronic, and optical properties were calculated to determine band gap value, density of states, and index of refraction. Finally, Judd–Ofelt analysis calculated the intensity parameters for electric dipole transitions, allowing an estimate of their radiative properties. To the extent of our knowledge, there are no data on the temperature needed for the amorphous-to-crystalline transformation of the NaY9Si6O26 oxyapatite host nor an index of refraction values, both being very important for the potential application of alkaline metal/rare earth orthosilicates.
2. Materials and Methods
2.1. Hydrothermal Synthesis of Undoped and Eu3+-Doped Apatite Samples
A total of five samples of undoped and Eu3+-doped apatite—NaY9Si6O26:xEu3+ (x = 0, 1, 5, 7, 10 mol% Eu3+; molecular formula of each sample is given in Table 1) were synthesized via the hydrothermal method [12,13]. The proper amounts of Na2SiO3 × 9H2O (Sigma Aldrich, 98%, St. Louis, MO, USA), Y(NO3)3 × 6H2O (Sigma Aldrich, 99.8%), and Eu(NO3)3 × 6H2O (Alfa Aesar, 99.9%, Haverhill, MA, USA) were dissolved in deionized water leading to the formation of the aqueous precursor solutions. That way, concentrations of 0.299 mol/dm3 for the Y and Eu precursors and 0.225 mol/dm3 for the Si precursor solution were prepared. The Si solution was added in drops under intense magnetic stirring to the Y/Eu solution (molar ratio Eu/Y:Si = 1.33:1), and the pH of the precursor mixture was tuned to 13 by the dropwise addition of sodium hydroxide solution (6 mol/dm3). The final mixture solution was stirred for another 3 h and then transferred to the PTFE liner of the hydrothermal reactor using a filling ratio of 30%. The hydrothermal reaction was carried out in the hydrothermal autoclave reactor at 230 °C for 12 h; the precursor was then separated by centrifugation, washed with water five times, and dried at 80 °C for 2 h, resulting in an amorphous material. The crystalline samples were obtained by calcinating the amorphous materials for 12 h at 1100 °C.

Table 1.
Chemical formulas of the synthesized NaY9Si6O26:xEu3+ (x = 0, 1, 5, 7, 10 mol% Eu3+) samples.
2.2. Characterization of the Apatite Materials
Thermal stability was examined by non-isothermal thermo-gravimetric analysis (TG) and differential thermal analysis (DTA), simultaneously, using a SETARAM SETSYS Evolution 1750 instrument (heating rate −20 °C/min in a dynamic air atmosphere; flow rate −40 cm3/min; temperature range 30–1300 °C). The mass of the sample was about 5 mg. The crystal structures of the obtained phosphors were looked at carefully with an X-ray diffractometer (XRD) from Rigaku SmartLab (Cu-Kα1,2 radiation, λ = 0.1540 nm) at room temperature. The experimental conditions for measurements were as follows: 2θ range of 20°–80°, with a step size of 0.02°, and a counting time of 10°/min. Conclusions on the structural study (unit cell parameters, crystal coherence size, micro strain values, and data fit parameters) were attained using the built-in PDXL2 software (v2.1). The average particle size was calculated using ImageJ software (https://imagej.net). The morphology was examined by a TESCAN MIRA3 field emission scanning electron microscope (FE-SEM) (TESCAN, Brno, Czechia), with the samples coated using a thin layer of Au, and by transmission electron microscope (TEM) JEOL JEM1011 operated at an accelerating voltage of 100 kV (JEOL, Frenchs Forest, NSW, Australia). The sample’s UV–VIS diffuse reflection spectrum was recorded with a Shimadzu UV-3600 UV-VIS-NIR spectrophotometer with BaSO4 used as the reflectance standard (Shimadzu, Kyoto, Japan). Photoluminescence measurements were carried out using a Fluorolog-3 Model FL3-221 spectrofluorometer system (Horiba Jobin-Yvon, Longjumeau, France) equipped with an R928 PMT detector. Emission and excitation spectra were corrected for the lamp spectral intensity and detector sensitivity. Excited-state lifetime measurements were carried out using the Rohde&Schwarz RTC1002 two-channel oscilloscope paired with the Hamamatsu H10722-20 photomultiplier tube, and by exciting the samples with a square wave modulated Ocean Insight fiber-coupled LED (LSM-405A LED Light Source, Winter Park, FL, USA) controlled by an Ocean Insight LDC-1 Single Channel LED Controller.
3. Results and Discussion
3.1. Thermal Stability (TGA) and Differential Thermal Analysis (DTA)
The hydrothermal method used to obtain the desired materials resulted in amorphous apatite samples which, under appropriate sintering, transformed to crystalline NaY9Si6O26. The undoped amorphous precursor was investigated to establish the adequate calcination temperature needed for transformation to the apatite phase. DTA analysis showed an exothermic peak at 995 °C that could be attributed to the transformation of amorphous NaY9Si6O26 to the crystalline phase NaY9Si6O26. At the same time, the TG curve showed ~13% total mass loss that could be attributed to the vaporization of adsorbed water and residual molecules. At the same time, the initial TG curve showed a sharp mass loss that could be attributed to the fast vaporization of adsorbed water and residual molecules. The total mass loss was found to be ~13%. According to the TG/DTA analysis results, calcination at 1100 °C was chosen to complete the amorphous-to-crystalline transformation (Figure 1).
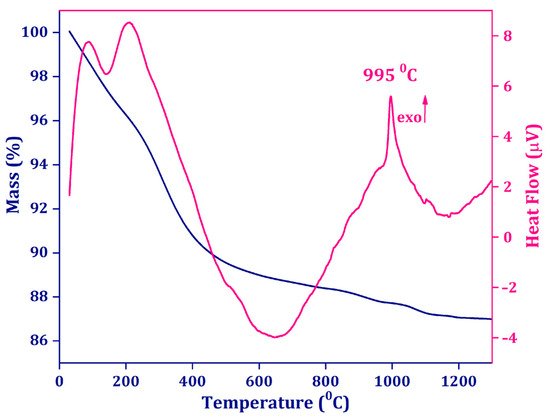
Figure 1.
Thermogravimetry (TG, blue) and differential thermal analysis (DTA, pink) curves for undoped NaY9Si6O26 precursor prepared via the hydrothermal method.
Table 2 presents a comparison of the obtained amorphous-to-crystalline transformation temperature with the values found in the literature for some rare earth silicates.
Table 2.
Comparison of the obtained amorphous-to-crystalline transformation temperature with the values found in the literature.
3.2. Structural Characterization
Figure 2a shows the X-ray diffraction pattern of NaY9Si6O26:xEu3+ (x = 0, 1, 5, 7, 10 mol% Eu3+) samples depicted with a corresponding ICDD Card No. 00-035-0404. X-ray diffraction analysis verified a single-phase hexagonal structure (space group: P63/m (176)) with no other phase peaks or traces of impurities signifying that dopant Eu3+ ions have been efficiently incorporated into the NaY9Si6O26 host lattice owing to similar sizes between Y3+ and Eu3+ ions [21]. PDXL2 software was used to calculate the average crystallite size and structural parameters presented in Table 3. The initial parameters for the evaluation were extracted from Reference [22]. The calculated mean crystallite size for all the samples was in the nanometer region (~14–25 nm).
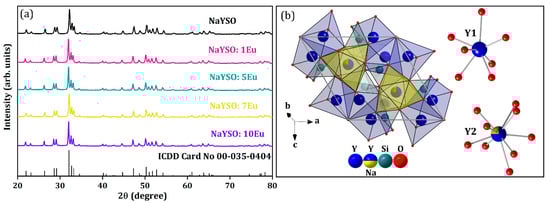
Figure 2.
(a) XRD patterns of NaY9−xEuxSi6O26 materials with standard ICDD Card No. 00-035-0404; (b) representation of NaY9Si6O26 crystal structure and coordination environment of Y1 and Y2 atoms in the NaY9Si6O26 crystal lattice designed with DIAMOND Release 4.6.8. Crystal Impact GbR software (version 4.0).
Table 3.
Selected structural parameters of the synthesized NaY9−xEuxSi6O26 samples. CS—Crystallite size; Rwp—the weighted profile factor; Rp—the profile factor; Re—the expected weighted profile factor; and GOF—the goodness of fit.
As seen from Table 3 the value of lattice constant c becomes larger with the increase of Eu3+ concentration. When Y3+ is replaced with Eu3+ within the crystal structure, the significant increase in the lattice parameter c rather than a = b can be explained by several factors such as: (a) ionic radius—Eu3+ has a larger ionic radius than Y3+ which can lead to an expansion of the unit cell in the vertical direction (along the c-axis); (b) crystal field effects—the different electronic configurations and interactions of Eu3+ compared to Y3+ can alter the crystal field, which affects the bond lengths and angles, particularly in the axial direction, which might preferentially expand the c-parameter; (c) phase stability—the introduction of Eu3+ may stabilize certain orientations within the crystal structure that are more favorable in the vertical direction, leading to an increase in c without a corresponding increase in a = b. So, the significant increase in the c lattice parameter upon replacing Y3+ with Eu3+ in a hexagonal crystal structure is primarily driven by the larger ionic radius of Eu3+, changes in crystal field interactions, and potentially different bonding characteristics that favor expansion along the c-axis.
There are two distinct crystallographic positions for the Y3+ in the NaY9Si6O26 crystal structure (Figure 2b): one is coordinated by seven oxygen atoms (Y1), and the other one by nine (Y2), while the silicon atom is positioned in a tetrahedral site. In the nine-coordinated site, one quarter of the Y3+ position is occupied by Na+ atoms, thus preserving the charge balance [23].
3.3. Microstructural Characterization by Electron Microscopy (SEM and TEM)
It is generally acknowledged that in nanoparticles with a large specific surface area, luminescence characteristics are affected by the particles’ size, which ultimately influences excitation efficiency and emission. The SEM images captured at low magnification illustrate that the representative NaYSO:1Eu powder sample tends to form agglomerates (Figure 3a). At higher magnification, the surface morphology shows that the particles can be classed as round-shaped nano-sized particles (Figure 3b). Figure 3c illustrates the microstructure at a local scale, examined through transmission electron microscopy, and shows the presence of sphere-like nanoparticles. The TEM images used for the average particle size analysis considered over 70 particles, using the largest axis of the grain. From the inset in Figure 3c, it can be concluded that the most frequent nanoparticle size is in the 45 to 60 nm range with an average particle size of ~53 nm in diameter. The upper inset in Figure 3c shows a ring electron diffraction pattern as evidence of the polycrystalline nature of the material. At the same time, the rings’ grainy form is linked to the finding that the constituent crystallites have a size of ~20 nm. The ring pattern is formed due to diffraction from polycrystalline material because diffracting planes are oriented randomly in all possible directions. This agrees with the crystallite size obtained from XRD measurements (~20 nm) and particle size obtained from TEM (45–60 nm range) showing that each particle is composed of approximately 2–3 crystallites.
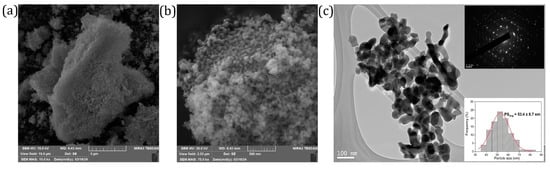
Figure 3.
SEM images of the representative NaYSO:1Eu powder sample at different magnifications: (a) ×10,000, (b) ×75,000, (c) TEM image of the representative NaYSO:1Eu powder sample with electron diffraction pattern and particle size distribution histogram as insets.
3.4. Calculations of the Structural and Electronic Properties
Calculations of the structural and electronic properties of NaY9Si6O26 were performed using the CASTEP module of Materials Studio [24]. The general gradient approximation (GGA) [25] and local density approximation (LDA) [26] were used to treat the exchange-correlation effects. The plane wave basis set cut-off was 370 eV; the k-points grid was 3 × 3 × 4. The electronic configurations for the atoms in the unit cell were 2s22p63s1 for Na, 3s23p2 for Si, 4s24p64d15s2 for Y, and 2s22p4 for O.
Figure 4a,b show the calculated (in both approximations) band structure of the studied material. The calculated direct band gap values are 4.665 eV (LDA) and 3.765 eV (GGA).
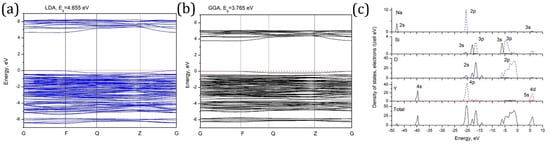
Figure 4.
(a,b) Calculated band structure of NaY9Si6O26. The coordinates of the special points of Brillouin zone are (in units of the reciprocal lattice unit vectors): G (0, 0, 0); F (0, ½, 0); Q (0, ½, ½); Z (0, 0, ½), and (c) calculated density of states diagrams for NaY9Si6O26.
Very low dispersion of the calculated electronic states, which follows from nearly flat electronic bands, indicates low mobility of the charge carriers. The origin of the calculated bands can be clarified with the help of the density of states diagrams (Figure 4c). The conduction band consists mainly of the Y 4d and Na 3s states. The upper part of the valence band is made by the oxygen 2p states, and highly hybridized 3s-3p states of silicon in four-fold coordination (sp3 hybridized states) are mainly at the bottom of the valence band. Several narrow bands between −22 eV and −13 eV are made by the oxygen 2s and the same highly hybridized Si 3s-3p states. Finally, at about −48 eV and −40 eV very deep Na 2s and Y 4s states, respectively, can be identified.
3.5. Optical Spectroscopy
The diffuse reflectance spectrum of the NaYSO:10Eu sample given in Figure 5a is recorded in the 220–700 nm range. A broad absorption below 250 nm is attributed to the charge transfer band while peaks at longer wavelengths are attributed to the f-f transition of Eu3+ ions.
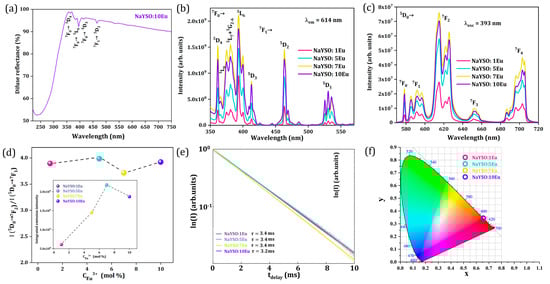
Figure 5.
(a) Diffuse reflectance spectrum of NaYSO:10Eu sample. Ambient temperature photoluminescence of NaY9Si6O26:xEu3+ (x = 1, 5, 7, 10 mol% Eu3+) samples: (b) excitation spectra under λem = 614 nm; (c) emission spectra under λexc = 393 nm; (d) asymmetry ratio as a function of Eu ions concentration with integrated emission intensity as a function of Eu3+ ions concentration given as Inset; (e) lifetime decay curves as a function of Eu3+ ions concentration; (f) CIE diagram with calculated coordinates.
The photoluminescence excitation spectra of all NaY9Si6O26:xEu3+ (x = 1, 5, 7, 10 mol% Eu3+) samples, recorded in the 350–575 nm (λem = 614 nm) range, are given in Figure 5b, showing emission lines of typical transitions within the 4f6 configuration of Eu3+. Excitation into the 5L6 (393 nm) energy level of Eu3+ is picked for observing the emission spectra since it is the most intense peak in the excitation spectra. Upon excitation, distinct emission bands in the visible spectral region corresponding to 5D0 → 7FJ (J = 0, 1, 2, 3, and 4) f-f transitions, placed around 578 nm, 592 nm, 615 nm, 652 nm, and 703 nm, respectively, are visible (see Figure 5c).
As mentioned above, there are two different Y3+ sites with unequal coordination numbers in the silicate apatite structure [7], one having nine-coordination with C3 symmetry and the other having seven-coordination with Cs symmetry, both being non-centrosymmetric. Such low symmetry stimulates the splitting of energy levels into a large number of Stark sublevels [27]. According to the Laport rule, the Eu3+ ion, with an [Xe]4f6 electronic configuration, has only magnetic-dipole transitions in a centrosymmetric site, whereas if in a non-centrosymmetric site, both magnetic-dipole and induced electric-dipole transitions are probable.
The 5D0 → 7F1 is a magnetic-dipole transition that does not depend on the local environment. However, the 5D0 → 7F2 electric-dipole transition is hypersensitive and highly dependent on changes in the local environment around the Eu3+ ions. Theoretically, when the Eu3+ ions occupy non-centrosymmetric sites, the emission spectrum shows a more intense 5D0 → 7F2 transition than the 5D0 → 7F1, which agrees with our experimental observations. In addition, the ratio of the integrated intensity of the 5D0 → 7F2 and 5D0 → 7F1 transitions, known as the asymmetry ratio, can be considered indicative of the reduction of symmetry of the coordination environment around the Eu3+ ion and is given by Equation (1):
The asymmetry ratio values obtained from the emission spectra are presented in Figure 5d showing no significant change with Eu3+ concentration. The high value of the asymmetry ratio as a function of dopant ion concentration indicates low symmetry of the Eu3+ surroundings in the NaY9Si6O26 apatite host. Also, no significant change with Eu3+ concentration reveals that the degree of distortion of the local symmetry around Eu3+ is similar in all the samples in the series produced, as indicated by XRD analysis. The inset in Figure 5d presents the integrated emission intensity as a function of Eu3+ concentration showing that 7 mol% Eu3+ is the optimal doping concentration in the NaY9Si6O26 host lattice.
The photoluminescent lifetime decay curves of all Eu3+-doped NaYSO samples recorded at ambient temperature can be seen in Figure 5e. The values of the lifetime (τ) were obtained after the data were fitted to a simple single exponential function. Even though two distinct crystallographic positions for Y3+ can host Eu3+ ions, our experimental data reveal single exponential decay curves. This can be explained either by both Y sites being non-centrosymmetric and having similar C3 and Cs symmetry or, most likely, by the similar lifetime values for each of the two Y sites that are not distinguishable by our integrated intensity decay measurement. All samples have similar, rather long lifetime values calculated to be in the 3.2 to 3.4 ms range.
Chromaticity coordinates (x, y) on the CIE chromaticity diagram, which represents a two-dimensional color space encompassing all colors visible to the human eye, can be utilized to quantify apparent color. We derived the CIE chromaticity coordinates from the photoluminescent spectra to evaluate the color of the synthesized samples, as shown in Figure 5f. For all the samples, CIE coordinates are almost identical (x = 0.65, y = 0.34; λdom = 614 nm; color purity = 93.6%) and placed in the orange-red portion of the diagram, confirming that there is no significant change in the local symmetry around Eu3+ across the series and consequently in the emission spectra.
The energy levels of trivalent Eu3+ ions in the structure were determined using room temperature excitation and emission spectra and are given in Table 4. Based on the whole luminescence spectra and the ratio of the 5D0 → 7FJ (J = 0–4) transitions, it is assumed that the Eu3+ ion occupies both sites. Also, using the 7F1 manifold, we carried out a simplified phenomenological crystal field calculation by considering only the second-order crystal field B20 (51.46 cm−1), and B22 (−642.6 cm−1) parameters to calculate the crystal field strength parameter Nv (1442.65 cm−1) [28], using the simplified Equation (2) given by Monteil and Zhu [29,30].
Table 4.
Energy levels of Eu3+ in the hexagonal NaY9Si6O26.
3.6. The Judd–Ofelt Calculation
To perform Judd–Ofelt calculations, the refractive index of NaY9Si6O26 is determined using the structural and electronic property calculations given above. Figure 6 presents the calculated index of refraction values as a function of wavelength.
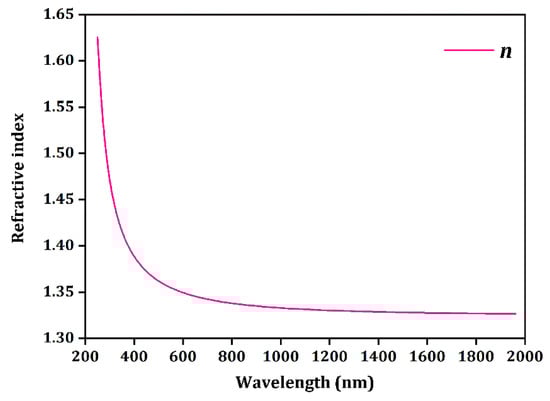
Figure 6.
Calculated refractive index of NaY9Si6O26.
The Judd–Ofelt theory is a framework for understanding the optical behavior of rare earth ions in different host materials. It allows for the calculation of intensity parameters for electric dipole transitions, aiding in the prediction of their absorption and emission spectra. In the case of the Eu3+ ion, these parameters can be derived from the emission spectrum of Eu3+ using the formula [31]:
Here, e denotes the elementary charge, Uλ represents the squared reduced matrix elements, n is the refractive index at the wavelength of the transition, and I is the integrated intensity. The transition 5D0 → 7F1 is a purely magnetic dipole transition, meaning its dipole strength DMD remains unaffected by the host matrix. The term corresponds to the average wavelength of the emission. The subscripts λ indicate electric dipole transitions.
The Judd–Ofelt Ω6 parameter can be best determined from the excitation spectrum of Eu3+ using the formula [32]:
In this context, index 6 corresponds to excitation from the ground level to 5L6, and 1 for the pure magnetic dipole transition to 5D1.
Using the Judd–Ofelt parameters, we can derive key quantities relevant to the practical applications of luminescent materials. The radiative transition probabilities, or rates of spontaneous emission, are given by [33]:
where h stands for the Planck constant. The emission branching ratio is defined as:
Note that A6 is neglected as its intensity is very low and because the transition 5D0 → 7F6 lies outside the visible range. The radiative lifetime is the inverse of the total radiative transition probability:
The intrinsic quantum yield can then be calculated from the ratio of the observed and radiative lifetimes:
A complete Judd–Ofelt analysis was performed on all concentrations and the results are summarized in Table 5. The Ω2 parameter, which is related to the degree of symmetry and covalency of the Eu3+ ion, is unchanged with the Eu3+ concentration, while the Ω4 and Ω6 parameters related to the long-range effects and rigidity of the matrix [34] see a small decrease with rising concentration. According to the branching ratio and the radiative transition probability, the hypersensitive 5D0 → 7F2 transition is dominant in the emission spectrum. The concentration has no significant impact on the rather long radiative lifetime of 5D0 emissions, as confirmed by experimental data given previously in Figure 5e.
Table 5.
Judd–Ofelt analysis of NaY9Si6O26 doped with various concentrations of Eu3+.
4. Conclusions
This study gives a comprehensive insight into Eu3+-doped NaY9Si6O26 oxyapatite phosphor—its synthesis, structural, morphological, electronic, and optical properties. It is shown that with hydrothermal synthesis, it is possible to obtain single-phase hexagonal NaY9Si6O26 oxyapatite nanophosphors. Differential thermal analysis shows that, in the NaY9Si6O26 host material, amorphous-to-crystalline transformation is somewhat lower compared to simple orthosilicates (Y2SiO5 and Y2Si2O7) and comparable to similar, apatite-type silicates (i.e., La10Si6O27). Photoluminescent measurements show typical orange-red emission of trivalent Eu3+ showing that 7 mol% Eu3+ is the optimal doping concentration in the NaY9Si6O26 host lattice. However, lifetime measurements show that the Eu3+ concentration has no significant impact on the rather long radiative lifetime of 5D0 emission. The findings presented here can be used to further develop alkaline metal/rare earth orthosilicate phosphors that meet specific needs in technology and industry.
Author Contributions
Conceptualization, M.D.D.; methodology, M.D.D. and Ž.A.; formal analysis, M.I., J.P., A.Ć., M.M.C., A.N.A., Ž.A. and M.G.B.; investigation, M.I., J.P., A.Ć., M.M.C., M.G.B. and A.N.A.; writing—original draft preparation, M.I., Ž.A. and J.P.; writing—review and editing, M.D.D., A.Ć. and Ž.A.; visualization, M.I., J.P., A.Ć., A.N.A. and M.M.C.; supervision, M.D.D. All authors have read and agreed to the published version of the manuscript.
Funding
This study was supported by Romania’s National Recovery and Resilience Plan, NRRP, [project grant number C9-I8-28/ FC 760107/2023]. Author ANA would like to extend sincere appreciation to the Researcher supporting program at King Saud University, Riyadh, for funding this work under the project number (RSP2024R304). Authors from Vinča Institute would like to acknowledge funding of the Ministry of Science, Technological Development, and Innovation of the Republic of Serbia under contract 451-03-47/2023–01/200017.
Data Availability Statement
The original contributions presented in the study are included in the article. Further inquiries can be directed to the corresponding authors.
Conflicts of Interest
The authors declare no conflict of interest.
References
- Ptáček, P. Apatites and Their Synthetic Analogues-Synthesis, Structure, Properties and Applications; Intech Open: London, UK, 2016. [Google Scholar] [CrossRef]
- Anil; Kumar, B.; Barwar, A.; Barbar, S.K. Structural, Optical and Photoluminescence Characteristics of Apatite Type Lanthanide Silicates. J. Mol. Struct. 2024, 1312, 138607. [Google Scholar] [CrossRef]
- Kobayashi, K.; Sakka, Y. Rudimental Research Progress of Rare-Earth Silicate Oxyapatites: Their Identification as a New Compound until Discovery of Their Oxygen Ion Conductivity. J. Ceram. Soc. Jpn. 2014, 122, 649–663. [Google Scholar] [CrossRef]
- Neeway, J.J.; Asmussen, R.M.; McElroy, E.M.; Peterson, J.A.; Riley, B.J.; Crum, J.V. Kinetics of Oxyapatite [Ca2Nd8(SiO4)6O2] and Powellite [(Ca,Sr,Ba)MoO4] Dissolution in Glass-Ceramic Nuclear Waste Forms in Acidic, Neutral, and Alkaline Conditions. J. Nucl. Mater. 2019, 515, 227–237. [Google Scholar] [CrossRef]
- Liu, H.; Liao, L.; Pan, X.; Su, K.; Shuai, P.; Yan, Z.; Guo, Q.; Mei, L. Recent Research Progress of Luminescent Materials with Apatite Structure: A Review. Open Ceram. 2022, 10, 100251. [Google Scholar] [CrossRef]
- Sumathi, S.; Gopal, B. A New Insight into Biomedical Applications of an Apatite like Oxyphosphate–BiCa4(PO4)3O. Ceram. Int. 2015, 41, 4852–4860. [Google Scholar] [CrossRef]
- Chuai, X.H.; Zhang, H.J.; Li, F.S.; Lu, S.Z.; Lin, J.; Wang, S.B.; Chi-Chou, K. Synthesis and Luminescence Properties of Oxyapatite NaY9Si6O26 Doped with Eu3+, Tb3+, Dy3+ and Pb2+. J. Alloys Compd. 2002, 334, 211–218. [Google Scholar] [CrossRef]
- Kang, T.W.; Choi, Y.B.; Kang, C.H.; Park, Y.J.; Kim, J.H.; Bae, B.; Kim, S.W. Development of NaY9Si6O26:Yb3+ Phosphors with High Thermal Stability for NIR Anti-Counterfeiting: Study of Its Crystal Structure and Luminescent Properties. RSC Adv. 2023, 13, 7597–7602. [Google Scholar] [CrossRef]
- Zheng, L.; Zheng, B.; Xia, H.; Wang, J.; Song, H.; Chen, B. Color-Tunable Emission and Non-Contact Optical Temperature Sensing Performance in NaY9Si6O26: Ce3+, Eu3+ Phosphors. Mater. Res. Bull. 2021, 138, 111210. [Google Scholar] [CrossRef]
- Zheng, L.; Zhou, X.; Zhang, J.; Xia, H.; Song, H.; Chen, B. Multiple Occupation Sites of Bi3+ and Full Color Luminescence Tuning through Co-Doped Eu3+ in NaY9Si6O26 Phosphors. J. Alloys Compd. 2020, 847, 156575. [Google Scholar] [CrossRef]
- Brgoch, J.; Borg, C.K.H.; Denault, K.A.; Douglas, J.R.; Amanda Strom, T.; DenBaars, S.P.; Seshadri, R. Rapid Microwave Preparation of Cerium-Substituted Sodium Yttrium Silicate Phosphors for Solid State White Lighting. Solid State Sci. 2013, 26, 115–120. [Google Scholar] [CrossRef]
- Preparation Method of Fusiform Apatite Phase Y4.67(SiO4)3O Powder, CN105776231A. Available online: https://patents.google.com/patent/CN105776231A/en?oq=CN105776231A (accessed on 12 September 2024).
- Wang, Q.-G.; Huang, J.-F.; Zhou, L.; Wu, W.-C.; Cao, L.-Y. Thermal Property of Y4.67 (SiO4)3 Ceramic Sintered from Hydrothermally Synthesized Spindle-like Y4.67(SiO4)3O Apatite Crystallites. J. Inorg. Mater. 2018, 33, 688–692. [Google Scholar] [CrossRef]
- Gu, H.; Hou, X.; Zhang, R.; Fang, D. Novel High-temperature-resistant Y2SiO5 Aerogel with Ultralow Thermal Conductivity. Int. J. Appl. Ceram. Technol. 2019, 16, 2393–2397. [Google Scholar] [CrossRef]
- Boyer, D.; Derby, B. Yttrium Silicate Powders Produced by the Sol–Gel Method, Structural and Thermal Characterization. J. Am. Ceram. Soc. 2003, 86, 1595–1597. [Google Scholar] [CrossRef]
- Krsmanović, R.W.; Andrić, Ž.; Marinović-Cincović, M.; Zeković, I.; Dramićanin, M.D. Optical and Thermal Investigation of Sol-Gel Derived Eu3+: Y2SiO5 Nanoparticles. Acta Phys. Polonica. A 2007, 112, 981–986. [Google Scholar] [CrossRef]
- Moya, J.S.; Díaz, M.; Serna, C.J.; Mello-Castanho, S. Formation of Nanocrystalline Yttrium Disilicate Powder by an Oxalate Gel Method. J. Eur. Ceram. Soc. 1998, 18, 1381–1384. [Google Scholar] [CrossRef]
- Jo, S.H.; Muralidharan, P.; Kim, D.K. Low-Temperature Sintering of Dense Lanthanum Silicate Electrolytes with Apatite-Type Structure Using an Organic Precipitant Synthesized Nanopowder. J. Mater. Res. 2009, 24, 237–244. [Google Scholar] [CrossRef]
- Tao, S.; Irvine, J.T.S. Preparation and Characterisation of Apatite-Type Lanthanum Silicates by a Sol-Gel Process. Mater. Res. Bull. 2001, 36, 1245–1258. [Google Scholar] [CrossRef]
- Li, J.; Cai, Q.; Horri, B.A. Synthesis and Densification of Mo/Mg Co-Doped Apatite-type Lanthanum Silicate Electrolytes with Enhanced Ionic Conductivity. Chem. A Eur. J. 2023, 29, e202300021. [Google Scholar] [CrossRef]
- Shannon, R.D. Revised Effective Ionic Radii and Systematic Studies of Interatomic Distances in Halides and Chalcogenides. Acta Crystallogr. A 1976, 32, 751–767. [Google Scholar] [CrossRef]
- Lee, F.C.; Marr, J.; Glasser, F.P. Compounds in the Na2O Y2O3 SiO2 System. Ceram. Int. 1981, 7, 43–47. [Google Scholar] [CrossRef]
- Redhammer, G.R.; Roth, G. Lithium and Sodium Yttrium Orthosilicate Oxyapatite, LiY9(SiO4)6O2 and NaY9(SiO4)6O2, at Both 100 K and near Room Temperature. Acta Crystallogr. C 2003, 59, i120–i124. [Google Scholar] [CrossRef] [PubMed]
- Clark, S.J.; Segall, M.D.; Pickard, C.J.; Hasnip, P.J.; Probert, M.I.J.; Refson, K.; Payne, M.C. First Principles Methods Using CASTEP. Z. Für Krist. -Cryst. Mater. 2005, 220, 567–570. [Google Scholar] [CrossRef]
- Perdew, J.P.; Burke, K.; Ernzerhof, M. Generalized Gradient Approximation Made Simple. Phys. Rev. Lett. 1996, 77, 3865–3868. [Google Scholar] [CrossRef] [PubMed]
- Ceperley, D.M.; Alder, B.J. Ground State of the Electron Gas by a Stochastic Method. Phys. Rev. Lett. 1980, 45, 566–569. [Google Scholar] [CrossRef]
- Binnemans, K.; Görller-Walrand, C. Application of the Eu3+ ion for site symmetry determination. J. Rare Earths 1996, 14, 173–180. [Google Scholar]
- Malta, O.L.; Antic-Fidancev, E.; Lemaitre-Blaise, M.; Milicic-Tang, A.; Taibi, M. The Crystal Field Strength Parameter and the Maximum Splitting of the 7F1 Manifold of the Eu3+ Ion in Oxides. J. Alloys Compd. 1995, 228, 41–44. [Google Scholar] [CrossRef]
- Monteil, A.; El-Jouad, M.; Alombert-Goget, G.; Chaussedent, S.; Gaumer, N.; Mahot, A.; Chiasera, A.; Jestin, Y.; Ferrari, M. Relationship between Structure and Optical Properties in Rare Earth-Doped Hafnium and Silicon Oxides: Modeling and Spectroscopic Measurements. J. Non-Cryst. Solids 2008, 354, 4719–4722. [Google Scholar] [CrossRef]
- Zhu, C.; Monteil, A.; EI-Jouad, M.; Gaumer, N.; Chaussedent, S. Influence of Thermal Treatment on Optical and Structure Properties of Europium-Doped SiO2–HfO2 Glasses. J. Am. Ceram. Soc. 2010, 93, 1039–1043. [Google Scholar] [CrossRef]
- Ćirić, A.; Stojadinović, S.; Sekulić, M.; Dramićanin, M.D. JOES: An Application Software for Judd-Ofelt Analysis from Eu3+ Emission Spectra. J. Lumin. 2019, 205, 351–356. [Google Scholar] [CrossRef]
- Ćirić, A.; Marciniak, Ł.; Dramićanin, M.D. Self-Referenced Method for the Judd–Ofelt Parametrisation of the Eu3+ Excitation Spectrum. Sci. Rep. 2022, 12, 563. [Google Scholar] [CrossRef]
- Binnemans, K. Interpretation of Europium(III) Spectra. Coord. Chem. Rev. 2015, 295, 1–45. [Google Scholar] [CrossRef]
- Walsh, B.M. Judd-Ofelt Theory: Principles and Practices. In Advances in Spectroscopy for Lasers and Sensing; Di Bartolo, B., Forte, O., Eds.; Springer: Dordrecht, The Netherlands, 2006; pp. 403–433. ISBN 978-1-4020-4788-6. [Google Scholar]
Disclaimer/Publisher’s Note: The statements, opinions and data contained in all publications are solely those of the individual author(s) and contributor(s) and not of MDPI and/or the editor(s). MDPI and/or the editor(s) disclaim responsibility for any injury to people or property resulting from any ideas, methods, instructions or products referred to in the content. |
© 2024 by the authors. Licensee MDPI, Basel, Switzerland. This article is an open access article distributed under the terms and conditions of the Creative Commons Attribution (CC BY) license (https://creativecommons.org/licenses/by/4.0/).