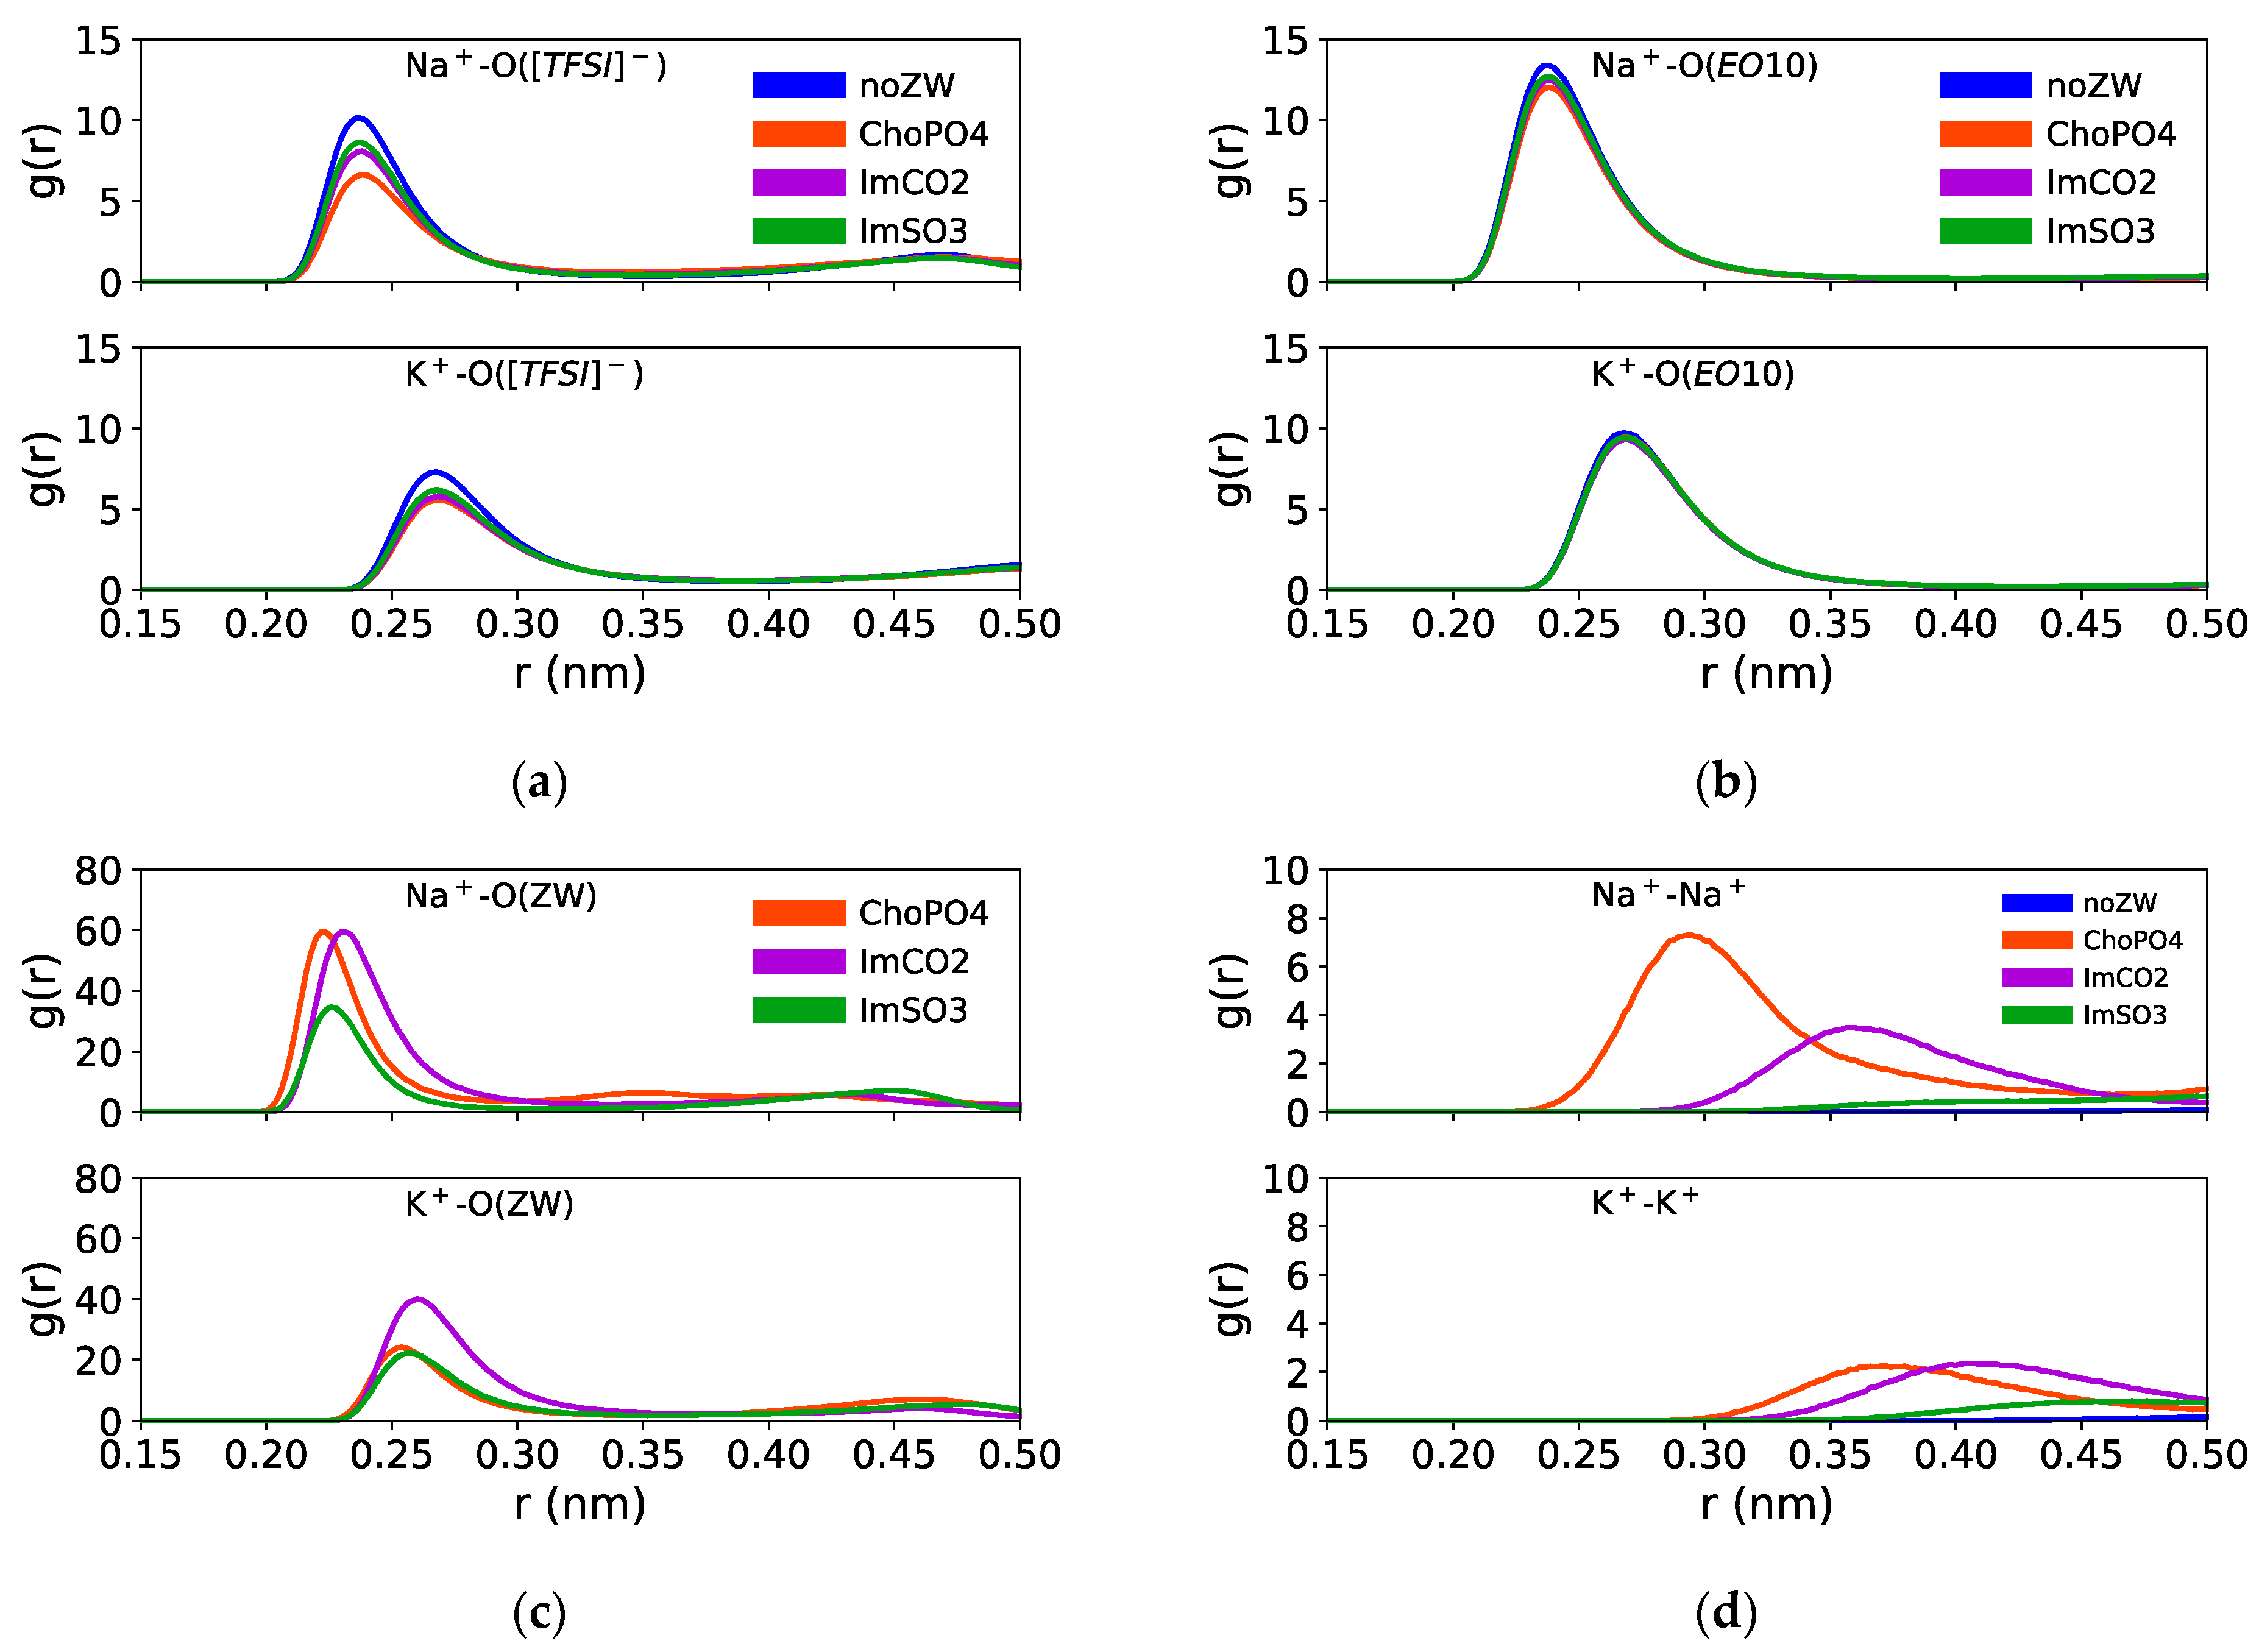
3.1. Radial Distribution Functions (RDFs)
Figure 3 shows the cation–O([TFSI]
−), cation–O(EO
10), and cation–O(ZW) RDFs in Na
+ and K
+ electrolytes. The RDFs of Na
+–O([TFSI]
−), Na
+–O(EO
10), and Na
+–O(ZW) showed a high peak located around 0.24 nm, consistent with the literature [
34,
35,
36,
37,
38,
39,
40]. Meanwhile, the K
+–O([TFSI]
−) and K
+–O(EO
10) RDFs showed high peaks at a further distance of around 0.27 nm. Previous studies [
38,
41,
42,
43,
44,
45] also reported that the K⁺–O RDF peaks were at a greater distance at around 0.28 nm, indicating weaker K⁺–O interactions compared to Na
+–O interactions. The high RDF peaks suggested a strong coordination between Na
+ and K
+ ions with [TFSI]
−, EO
10, and ZW molecules.
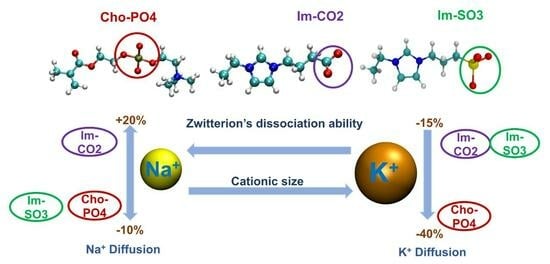
Among these three ZW structures, ChoPO4 demonstrated the most pronounced effect in reducing the preference of Na
+ for coordinating with [TFSI]
− and EO
10.
Figure 3a,b shows that the RDF peak heights of Na
+–O([TFSI]
−) decreased from 10 to 7 with ChoPO4 addition, whereas were around 8 and 9 with ImCO2 and ImSO3, respectively. Likewise, the Na
+–O(EO
10) RDF peak height decreased from around 14 to 12 with ChoPO4 and to about 13 with ImCO2 and ImSO3. A similar phenomenon was also observed in the case of Li
+ in our prior study [
24], which showed that ChoPO4 presence resulted in a 30% decrease in the RDF peak heights of Li
+–O(EO
10) and Li
+–O([TFSI]
−), while ImCO2 and ImSO3 only caused a 6% reduction in those RDF peak heights. The more significant decrease in the RDF peak heights indicated the higher efficacy of ChoPO4 in diminishing Na
+ coordination with [TFSI]
− and EO
10.
Regarding the larger K
+ ion, the ZW molecules had a weaker effect on K
+ coordination preference for EO
10 and [TFSI]
−.
Figure 3a,b shows that all ZW molecules caused a slight decrease in the peak heights of K
+–O([TFSI]
−) from 7 to 6 and exerted a minute effect on K
+–O(EO
10) RDFs. It was noted that while ChoPO4 had the strongest influence on the coordination preference of Na
+/Li
+ for [TFSI]
− and EO
10, the three ZW compounds had a comparable effect on K
+ coordination preference. Hence, compared to the effects of ImSO3 and ImCO2, ChoPO4 effect became weaker when increasing the cationic size.
The weakening of the ChoPO4 effect on K
+ coordination preference might have been due to a decrease in K
+ preference for coordinating with ChoPO4.
Figure 3c indicates that Na
+–O(ChoPO4) RDF peak was the highest. In contrast, K
+–O(ChoPO4) RDF peak height was lower than that of K
+–O(ImCO2) RDF peak. The larger size of K
+ might hinder the coordination of the cation with all four O atoms in ChoPO4 molecules. Instead, the coordination with two O atoms from ZW molecules was preferred by K
+.
Figure S2 (Supporting Information) shows that K
+ preferred to coordinate with two O atoms having double bonds with the P atom in the PO
4 group of ChoPO4. As shown in
Figure S2, the RDF peak heights for K
+ and O4/O5 were higher than those for K
+ and O3/O6 in PO
4 (O4/O5 are double-bonded to the P atom, and O3/O6 are single-bonded to the P atom). Moreover, as shown in
Figure S2, the RDF peak heights of K
+–O4/O5(ChoPO4) were higher than those of K
+–O(ImCO2) and K
+–O(ImSO3).
Figure 3c shows that increasing the cationic size led to a decrease in cation–ZW molecule coordination preference. The peak heights of the RDFs of K
+–O(ZW) were lower than those of the RDFs of Na
+–O(ZW), which were in turn lower than those of the RDFs of Li
+–O(ZW). However, the coordination preference of cations for ChoPO4 showed a greater reduction than that for ImSO3 and ImCO2. For example, on the basis of our prior study on Li
+ [
24], the cation–O(ChoPO4) RDF peak height decreased by 50% when changing from Li
+ to Na
+, and by 61% when substituting Na
+ with K
+. The cation–O(ImSO3) RDF peak height decreased by 47% and 37% when changing from Li
+ to Na
+ and from Na
+ to K
+, respectively. Similarly, reductions of 38% and 32% were observed for the cation–O(ImCO2) RDF peak height when changing from Li
+ to Na
+ and from Na
+ to K
+, respectively. Such larger decrease in the coordination preference of cations for ChoPO4 compared to that for ImSO3 and ImCO2 was correlated with the weakening of the ChoPO4 effect on cation–O(EO
10) and cation–O([TFSI]
−) coordination preference.
As shown in
Figure 3d, ChoPO4 and ImCO2 could induce the formation of indirect cationic pairs. The height of the RDF cation–cation peaks was increased with the addition of ChoPO4 and ImCO2 in both Na
+ and K
+ systems. The cation–cation RDF peak heights followed the order ChoPO4 > ImCO2 > ImSO3 for Na
+, and ChoPO4 ≈ ImCO2 > ImSO3 for K
+. This order of cation–cation RDF peak heights correlated with that of Na
+–ZW and K
+–ZW molecule RDF peak heights (
Figure 3c and
Figure S1), and a similar phenomenon was also evident in Li
+ electrolytes [
24]. This finding suggests that cations exhibit a strong tendency to coordinate with ZW molecules, which results in the aggregation of cations around ZW molecules. Consequently, ZW molecules function as “bridges,” facilitating indirect pairing among the cations themselves. The pairing of cations is illustrated in
Figures S3 and S4.
3.2. Coordination Number
Table 2 and
Table 3 show the calculated coordination numbers of cation–O(EO10) (N
cation-O(EO10)), cation–O([TFSI]
−) (N
cation-O([TFSI]−), and cation–O(ZW) (N
cation-O(ZW)) and their sums for Na
+ and K
+ in the eight electrolytes listed in
Table 1. The total cation–O coordination number was higher for K
+ (7.03–7.15) than for Na
+ (6.52–6.70), which is consistent with the literature [
44,
45].
The highest coordination number was observed for cation–O(EO
10). For example, as shown in
Table 2, on average, a Na
+ ion coordinated with 3.7 O atoms from EO
10, 1.5 O atoms from [TFSI]
−], and 1.5 O atoms from the ChoPO4 molecule. Similarly, the coordination numbers of K
+–O exhibited the same trend as those determined for Na
+ electrolytes (
Table 3) as well as Li
+ electrolytes [
24]. While cations exhibited a stronger inclination to coordinate with the ZW molecules than with the other tested molecules (
Figure 3), the coordination number of cation–O(ZW) was lower compared to that of cation–O(EO
10), which was attributed to the low ZW molecule/cation molar ratio of 1:5. Our prior study [
23] observed that when ImSO3 was added at an ImSO3/Li
+ molar ratio of 1:1, the coordination number of Li
+–O(ImSO3) was the highest in the ImSO3/LiTFSI/EO
5 electrolyte at the Li
+/O(EO
5) molar ratio – r = 1:6.
Overall, adding ZW molecules to an electrolyte can reduce the coordination numbers of Na
+–O and K
+–O. Among the three examined ZW structures, ChoPO4 caused the highest decrease in cation–O([TFSI]
−) and cation–O(EO
10) coordination. For example,
Table 2 shows that the N
Na+-O(EO10) decreased from 4.60 to 3.72 with ChoPO4, and to 4.03 and 4.11 with the addition of ImCO2 and ImSO3, respectively. Similarly, ChoPO4 addition also reduced the Na
+–O([TFSI]
−) coordination number by 28%, whereas ImCO2 reduced the coordination number by 20%, and ImSO3 by 17%. As shown in
Table 3, the ZW molecules exerted the same effects in K
+ electrolyte systems. N
K+-O(EO10) decreased from 4.83 to 4.27 with ChoPO4 and to 4.35 and 4.40 with the addition of ImCO2 and ImSO3, respectively. Likewise, the addition of ChoPO4 resulted in the highest reduction in the K
+–O([TFSI]
−) coordination number (ChoPO4: 24%; ImCO2: 20%; ImSO3: 17%). This trend indicated that ChoPO4 is better at reducing the coordination of cations with [TFSI]
− and EO
10 compared to ImSO3 and ImCO2, which correlates with the higher preference of cations for forming coordination with ChoPO4 (as shown by the cation–O(ZW) RDF results—
Figure 3).
As the cationic size increased, the effect of the ZW molecules on cation–EO
10 weakened. Combining our previous study on Li
+ [
24] with
Table 2 and
Table 3, we observed that ChoPO4 decreased the N
cation-O(EO10) by 30% with Li
+, by 19% with Na
+, and only by 11% with K
+. Similarly, ImSO3 and ImCO2 exhibited a comparable trend, reducing N
cation-O(EO10) by approximately 16% with Li
+, 12% with Na
+, and 10% with K
+. The weakening of ZW molecules’ effect on cation–EO
10 coordination number is consistent with the corresponding RDF results shown in
Figure 3. The reduction in cation–ZW coordination preference led to a weakened effect of the ZW molecules on the cation-EO
10 coordination number.
The effect of ChoPO4 on cation–O([TFSI]
−) coordination weakened in the case of K
+ compared to Na
+, whereas ImCO2 and ImSO3 maintained their impact on cation–O([TFSI]
−) coordination. Specifically, ChoPO4 decreased N
cation-O([TFSI]−) by 28% in the presence of Na
+ and by 24% with K
+. However, the reduction effect of ImCO2 and ImSO3 on N
cation-O([TFSI]−) remained consistent, amounting to 20% and 17%, respectively, for the Na
+ and K
+ systems. Our previous study [
24] showed that ChoPO4, ImCO2, and ImSO3 reduced N
Li+-O([TFSI]−) by 29%, 17%, and 14%, respectively, which suggests ImCO2 and ImSO3 were even slightly more effective in reducing Na
+/K
+–[TFSI]
− than Li
+–[TFSI]
− coordination.
The order of the cation–O(ZW) coordination numbers was as follows: ChoPO4 > ImCO2 > ImSO3.
Table 2 shows that the Na
+–O(ZW) coordination numbers were 1.47, 0.92, and 0.67 for ChoPO4, ImCO2, and ImSO3, respectively. Likewise, the K
+–O(ChoPO4), K
+–O(ImCO2), and K
+–O(ImSO3) coordination numbers were 1.00, 0.96, and 0.77, respectively. This ranking of cation–O(ZW) coordination numbers aligns with their respective RDF peak heights. A higher cation–O(ChoPO4) coordination number accounted for a more substantial reduction in the coordination numbers of cation–O([TFSI]
−) and cation–O(EO
10) upon adding ChoPO4, compared to that observed in the presence of ImCO2 and ImSO3. The coordination number of cation–O(ImCO2) was higher than that of cation–O (ImSO3), which correlated with ImCO2 more effective dissociation effect on cation– O([TFSI]
−) and cation–O(EO
10) coordination.
With an increasing cation size, the cation–O(ChoPO4) coordination number decreased, while that of cation–O(ImCO2/ImSO3) increased. In combination with our study on Li
+ electrolytes [
24],
Table 2 and
Table 3 show that the cation–O(ChoPO4) coordination number was 1.69 for Li
+,1.47 for Na
+, 1.00 for K
+. In contrast, the coordination number of cation–O(ImCO2) increased from 0.82 for Li
+ to 0.92 for Na
+, and further to 0.96 for K
+. The same trend was observed for the cation–O(ImSO3) coordination number (0.60 for Li
+, 0.67 for Na
+, 0.77 for K
+). The geometry of ChoPO4 might hinder its coordination with larger cations, resulting in a decrease in the cation–O(ChoPO4) coordination number with increasing cation size. ImSO3 and ImCO2 possess anionic groups at the end of their molecules, enabling an easier association with larger cations. It is noted that the cation–O(ImCO2) coordination number approached 1 as the cation size increased. This suggests that larger cations such as K
+ might prefer to coordinate with one O atom from ImCO2 at the molar ratio K
+/O(ImCO2) of 5:1.
3.3. Percentage of Li+ Leaving the Coordination with EO10 Chains
ChoPO4 demonstrated the highest efficacy in completely freeing Na
+ and K
+ from the coordination with EO
10. In our prior study, we showcased the effectiveness of ZW molecules in releasing Li
+ from the wrapping of EO chains [
24]. In this study, we investigated this ZW molecules’ dissociation ability on Na
+ and K
+. As shown in
Table 2 and
Table 3, the ZW molecules decreased the average cation–O(EO
10) coordination number, which indicated that the cations coordinated with PEO chains with fewer O atoms or were completely dissociated from the PEO chains. To further assess this dissociation effect of the ZW molecules, we computed the percentage of cations that were not in coordination with O(EO
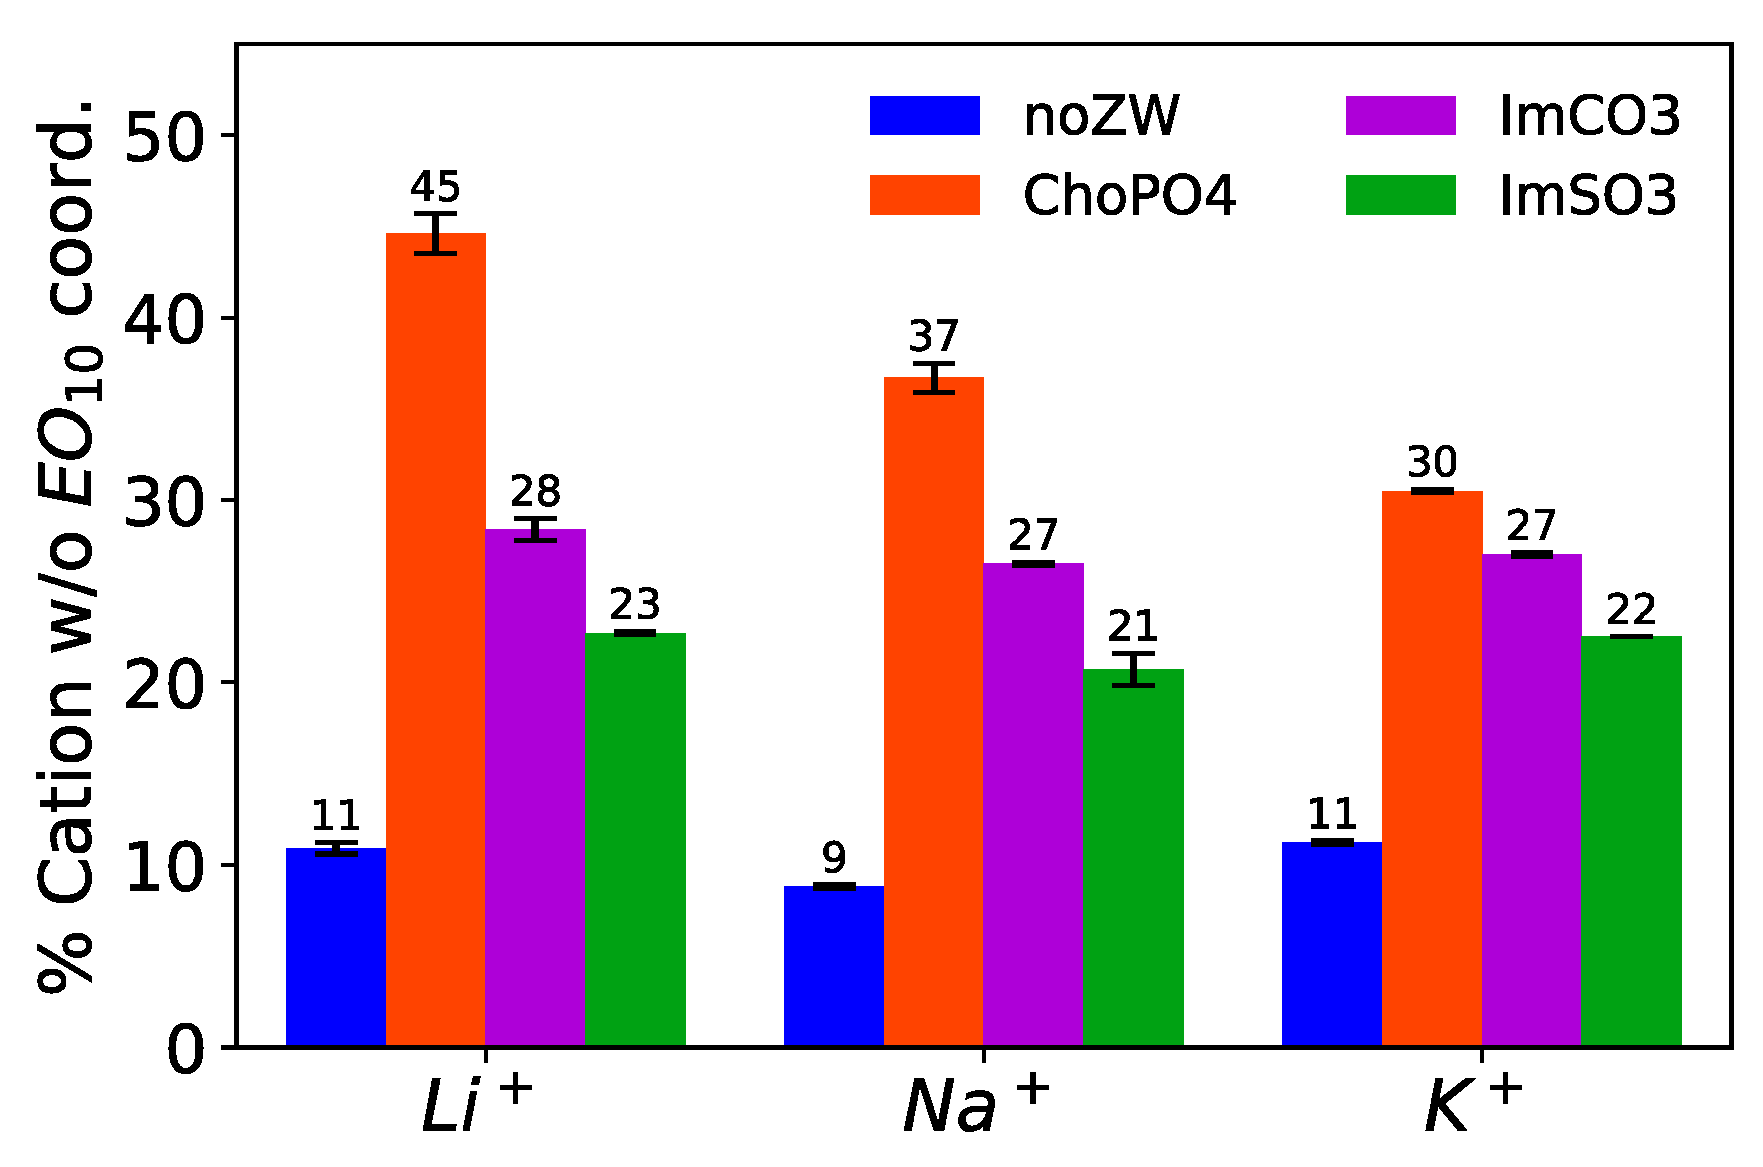
10) in the eight systems.
Figure 4 shows that ChoPO4 addition led to a rise in the percentage of Na
+ not coordinating with EO
10, from 9% to 37%. ImCO2 and ImSO3 exhibited a lesser capacity to completely release Na
+ from the coordination with EO
10 chains. ImCO2 and ImSO3 dissociated around 27% and 21% of Na
+ from the EO
10 chains, respectively. As shown in
Table 3 and
Figure 4, these three ZW molecules showed the same trend for their ability to fully release K
+ from EO
10 chains. Such trend was correlated with the cation–O(ZW) and cation–O(EO
10) coordination numbers. The more extensively the ZW molecules coordinated with cations, the better they dissociated cations from coordination with EO
10.
The dissociation effect of ChoPO4 on cation–EO
10 coordination decreased as the cation size increased, while that of ImSO3 and ImCO2 remained unvaried.
Figure 4 shows that the percentage of cations not coordinating with EO
10 decreased from 37% to 30% when ChoPO4 was added to the Na
+ and K
+ systems, respectively. In our previous work [
24], we observed a higher percentage of Li
+ (45%) not coordinating with EO
10 in the presence of ChoPO4. The decreased effect of ChoPO4 correlated with the reduction in the cation–ChoPO4 coordination number. The larger cationic size favored the coordination with fewer O atoms from ChoPO4, thereby weakening the ability of ChoPO4 to replace EO
10 in the cation coordination shell. However, ImSO3 and ImCO2 showed a minute change in their ability to release cations completely from coordination with EO
10. ImSO3 and ImCO2 released 28% and 23% of Li
+ from coordination with EO
10, respectively, in our previous study [
24].
ChoPO4 and ImCO2 had a weak exclusive solvation effect on Na
+ and K
+.
Table 4 shows the percentages of Na
+ and K
+ coordinating exclusively with the ZW molecules. Around 2–3% of Na
+ and K
+ were coordinated exclusively with ChoPO4 and ImCO2. This exclusion effect of ChoPO4 was stronger in the case of Li
+ [
24]. Specifically, 9% of Li
+ coordinated with ChoPO4 exclusively, at the same concentration and molar ratios as Na
+ and K
+ in their respective systems. The large ionic size hindered the coordination with multiple O atoms from ChoPO4, thus reducing the exclusive coordination with ChoPO4.
Na
+ formed coordination with multiple O atoms from ChoPO4 to a greater extent than with O atoms from ImSO3 and ImCO2.
Figure 5 illustrates the distribution of the cation–O(ZW) coordination numbers in the Na
+ and K
+ systems. The cation–O(ZW) coordination numbers were sorted by the number of O atoms in the ZW molecules with which the cation coordinated.
Figure 5b shows that a higher percentage of Na
+ was found to coordinate with more than one O atom from ChoPO4 than with more than one O atom from ImCO2 and ImSO3. Approximately 93% of Na
+ coordinated with more than one O atom from ChoPO4, while around 83% of Na
+ coordinated with more than one O atom from ImCO2, and that number was 45% for ImSO3 (7%, 17%, and 55% of Na
+ coordinated with one O from ChoPO4, ImCO2, and ImSO3, respectively). The same trend was also observed with Li
+ electrolytes [
24].
The cation with larger size showed a reduction in the coordination with multiple O atoms from ChoPO4 and an increase in the coordination with multiple O atoms from ImSO3 and ImCO2.
Figure 5b shows that the 80% of K
+ coordinated with more than one O from ChoPO4, and this percentage was higher for Na
+ (93%). Our previous study [
24] observed that 100% of Li
+ coordinated with more than one O from ChoPO4. In contrast, the percentage of cations coordinating with more than one O from ImSO3 increased from 30% for Li
+ to 45% for Na
+, and further to 55% for K
+. Likewise, the percentage of cations coordinating with more than one O from ImCO2 was 70% and 83% for Li
+ and Na
+, respectively. However, the distribution of the cation–O(ImCO2) coordination numbers remained comparable between Na
+ and K
+. The trend of cations coordinating with multiple O(ZW) atoms was also reflected in the average cation–O(ZW) coordination numbers (
Table 1 and
Table 2).
Figures S3 and S4 show simulation snapshots as examples of the different morphology of the Na
+–ZW molecule and K
+–ZW molecule coordination systems.
3.4. Coordination Lifetime
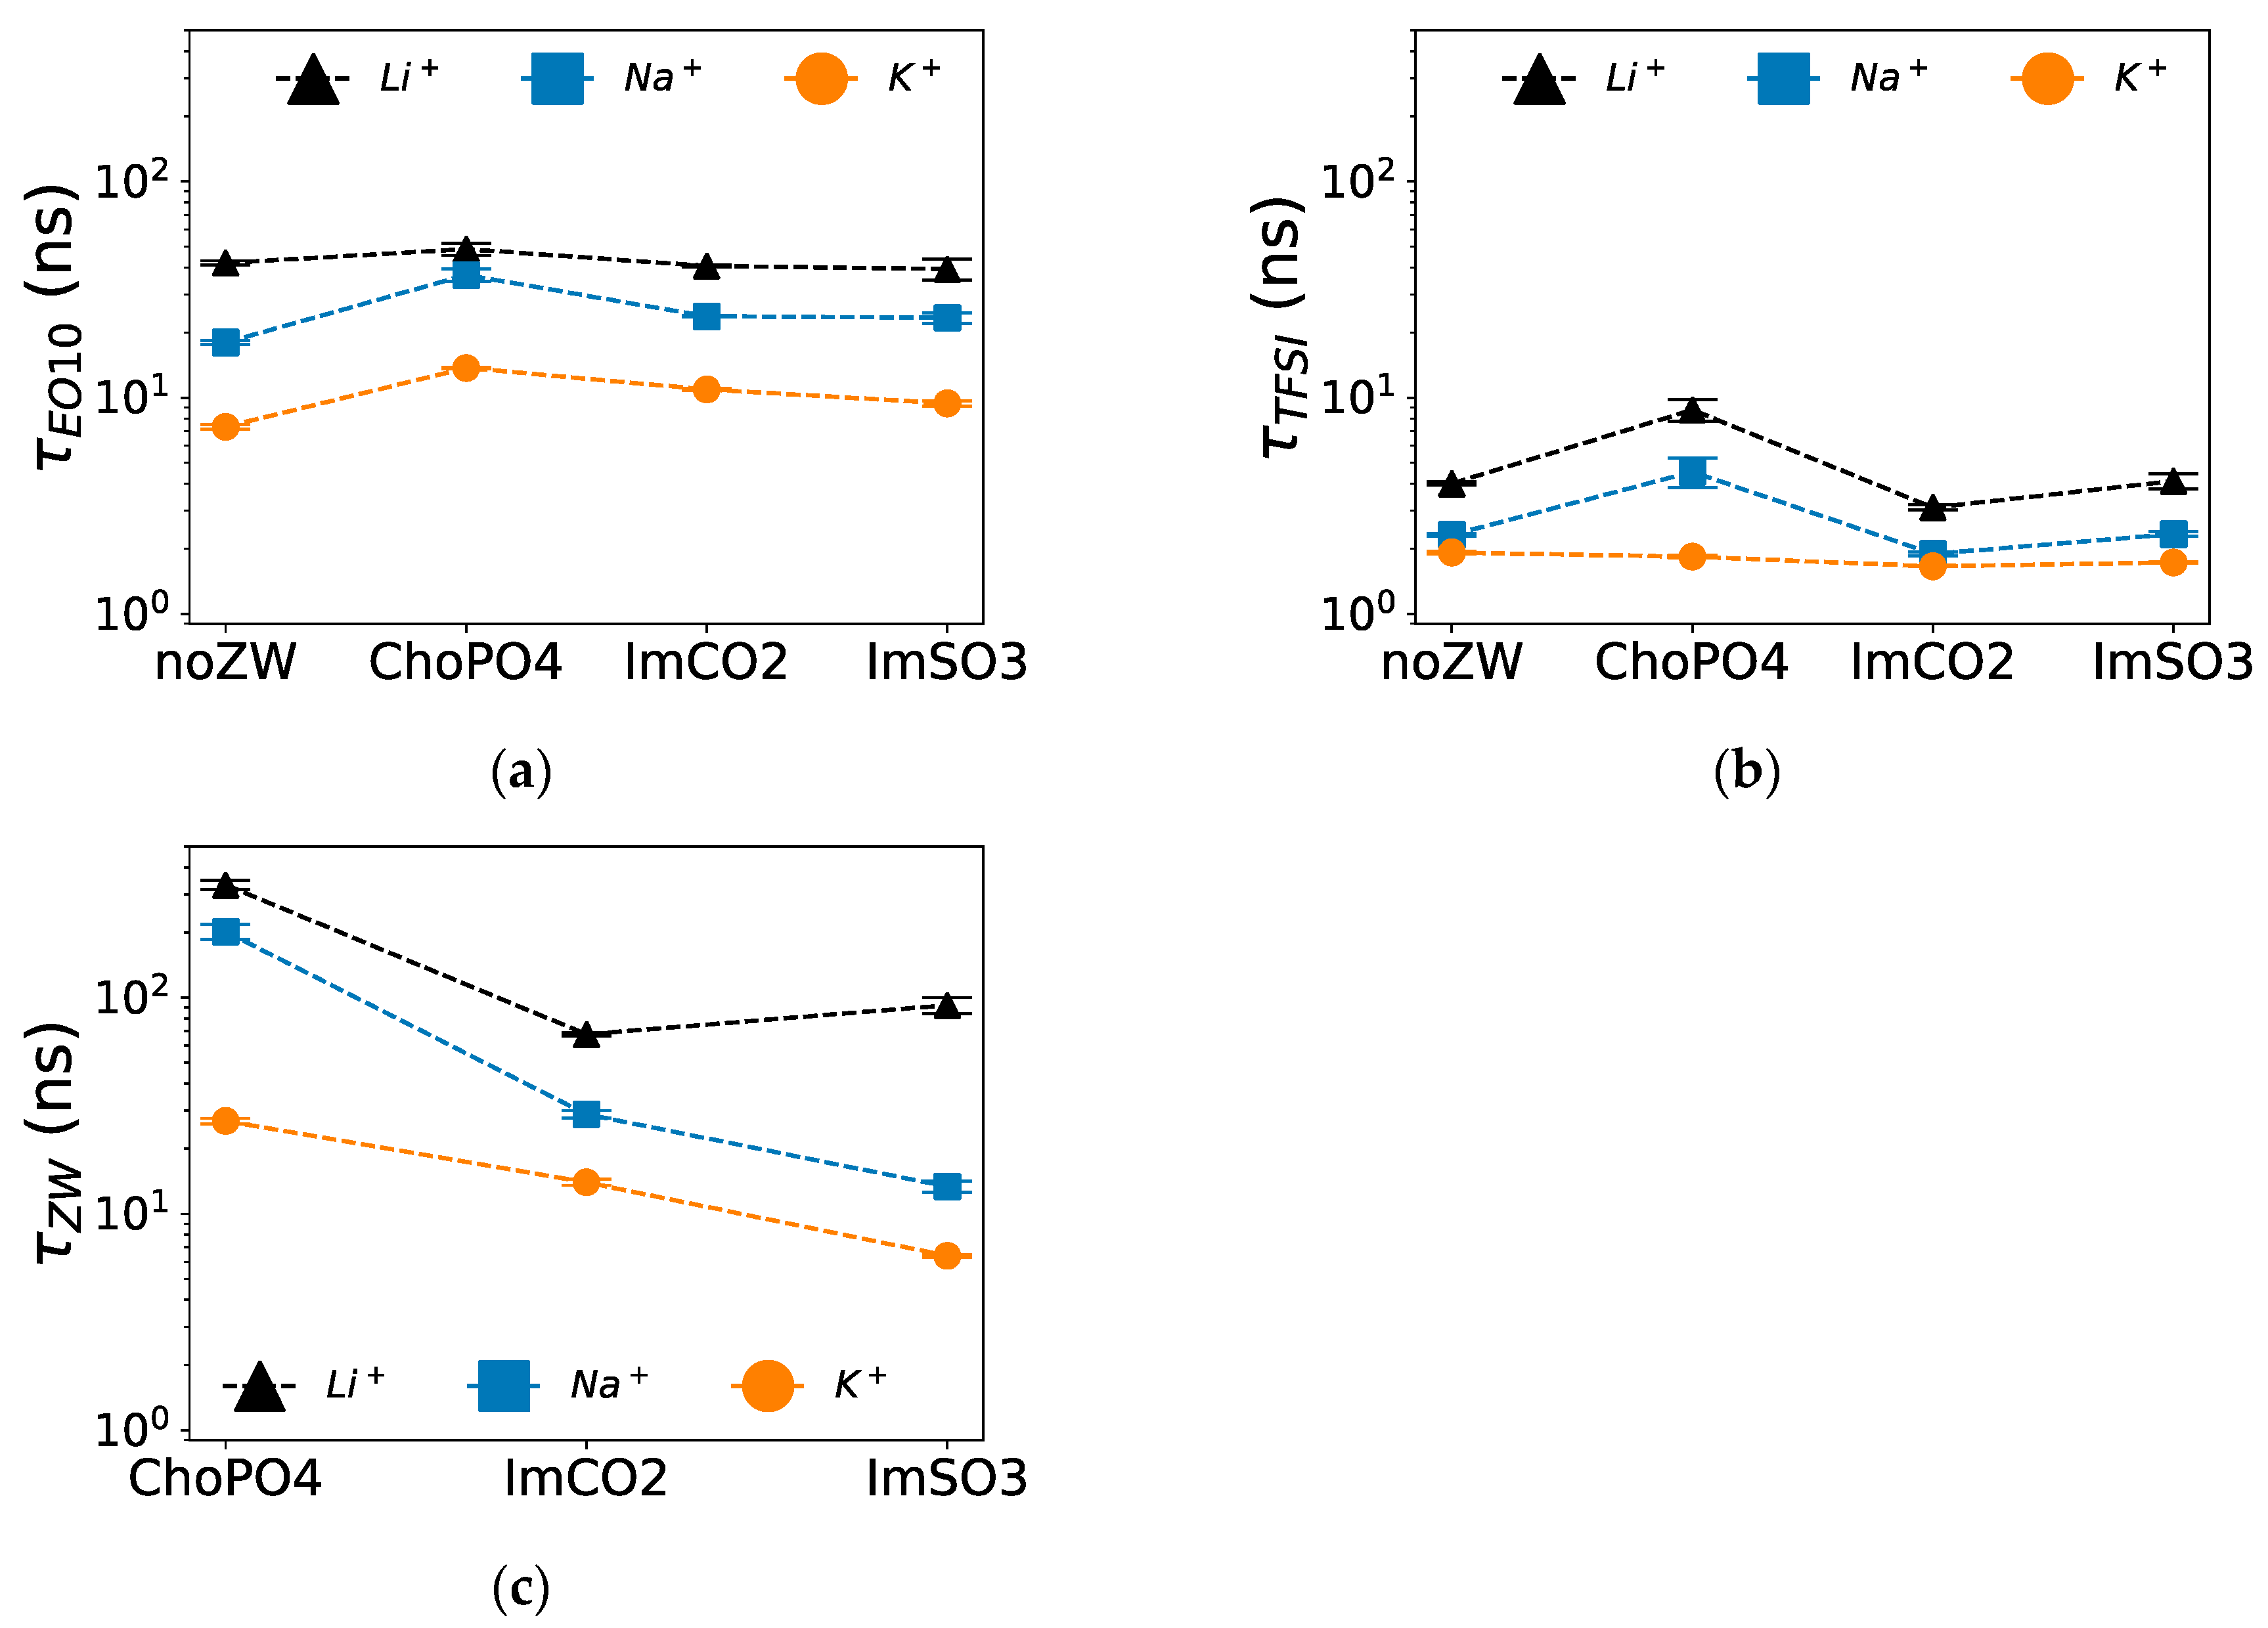
Among the three examined ZW molecules, ChoPO4 caused the highest increase in the stability of Na
+–O(EO
10) and Na
+–O([TFSI]
−) coordination in Na
+ electrolytes. As shown in
Figure 6a, ChoPO4 increased τ
Na+–O(EO10) from 18 ns to around 37 ns, whereas τ
Na+–O(EO10) was around 23 ns when ImCO2 and ImSO3 were added. Likewise,
Figure 6b shows that the presence of ChoPO4 resulted in an increase in τ
Na+–O(TFSI-) from 2 ns to around 5 ns, whereas τ
Na+–O([TFSI]−) remained constant around 2 ns with ImCO2 and ImSO3 addition. Such trend was also observed in Li
+ electrolytes [
24]. Since τ
Na+–O([TFSI]−) was more than one order of magnitude lower than τ
Na+–O(EO10) and τ
Na+–O(ZW), the increase in τ
Na+–O([TFSI]−) might not have significantly affected Na
+ mobility compared to the enhanced stability of Na
+–O(EO
10) coordination.
Similarly, among the three ZW molecules, ChoPO4 enhanced the stability of K
+–O(EO
10) coordination the most.
Figure 6a shows that τ
K+–O(EO10) increased from 7 ns to around 14 ns with ChoPO4 and to around 10 ns with ImCO2 and ImSO3 addition. However, the three ZW molecules had no effect on the stability of K
+–O([TFSI]
−) coordination.
Figure 6b shows that τ
K+–O(TFSI-) remained around 2 ns in the presence of the ZW compounds. The increase in the stability of cation–O(EO
10) coordination might have reduced cationic diffusion, as cations were affected by the slow dynamics of the EO chains.
Among the three ZW structures, cations established the most stable coordination with ChoPO4 and the least stable coordination with ImSO3.
Figure 6c shows that τ
cation–O(ZW) was ranked in the order ChoPO4 > ImCO2 > ImSO3, reflecting the cation–ZW molecule coordination numbers. The lifetime of cation–O(ZW) coordination followed the same trend in K
+ electrolytes. However, the lifetime of K
+–O(ZW) coordination was lower than that of Na
+–O(ZW) coordination. Our previous study [
24] in Li
+ showed higher cation–O(ZW) coordination lifetimes than in Na
+. The decrease in cation–ZW molecule lifetime with increased cationic size correlated with the weakened preference of the cation to coordinate with ZW molecules. The reduced cation–O interaction lifetime for K
+ compared to Na
+ agrees with the literature [
44] and can be attributed to the weaker cation–O interactions.
Except for ImSO3, cation–O(ZW) coordination was more stable than cation–O(EO10) and cation–O([TFSI]−) coordination. For instance, in Na+ electrolytes, τNa+–O(ChoPO4) was 202 ns, whereas τNa+–O(EO10) and τNa+–O(TFSI) were 37 ns and 5 ns, respectively. Similarly, τNa+–O(ImCO2) was 29 ns in Na+ electrolytes, exceeding τNa+–O(EO10) (24 ns) and τNa+–O(TFSI) (2 ns). However, cation–O(ImSO3) coordination was less stable than cation–O(EO10) coordination. For example, in Na+ electrolytes, τNa+–O(ImSO3) was 13 ns, which was lower than τNa+–O(EO10) of 37 ns. The same phenomenon was observed for K+ electrolyte. However, for all ZW molecules, Li+–O(ZW) showed higher stability compared to Li+–O([TFSI]−) and Li+–O(EO10) in Li+ electrolytes. The low Na+/K+–O(ImSO3) lifetime is related to the general decrease in cation–O(ZW) lifetime as the cationic size increases. Due to the larger molecular size of ZW structures compared to cations, the introduction of a stable cation–ZW molecule coordination can slow down cation diffusion. Thus, the reduction in cation–O(ZW) lifetime might lessen this slowing effect on the diffusion dynamics of large cations.
3.5. Diffusion Coefficients
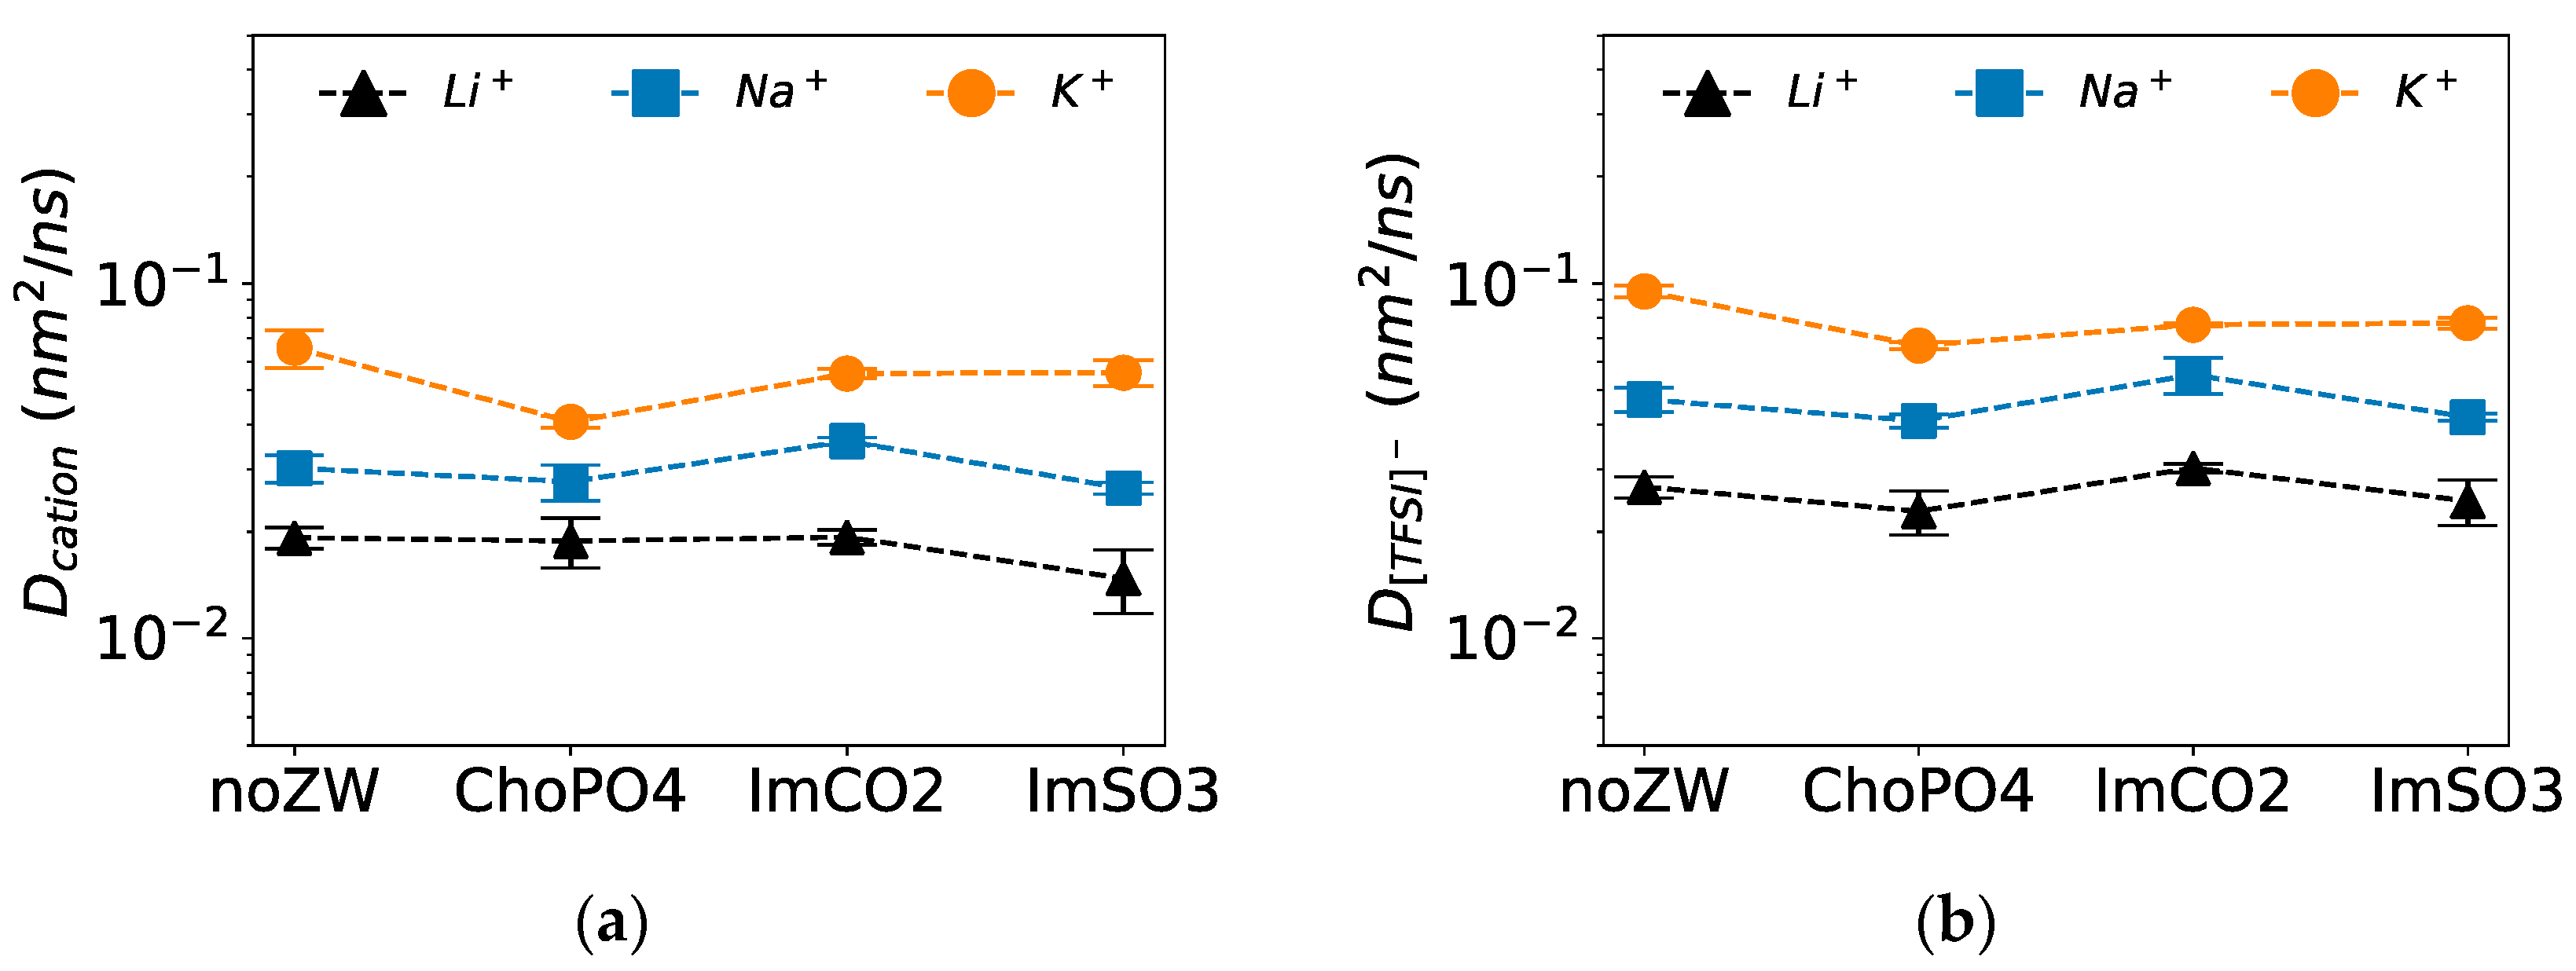
Among the three examined ZW molecules, only ImCO2 enhanced the diffusion of Na
+, while ChoPO4 and ImSO3 had a minimal effect on Na
+ diffusion.
Figure 7a shows that ImCO2 slightly increased the diffusion of Na
+ by 20%, whereas ChoPO4 and ImSO3 slightly decreased Na
+ diffusion by less than 10%. The greater diffusion enhancement by ImCO2 might be related to its better ability to release Na
+ from EO
10 compared to ImSO3 (
Figure 4) and to weaken Na
+–O(ImCO2) stability more than Na
+–O(ChoPO4) stability (
Figure 6c). Obviously, ImCO2 enhanced Na
+ diffusion more effectively than ImSO3 due to the absence of a strong Na
+ trap associated with Na
+–ImCO2 coordination, as observed for ChoPO4.
Although all three ZW molecules reduced K
+ diffusion, ChoPO4 had the greatest impact. As shown in
Figure 7a, ChoPO4, ImSO3, and ImCO2 decreased K
+ diffusion by 40%, 15%, and 15%, respectively. The highest reduction by ChoPO4 might be due to the higher K
+–O(ChoPO4) coordination stability in comparison to the stability of the coordination between K
+ and the other two ZW molecules (
Figure 6). Previous research [
23,
24] highlighted the balance between two opposing effects of ZW molecules on Li
+ diffusion: an enhancement due to the dissociation of Li
+–O(EO) coordination and a deceleration due to the formation of stable Li
+–O(ZW) coordination. We speculate that the decrease in the dissociation effect of ChoPO4 strengthened the diffusion-slowing effect, given the high cation–O(ChoPO4) stability. Consequently, ChoPO4 had the strongest impact on slowing K
+ diffusion. Since ImCO2 and ImSO3 exhibited minimal changes in their cation–O(EO
10) releasing ability with respect to Li
+ and Na
+, the weakened stability of the cation–ImCO2/ImSO3 coordination lessened their diffusion-slowing effect, leading to increased Na
+ diffusion, in contrast to unvaried Li
+, diffusion in the presence of ImCO2. Likewise, ImSO3 reducing effect on cationic diffusion was milder for Na
+ (−10%) compared to Li
+ (−25%). However, due to the weakening of the ZW molecules’ dissociation effect on the K
+–O(EO
10) coordination number (
Table 2 and
Table 3) and the enhancing of K
+–O(EO
10) stability (
Figure 8a), both ImCO2 and ImSO3 decreased K
+ diffusion.
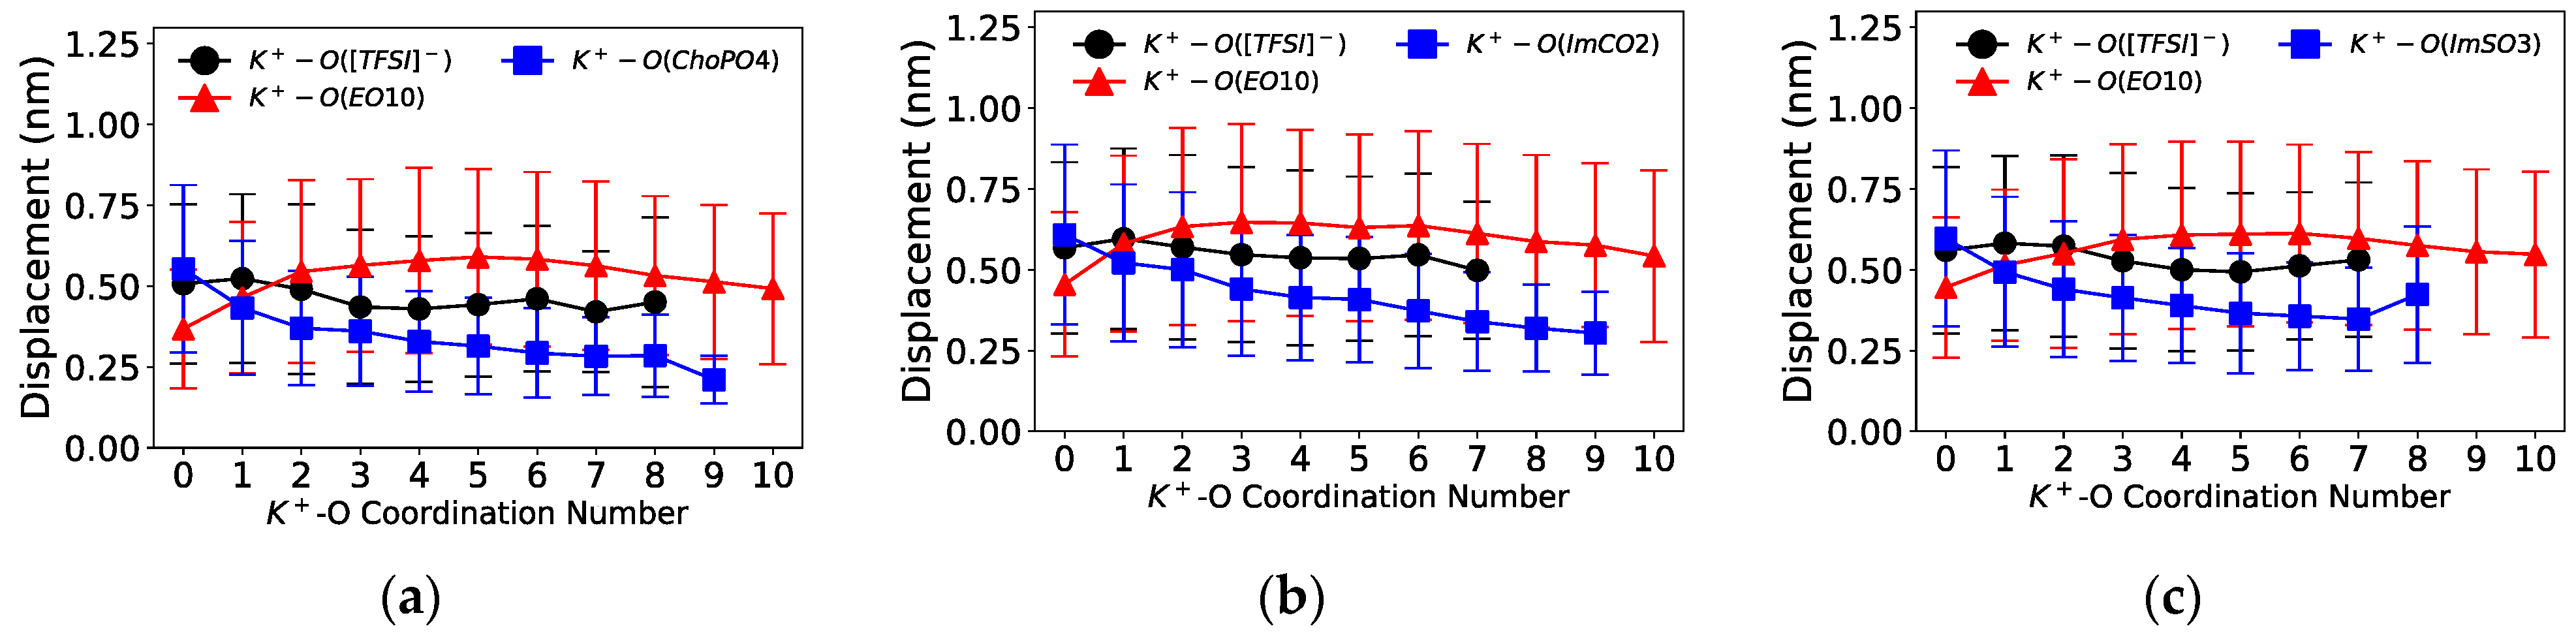
As ZW molecules released cations from coordinated EO
10 by forming the more preferred cation–ZW molecule coordination, we investigated the impact of this change in cationic coordination on the short-scale diffusion of cations.
Figure 8 and
Figure 9 illustrate the displacement of cations as a function of the cation–O coordination number (O from [TFSI]
−, EO
10, and ZW molecules) in Na
+ and K
+ electrolytes, respectively.
The coordination of cations with the ZW molecules slowed down the cation mobility.
Figure 8 shows that the displacement distance of Na
+ notably decreased upon its coordination with one O from the ZW molecules (Na
+–O(ZW) coordination number equaling 1). Additionally, Na
+ exhibited a decrease in short-scale motion with enhanced coordination with ZW molecules or [TFSI]
− compared to coordination with EO
10. Similarly, the displacement of K
+ also decreased with increasing K
+–ZW coordination, as shown in
Figure 9. Such phenomenon was likewise present in Li
+ electrolytes [
24]. This phenomenon also indicated that the introduction of ZW molecules hindered the vehicular movement of cations, as stable cation–ZW molecule interactions decelerated cation mobility. The aggregation of cations caused by ZW molecules might have also contributed to the decrease in cation transport. Similarly, Molinari et al. [
46] reported that the clustering of Li
+ and [TFSI]
− was associated with shorter displacements of Li
+ in a LiTFSI/EO
100 system at 4 M Li
+ concentration. Meanwhile, ZW molecules might be beneficial for the cation hopping mechanism, which necessitates the transition between coordination sites and can be induced by the dissociation effect of ZW molecules.
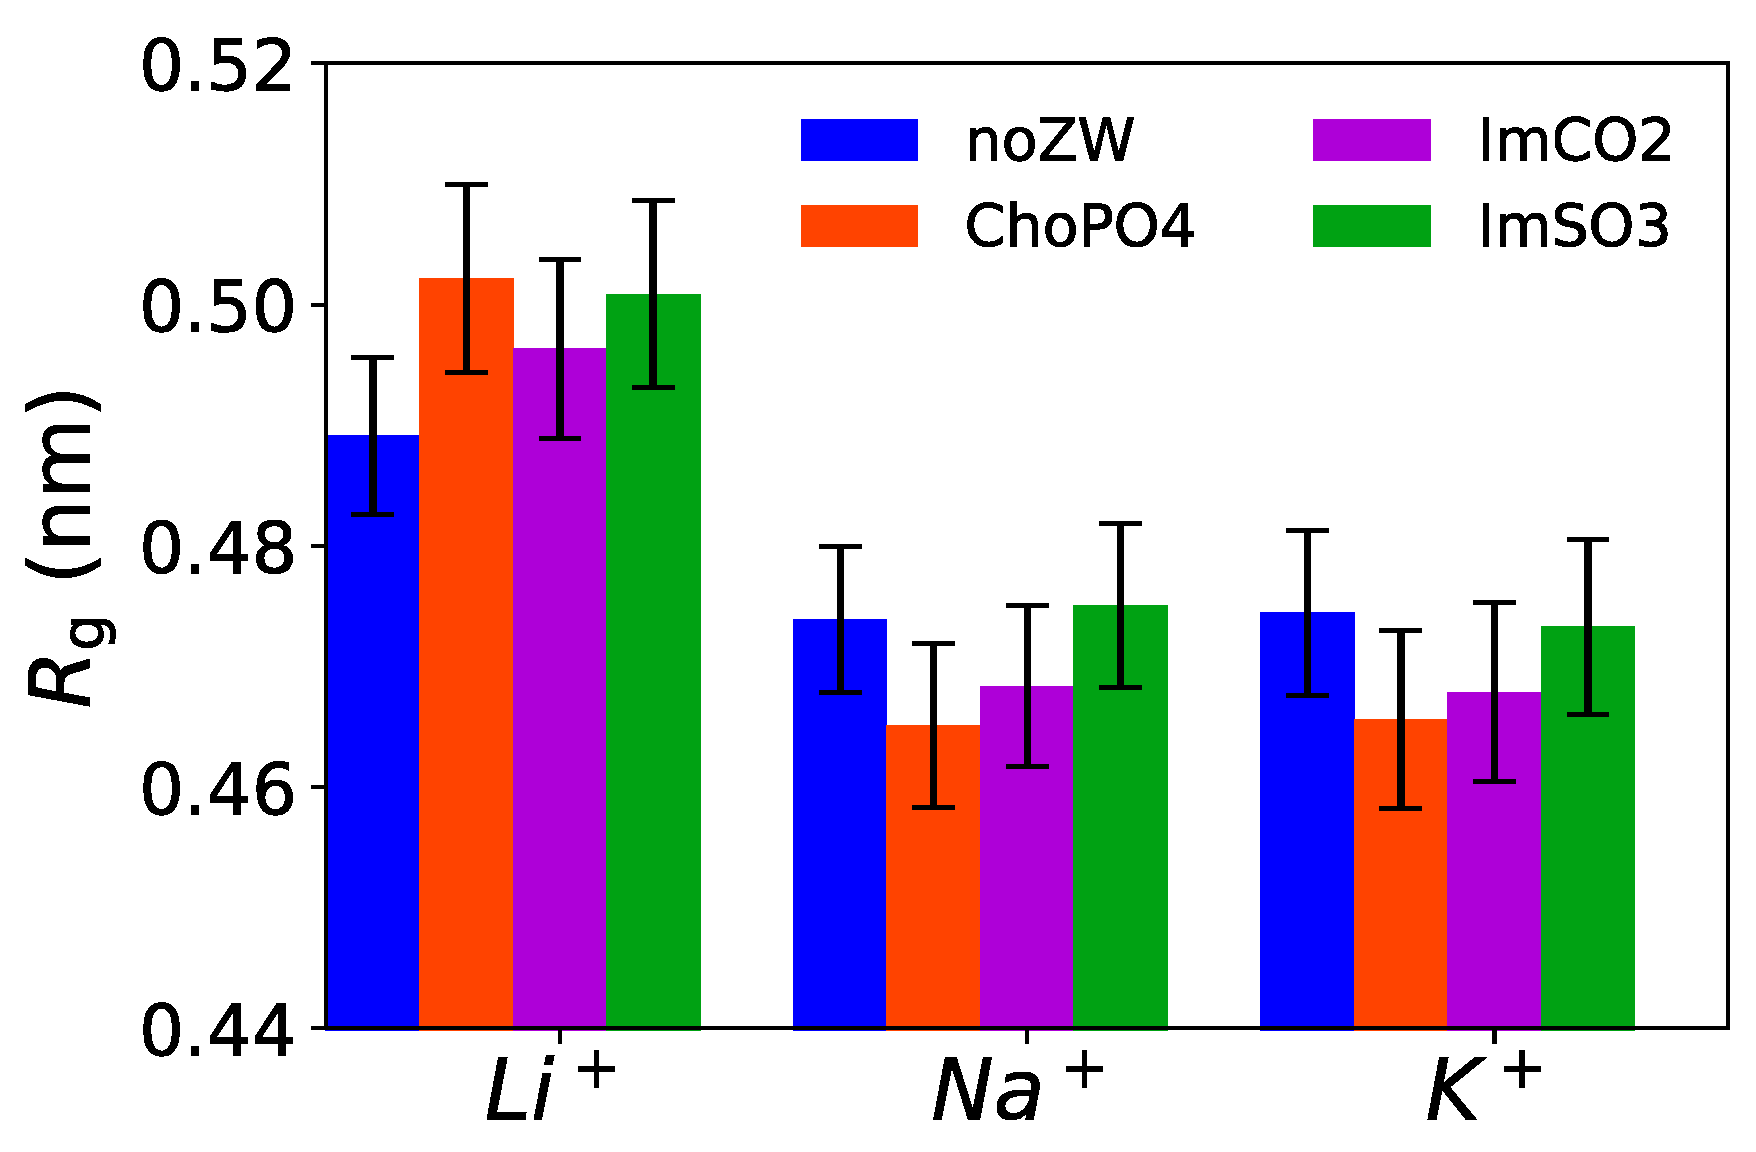
3.6. Radius of Gyration of EO10
ChoPO4 and ImCO2 molecules can enhance the coiling of EO
10 chains. Here, we analyzed the EO
10 conformation using the radius of gyration (
Rg), a measure of the average coil size of EO
10 chains.
Figure 10 shows that the
Rg of the EO
10 chains decreased slightly due to the addition of ChoPO4 and ImCO2 structures in both Na
+ and K
+ cationic systems. The lower
Rg aligned with the higher percentage of Na
+ ions dissociated from the coordination with the EO
10 chains (
Figure 4). The same phenomenon was also present in K
+ systems. However, ZW molecules had an opposite effect in Li
+ systems. Our previous study [
24] showed that the addition of ZW molecules relaxed the EO chain coiling in Li
+ electrolytes. The ZW molecules reduced the wrapping of the EO
10 chains around Li
+, resulting in an increase in the
Rg of the EO
10 chains. However, given the larger ionic size of Na
+ and K
+, there might be a competition between the EO
10 chains for the coordination of Na
+/K
+ cations. Each Na
+/K
+ cation can coordinate with approximately seven O atoms. On average, our systems had six O(EO
10) atoms available for each cation. Thus, there were some EO
10 chains that did not completely coil around the cations. By releasing certain cations from the wrapping of EO
10, the remaining EO
10 chains would have a greater possibility to coordinate with the cations, which would lead to more tightly coiled chains. Hence, ZW molecules could potentially influence the cationic transport dynamics in PEO electrolytes by altering the conformation of the PEO chains. The
Rg distribution for the EO
10 chains is shown in
Figure S16.
3.7. Cationic Charge Density
Table 5 lists the ionic radius and surface charge density of cations (Li
+, Na
+, K
+) and Pauling electronegativity of Li, Na, and K elements. As the cation size increases from Li
+ to K
+, the surface charge density decreases, leading to a weaker cation–O(ZW) coordination. Likewise, the decrease in Pauling electronegativity agrees with the reduced ability of cations to interact with O atoms from anions, ZW molecules, and (EO)
10 molecules. The weakened cation–O interactions observed for Li
+ to K
+ is consistent with the literature. Okoshi et al. [
47] conducted density functional theory (DFT) calculations, revealing a diminishing interaction energy (desolvation energy) with 27 organic solvents as the cationic size increased, following the order Li
+ > Na
+ > K
+, aligning with the Lewis acidity of the respective cations. Similarly, Pham et al. conducted simulation studies on Li
+, Na
+, and K
+ solvation in ethylene carbonate, establishing the order of solvation energies Li
+ > Na
+ > K
+ (5.85, 4.72, and 4.12 eV, respectively) [
45]. Additionally, Wróbel et al. reported analogous results, highlighting lower binding energies for Na
+ to the carbonate molecule compared to Li
+ [
43]. This weaker interaction of Na
+ with solvents compared to Li
+ is consistent with a comprehensive theorical–experimental study by Creasce et al. [
48].
In our study, weaker interactions were reflected in the decrease in cation–O(ZW) RDF peak heights and stability (
Figure 3 and
Figure 6). Likewise, the dissociation effect of the ZW molecules weakened in relation to the cation–O(EO)
10 coordination (
Table 2 and
Table 3). ChoPO4 particularly showed the lowest ability to fully release cations from coordination with EO
10 due to Na
+/K
+ preference for single O atom coordination over coordination of multiple O atoms from ZW molecules (
Figure 5). Meanwhile, the weakening of cation–O(ZW) coordination stability lessened the decelerating effect of the ZW molecules on cationic diffusion. As demonstrated in
Figure 7, ImCO2 enhanced Na
+ diffusion by 20%, and ImSO3 had a milder impact on Na
+/K
+ diffusion compared to Li
+ diffusion.
3.8. Effect of the Simulation Temperature
To explore the effect of the simulation temperature on cation diffusion, we performed similar MD simulation analyses at T = 600 K. We demonstrated that an increase in temperature from 353 K to 600 K enhanced the mobility of ions and molecules while preserving the solvation structures of Na
+ and K
+. This temperature elevation was essential for the investigation of the dynamics of ions and molecules within a practical simulation timeframe.
Figures S13 and S14 and Table S7 show that ions and molecules exhibited slower dynamics in systems at 353 K compared to those at 600 K (
Figures S2 and S3 and Table S4). For instance, the C(t) curve of the Na
+–O(EO
10) coordination decayed to 80–90% after 500 ns in a system at 353 K (
Figure S13), whereas it decreased to 0% in less than 300 ns at 600 K (
Figure S5). Furthermore,
Table S7 indicates that the diffusion coefficients of Na
+/K
+ at 353 K ranged from 10
−5 to 10
−4 nm
2/ns, which are two orders of magnitude lower than those observed at 600 K (
Table S4). Nevertheless, the ionic solvation of cations at 353 K and 600 K remained comparable.
Tables S5 and S6 show that ChoPO4 exerted the most pronounced influence in reducing the coordination numbers of cation–O([TFSI]
−) and cation–O(EO
10) for systems at 353 K. Moreover,
Figure S15 indicates that the ZW molecules fully released cations from coordination with EO
10 in the order ChoPO4 > ImCO2 > ImSO3 at 353 K. Likewise, at 353 K, the ranking of the RDF peak heights and coordination numbers of cation–O(ZW) followed the order ChoPO4 > ImCO2 > ImSO3. Additionally, the Na
+–Na
+ pairing preference at 353 K was enhanced with the addition of the ZW molecules in the order ChoPO4 > ImCO2 > ImSO3 (
Figure S11). However, differences in the effect of the ZW molecules were observed between systems at 353 K and 600 K. For instance, the K
+–K
+ RDF heights in ChoPO4 presence were comparable to those observed with ImCO2 addition at 353 K (
Figure S11). Additionally, the impact of the ZW molecules on the dissociation of K
+–EO
10 was more significant than that on the dissociation of Na
+–EO
10 (
Figure S15). The elevated temperature improved the ion dynamics, consequently rendering the data of ionic solvation more reliable.


