Article

Thickness-Dependent Evolutions of Surface Reconstruction and Band Structures in Epitaxial β–In2Se3 Thin Films

1
National Laboratory of Solid State Microstructure, School of Physics, Nanjing University, Nanjing 210093, China
2
Collaborative Innovation Center of Advanced Microstructures, Nanjing University, Nanjing 210093, China
3
School of Physics and Electronic Sciences, Changsha University of Science and Technology, Changsha 410114, China
*
Author to whom correspondence should be addressed.
Nanomaterials 2023, 13(9), 1533; https://doi.org/10.3390/nano13091533
Submission received: 9 April 2023 / Revised: 29 April 2023 / Accepted: 29 April 2023 / Published: 3 May 2023
(This article belongs to the Special Issue 2D Semiconductor Nanomaterials and Heterostructures)

Abstract

:
Ferroelectric materials have received great attention in the field of data storage, benefiting from their exotic transport properties. Among these materials, the two-dimensional (2D) In2Se3 has been of particular interest because of its ability to exhibit both in-plane and out-of-plane ferroelectricity. In this article, we realized the molecular beam epitaxial (MBE) growth of β–In2Se3 films on bilayer graphene (BLG) substrates with precisely controlled thickness. Combining in situ scanning tunneling microscopy (STM) and angle-resolved photoemission spectroscopy (ARPES) measurements, we found that the four-monolayer β–In2Se3 is a semiconductor with a (9 × 1) reconstructed superlattice. In contrast, the monolayer β–In2Se3/BLG heterostructure does not show any surface reconstruction due to the interfacial interaction and moiré superlattice, which instead results in a folding Dirac cone at the center of the Brillouin zone. In addition, we found that the band gap of In2Se3 film decreases after potassium doping on its surface, and the valence band maximum also shifts in momentum after surface potassium doping. The successful growth of high-quality β–In2Se3 thin films would be a new platform for studying the 2D ferroelectric heterostructures and devices. The experimental results on the surface reconstruction and band structures also provide important information on the quantum confinement and interfacial effects in the epitaxial β–In2Se3 films.

1. Introduction

In recent decades, the research on ferroelectric materials, which have spontaneous electric polarization, has led to the development of data storage devices [1,2,3,4], such as ferroelectric field effect transistors (FeFETs) and non-volatile memory technology [1,2,5,6,7,8]. However, traditional ferroelectric materials, such as perovskite compounds, usually have only one direction of dipole due to the non-centrosymmetric charge distribution in their crystal, which limits their practical applications [9,10]. As a two-dimensional (2D) van der Waals (vdW) material, In2Se3 is theoretically predicted to exhibit both in-plane and out-of-plane ferroelectricity when in the monolayer (ML) limit [11,12]. On the other hand, 2D vdW materials, such as graphene, have excellent properties, such as ease of mechanical exfoliation and high in-plane carrier mobility, making them suitable for the fabrication of nano-scale devices [13,14]. Many types of 2D materials with novel properties have been fabricated by either mechanical exfoliation or epitaxial growth methods [15,16]. These materials are well-suitable for building heterostructures and magic-angle systems [17,18]; therefore, they have been used to explore novel quantum states, such as topological [19,20] and superconducting phases [21,22]. The excellent properties of 2D heterostructures also provide them great application potentials in electronic devices [23,24,25]. In addition, the band structure of some 2D materials, such as MoSe2 and WSe2, undergoes a layer-dependent transition from a direct to an indirect bandgap semiconductor [26,27], and similar thickness-dependent band evolution has also been observed in the Ⅲ–Ⅵ vdW materials, such as InSe and In2Se3 [28,29,30,31].
Both the lattices of ML α-In2Se3 and β–In2Se3 consist of a five-atomic-layer structure of Se-In-Se-In-Se but showing different stacking orders [32]. The room-temperature ferroelectricity of α–In2Se3 can lead to the characteristic butterfly-like traces of electronic transport curves in the α–In2Se3-based 2D FeFET devices [33,34,35,36,37]. Furthermore, due to the built-in interfacial electric field, the electronic structures of In2Se3-based heterostructures can be modified depending on which side of the ferroelectric layer is in contact with other 2D materials [11]. In addition to its ferroelectric properties, the optoelectronic and thermoelectric properties of 2D In2Se3 also broaden its application potentials in the related fields [38,39,40,41,42]. However, unlike the transition metal dichalcogenides (TMDCs), Ⅲ2–Ⅵ3 compounds usually have complex phase diagrams, including the 2D vdW α and β phases, and the 3D compound γ phase [43], making it difficult to synthesize In2Se3 with precise phase control [35,44,45,46,47,48,49,50,51].
In this article, by using the molecular beam epitaxial (MBE) method with α–In2Se3 and Se shots as the evaporation sources, we realized the growth of pure-phase β–In2Se3 films on bilayer graphene (BLG)-terminated SiC substrate in ML limit. Using in situ scanning tunneling microscopy (STM), we found that the grown ML β–In2Se3/BLG heterostructure shows a moiré superlattice, while the 4 ML β–In2Se3 film shows a (9 × 1) reconstructed superlattice. The ex situ Raman spectra confirmed the pure β phase of the grown In2Se3 films, although the evaporation source materials were in α phase. By combining the in situ X-ray photoemission spectroscopy (XPS) and angle-resolved photoemission spectroscopy (ARPES), we studied the electronic structures of both pristine and potassium-doped β–In2Se3 films. The grown β–In2Se3 films are semi-conductive with an indirect band gap, but the moiré superlattice of ML β–In2Se3/BLG heterostructure induces the Dirac cone folding of BLG substrate. Aside from the energy shifts and gap shrinkage of the band structures, the surface potassium doping on the β–In2Se3 surface also changes the momentum position of valence band maximum (VBM) in reciprocal space.

2. Methods

The growth of In2Se3 films was performed in a combined MBE-STM-ARPES ultra-high vacuum (UHV) system with a base pressure of ~1.5 × 10⁻¹⁰ mbar. The BLG substrates were prepared by flash-annealing 4H-SiC(0001) wafers to 1250 °C for 80 cycles [52,53]. High-purity Se (99.9995%) and α–In2Se3 (99.999%) shots served as the constituents to grow In2Se3 films and were evaporated separately from standard Knudsen cells at 120 °C and 640 °C, respectively. During the growth, the BLG substrate was kept at 300 ℃, and the flux ratio of α–In2Se3 to Se was kept at ~1:8. The growth rate of β–In2Se3 film was ~4 min per ML. The surface morphology was characterized by the in situ reflection high-energy electron diffraction (RHEED) and room-temperature (RT) STM. The RT-STM is a Pan-style one (GC Innovation (Changzhou) Co., Ltd., Changzhou, China), and the tungsten tips for STM measurements were prepared by electrochemical corrosion method. The energy of electron beam for RHEED was set as 15.0 keV. The ex situ Raman scattering spectroscopy was performed with 532 nm laser excitation. The Raman signal was collected using a grating spectrograph and a liquid-nitrogen-cooled charge-coupled device. The sample was mounted in a vacuum chamber during Raman data acquisition. The incident laser was focused on the sample to a micron-sized spot, and the scattered light was detected through Bragg notch filters to access the low-wave-number region. The in situ XPS and ARPES spectra were collected by a DA30 analyzer bought from Scienta Omicron AB, Uppsala, Sweden. The monochromatic X-ray was generated from an Al electrode excitation source (Alα, 1486.7 eV), and the ultraviolet light was generated from a helium lamp (Fermion Instruments (Shanghai) Co., Ltd., China) with a monochromator (He I, 21.218 eV). During the XPS and ARPES measurements, the sample was cooled down to ~8 K by a helium-free close-cycle cryo-manipulator. The potassium doping was conducted in situ by an alkali metal dispenser bought from SAES Getters, S.p.A, Milan, Italy. The heating current of 5.20 A was applied to the potassium dispenser for 40 min for all the surface doping operations. During the potassium doping, the temperature of sample was kept at 8 K, and the doped potassium adatoms are suggested in a disordered arrangement [54].

3. Results and Discussion

3.1. Surface Reconstructions of the Grown In2Se3 Films

Figure 1a shows a ball–stick schematic of the crystalline structure of the ML β–In2Se3/BLG heterostructure. According to our RHEED and ARPES results, the lattice orientation of grown In2Se3 film rotates by ~30° compared to the BLG substrate, as shown in the upper panel of Figure 1a. The stacking order of the five atomic layers of ML β–In2Se3 is shown in the middle and lower panels of Figure 1a. Figure 1b,d includes the RHEED patterns of a BLG substrate and a partially covered sub-ML β–In2Se3 film along the 10 1 ¯ 0 direction of SiC, respectively. The (1 × 1) diffraction stripes of the grown β–In2Se3 film nearly coincide with those of the BLG substrate, while, for the RHEED pattern along the 11 2 ¯ 0 direction shown in Figure 1e, a new set of diffraction stripes (indicated by the blue arrow) from another direction of the β–In2Se3 lattice gradually appeared, which are distinct from the diffraction patterns of the SiC substrate (pointed by the red arrow). The spacing between the (1 × 1) diffraction stripes can be obtained from the intensity distribution curve (yellow dotted line) shown in Figure 1e, from which we can quantitatively determine the in-plane lattice constant of the grown β–In2Se3 film as a = 4.01 ± 0.05 Å. The detailed method of lattice constant estimation is provided in the Supplementary Materials, Part A. The obtained lattice constant is consistent with its bulk counterpart reported in previous studies [41,55], indicating that the grown β–In2Se3 films were almost freestanding with few interfacial strains. Figure 1f,g includes the RHEED patterns of an ML β–In2Se3 film along the two directions. When the film fully covered the substrate, the diffraction patterns of the BLG and SiC became totally invisible. Figure 1h,i includes the RHEED patterns of a 4 ML β–In2Se3 film along the two directions. As the film thickness increases, the diffraction stripes become slightly sharper. From the distinct features of the (1 × 1) patterns of β–In2Se3 along the different directions, we concluded that the lattice orientation of grown β–In2Se3 film rotates by ~30° compared to the BLG lattice. More significantly, in the enlarged RHEED images with enhanced intensity shown in Figure 1j,k, the 4 ML one shows a set of weak peaks between the (1 × 1) diffraction stripes, implying a surface reconstruction, while, for the ML one [Figure 1j], no such weak peaks were observed. The surface reconstruction in 4 ML β–In2Se3 film was further confirmed in the STM measurements.
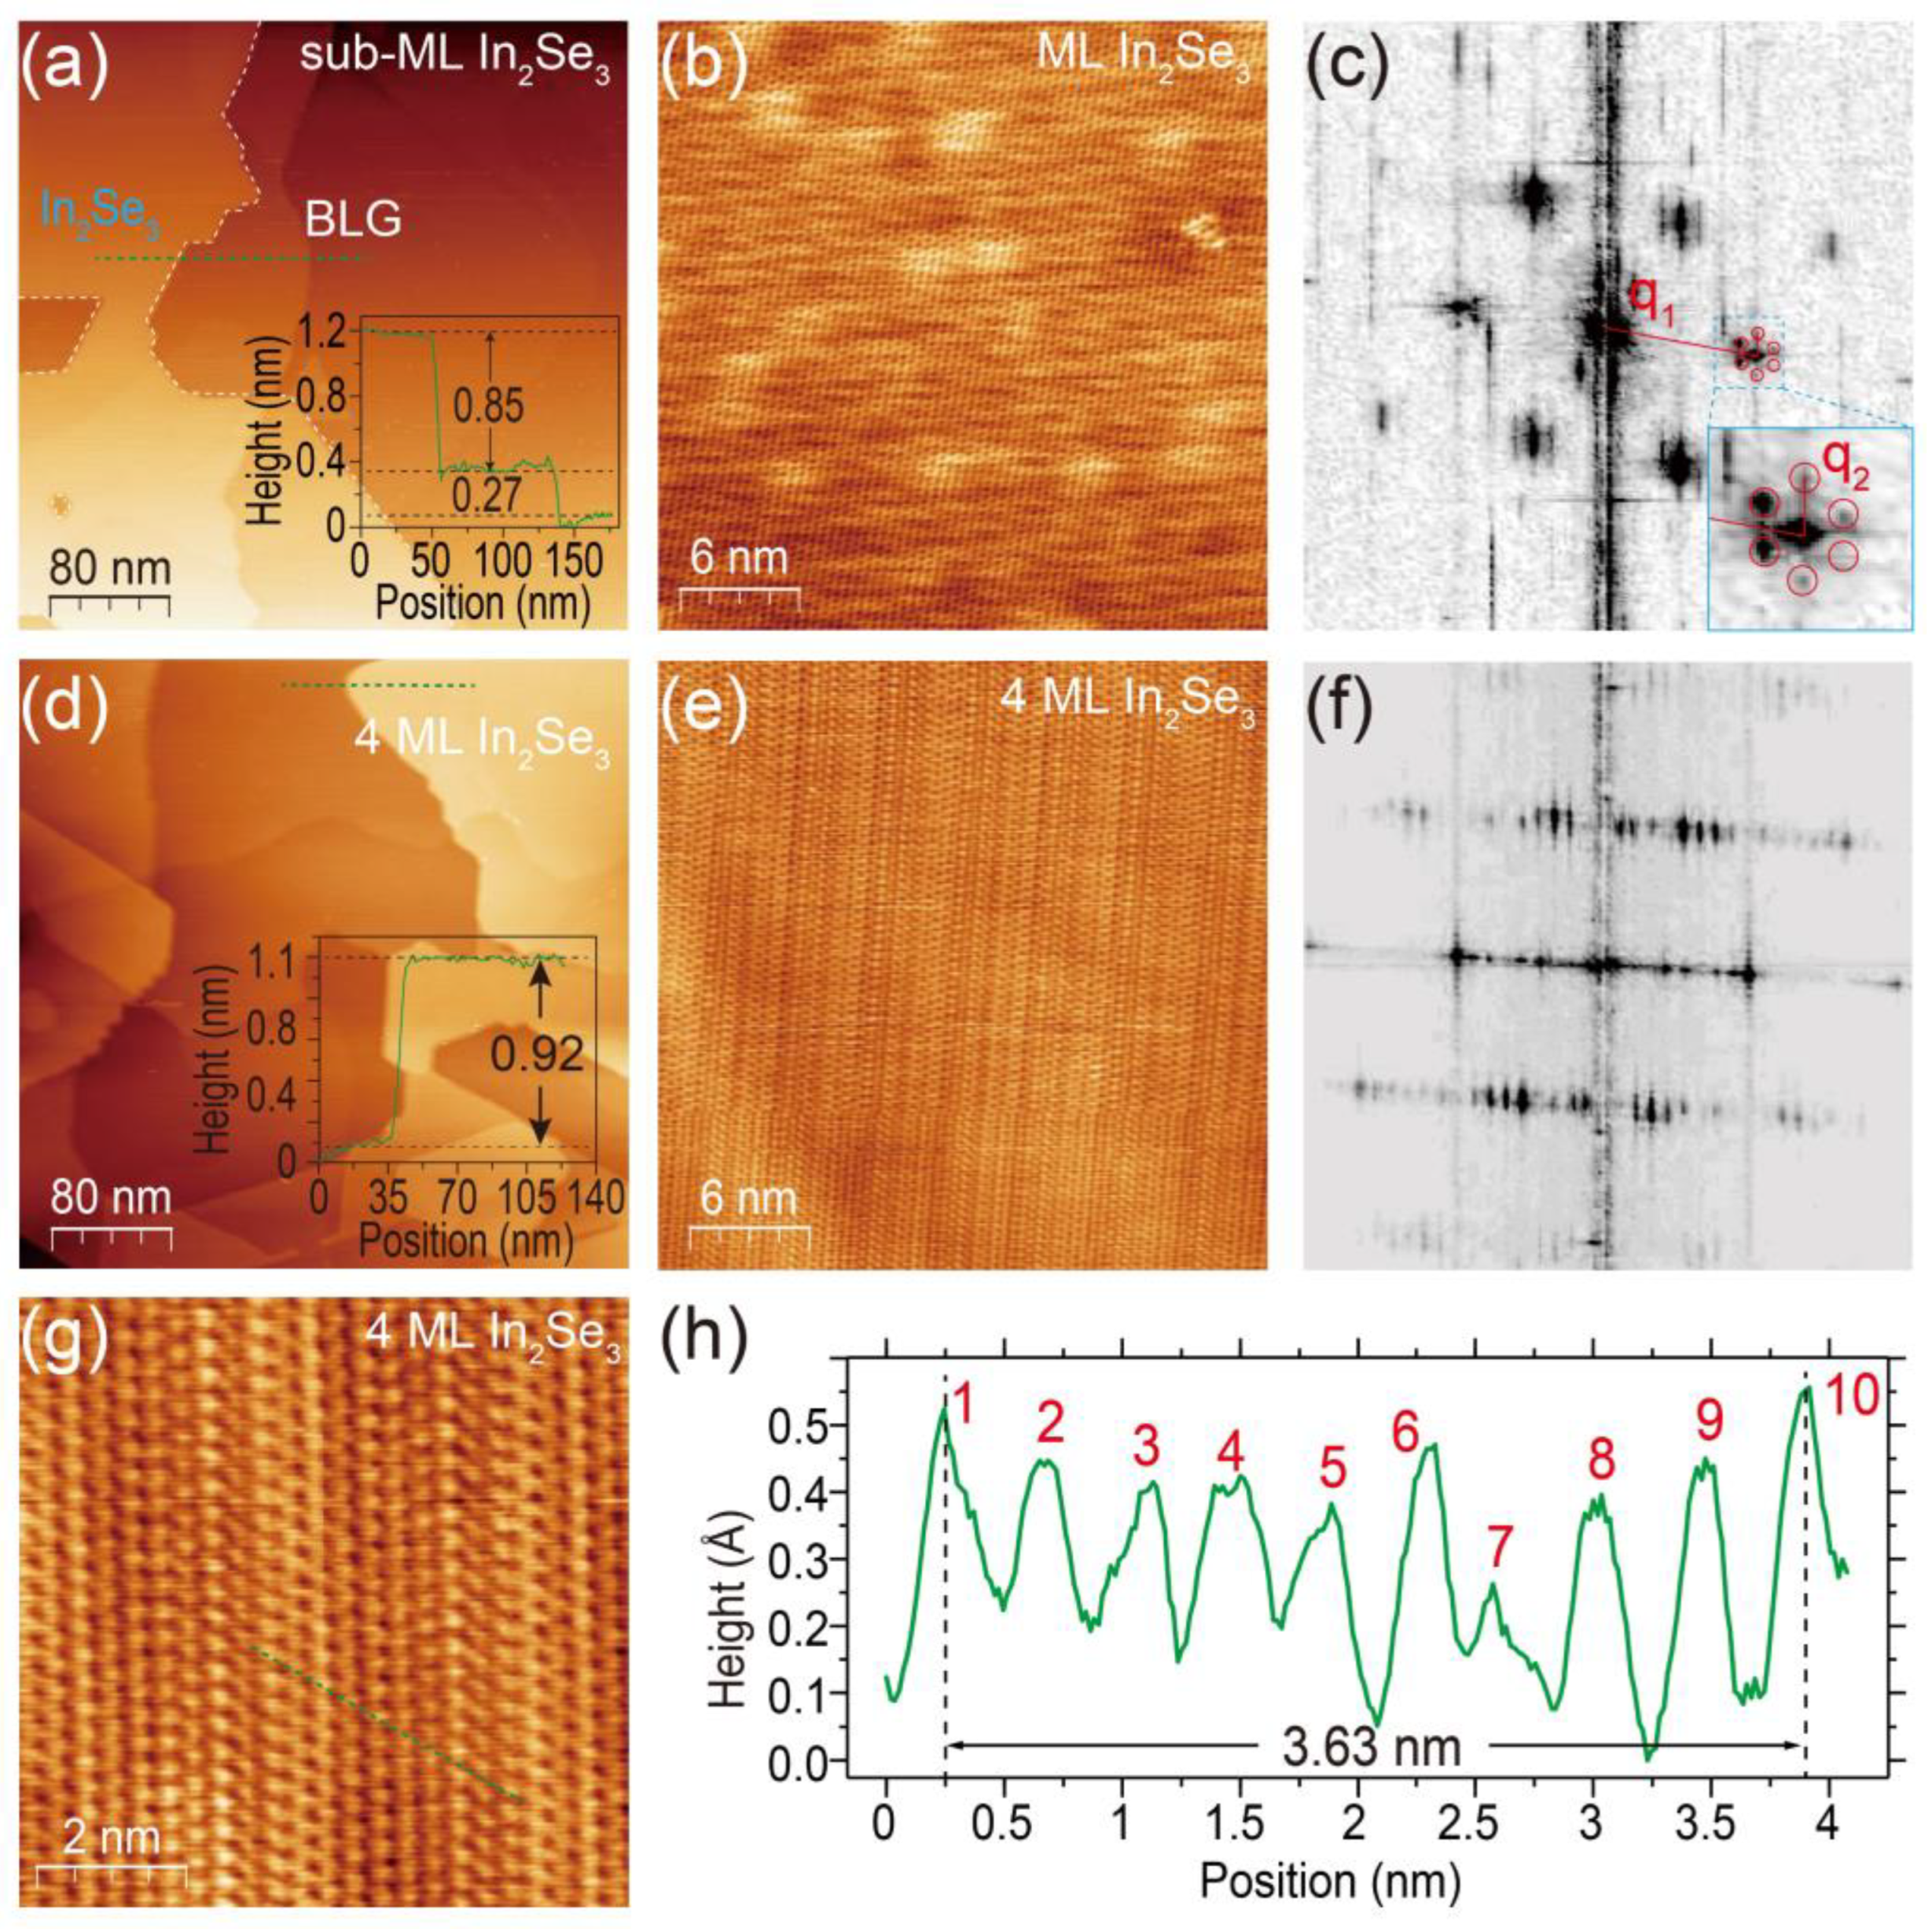
The in situ STM was utilized to investigate the surface topographies and reconstruction of the grown films. In Figure 2a, the STM topography of a sub-ML β–In2Se3 film shows that the height of the ML β–In2Se3 on BLG is ~0.85 nm, and the height of ~0.27 nm represents the characterized step height of SiC substrate. For the 4 ML β–In2Se3 film, the STM image in Figure 2d shows that the height of the top layer β–In2Se3 is ~0.92 nm, which is slightly larger than ~0.85 nm of the first ML β–In2Se3 grown on BLG, implying that the interfacial interaction between β–In2Se3 and graphene layers is slightly stronger than that between β–In2Se3 layers itself. In Figure 2b,c, the atom-resolved STM of ML β–In2Se3 surface and its fast Fourier transform (FFT) images display the hexagonal symmetry of grown β–In2Se3. In addition, the reciprocal vector   q 2 , displayed in the zoom-in inset of Figure 2b is about 1/7 to the (1 × 1) reciprocal vector q 1 , corresponding to the moiré superlattice between ML β–In2Se3 and BLG substrate. In Figure 2e,f, the atom-resolved STM and its FFT images of 4 ML β–In2Se3 exhibit one-dimensional ferroelectric lattice distortions. To further investigate this structure, we present the zoom-in atom-resolved STM image and its height profile in Figure 2g,h, respectively. We found that this one-dimensional reconstruction exhibits a period of nine peaks, referred to as the (9 × 1) reconstruction phase with a periodical length of ~3.63 nm. Previous research has suggested that this phase is induced by the diploe interaction of the in-plane ferroelectricity of β–In2Se3 and can be viewed as a combination of the (4 × 1) and (5 × 1) phases [56,57,58,59]. The (9 × 1) phase is a characteristic reconstruction of the β-phase In2Se3 [58]. Since the one-dimensional distortion on the three-folded rotational symmetric β–In2Se3 lattice will have three equivalent orientations, this (9 × 1) reconstruction only appears as a set of weak peaks in the RHEED pattern shown in Figure 1k. We speculate the disappearance of the (9 × 1) distortion in ML β–In2Se3 may be attributed to generalized Umklapp scattering induced by the graphene-based superlattice since the wave vector of the ML β–In2Se3 is roughly ~ 3 times the graphene one with an in-plane rotation of ~30° [60,61]. This superlattice will induce the moiré Dirac cone and will be discussed later. All the STM images, together with the sharp RHEED patterns, confirm the high quality of our grown films.

3.2. Raman and XPS Characterizations of the Grown β–In2Se3 Films

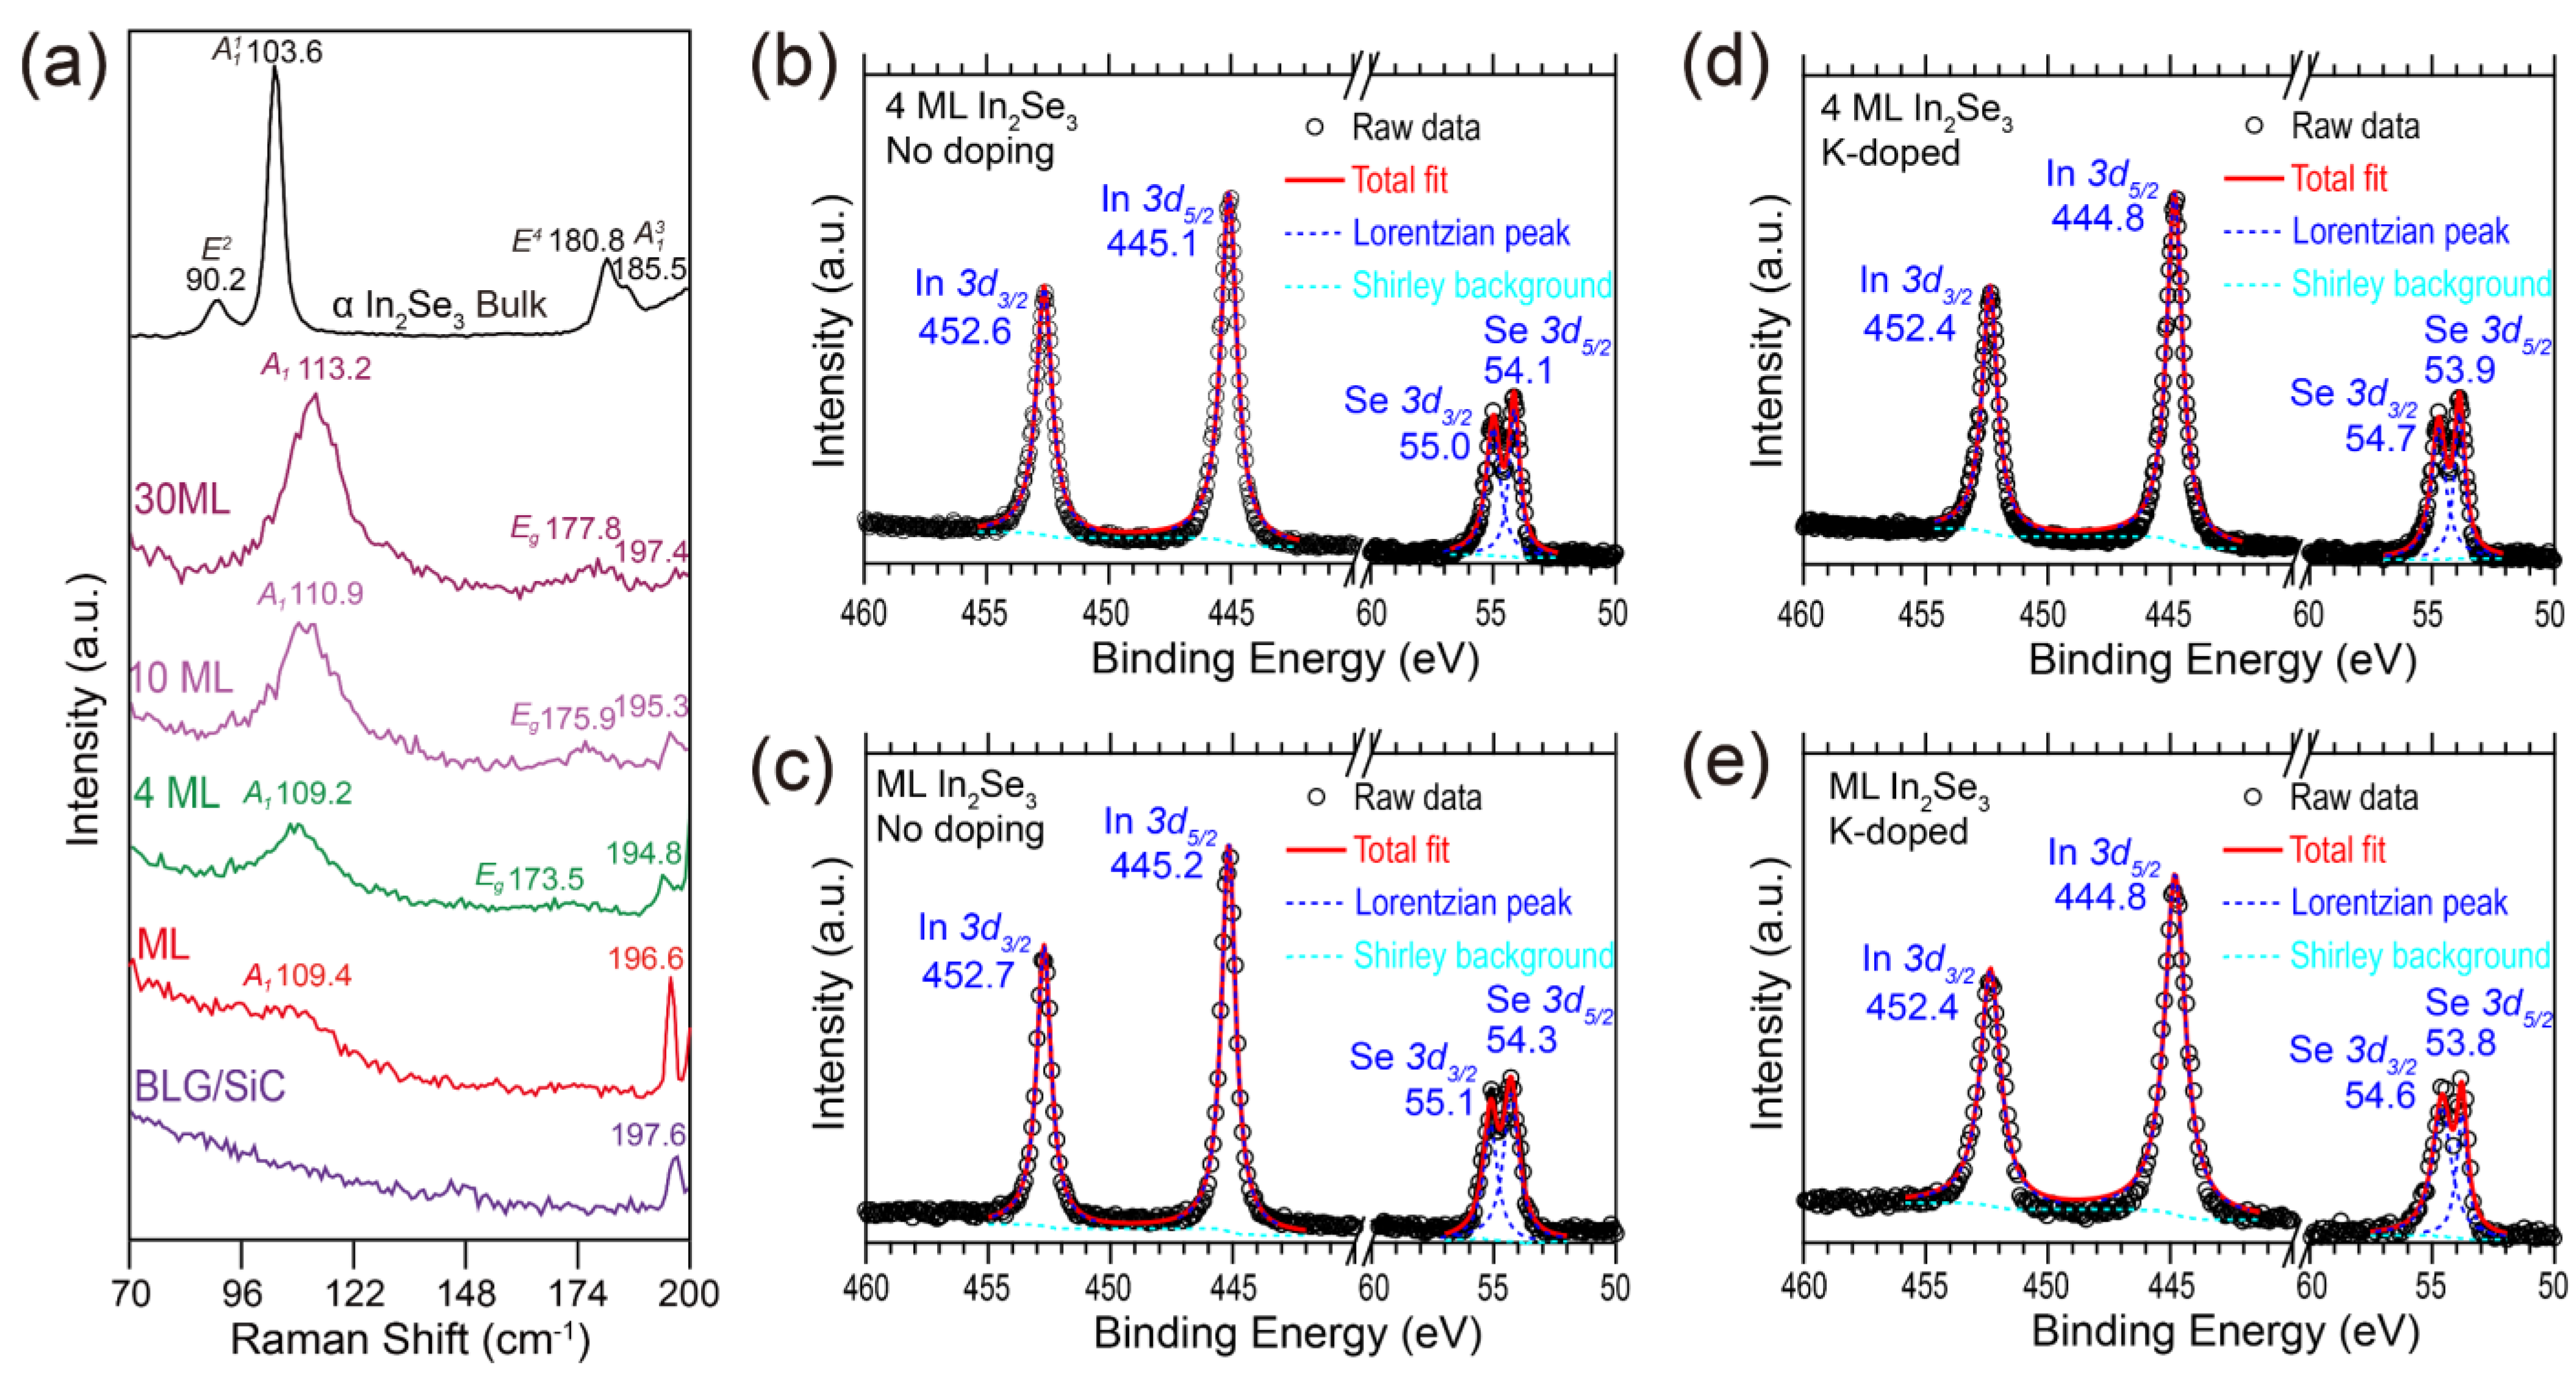
To further evidence the structural phase of the grown In2Se3 films, we conducted the ex situ Raman measurements on the grown β–In2Se3 films and the evaporation source α–In2Se3. The top black line in Figure 3a represents the Raman spectrum of the bulk α–In2Se3 source material, and its characteristic peaks around 90.2, 103.6, 180.8, and 185.5 cm−1 correspond to the E2, A 1 1 , E4, and A 1 3 modes, respectively [62]. For the four curves plotted below, which are the Raman spectra of 30 ML, 10 ML, 4 ML, and ML β–In2Se3 films, the characteristic peaks of α–In2Se3 (E2 mode) were not observed. Instead, the A1 mode around 110 cm−1 and Eg mode between 173.5 and 177.8 cm−1 emerged, indicating the pure β-phase of grown In2Se3 films [39]. In addition, the full-width-at-half-maximum (FWHM) of β–In2Se3 A1 mode is larger than that of α–In2Se3   A 1 1 mode, which is consistent with the previous report [62]. The 197 cm−1 peaks in the Raman spectra were all from the 4H-SiC substrate [63]. The above Raman spectral features are sufficient to confirm that the grown film is in the β phase rather than α phase.
Figure 3b,c shows the XPS spectra around In 3d and Se 3d orbitals for the 4 and 1 ML β–In2Se3 films, respectively. To better obtain the core levels, we completed the multiple Lorentzian peaks fitting on the raw data by using the following multiple Lorentzian peaks fitting equation:
I E b = S E b + i = 1 n A i 1 + E b E i 2 W i 2
while I E b is the intensity of XPS spectrum, E b is the binding energy, S E b is the Shirley background [64,65], n is the number of peaks, A i is the height of each peak, E i is the peak position of each peak, and 2 W i is the FWHM of each peak. The total fitting lines are plotted as the red lines, and each peak is plotted as the blue dashed lines. The core levels of In 3d3/2 (452.6 eV), In 3d5/2 (455.1 eV), Se 3d3/2 (55.0 eV), and Se 3d5/2 (54.1 eV) orbitals of the 4 ML β–In2Se3 film exhibit small redshifts of about 0.1~0.2 eV compared to those of In 3d3/2 (452.7 eV), In 3d5/2 (455.2 eV), Se 3d3/2 (55.1 eV), and Se 3d5/2 (54.3 eV) orbitals in ML β–In2Se3 film. The binding energy shifts are likely due to the charge transfer effect between the BLG substrate and ML β–In2Se3, as indicated by the different energy positions of the VBM between 1 and 4 ML β–In2Se3 in Figure 4. For the XPS spectra of potassium-doped 4 and 1 ML β–In2Se3 films shown in Figure 3b,c, the core levels exhibit redshifts of about 0.3~0.5 eV compared to the pristine β–In2Se3 films. Unfortunately, since the XPS signal of potassium 2p orbital is mixed with the Se Auger line L3M23M45(1P) [66,67] and the amount of potassium dopant is rather small, it is very difficult to distinguish the rather weak potassium signal in the XPS spectra (see Supplementary Materials, Part B).

3.3. Band Structures Evolution of β–In2Se3 Films

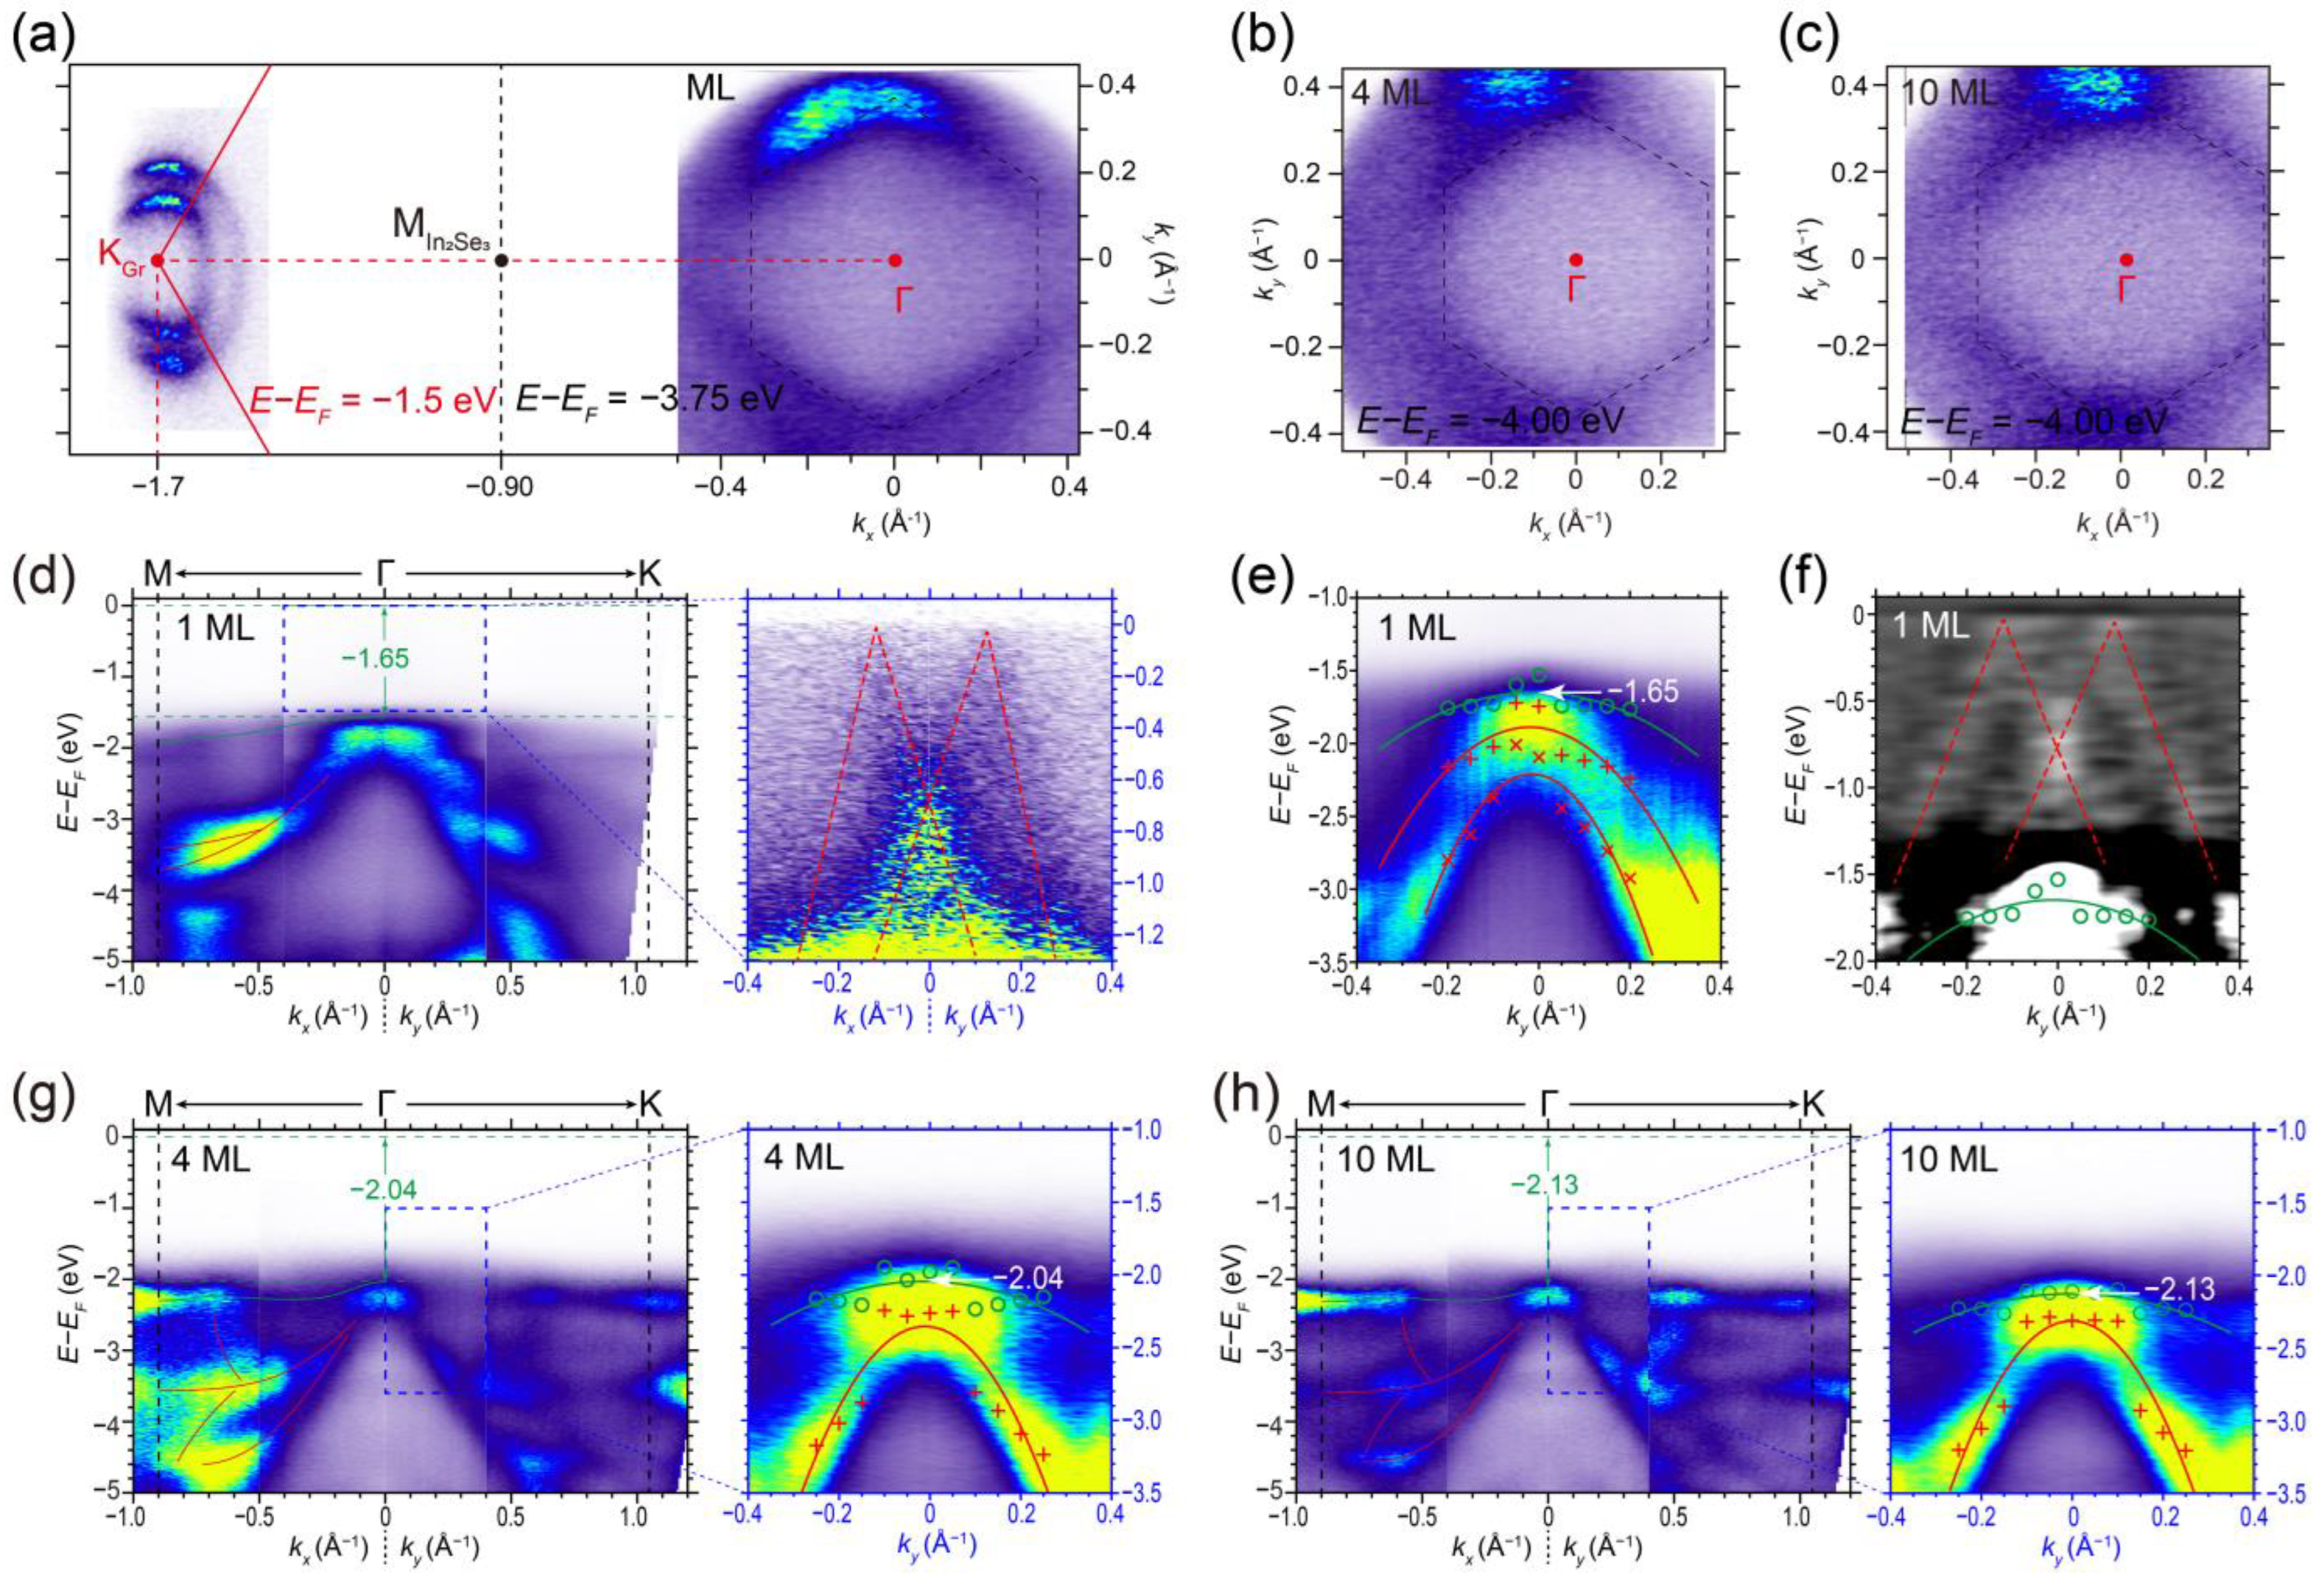
We further investigated the energy band evolution of β–In2Se3 films with increasing thickness and surface doping effect via in situ ARPES. To identify the high symmetry points in reciprocal space, we plotted the constant energy ARPES mapping of the ML β–In2Se3 in Figure 4a. To indicate the 30° relative rotation angle of the BLG substrate and ML β–In2Se3, the mapping energies of them in Figure 4a are various for different momentum positions. The constant energy mapping around the K point of graphene Brillouin zone, taken at EEF = −1.50 eV, shows the characterized Dirac cone pockets of BLG substrate, and the red solid line denotes the Brillouin zone boundary of graphene. The Dirac point of BLG substrate is located at −0.30 eV below Fermi level with no energy shift (Supplementary Materials, Figure S3) [52,68], indicating no-charge doping from the defects of substrate. The mapping taken at EEF = −3.75 eV around the Γ point represents a hole band pocket of ML β–In2Se3 (denoted by the black dashed hexagon). The black dotted line at k = − 0.905 Å−1 represents the β–In2Se3 Brillouin zone boundary. Figure 4b,c includes the constant energy mapping of 4 and 10 ML β–In2Se3 films taken at EEF = −4.00 eV, respectively. The symmetry of the hole band pocket remains unchanged with the increasing thickness of β–In2Se3.
Figure 4d is the energy–momentum ARPES cut of the ML β–In2Se3/BLG along the M-Γ-K direction. The right panel is the zoom-in spectra with enhanced intensity near Fermi level, in which a weak Dirac cone (depicted by the red dashed lines) emerges at Γ point. This weak Dirac cone was not observed in the 4 and 10 ML β–In2Se3 films. The second derivative spectra in Figure 4f imply that this weak Dirac cone at Γ point has the characteristics of epitaxial graphene on SiC [60,69], which can be attributed to the Umklapp scattering in the β–In2Se3/BLG heterostructure [60]. This emergence of renormalized moiré Dirac cones suppresses the formation of (9 × 1) surface reconstruction and makes the ML β–In2Se3/BLG heterostructure a semi-metal, which contrasts with the semiconductive multilayer β–In2Se3 films [Figure 4g,h].
Now, we focus on the valence bands of β–In2Se3 below the scattering-induced Dirac cone. The ML β–In2Se3 ARPES spectra in Figure 4e along with its second-derivative spectra in Figure 4f show that the VBM is located at the Γ point. For the 4 and 10 ML β–In2Se3 films, the momentum position of VBM remains unchanged at the Γ point, as shown in Figure 4g,h. The VBM of ML β–In2Se3 is located at −1.65 eV below the Fermi level. However, the VBMs of the 4 and 10 ML β–In2Se3 are located at −2.04 eV and −2.13 eV, respectively. The higher VBM of ML β–In2Se3 compared to the other multilayer films is due to the charge transfer effect and the moiré superlattice between the β–In2Se3 and BLG substrate. The energy positions of VBM are determined by parabolic fitting of the valence band data, which are extracted from the fitting of the energy distribution curves (EDCs) in Figure S2. The valence band data are plotted as the colored circles/crosses/forks in Figure 4e and the right panels of Figure 4g,h, and the parabolic fitting results are plotted by the colored curves. The detailed method of the VBM determination is provided in the Supplementary Materials, Part D. The deep valence bands ranging from −5.00 eV to −2.50 eV are depicted by the red lines in Figure 4d,g,h, showing distinct features for different thicknesses of β–In2Se3 films.
In order to observe the conduction band of the grown β–In2Se3 films, we doped the film surface by potassium. This doping process can lift the Fermi level upward and allow the conduction band minimum (CBM) to be accessible for ARPES measurements. Figure 5 shows the ARPES spectra of the 1, 4, and 10 ML β–In2Se3 films after potassium doping with the same dosage. Figure 5a–c includes the Fermi surface mappings of 1, 4, and 10 ML β–In2Se3 films with potassium doping, respectively. The hexagonal electron pockets depicted by the green dashed circles are visible around the M point at the Brillouin zone boundary, consistent with the previous experiments on bulk β–In2Se3 [32,55,70]. Additionally, we also found a small pocket (depicted by the black dashed circles) at the Γ point in ML β–In2Se3, which originates from the moiré Dirac cone from ML β–In2Se3/BLG hetero-interface.
Figure 5d–f shows the energy–momentum ARPES spectra of 1, 4, and 10 ML β–In2Se3 films with potassium doping along the M-Γ-K direction, respectively. The zoom-in spectra with enhanced intensity are at the right panels with corresponding colored axis. The moiré Dirac cone at the Γ point can be clearly observed in the zoom-in spectra of ML β–In2Se3 film but disappears for the 4 and 10 ML β–In2Se3 films. The conduction band along the Γ-M direction was found below Fermi level after potassium doping, with the momentum position of the CBM located at the M point of the Brillouin zone (kM = ~0.905 Å−1). The CBM of potassium-doped ML β–In2Se3 film is at −0.38 eV below the Fermi level. For the potassium-doped 4 and 10 ML β–In2Se3 films, the CBMs are located at ~−0.45 eV and −0.48 eV, respectively. The evolution of the conduction band structures with increasing thickness can be more clearly revealed in the second-derivative spectra shown in Figure 5g,i,k. In contrast to the single conduction band observed in 1 and 4 ML β–In2Se3, the conduction band of the 10 ML β–In2Se3 in Figure 5k displays a splitting into two branches (depicted by the orange dashed curves). For the n-type doping bulk situation in a previous report [70], the conduction band also splits into several branches. Here, the 10 ML β–In2Se3 behaves as the bulk situation with split conduction band.
The valence bands of the ML β–In2Se3 show similar behaviors to its conduction bands after potassium doping. In Figure 5d, the VBM of the ML β–In2Se3 film shifts downwards to −1.79 eV, or by 0.14 eV compared to the pristine film. In contrast, for the 4 and 10 ML β–In2Se3 films, the VBM shifts upwards to −1.56 eV and −1.55 eV, respectively. Compared to the pristine films, the VBM shifts upwards by 0.48 eV and 0.58 eV for 4 ML and 10 ML β–In2Se3 films, respectively. This means that the VBM of the multilayer β–In2Se3 films was elevated after potassium doping. Given the energy positions of CBM, the indirect band gap of β–In2Se3 films after potassium doping was estimated to be 1.40 eV, 1.11 eV, and 1.07 eV for the 1, 4, and 10 ML β–In2Se3 films, respectively. This indicates that the band gaps shrink by at least 0.25 eV, 0.93 eV, and 1.06 eV for the 1, 4, and 10 ML β–In2Se3 films, respectively. The shrinkage of bandgap after potassium doping would be the reason for relatively less downshift and even upshift regarding VBM towards the Fermi level by potassium doping.
By comparing ARPES and XPS results on the potassium-doped β–In2Se3 films, we found that the potassium doping leads to different energy shifts of core levels and VBM for different thicknesses. The shifts in core levels are all about 0.3~0.5 eV towards lower binding energy, which is generally consistent with the energy shift of VBM for 4 ML β–In2Se3 films, while, for the ML β–In2Se3 films, the VBM shifts to higher binding energy by 0.14 eV, which is opposite to the shifts of core levels. This difference may be attributed to the interfacial effects of ML β–In2Se3/BLG heterointerface.
In addition to the gap shrinkage caused by potassium doping, the momentum positions of the VBM of 4 and 10 ML β–In2Se3 also shift away from the Γ point after doping. From the enhanced intensity spectra (bottom-right panels of Figure 5d–f) and the second-derivative spectra (Figure 5h,j,l) of 1, 4, and 10 ML β–In2Se3 films, we found that the momentum positions of VBM of 4 and 10 ML β–In2Se3 films shift to kVBM ≈ ±0.35 Å−1 (labeled by the orange arrows). However, the VBM of ML β–In2Se3 remained at the Γ point. This can be attributed to the fact that the bands at different momentum positions in reciprocal space have different responses to the surface doping, as observed in previous reports [27,71]. Although the momentum positions of VBM were moved by potassium doping, the 4 and 10 ML β–In2Se3 films were still indirect semiconductors.

4. Conclusions

In summary, we have successfully realized the MBE growth of β–In2Se3 thin films on BLG substrates by using α–In2Se3 and Se shots serving as the evaporation sources. We found that the lattice orientation of grown β–In2Se3 rotates by ~30° compared to the BLG substrate. The 4 ML In2Se3 film shows a characterized (9 × 1) reconstruction of β–In2Se3, while the ML In2Se3 shows no surface reconstruction due to the interfacial interaction and moiré superlattice between ML β–In2Se3 and BLG substrate. The interfacial moiré modulation results in a folding Dirac cone structure at the Γ point in the ML β–In2Se3/BLG heterostructure. In addition, we found that the band gap of β–In2Se3 films shrinks after potassium doping. For the 4 and 10 ML β–In2Se3 films with potassium doping, the momentum positions of VBM move away from the Γ point along the Γ-M direction. Our work provides inspiration for the synthesis and electronic characterization of the epitaxial In2Se3 films in 2D limit, which would be a new platform for studying the 2D ferroelectric heterostructures and devices. The high quality of the grown films would also provide an ideal platform to fabricate 2D heterostructures; for instance, some interesting 2D materials, such as TMDCs, could be grown on its surface to realize the band engineering of semiconductors, which has been theoretically proposed in a previous study [11]. Additionally, the growth of pure-phase β–In2Se3 films by using α–In2Se3 shots would fulfill the phase diagram of In2Se3 synthesis.

Supplementary Materials

The following supporting information can be downloaded at: https://www.mdpi.com/article/10.3390/nano13091533/s1, lattice constant determined from the RHEED patterns (Figure S1), XPS spectra of potassium dopant (Figure S2), ARPES spectra of BLG substrate (Figure S3) determination of the VBM from ARPES spectra (Figure S4). References [52,66,67,68] are cited in the supplementary materials.

Author Contributions

Conceptualization, Q.M. and Y.Z.; Methodology, Q.M. and Y.Z.; Validation, Q.M. and Y.Z.; Formal Analysis, Q.M. and Y.Z.; Investigation, Q.M., F.Y., G.L., J.Z., Q.T., K.W., X.Q. and C.W.; Data Curation, Q.M., G.L. and Y.Z.; Writing—Original Draft Preparation, Q.M.; Writing—Review and Editing, Y.Z.; Supervision, X.X. and Y.Z.; Project Administration, Y.Z.; Funding Acquisition, Y.Z. All authors have read and agreed to the published version of the manuscript.

Funding

This research was funded by the National Natural Science Foundation of China, grant number 92165205, the National Key Research and Development Program of China, grant number 2018YFA0306800, the Innovation Program for Quantum Science and Technology of China, grant number 2021ZD0302803, the Program of High-Level Entrepreneurial and Innovative Talents Introduction of Jiangsu Province, China. And The APC was funded by the National Natural Science Foundation of China, grant number 92165205.

Data Availability Statement

The data presented in this study are available on request from the corresponding author.

Acknowledgments

We sincerely acknowledge Ziyu Wang and Junwei Liu from The Hong Kong University of Science and Technology for valuable discussions.

Conflicts of Interest

The authors declare no conflict of interest.

References

  1. Scott, J.F. Applications of modern ferroelectrics. Science 2007, 315, 954–959. [Google Scholar] [CrossRef] [PubMed]
  2. Guo, R.; You, L.; Zhou, Y.; Lim, Z.S.; Zou, X.; Chen, L.; Ramesh, R.; Wang, J. Non-volatile memory based on the ferroelectric photovoltaic effect. Nat. Commun. 2013, 4, 1990. [Google Scholar] [CrossRef] [PubMed]
  3. Wen, Z.; Wu, D. Ferroelectric Tunnel Junctions: Modulations on the Potential Barrier. Adv. Mater. 2020, 32, 1904123. [Google Scholar] [CrossRef] [PubMed]
  4. Xu, Y. Ferroelectric Materials and Their Applications; Elsevier: Amsterdam, The Netherlands, 1991. [Google Scholar]
  5. Si, M.; Saha, A.K.; Gao, S.; Qiu, G.; Qin, J.; Duan, Y.; Jian, J.; Niu, C.; Wang, H.; Wu, W.; et al. A ferroelectric semiconductor field-effect transistor. Nat. Electron. 2019, 2, 580–586. [Google Scholar] [CrossRef]
  6. Bez, R.; Pirovano, A. Non-volatile memory technologies: Emerging concepts and new materials. Mater. Sci. Semicond. Process. 2004, 7, 349–355. [Google Scholar] [CrossRef]
  7. Mukherjee, S.; Koren, E. Indium Selenide (In2Se3)—An Emerging Van-der-Waals Material for Photodetection and Non-Volatile Memory Applications. Isr. J. Chem. 2022, 62, e202100112. [Google Scholar] [CrossRef]
  8. Huang, Y.T.; Chen, N.K.; Li, Z.Z.; Wang, X.P.; Sun, H.B.; Zhang, S.; Li, X.B. Two-dimensional In2Se3: A rising advanced material for ferroelectric data storage. InfoMat 2022, 4, e12341. [Google Scholar] [CrossRef]
  9. Cohen, R.E. Origin of Ferroelectricity in Perovskite Oxides. Nature 1992, 358, 136–138. [Google Scholar] [CrossRef]
  10. Nuraje, N.; Su, K. Perovskite ferroelectric nanomaterials. Nanoscale 2013, 5, 8752–8780. [Google Scholar] [CrossRef]
  11. Ding, W.; Zhu, J.; Wang, Z.; Gao, Y.; Xiao, D.; Gu, Y.; Zhang, Z.; Zhu, W. Prediction of intrinsic two-dimensional ferroelectrics in In2Se3 and other III2-VI3 van der Waals materials. Nat. Commun. 2017, 8, 14956. [Google Scholar] [CrossRef]
  12. Li, C.F.; Li, Y.Q.; Tang, Y.S.; Zheng, S.H.; Zhang, J.H.; Zhang, Y.; Lin, L.; Yan, Z.B.; Jiang, X.P.; Liu, J.M. Band structure, ferroelectric instability, and spin–orbital coupling effect of bilayer α–In2Se3. J. Appl. Phys. 2020, 128, 234106. [Google Scholar] [CrossRef]
  13. Novoselov, K.S.; Mishchenko, A.; Carvalho, A.; Castro Neto, A.H. 2D materials and van der Waals heterostructures. Science 2016, 353, aac9439. [Google Scholar] [CrossRef] [PubMed]
  14. Novoselov, K.S.; Geim, A.K.; Morozov, S.V.; Jiang, D.; Zhang, Y.; Dubonos, S.V.; Grigorieva, I.V.; Firsov, A.A. Electric field effect in atomically thin carbon films. Science 2004, 306, 666–669. [Google Scholar] [CrossRef] [PubMed]
  15. Toksumakov, A.N.; Ermolaev, G.A.; Slavich, A.S.; Doroshina, N.V.; Sukhanova, E.V.; Yakubovsky, D.I.; Syuy, A.V.; Novikov, S.M.; Romanov, R.I.; Markeev, A.M.; et al. High-refractive index and mechanically cleavable non-van der Waals InGaS3. NPJ 2D Mater. Appl. 2022, 6, 85. [Google Scholar] [CrossRef]
  16. Chen, W.; Hu, M.; Zong, J.; Xie, X.; Meng, Q.; Yu, F.; Wang, L.; Ren, W.; Chen, A.; Liu, G.; et al. Epitaxial Growth of Single-Phase 1T’-WSe2 Monolayer with Assistance of Enhanced Interface Interaction. Adv. Mater. 2021, 33, 2004930. [Google Scholar] [CrossRef]
  17. Zong, J.; Wang, Z.; Wang, K.; Meng, Q.; Tian, Q.; Qiu, X.; Xie, X.; Zhang, Y.; Jin, S.; Wang, C.; et al. Band structures of molecular beam epitaxially grown MoSe2–WSe2 heterobilayers with different stacking orders on SrTiO3(111) substrate. Appl. Phys. Lett. 2022, 121, 113103. [Google Scholar] [CrossRef]
  18. Cao, Y.; Fatemi, V.; Fang, S.; Watanabe, K.; Taniguchi, T.; Kaxiras, E.; Jarillo-Herrero, P. Unconventional superconductivity in magic-angle graphene superlattices. Nature 2018, 556, 43–50. [Google Scholar] [CrossRef]
  19. Qian, X.F.; Liu, J.W.; Fu, L.; Li, J. Quantum spin Hall effect in two-dimensional transition metal dichalcogenides. Science 2014, 346, 1344–1347. [Google Scholar] [CrossRef]
  20. Hasan, M.Z.; Kane, C.L. Colloquium: Topological insulators. Rev. Mod. Phys. 2010, 82, 3045–3067. [Google Scholar] [CrossRef]
  21. Guillamon, I.; Suderow, H.; Vieira, S.; Cario, L.; Diener, P.; Rodiere, P. Superconducting Density of States and Vortex Cores of 2H-NbS2. Phys. Rev. Lett. 2008, 101, 166407. [Google Scholar] [CrossRef]
  22. Kusmartseva, A.F.; Sipos, B.; Berger, H.; Forro, L.; Tutis, E. Pressure Induced Superconductivity in Pristine 1T-TiSe2. Phys. Rev. Lett. 2009, 103, 236401. [Google Scholar] [CrossRef] [PubMed]
  23. Bolshakov, A.D.; Fedorov, V.V.; Koval, O.Y.; Sapunov, G.A.; Sobolev, M.S.; Pirogov, E.V.; Kirilenko, D.A.; Mozharov, A.M.; Mukhin, I.S. Effective Suppression of Antiphase Domains in GaP(N)/GaP Heterostructures on Si(001). Cryst. Growth Des. 2019, 19, 4510–4520. [Google Scholar] [CrossRef]
  24. Mitin, D.M.; Bolshakov, A.D.; Neplokh, V.; Mozharov, A.M.; Raudik, S.A.; Fedorov, V.V.; Shugurov, K.Y.; Mikhailovskii, V.Y.; Rajanna, P.M.; Fedorov, F.S.; et al. Novel design strategy for GaAs-based solar cell by application of single-walled carbon nanotubes topmost layer. Energy Sci. Eng. 2020, 8, 2938–2945. [Google Scholar] [CrossRef]
  25. Koval, O.Y.; Fedorov, V.V.; Bolshakov, A.D.; Fedina, S.V.; Kochetkov, F.M.; Neplokh, V.; Sapunov, G.A.; Dvoretckaia, L.N.; Kirilenko, D.A.; Shtrom, I.V.; et al. Structural and Optical Properties of Self-Catalyzed Axially Heterostructured GaPN/GaP Nanowires Embedded into a Flexible Silicone Membrane. Nanomaterials 2020, 10, 2110. [Google Scholar] [CrossRef]
  26. Zhang, Y.; Chang, T.R.; Zhou, B.; Cui, Y.T.; Yan, H.; Liu, Z.; Schmitt, F.; Lee, J.; Moore, R.; Chen, Y.; et al. Direct observation of the transition from indirect to direct bandgap in atomically thin epitaxial MoSe2. Nat. Nanotechnol. 2014, 9, 111–115. [Google Scholar] [CrossRef]
  27. Zhang, Y.; Ugeda, M.M.; Jin, C.; Shi, S.F.; Bradley, A.J.; Martin-Recio, A.; Ryu, H.; Kim, J.; Tang, S.; Kim, Y.; et al. Electronic Structure, Surface Doping, and Optical Response in Epitaxial WSe2 Thin Films. Nano Lett. 2016, 16, 2485–2491. [Google Scholar] [CrossRef] [PubMed]
  28. Kibirev, I.A.; Matetskiy, A.V.; Zotov, A.V.; Saranin, A.A. Thickness-dependent transition of the valence band shape from parabolic to Mexican-hat-like in the MBE grown InSe ultrathin films. Appl. Phys. Lett. 2018, 112, 191602. [Google Scholar] [CrossRef]
  29. Hamer, M.J.; Zultak, J.; Tyurnina, A.V.; Zolyomi, V.; Terry, D.; Barinov, A.; Garner, A.; Donoghue, J.; Rooney, A.P.; Kandyba, V.; et al. Indirect to Direct Gap Crossover in Two-Dimensional InSe Revealed by Angle-Resolved Photoemission Spectroscopy. ACS Nano 2019, 13, 2136–2142. [Google Scholar] [CrossRef]
  30. Sang, D.K.; Wang, H.; Qiu, M.; Cao, R.; Guo, Z.; Zhao, J.; Li, Y.; Xiao, Q.; Fan, D.; Zhang, H. Two Dimensional beta-InSe with Layer-Dependent Properties: Band Alignment, Work Function and Optical Properties. Nanomaterials 2019, 9, 82. [Google Scholar] [CrossRef]
  31. Ho, C.-H.; Chen, Y.-C. Thickness-tunable band gap modulation in γ-In2Se3. RSC Adv. 2013, 3, 24896. [Google Scholar] [CrossRef]
  32. Li, W.; Sabino, F.P.; Crasto de Lima, F.; Wang, T.; Miwa, R.H.; Janotti, A. Large disparity between optical and fundamental band gaps in layered In2Se3. Phys. Rev. B 2018, 98, 165134. [Google Scholar] [CrossRef]
  33. Zheng, C.X.; Yu, L.; Zhu, L.; Collins, J.L.; Kim, D.; Lou, Y.D.; Xu, C.; Li, M.; Wei, Z.; Zhang, Y.P.; et al. Room temperature in-plane ferroelectricity in van der Waals In2Se3. Sci. Adv. 2018, 4, eaar7720. [Google Scholar] [CrossRef]
  34. Zhou, Y.; Wu, D.; Zhu, Y.; Cho, Y.; He, Q.; Yang, X.; Herrera, K.; Chu, Z.; Han, Y.; Downer, M.C.; et al. Out-of-Plane Piezoelectricity and Ferroelectricity in Layered alpha-In2Se3 Nanoflakes. Nano Lett. 2017, 17, 5508–5513. [Google Scholar] [CrossRef]
  35. Cui, C.; Hu, W.J.; Yan, X.; Addiego, C.; Gao, W.; Wang, Y.; Wang, Z.; Li, L.; Cheng, Y.; Li, P.; et al. Intercorrelated In-Plane and Out-of-Plane Ferroelectricity in Ultrathin Two-Dimensional Layered Semiconductor In2Se3. Nano Lett. 2018, 18, 1253–1258. [Google Scholar] [CrossRef] [PubMed]
  36. Wan, S.; Li, Y.; Li, W.; Mao, X.; Wang, C.; Chen, C.; Dong, J.; Nie, A.; Xiang, J.; Liu, Z.; et al. Nonvolatile Ferroelectric Memory Effect in Ultrathin α–In2Se3. Adv. Funct. Mater. 2019, 29, 1808606. [Google Scholar] [CrossRef]
  37. Wang, L.; Wang, X.; Zhang, Y.; Li, R.; Ma, T.; Leng, K.; Chen, Z.; Abdelwahab, I.; Loh, K.P. Exploring Ferroelectric Switching in α–In2Se3 for Neuromorphic Computing. Adv. Funct. Mater. 2020, 30, 2004609. [Google Scholar] [CrossRef]
  38. Mohapatra, P.K.; Ranganathan, K.; Dezanashvili, L.; Houben, L.; Ismach, A. Epitaxial growth of In2Se3 on monolayer transition metal dichalcogenide single crystals for high performance photodetectors. Appl. Mater. Today 2020, 20, 100734. [Google Scholar] [CrossRef]
  39. Claro Marcel, S.; Grzonka Justyna, N.N.; Ferreira Paulo, J.; Sadewasser, S. Wafer-Scale Fabrication of 2D β–In2Se3 Photodetectors. Adv. Opt. Mater. 2020, 9, 2001034. [Google Scholar] [CrossRef]
  40. Feng, W.; Gao, F.; Hu, Y.; Dai, M.; Li, H.; Wang, L.; Hu, P. High-performance and flexible photodetectors based on chemical vapor deposition grown two-dimensional In2Se3 nanosheets. Nanotechnology 2018, 29, 445205. [Google Scholar] [CrossRef] [PubMed]
  41. Li, J.; Li, H.; Niu, X.; Wang, Z. Low-Dimensional In2Se3 Compounds: From Material Preparations to Device Applications. ACS Nano 2021, 15, 18683–18707. [Google Scholar] [CrossRef]
  42. Almeida, G.; Dogan, S.; Bertoni, G.; Giannini, C.; Gaspari, R.; Perissinotto, S.; Krahne, R.; Ghosh, S.; Manna, L. Colloidal Monolayer beta-In2Se3 Nanosheets with High Photoresponsivity. J. Am. Chem. Soc. 2017, 139, 3005–3011. [Google Scholar] [CrossRef]
  43. Han, G.; Chen, Z.G.; Drennan, J.; Zou, J. Indium Selenides: Structural Characteristics, Synthesis and Their Thermoelectric Performances. Small 2014, 10, 2747–2765. [Google Scholar] [CrossRef] [PubMed]
  44. Kupers, M.; Konze, P.M.; Meledin, A.; Mayer, J.; Englert, U.; Wuttig, M.; Dronskowski, R. Controlled Crystal Growth of Indium Selenide, In2Se3, and the Crystal Structures of alpha-In2Se3. Inorg. Chem. 2018, 57, 11775–11781. [Google Scholar] [CrossRef]
  45. Balakrishnan, N.; Steer, E.D.; Smith, E.F.; Kudrynskyi, Z.R.; Kovalyuk, Z.D.; Eaves, L.; Patane, A.; Beton, P.H. Epitaxial growth of gamma-InSe and alpha, beta, and gamma-In2Se3 on epsilon-GaSe. 2D Mater. 2018, 5, 035026. [Google Scholar] [CrossRef]
  46. Lyu, F.; Li, X.; Tian, J.; Li, Z.; Liu, B.; Chen, Q. Temperature-Driven alpha-beta Phase Transformation and Enhanced Electronic Property of 2H alpha-In2Se3. ACS Appl. Mater. Interfaces 2022, 14, 23637–23644. [Google Scholar] [CrossRef] [PubMed]
  47. Okamoto, T.; Nakada, Y.; Aoki, T.; Takaba, Y.; Yamada, A.; Konagai, M. Structural control of In2Se3 polycrystalline thin films by molecular beam epitaxy. Phys. Status Solidi C 2006, 3, 2796–2799. [Google Scholar] [CrossRef]
  48. Lin, M.; Wu, D.; Zhou, Y.; Huang, W.; Jiang, W.; Zheng, W.; Zhao, S.; Jin, C.; Guo, Y.; Peng, H.; et al. Controlled growth of atomically thin In2Se3 flakes by van der Waals epitaxy. J. Am. Chem. Soc. 2013, 135, 13274–13277. [Google Scholar] [CrossRef]
  49. Rasmussen, A.M.; Teklemichael, S.T.; Mafi, E.; Gu, Y.; McCluskey, M.D. Pressure-induced phase transformation of In2Se3. Appl. Phys. Lett. 2013, 102, 062105. [Google Scholar] [CrossRef]
  50. Tao, X.; Gu, Y. Crystalline-crystalline phase transformation in two-dimensional In2Se3 thin layers. Nano Lett. 2013, 13, 3501–3505. [Google Scholar] [CrossRef] [PubMed]
  51. Ke, F.; Liu, C.; Gao, Y.; Zhang, J.; Tan, D.; Han, Y.; Ma, Y.; Shu, J.; Yang, W.; Chen, B.; et al. Interlayer-glide-driven isosymmetric phase transition in compressed In2Se3. Appl. Phys. Lett. 2014, 104, 212102. [Google Scholar] [CrossRef]
  52. Moreau, E.; Godey, S.; Ferrer, F.J.; Vignaud, D.; Wallart, X.; Avila, J.; Asensio, M.C.; Bournel, F.; Gallet, J.J. Graphene growth by molecular beam epitaxy on the carbon-face of SiC. Appl. Phys. Lett. 2010, 97, 241907. [Google Scholar] [CrossRef]
  53. Wang, Q.; Zhang, W.; Wang, L.; He, K.; Ma, X.; Xue, Q. Large-scale uniform bilayer graphene prepared by vacuum graphitization of 6H-SiC(0001) substrates. J. Phys. Condens. Matter 2013, 25, 095002. [Google Scholar] [CrossRef]
  54. Siegel, D.A.; Regan, W.; Fedorov, A.V.; Zettl, A.; Lanzara, A. Charge-Carrier Screening in Single-Layer Graphene. Phys. Rev. Lett. 2013, 110, 146802. [Google Scholar] [CrossRef]
  55. Li, X.; Zuo, X.; Li, H.; Han, L.; Gao, Q.; Li, D.; Cui, B.; Liu, D.; Qu, F. Exotic magnetism in As-doped alpha/beta-In2Se3 monolayers with tunable anisotropic carrier mobility. Phys. Chem. Chem. Phys. 2019, 21, 19234–19241. [Google Scholar] [CrossRef]
  56. Xu, C.; Mao, J.; Guo, X.; Yan, S.; Chen, Y.; Lo, T.W.; Chen, C.; Lei, D.; Luo, X.; Hao, J.; et al. Two-dimensional ferroelasticity in van der Waals beta’-In2Se3. Nat. Commun. 2021, 12, 3665. [Google Scholar] [CrossRef]
  57. Xu, C.; Chen, Y.; Cai, X.; Meingast, A.; Guo, X.; Wang, F.; Lin, Z.; Lo, T.W.; Maunders, C.; Lazar, S.; et al. Two-Dimensional Antiferroelectricity in Nanostripe-Ordered In2Se3. Phys. Rev. Lett. 2020, 125, 047601. [Google Scholar] [CrossRef]
  58. Zhang, F.; Wang, Z.; Dong, J.; Nie, A.; Xiang, J.; Zhu, W.; Liu, Z.; Tao, C. Atomic-Scale Observation of Reversible Thermally Driven Phase Transformation in 2D In2Se3. ACS Nano 2019, 13, 8004–8011. [Google Scholar] [CrossRef]
  59. Matetskiy, A.V.; Mararov, V.V.; Denisov, N.V.; Nguyen, D.L.; Hsing, C.R.; Wei, C.M.; Zotov, A.V.; Saranin, A.A. Characterization of the ferroelectric phase transition in monolayer In2Se3 grown on bilayer graphene. Appl. Surf. Sci. 2022, 600, 154032. [Google Scholar] [CrossRef]
  60. Wang, Z.; Hao, Z.; Yu, Y.; Wang, Y.; Kumar, S.; Xie, X.; Tong, M.; Deng, K.; Hao, Y.J.; Ma, X.M.; et al. Fermi Velocity Reduction of Dirac Fermions around the Brillouin Zone Center in In2Se3-Bilayer Graphene Heterostructures. Adv. Mater. 2021, 33, e2007503. [Google Scholar] [CrossRef] [PubMed]
  61. Koshino, M. Interlayer interaction in general incommensurate atomic layers. New J. Phys. 2015, 17, 015014. [Google Scholar] [CrossRef]
  62. Liu, L.; Dong, J.; Huang, J.; Nie, A.; Zhai, K.; Xiang, J.; Wang, B.; Wen, F.; Mu, C.; Zhao, Z.; et al. Atomically Resolving Polymorphs and Crystal Structures of In2Se3. Chem. Mater. 2019, 31, 10143–10149. [Google Scholar] [CrossRef]
  63. Nakashima, S.; Harima, H. Raman Investigation of SiC Polytypes. Phys. Status Solidi (A) 1997, 162, 39–64. [Google Scholar] [CrossRef]
  64. Shirley, D.A. High-Resolution X-Ray Photoemission Spectrum of the Valence Bands of Gold. Phys. Rev. B 1972, 5, 4709–4714. [Google Scholar] [CrossRef]
  65. Végh, J. The Shirley background revised. J. Electron Spectrosc. Relat. Phenom. 2006, 151, 159–164. [Google Scholar] [CrossRef]
  66. Moulder, J.F.; Stickle, W.F.; Sobol, P.E.; Bomben, K.D. Handbook of X-ray Photoelectron Spectroscopy; Chastain, J., Ed.; Perkin-Elmer Corporation, Physical Electronics Division: Eden Prairie, MN, USA, 1992. [Google Scholar]
  67. Weightman, P.; Roberts, E.D.; Johnson, C.E. L2,3MM Auger processes in selenium. J. Phys. C Solid State Phys. 1975, 8, 550. [Google Scholar] [CrossRef]
  68. Qi, Y.; Rhim, S.H.; Sun, G.F.; Weinert, M.; Li, L. Epitaxial Graphene on SiC(0001): More than Just Honeycombs. Phys. Rev. Lett. 2010, 105, 085502. [Google Scholar] [CrossRef]
  69. Benfatto, L.; Cappelluti, E. Spectroscopic signatures of massless gap opening in graphene. Phys. Rev. B 2008, 78, 115434. [Google Scholar] [CrossRef]
  70. Collins, J.L.; Wang, C.; Tadich, A.; Yin, Y.; Zheng, C.; Hellerstedt, J.; Grubišić-Čabo, A.; Tang, S.; Mo, S.-K.; Riley, J.; et al. Electronic Band Structure of In-Plane Ferroelectric van der Waals β′-In2Se3. ACS Appl. Electron. Mater. 2020, 2, 213–219. [Google Scholar] [CrossRef]
  71. Han, T.T.; Chen, L.; Cai, C.; Wang, Z.G.; Wang, Y.D.; Xin, Z.M.; Zhang, Y. Metal-Insulator Transition and Emergent Gapped Phase in the Surface-Doped 2D Semiconductor 2H-MoTe2. Phys. Rev. Lett. 2021, 126, 106602. [Google Scholar] [CrossRef] [PubMed]
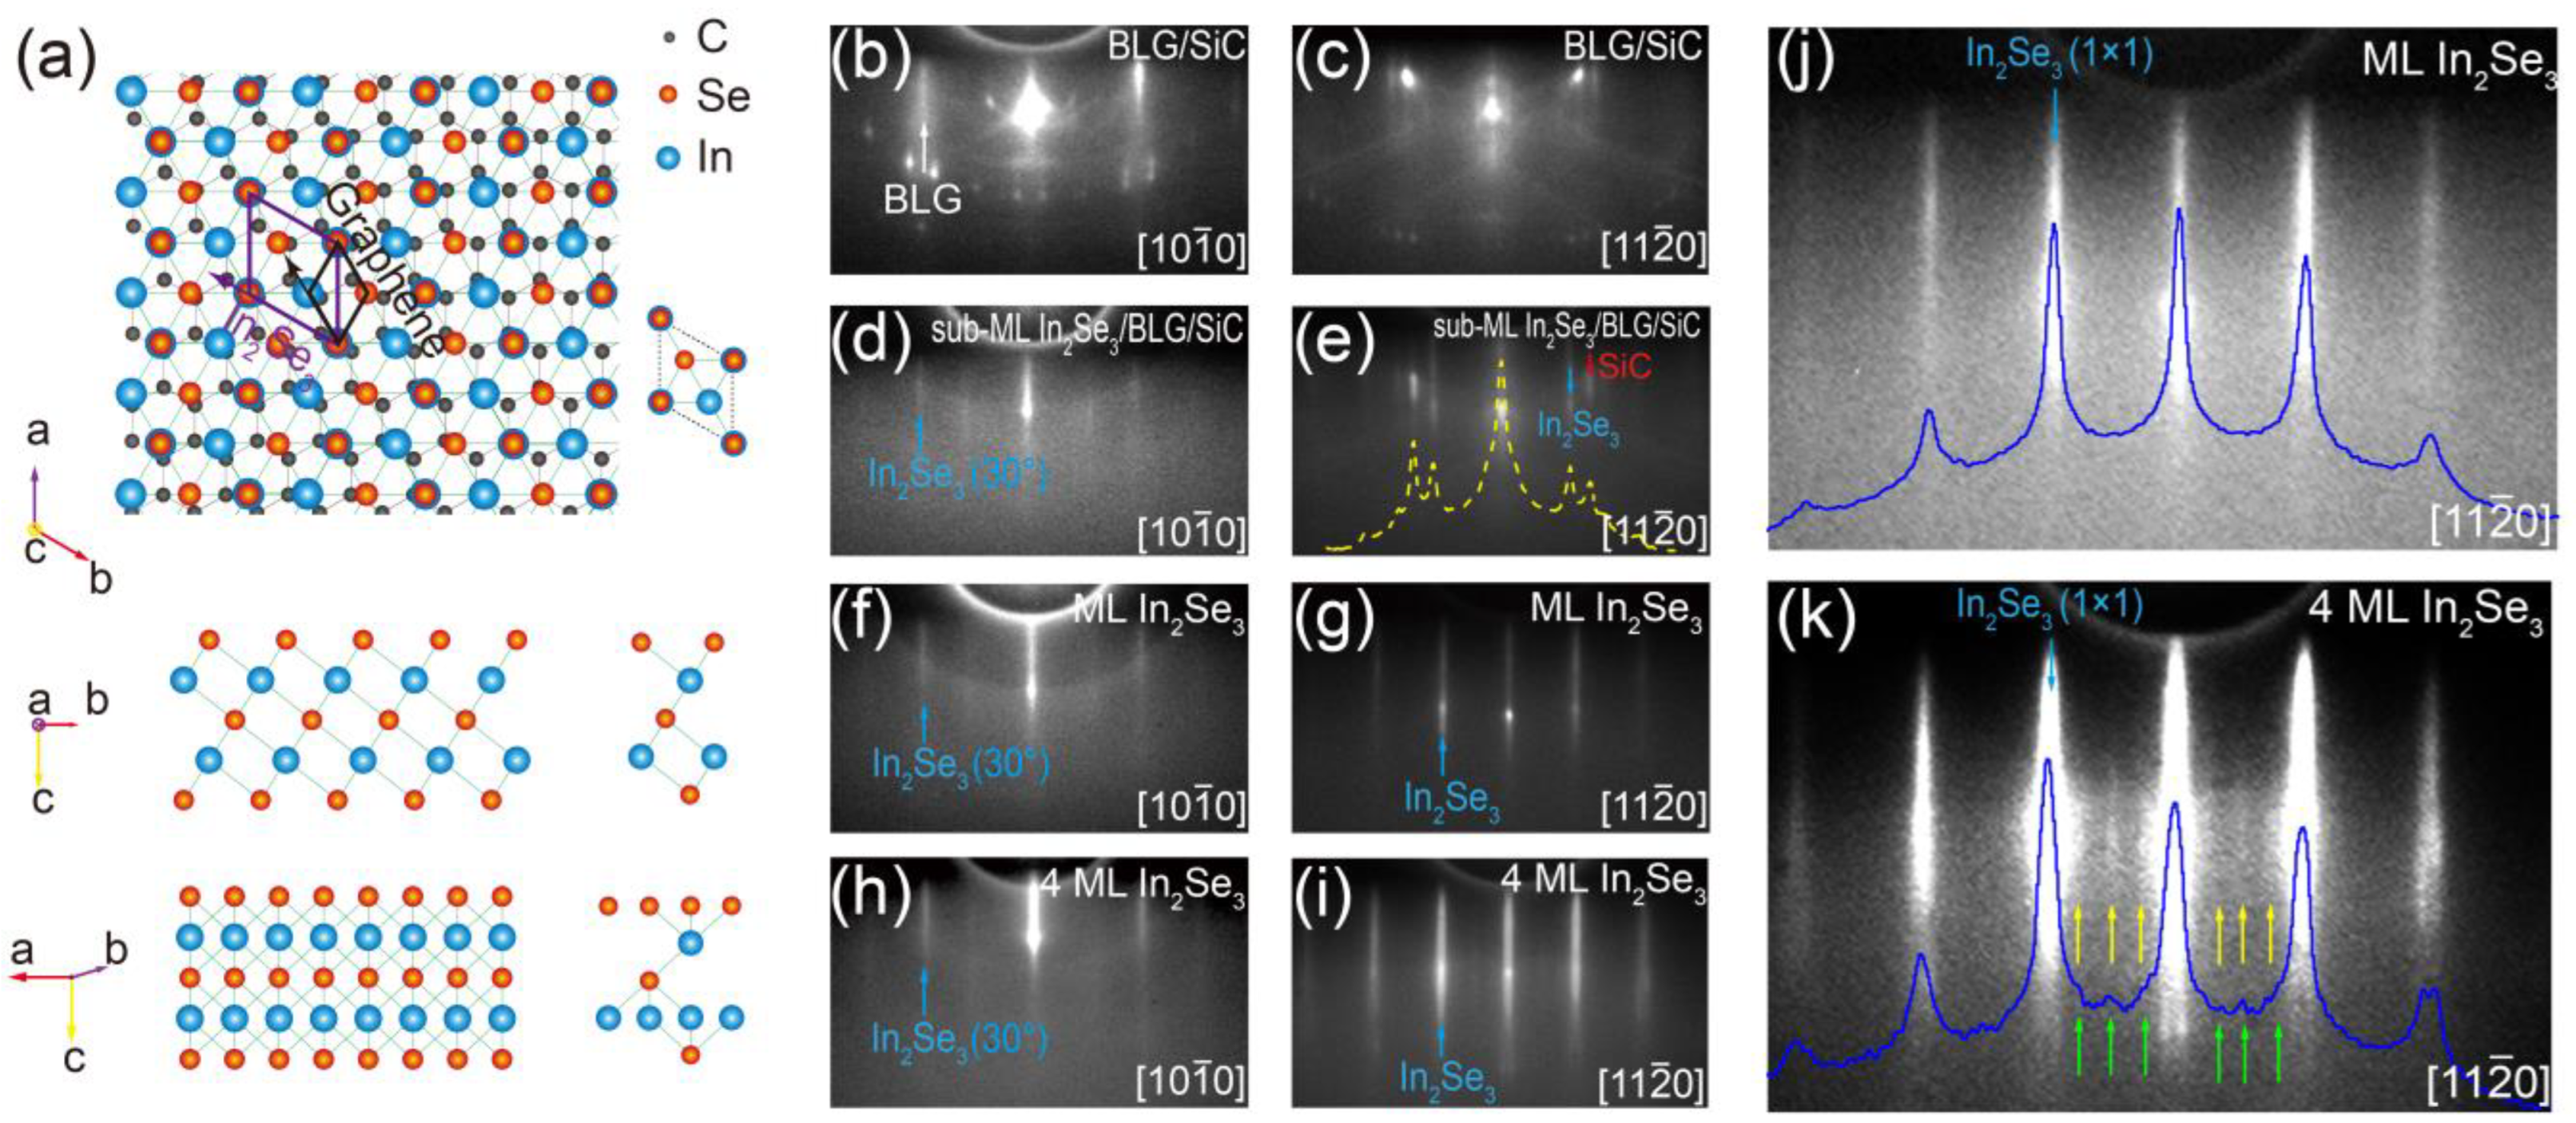
Figure 1. (a) Top view (upper panel) and side views (middle and lower panels) of the ML β–In2Se3 lattice on BLG. The purple and black rhombuses represent the unit cell of β–In2Se3 and the graphene lattice, respectively. The corresponding views of the β–In2Se3 unit cell from three directions are shown on the right. (b,c) RHEED patterns of a BLG/SiC substrate along the (b) 10 1 ¯ 0 and (c) 11 2 ¯ 0 directions of SiC, respectively. (di) RHEED patterns for (d,e) a partially covered sub-ML β–In2Se3 film, (f,g) a fully covered ML β–In2Se3, (h,i) a 4 ML β–In2Se3 along the 10 1 ¯ 0 and 11 2 ¯ 0 directions of SiC, respectively. (j,k) The enlarged RHEED patterns of (g,i) with enhanced intensity, respectively. The blue curves are the intensity distribution curves of the RHEED patterns.
Nanomaterials 13 01533 g001
Figure 2. (a,d) STM topographies of (a) sub-ML and (d) 4 ML β–In2Se3 films, respectively. The insets are the corresponding height profiles along the green dashed lines. (b,c,e,f) Atom-resolved STM images and the corresponding FFT images on the surface of (b,c) 1 ML and (e,f) 4 ML β–In2Se3 films, respectively. The inset in (c) is a 2× zoom-in of the cray dashed zone. (g) Atom-resolved STM image of a 4 ML β–In2Se3 film. (h) Height profile taken along the green dashed line in (g). Scanning parameters: (a,d) 400 × 400 nm2, Vb = 1.00 V, It = 100 pA; (b,e) 30 × 30 nm2, Vb = 0.60 V, It = 660 pA; (g) 8 × 8 nm2, Vb = 0.56 V, It = 600 pA.
Nanomaterials 13 01533 g002
Figure 3. (a) Raman spectra of the α–In2Se3 evaporation source, 30 ML, 10 ML, 4 ML, ML β–In2Se3 films, and BLG/SiC substrate. (be) XPS spectra of In 3d3/2, In 3d5/2, Se 3d3/2, and Se 3d5/2 orbitals of (b) 4 ML, (c) 1 ML, (d) potassium-doped 4 ML, and (e) potassium-doped ML β–In2Se3 films, respectively. The red lines are the multiple Lorentzian peaks fitting to the raw data by using Equation (1). The blue dashed lines are the parts of Lorentzian peaks of the total fitting lines. The cyan dashed lines are the Shirley backgrounds of the raw data.
Nanomaterials 13 01533 g003
Figure 4. (ac) Constant energy mappings of (a) sub-ML, (b) 4 ML, and (c) 10 ML β–In2Se3 films, respectively. (d) ARPES spectra of the ML β–In2Se3/BLG along the M-Γ-K direction. The right panel is the zoom-in spectra of the blue rectangular region. (e) Zoom-in ARPES spectra around the VBM of ML β–In2Se3. (f) Second-derivative ARPES spectra of ML β–In2Se3. (g,h) ARPES spectra of the 4 and 10 ML β–In2Se3 films along the M-Γ-K direction, respectively. The right panels are the zoom-in spectra of the blue rectangular regions.
Nanomaterials 13 01533 g004
Figure 5. (ac) Fermi surface mappings of the (a) 1, (b) 4, and (c) 10 ML β–In2Se3 films with potassium doping, respectively. (df) ARPES spectra of (d) 1, (e) 4, (f) 10 ML β–In2Se3 films with potassium doping along the M-Γ-K direction, respectively. The right panels are the zoom-in spectra with enhanced intensity in the colored rectangular regions. (gl) Second-derivative ARPES spectra of the (g,h) 1, (i,j) 4, and (k,l) 10 ML β–In2Se3 films around the CBM and VBM, respectively.
Nanomaterials 13 01533 g005
Disclaimer/Publisher’s Note: The statements, opinions and data contained in all publications are solely those of the individual author(s) and contributor(s) and not of MDPI and/or the editor(s). MDPI and/or the editor(s) disclaim responsibility for any injury to people or property resulting from any ideas, methods, instructions or products referred to in the content.