Article

Towards Automated and High-Throughput Quantitative Sizing and Isotopic Analysis of Nanoparticles via Single Particle-ICP-TOF-MS

by
Benjamin T. Manard
1,*,
Veronica C. Bradley
1,
C. Derrick Quarles, Jr.
2,
Lyndsey Hendriks
3,
Daniel R. Dunlap
1,
Cole R. Hexel
1,
Patrick Sullivan
2 and
Hunter B. Andrews
4,*
1
Chemical Sciences Division, Oak Ridge National Laboratory, Oak Ridge, TN 37831, USA
2
Elemental Scientific, Inc., Omaha, NE 68122, USA
3
TOFWERK AG, 3645 Thun, Switzerland
4
Radioisotope Science and Technology Division, Oak Ridge National Laboratory, Oak Ridge, TN 37831, USA
*
Authors to whom correspondence should be addressed.
Nanomaterials 2023, 13(8), 1322; https://doi.org/10.3390/nano13081322
Submission received: 21 March 2023 / Revised: 3 April 2023 / Accepted: 5 April 2023 / Published: 9 April 2023

Abstract

:
The work described herein assesses the ability to characterize gold nanoparticles (Au NPs) of 50 and 100 nm, as well as 60 nm silver shelled gold core nanospheres (Au/Ag NPs), for their mass, respective size, and isotopic composition in an automated and unattended fashion. Here, an innovative autosampler was employed to mix and transport the blanks, standards, and samples into a high-efficiency single particle (SP) introduction system for subsequent analysis by inductively coupled plasma–time of flight–mass spectrometry (ICP-TOF-MS). Optimized NP transport efficiency into the ICP-TOF-MS was determined to be >80%. This combination, SP-ICP-TOF-MS, allowed for high-throughput sample analysis. Specifically, 50 total samples (including blanks/standards) were analyzed over 8 h, to provide an accurate characterization of the NPs. This methodology was implemented over the course of 5 days to assess its long-term reproducibility. Impressively, the in-run and day-to-day variation of sample transport is assessed to be 3.54 and 9.52% relative standard deviation (%RSD), respectively. The determination of Au NP size and concentration was of <5% relative difference from the certified values over these time periods. Isotopic characterization of the 107Ag/109Ag particles (n = 132,630) over the course of the measurements was determined to be 1.0788 ± 0.0030 with high accuracy (0.23% relative difference) when compared to the multi-collector–ICP-MS determination.

Graphical Abstract

1. Introduction

Dedicated efforts in analytical chemistry are often centered on minimizing sample handling, improving analysis efficiency, and increasing throughout. These attributes have generally been shown to improve the overall data quality while reducing analysts’ time on the instrument. For inorganic mass spectrometry, the automation of sample introduction and sample preparation has become a major target as a way to boost productivity and sample throughput while reducing the time required for sample preparation [1]. These efforts often manifest in the form of multiport and switching valves [2], sample loops [3], vacuum and syringe pumps [4], mixing chambers [5], and flow injection techniques, such as separation or preconcentration columns [1,4,6,7]. Specifically, in the field of nuclear analytical chemistry, Metzger et al. utilized an automated separation system to separate uranium and plutonium from environmental sample swipes. These automated efforts not only improved sample throughput but also lowered method blanks due to an enclosed separation system which minimized sample handling [8]. Xu et al. utilized a novel sample introduction platform to minimize sample volumes of plutonium metal samples by approximately 90% by introducing the sample via syringe drive in conjunction with a sample loop (as opposed to traditional aspiration), while improving the method detection limit (by approximately 50×) [9]. Aside from nuclear analytical chemistry [10,11], other applications emphasizing improved automation and sample delivery have been particularly useful in terms of ICP-MS-based analysis, including speciation [12], stable isotope analysis [13], and clinical studies [14,15].
Single particle (SP) analysis is a unique sample scheme/approach for ICP-MS-based measurements [16,17,18]. Since the emergence of SP analysis, there have been some efforts explored regarding automated high-efficiency sample introduction [19,20] or automated on-line purifications [21] for single particles/single cells. In comparison to a bulk dissolution, which ultimately homogenizes the sample, SP analysis allows for the direct discrimination of particles. This technique has proven its utility covering a wide range of applications and is revolutionizing the way nanomaterials/nanoparticles (NPs) are studied. In short, this measurement needs a highly efficient way to introduce the sample into the ICP, such that one particle enters at a time. Secondly, an ICP is needed with a mass analyzer fast enough to detect such events. Sector field (SF)-based mass spectrometers are valuable when highly sensitive measurement are warranted, but are often hindered when more than one detected isotope is of interest due to magnet settling time [22]. While more recent hardware and software developments now permit for such fast data acquisition [23], the sequential nature of quadrupole- and single-collector SF-ICP-MS, does not allow for simultaneous multi-elemental NP analysis and thereby hinders high-throughput measurements. Indeed, as the sample needs to be repeatedly analyzed for all isotopes of interest and a sufficient number of NPs for reliable statistics, the analysis time is significantly lengthened. Time-of-flight (TOF)-based instruments appear to present the best utility for SP measurements, not only due to their inherently fast acquisition times, but also to their ability to quasi-simultaneously monitor all masses (e.g., 6Li–242Pu) [24]. This lends itself to be the ideal platform for isotopically characterizing multi-elemental SPs with ultra-fast acquisition times (a multi-collector instrument could isotopically characterize individual particles, but is limited based on acquisition times and mass range) [25].
Regarding sample introduction considerations for SP analysis, one must consider the effective preparation of the particle suspension, how to sample effectively and quickly, and how to introduce the sample into the ICP with high transport efficiency. Presented here are results from an optimized sample introduction method for NP characterization. A focus was placed on efficiently introducing particles into the ICP-MS with high in-sequence repeatability and successful day-to-day reproducibility. This was achieved with an innovative autosampler which incorporates in-run mixing of the samples, syringe-driven sample uptake for the precise aliquoting of samples, and a state-of-the-art nebulizer, spray chamber, and torch/injector for high-efficiency sample transport. This sample introduction methodology was validated with ionic and NP standards to determine NP concentration, size distribution, and isotopic abundance. The ability to reproductively introduce, detect, and characterize NPs, over long sequences (8 h) and multiple days (5 d) is highlighted here and can have an immediate impact across various applications (e.g., environmental, clinical, etc.).

2. Experimental

2.1. Materials & Reagents

Monodisperse spherical gold nanospheres (Au NPs) of 50 and 100 nm, and silver shelled gold core nanospheres (Au/Ag NPs) (nanoComposix, Fortis Life Sciences, San Diego, CA, USA) were utilized in the presented work. The certificate of analysis (COA) for these particles is summarized and presented in Table 1. For preparation of the NPs presented here, the stock solutions were diluted such that the working concentration was roughly 50,000 particles mL−1. Prior to each dilution, the sample was sonicated for 30 s to aid in resuspension. All dilutions were performed with ASTM type I water (18.2 MΩ·cm) generated with a ThermoScientific BarnsteadTM GenPureTM xCAD Plus ultrapure water purification system (Waltham, MA, USA). For quantification, single element ionic standards of Au and Ag were prepared from a stock solution (10 µg mL−1) from High Purity Standards (HPS, Charleston, SC, USA). Appropriate dilutions were performed in ASTM type I water to final concentrations of 1, 5, and 10 ng mL−1. OptimaTM grade nitric acid (HNO3) from Fisher Scientific (Pittsburg, PA, USA) was utilized to digest the Au/Ag NPs for subsequent Ag isotope verification via multi-collector (MC) ICP-MS.

2.2. Multi-Collector–Inductively Coupled Plasma–Mass Spectrometry

For isotopic verification of the 15 nm silver shell of the Au/Ag NPs, a multi-collector–inductively coupled plasma–mass spectrometer (MC-ICP-MS) was employed. Here, the Au/Ag NPs were dissolved in 4 M HNO3 at 150 °C for 30 min. The dissolved material was screened on a Thermo Scientific (Bremen, Germany) TQ ICP-MS to ensure complete dissolution of the Ag shells. Subsequent dilutions were made with 2 % (w/w) HNO3 such that a working concentration of 1 ng mL−1 could be analyzed by the MC-ICP-MS (Neptune Plus, Thermo Scientific, Bremen, Germany). Isotopes of Ag were analyzed using two 1011 Ω resistance amplifiers with 107Ag on the axial cup and 109Ag on the H2 cup to allow for periodic recalibration of the center mass position during analysis. A quartz spray chamber was used with a 150 µL min−1 nebulizer which resulted in 1 V ppb−1 Ag sensitivity. The analysis method was set up as single block of 10 cycles with an 8 s integration time. An HPS Ag standard was run, bracketing the samples to correct for instrumental mass bias effects. The isotopic ratio of the samples was corrected by direct comparison to the Ag standard.

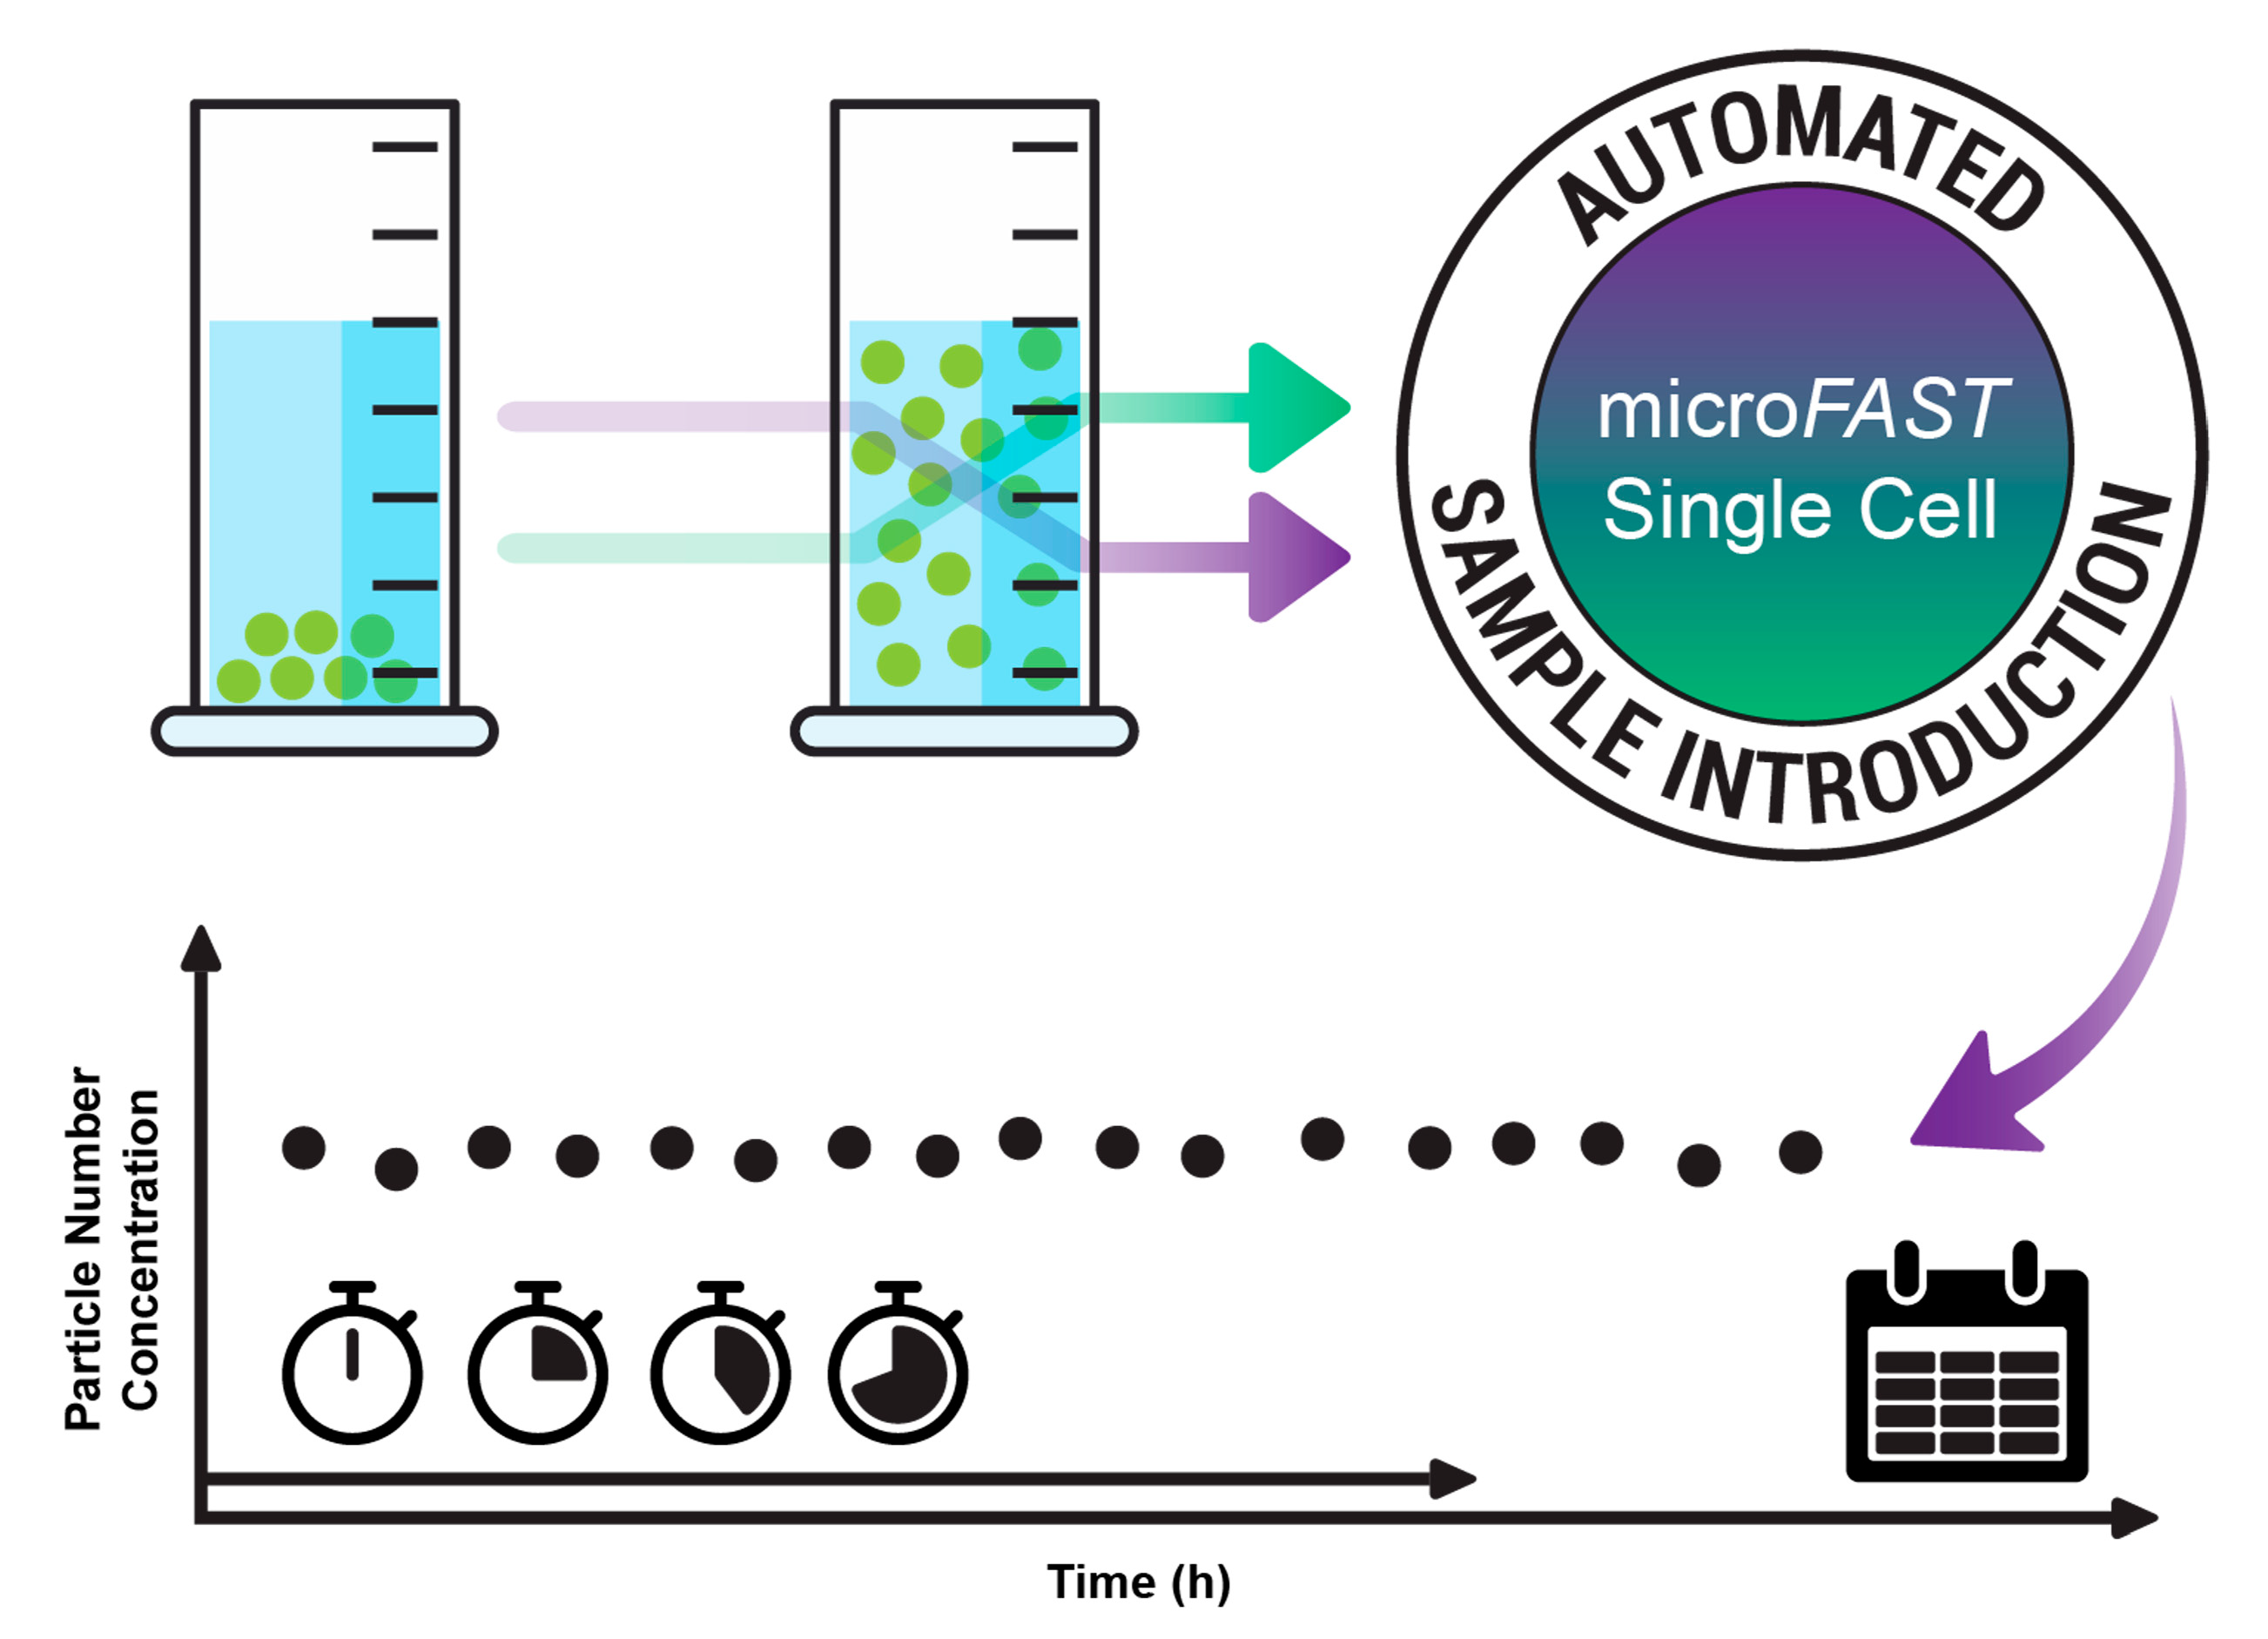
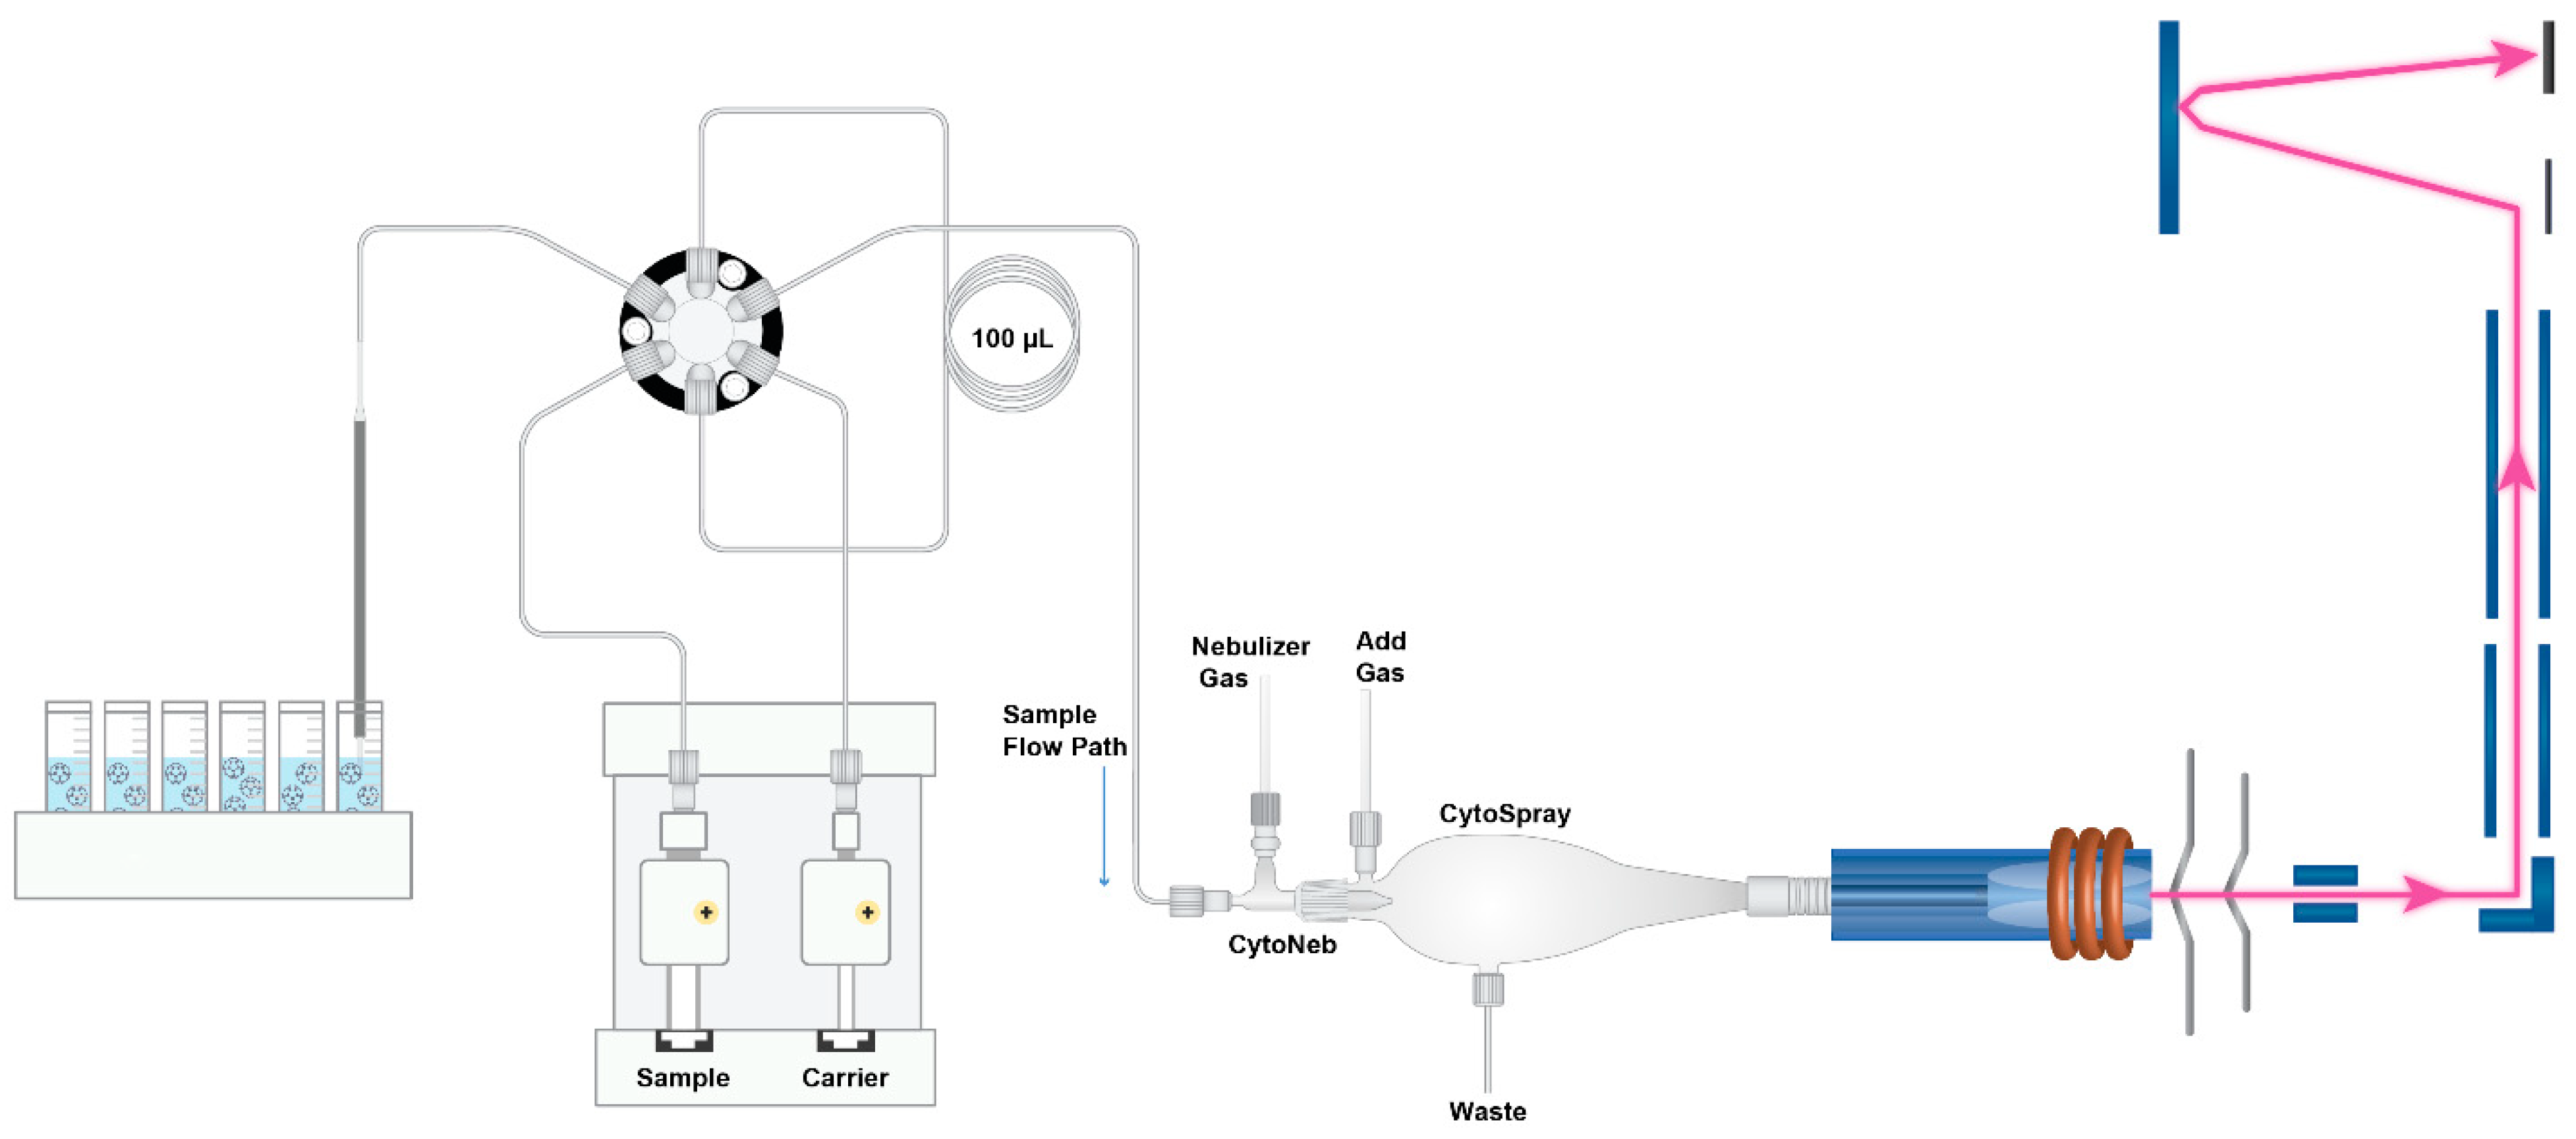
2.3. Single Particle–Inductively Coupled Plasma–Time of Flight–Mass Spectrometry

An Elemental Scientific Inc., (ESI, Omaha, NE, USA) microFAST SC sample introduction system was employed to introduce the NPs to the ICP-TOF-MS. The entirety of this introduction/detection system can be seen in Figure 1, operating conditions can be found in Table 2, and the sample introduction protocol is presented in Table 3. A tapered tipped carbon fiber autosampler probe is directed into the sample in which a mixing step is initiated, to assure NP suspension. Initial studies were performed to determine the optimum mixing protocol. In these studies, multiple repeated measurements were performed with and without mixing. It was found that the sample mixing prior to injection (100 µL) improved the percent relative standard deviation (%RSD) from 12.4 to 5.2 of the number events between samples. This study was performed over a 2 h analysis of 20 samples, each containing approximately 1000 particles. Once mixed, a syringe was employed to transport the sample into the sample loop to deliver a precise volume (100 µL) to the ICP-TOF-MS. Once injected out of the sample loop, the sample is then directed into a CytoNeb50 (ESI) nebulizer housed within a CytoSpray chamber (ESI, SC-CytoC-73) for high-efficiency NP introduction. The aerosolized particles are then transported into a unique one-piece torch/injector (ESI, T20-73, 2 mm) for NP delivery to the ICP. To determine particle transport efficiency, 50 nm Au NPs were injected at a known volume and known particle number concentration (PNC). The injection parameters were optimized such that the particle transport efficiency, calculated via particle frequency, was >80% for the 50 nm Au NPs. This high-efficiency particle transport performance is on par with what has recently been published [26], employing the same introduction components.
Here, an ICP-TOF-MS (icpTOF R, TOFWERK AG, Switzerland) was employed for sample analysis. Uniquely this ICP-MS can quasi-simultaneously detect all isotopes (2–290 Th) at ultra-fast acquisition times (30 µs). Further information regarding this ICP-TOF-MS instrument design can be found elsewhere [24]. This capability allows for multi-element as well as isotopic analysis of single NPs. The tuned mass resolving power and sensitivity of the instrument for 238U at the approximate times of measurement was 3100 Δm m−1 and 40,000 cps ppb−1, respectively. Experiment setup, data acquisition, and data processing were performed using TOFpilot v2.11.5 (TOFWERK AG, Switzerland). Using the dedicated particle module (TOFpilot v2.11.5, TOFWERK AG, Switzerland), the data were thresholded for particle identification by applying the compound Poisson algorithm [27] and subsequently, quantified using liquid standards [28]. Further data processing and data visualization were performed with in-house developed Python scripts.

3. Results and Discussion

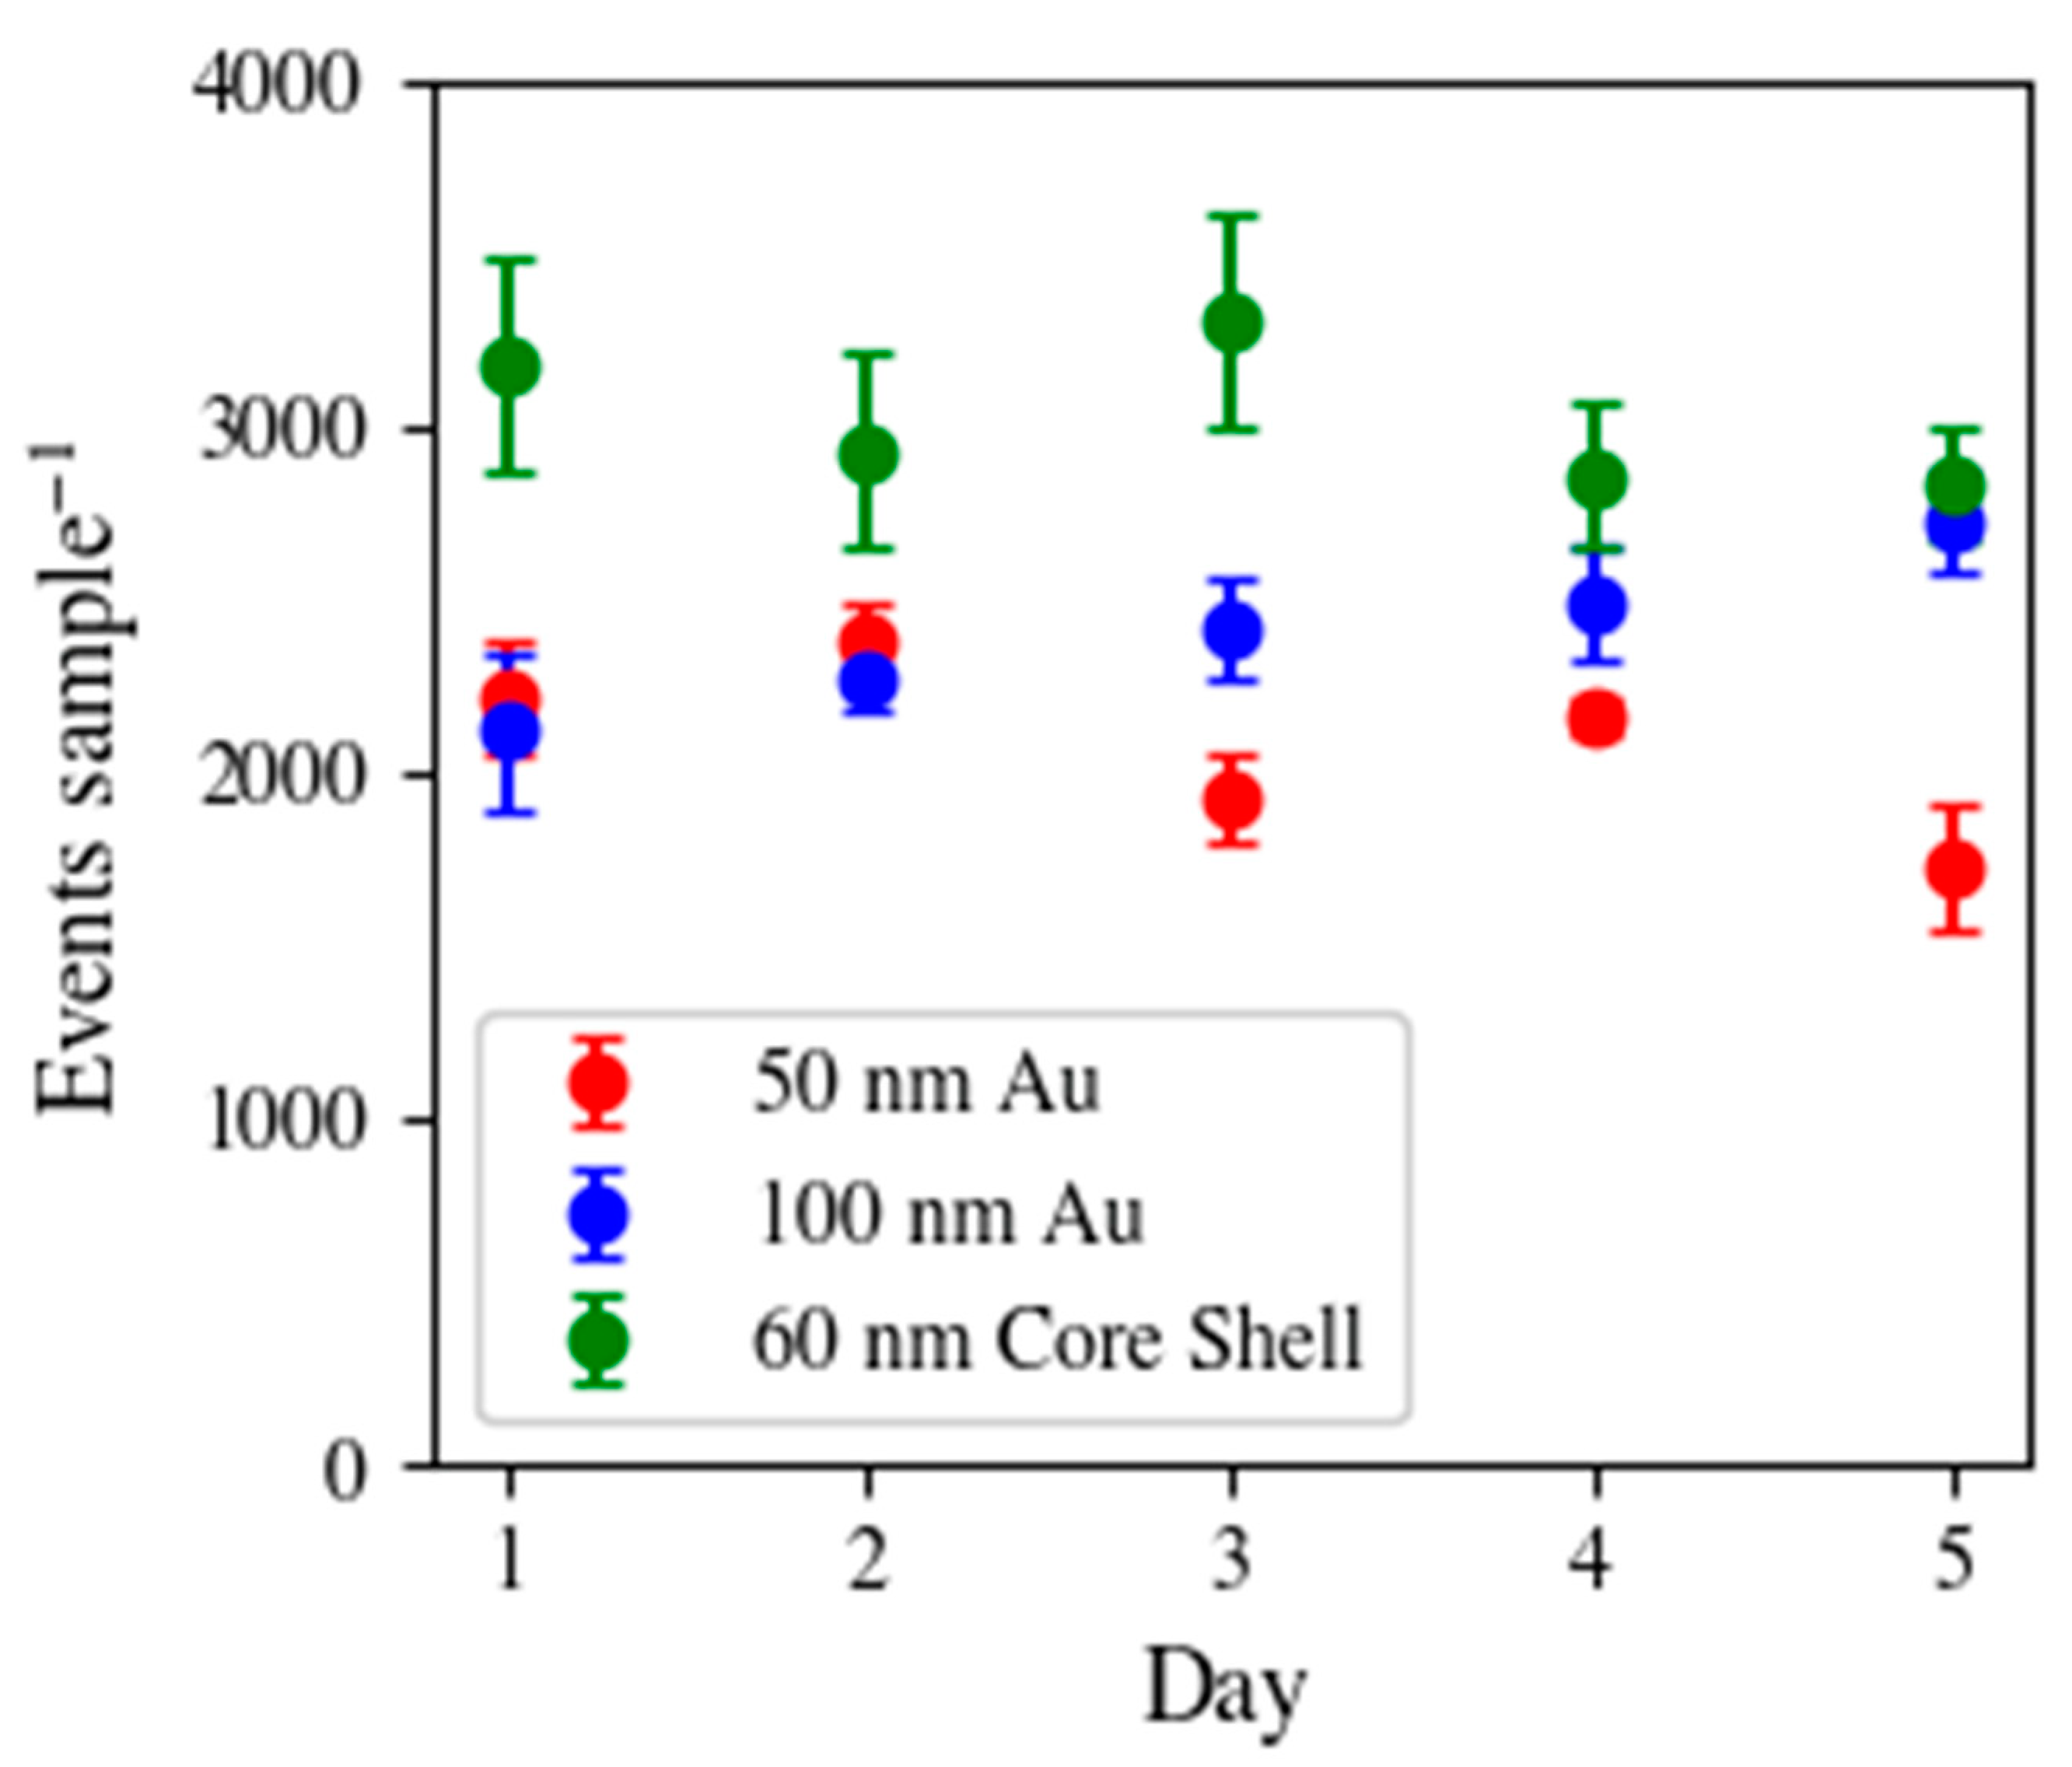
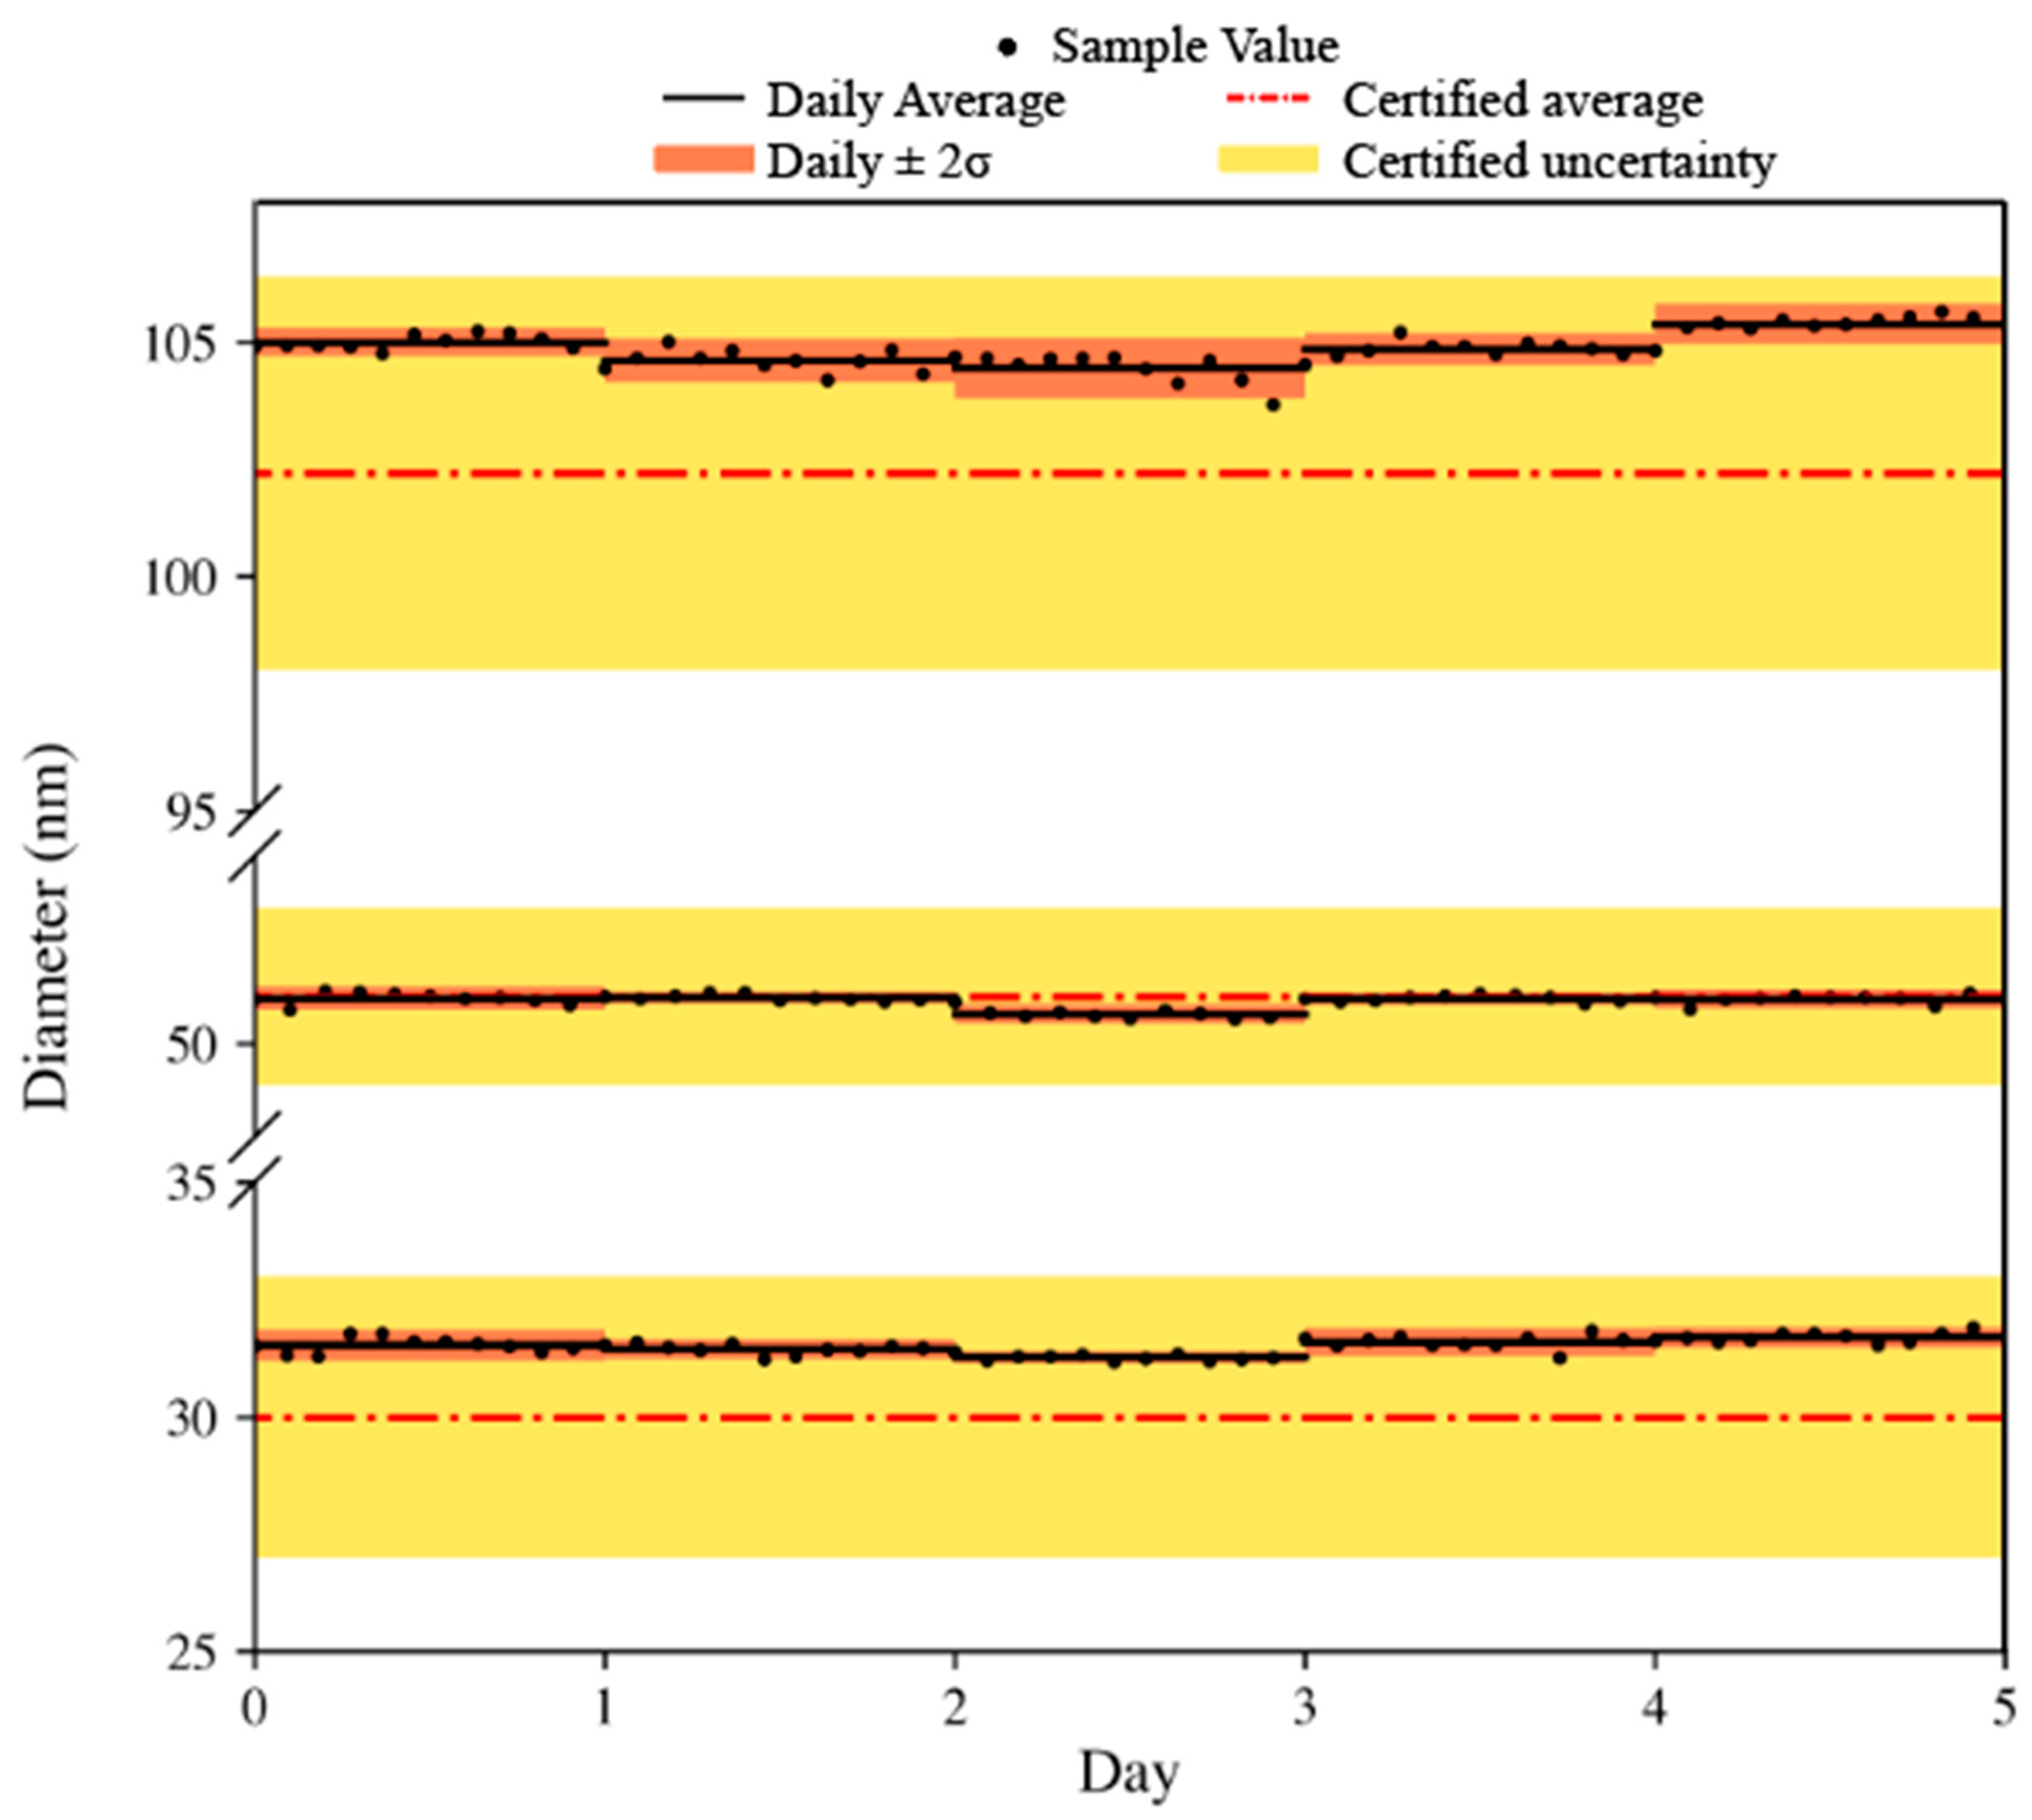
3.1. Reproducibility of Detected Particles

For the characterization of NPs, a sequenced approach was utilized and is presented in Table 3. Briefly, the ASTM Type I water (Blank) was bracketed before and after the sample analysis to monitor for successful rinsing of the tubing and injection loop prior to the analysis of the subsequent sample. Prior to the analysis of the NPs, single element (Au and Ag) ionic standards were measured at varying concentrations such that quantification based on external calibration could be utilized. All blanks and single element standards were measured with a 100 ms integration time for 60 s. These samples also aided in the determination of limits of detection (LOD). All NP samples were analyzed 10× with a 2 ms integration time for 450 s. The entirety of this sequence was completed in ~8 h. It should be noted that all calibration standards and NPs were prepared fresh prior to each daily sequence.
To determine the reproducibility of precisely injecting the same number of particles in each sample injection, the determined events were compared. For example, in a single injection (100 µL) of 50 nm Au NPs (with the presented dilution factors in Table 1) would yield around 2200 events during the detection time, assuming an 80% transport efficiency. This value is then compared within a single sequence and over the course of days, presented in Figure 2. This provides in-run and day-to-day statistics regarding the reproducibility of the 50, 60, and 100 nm SP introduction into the ICP-TOF-MS. The average %RSD for the in-run precision of detected events of the 50, 60, and 100 nm particles was 3.54 ± 1.05%. For day-to-day precision, the 50, 60, and 100 nm particles were detected at 2092 ± 510, 2412 ± 456, and 3029 ± 419 (2σ), respectively. Ultimately, this provides insight into the reproducibility of the effectiveness of particle introduction. The transport efficiency was calculated daily with an average of 77 ± 6% for the 5 days. As mentioned above, without the automated mixing of the sample, %RSDs (in terms of detected particle events) were seen in the >10% range on a single measurement. It would be expected that this %RSD would greatly increase over the course of longer sequences, such as those presented here. The fact that the average in-run precision during this study was 3.54 ± 1.05% and the day-to-day was 9.52 ± 5.3% demonstrates this introduction approach is a unique and robust way to introduce SP samples into the ICP-MS, which would be greatly beneficial in the arenas of environmental, production, and characterization of NPs.

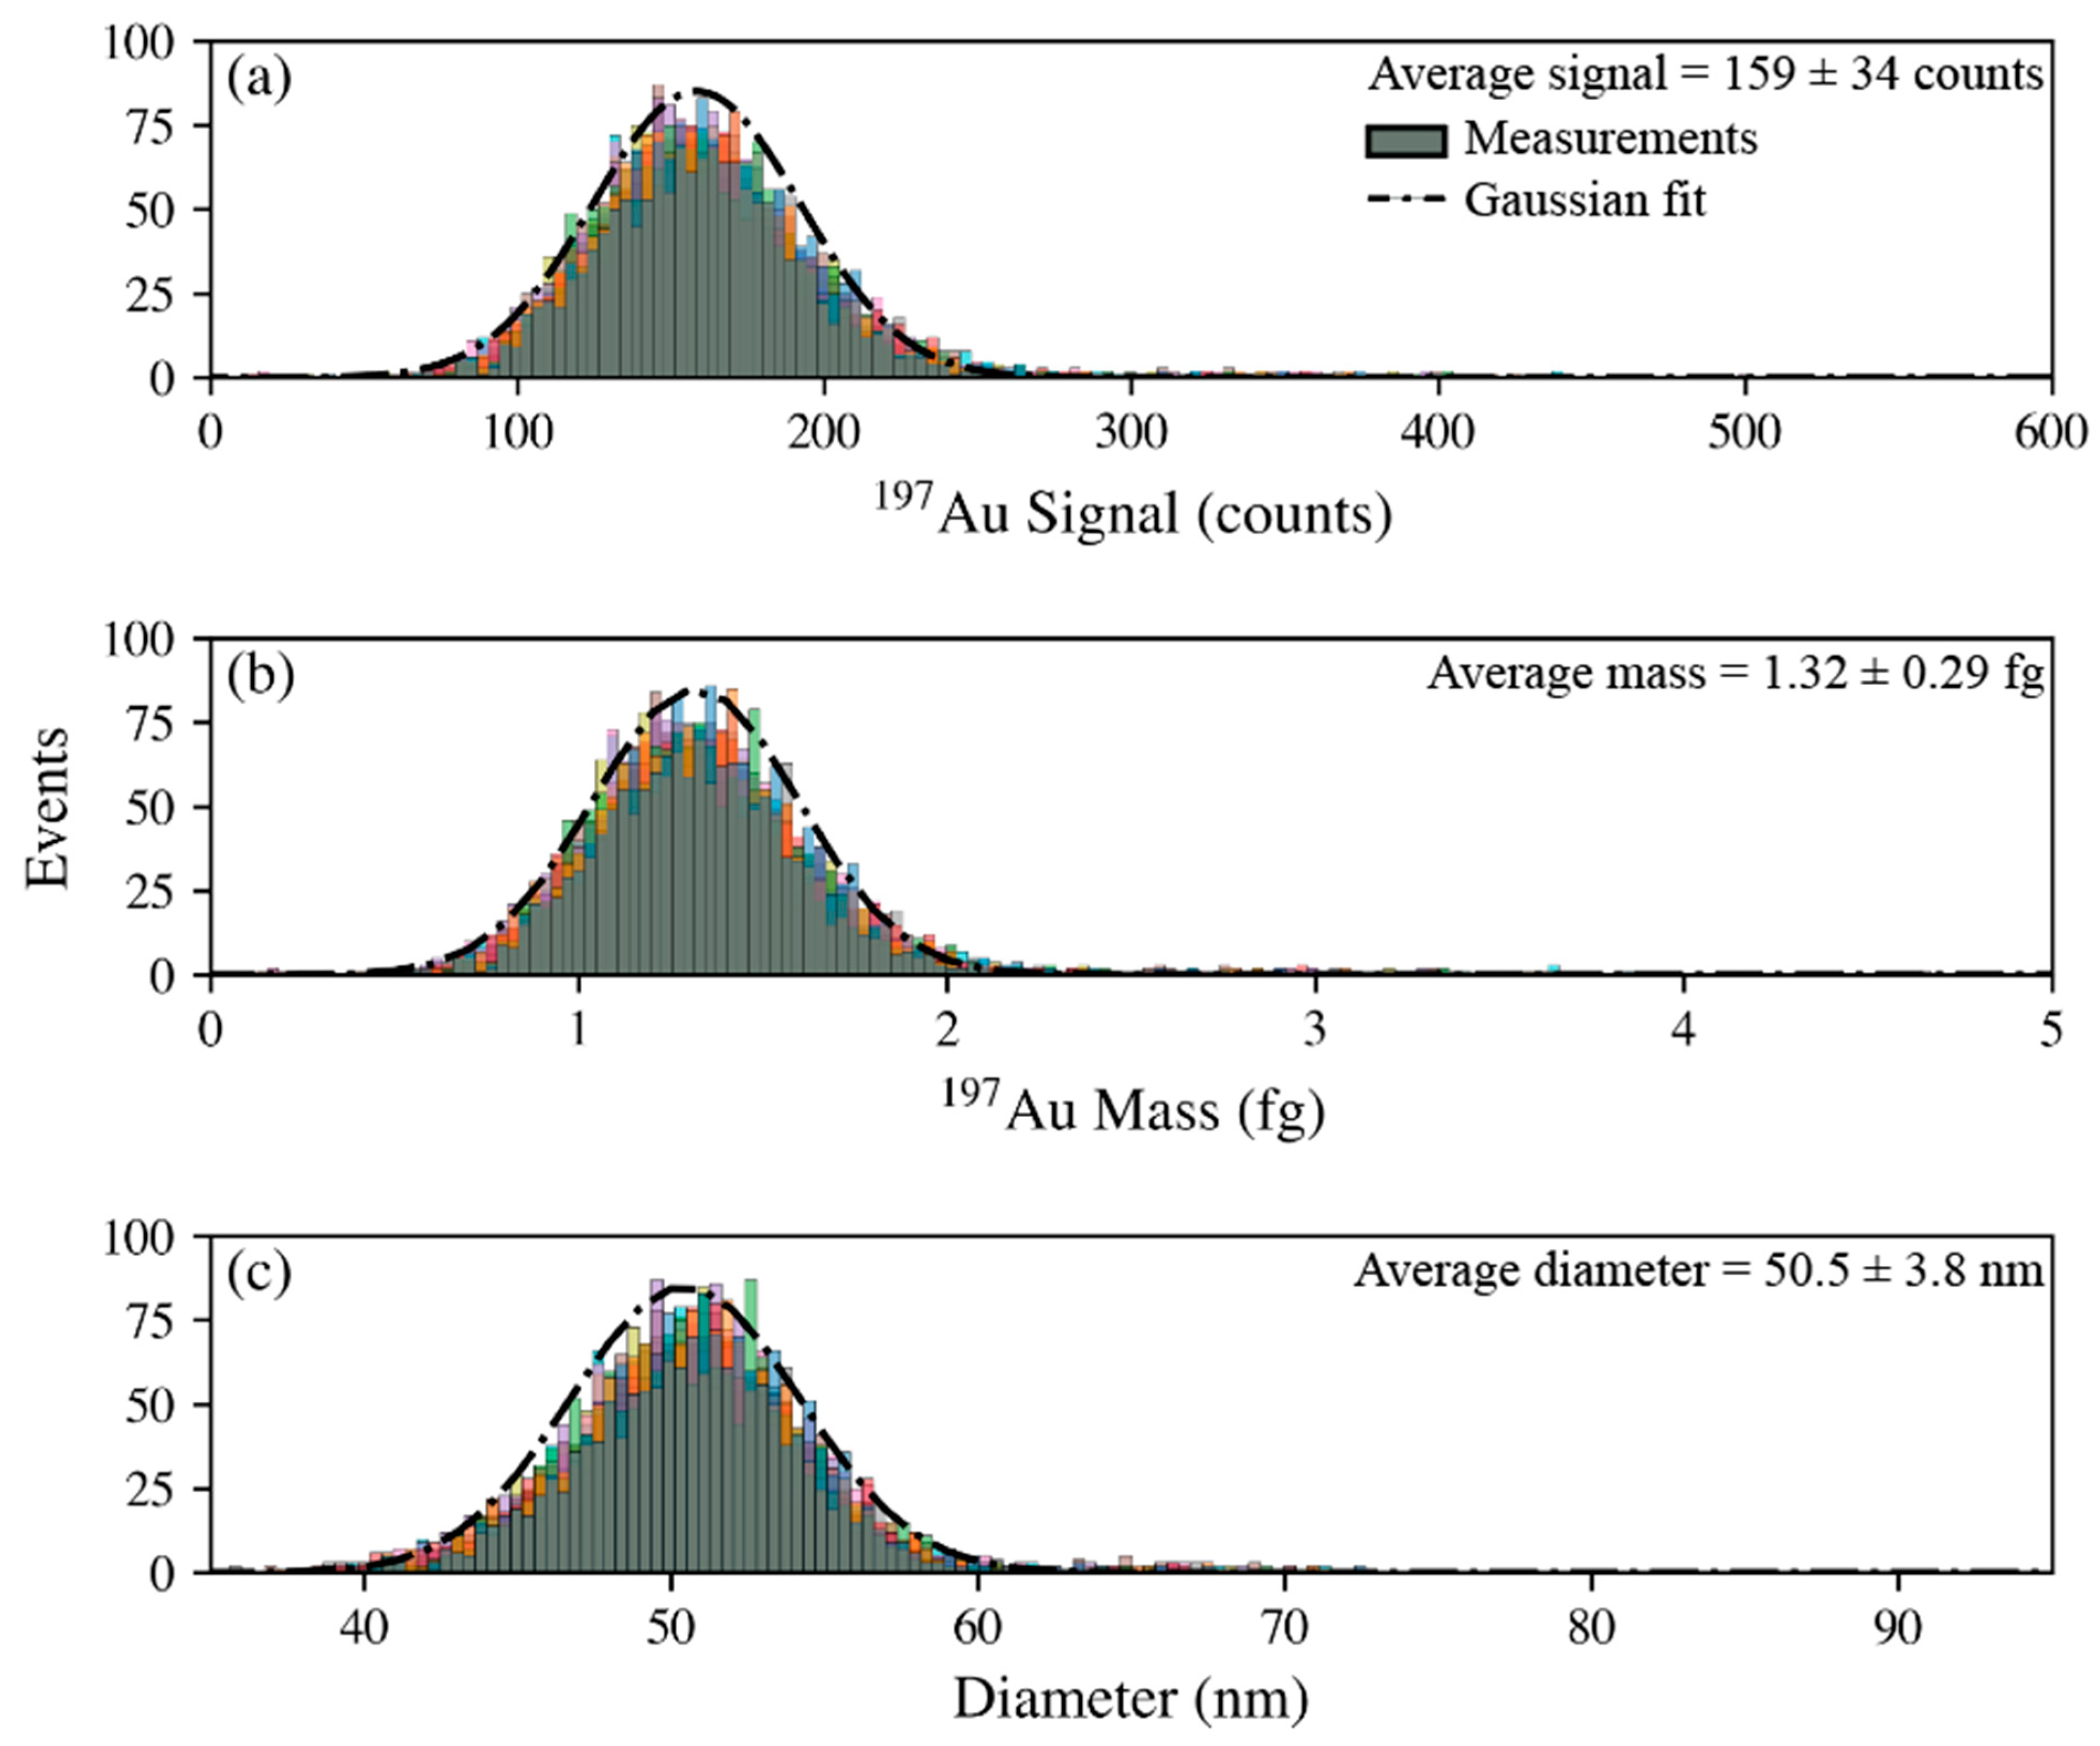
3.2. Mass and Size Characterization of Nanoparticles

The mass respective size characterization of the 50 nm Au NPs is presented in Figure 3 for a single day. This data clearly demonstrates the effectiveness of accurately determining the mass and size of the NPs. The data were processed in TOFpilot such that the signal (Figure 3a) from the ICP-TOF-MS measurement is converted to mass (Figure 3b) via external calibration based on the method of Pace et al. [29], this mass can then be used to determine NP size with the assumption of a spherical geometry. A set of known information, including elemental distribution and density of respective element (e.g., density of Au is 19.32 g cm−3) along with shape of the particles, can be used to calculate the particle diameter. Similar approaches have been previously reported [29,30]. Next, a k-clustering algorithm was applied to identify if multiple gaussian distributions were present in the sample population. The k-clustering was run 10× with differing random seeds for each sample to ensure if multiple distributions were detected that they were repeatedly identified. For the 100 nm Au NPs, a second population with a slightly larger diameter (approximately 106 nm) was identified; for the calculation of the NP diameter to compare with the COA values, only the lower distribution was used. Here, the Au NP sizes were determined to be 50.9 ± 0.30 and 104.9 ± 0.73 nm, over the course of the study, which is in excellent agreement with the certificate value of 51.0 ± 1.9 and 102.2 ± 4.2 nm. The Au/Ag NPs were analyzed with the same procedure, with the addition of the Ag layer thickness calculation. Here, the Au core was calculated to be 31.5 ± 0.32 nm and the Ag thickness was calculated to be 8.76 ± 2.4 nm compared to the certificate values of 30 ± 3 nm and 15 nm, respectively. The difference between the calculated and certificate values of the shell thickness may be caused by Ag layer degradation, or the certificate value may not be very accurate, as it was calculated rather than measured and does not have an associated uncertainty.
The derived particle diameters are presented in Figure 4, showing in-run and day-to-day variation with this characterization. Regarding each sample measurement (e.g., 50, 100 Au NPs and 60 nm Au/Ag NPs), the determined diameter of the Au cores was well within the certificate value with an average diameter (over the course of 5 days) corresponding to a 0.20, 2.6, and 5.0% relative difference, respectively. The in-run precision was assessed as 0.51% RSD on average for all measurements and the day-to-day %RSD being <1.03%.

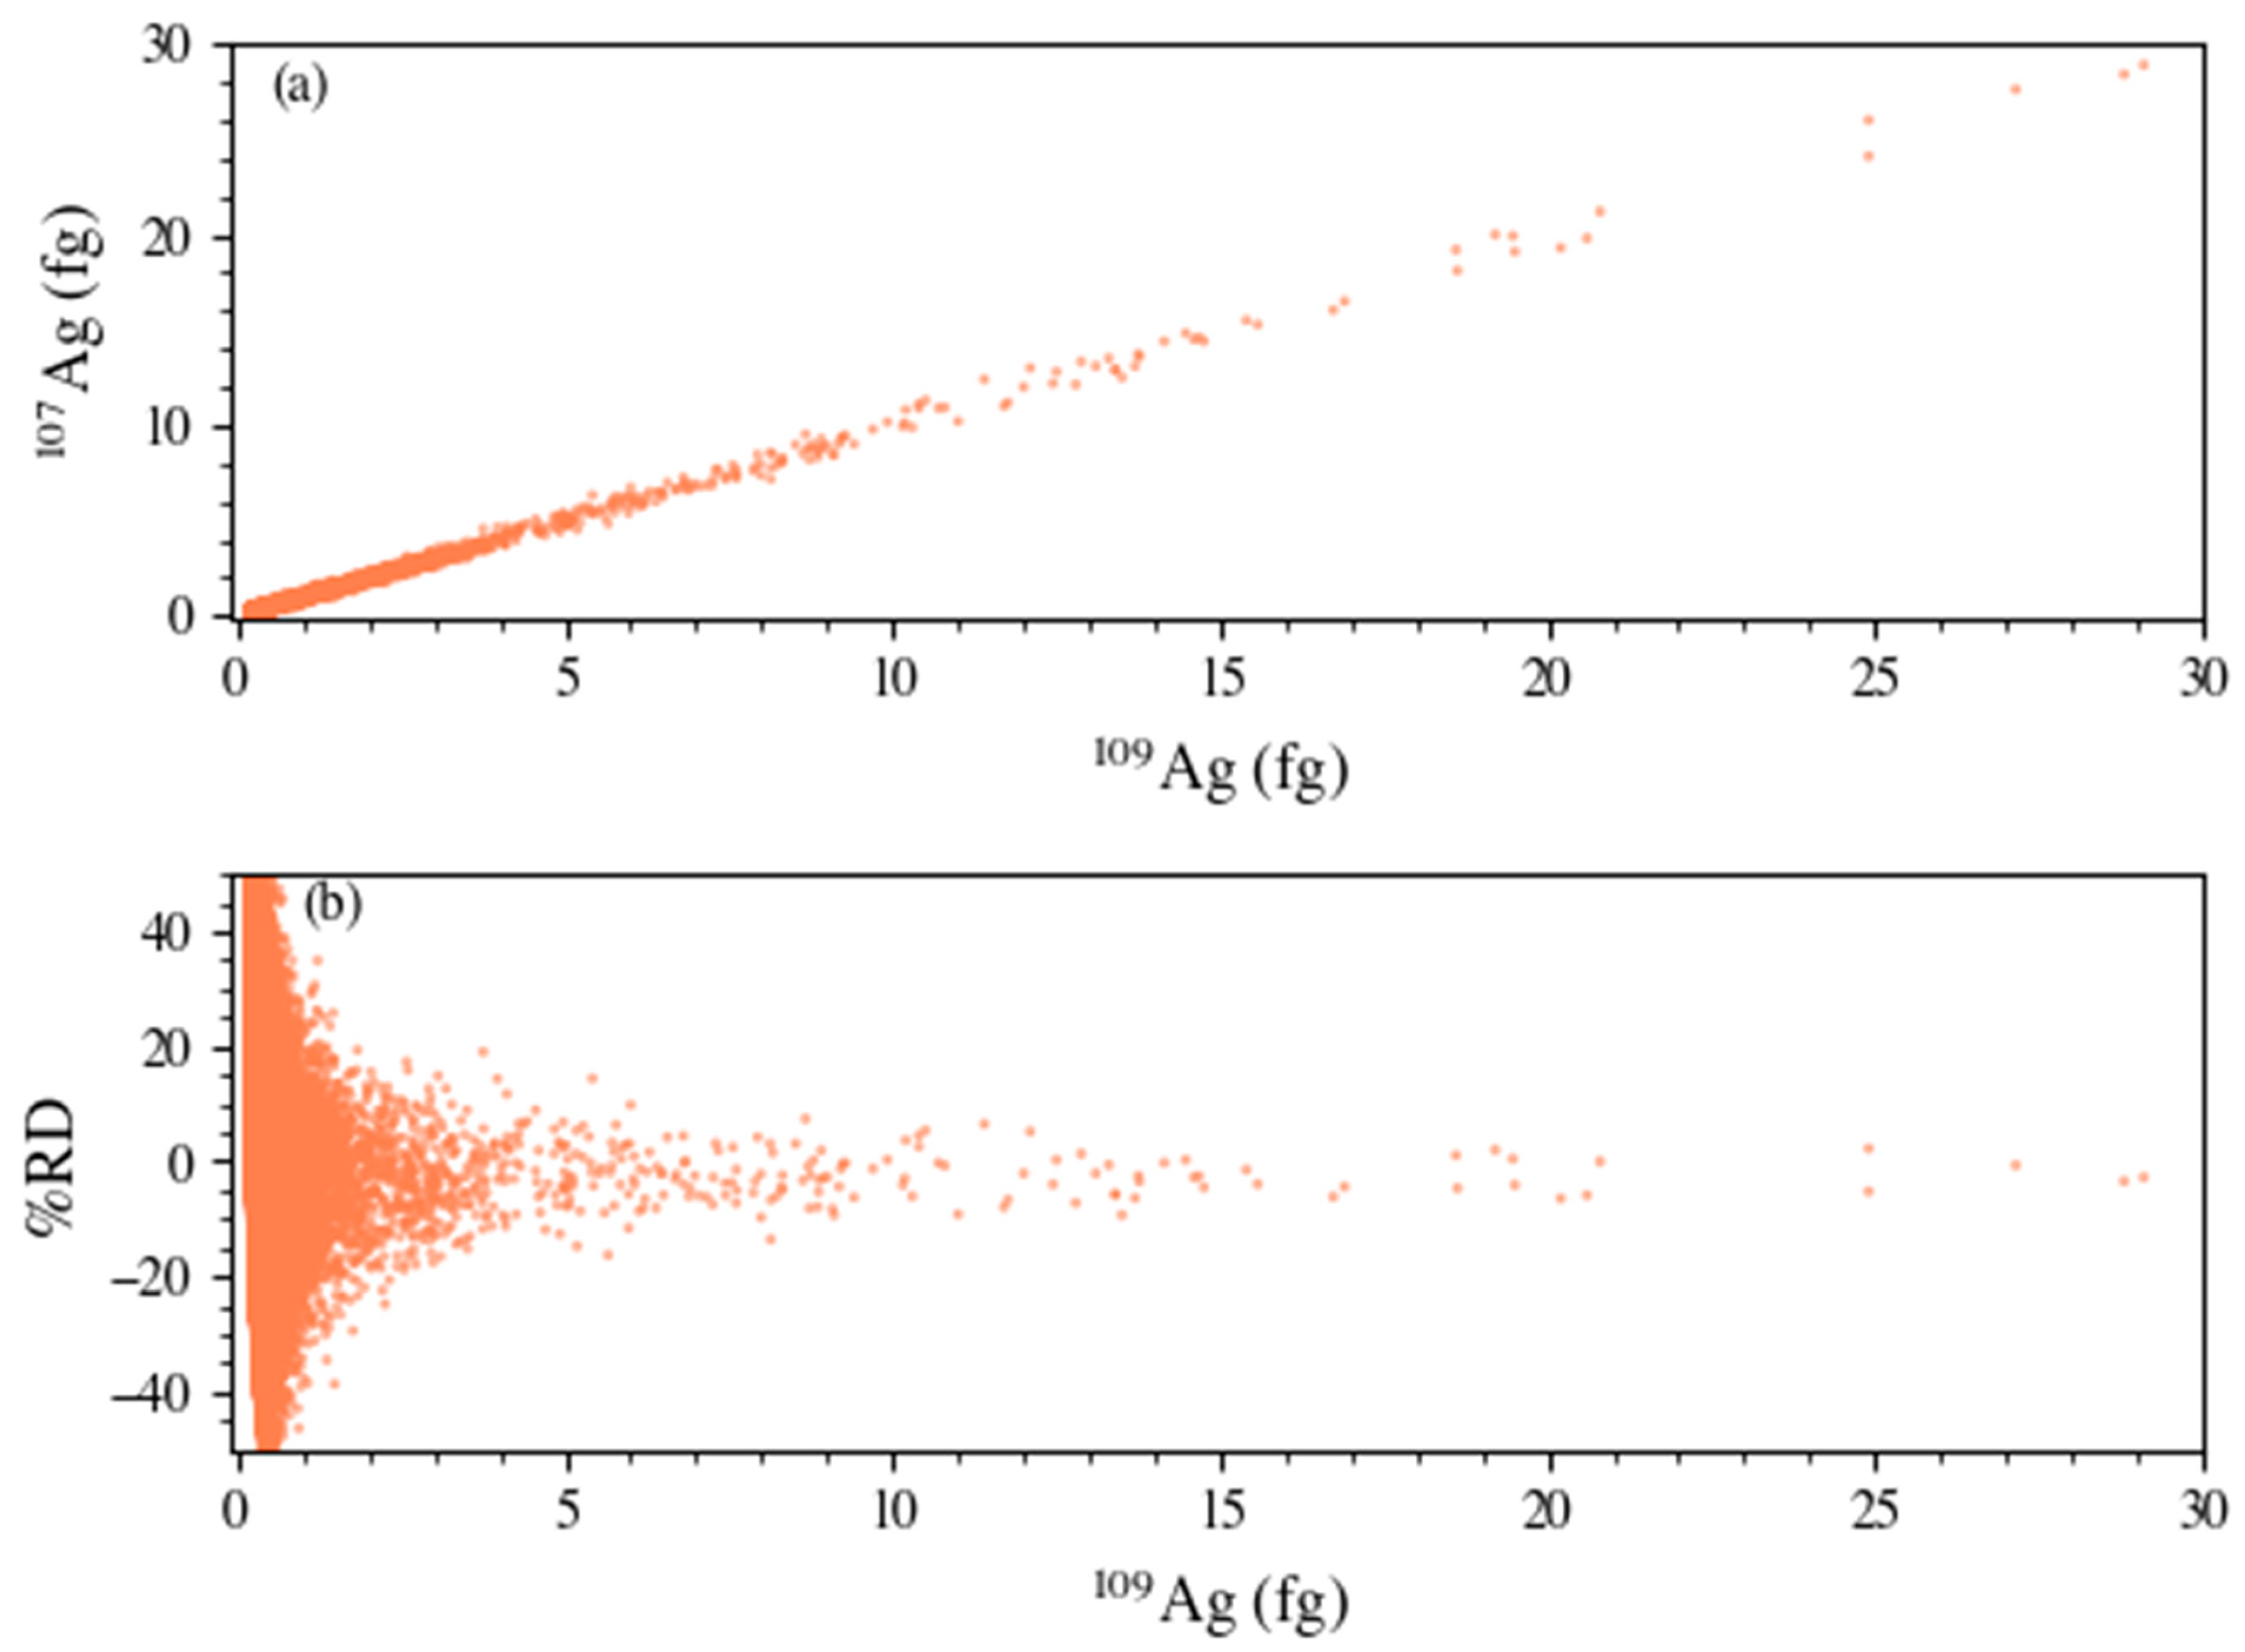
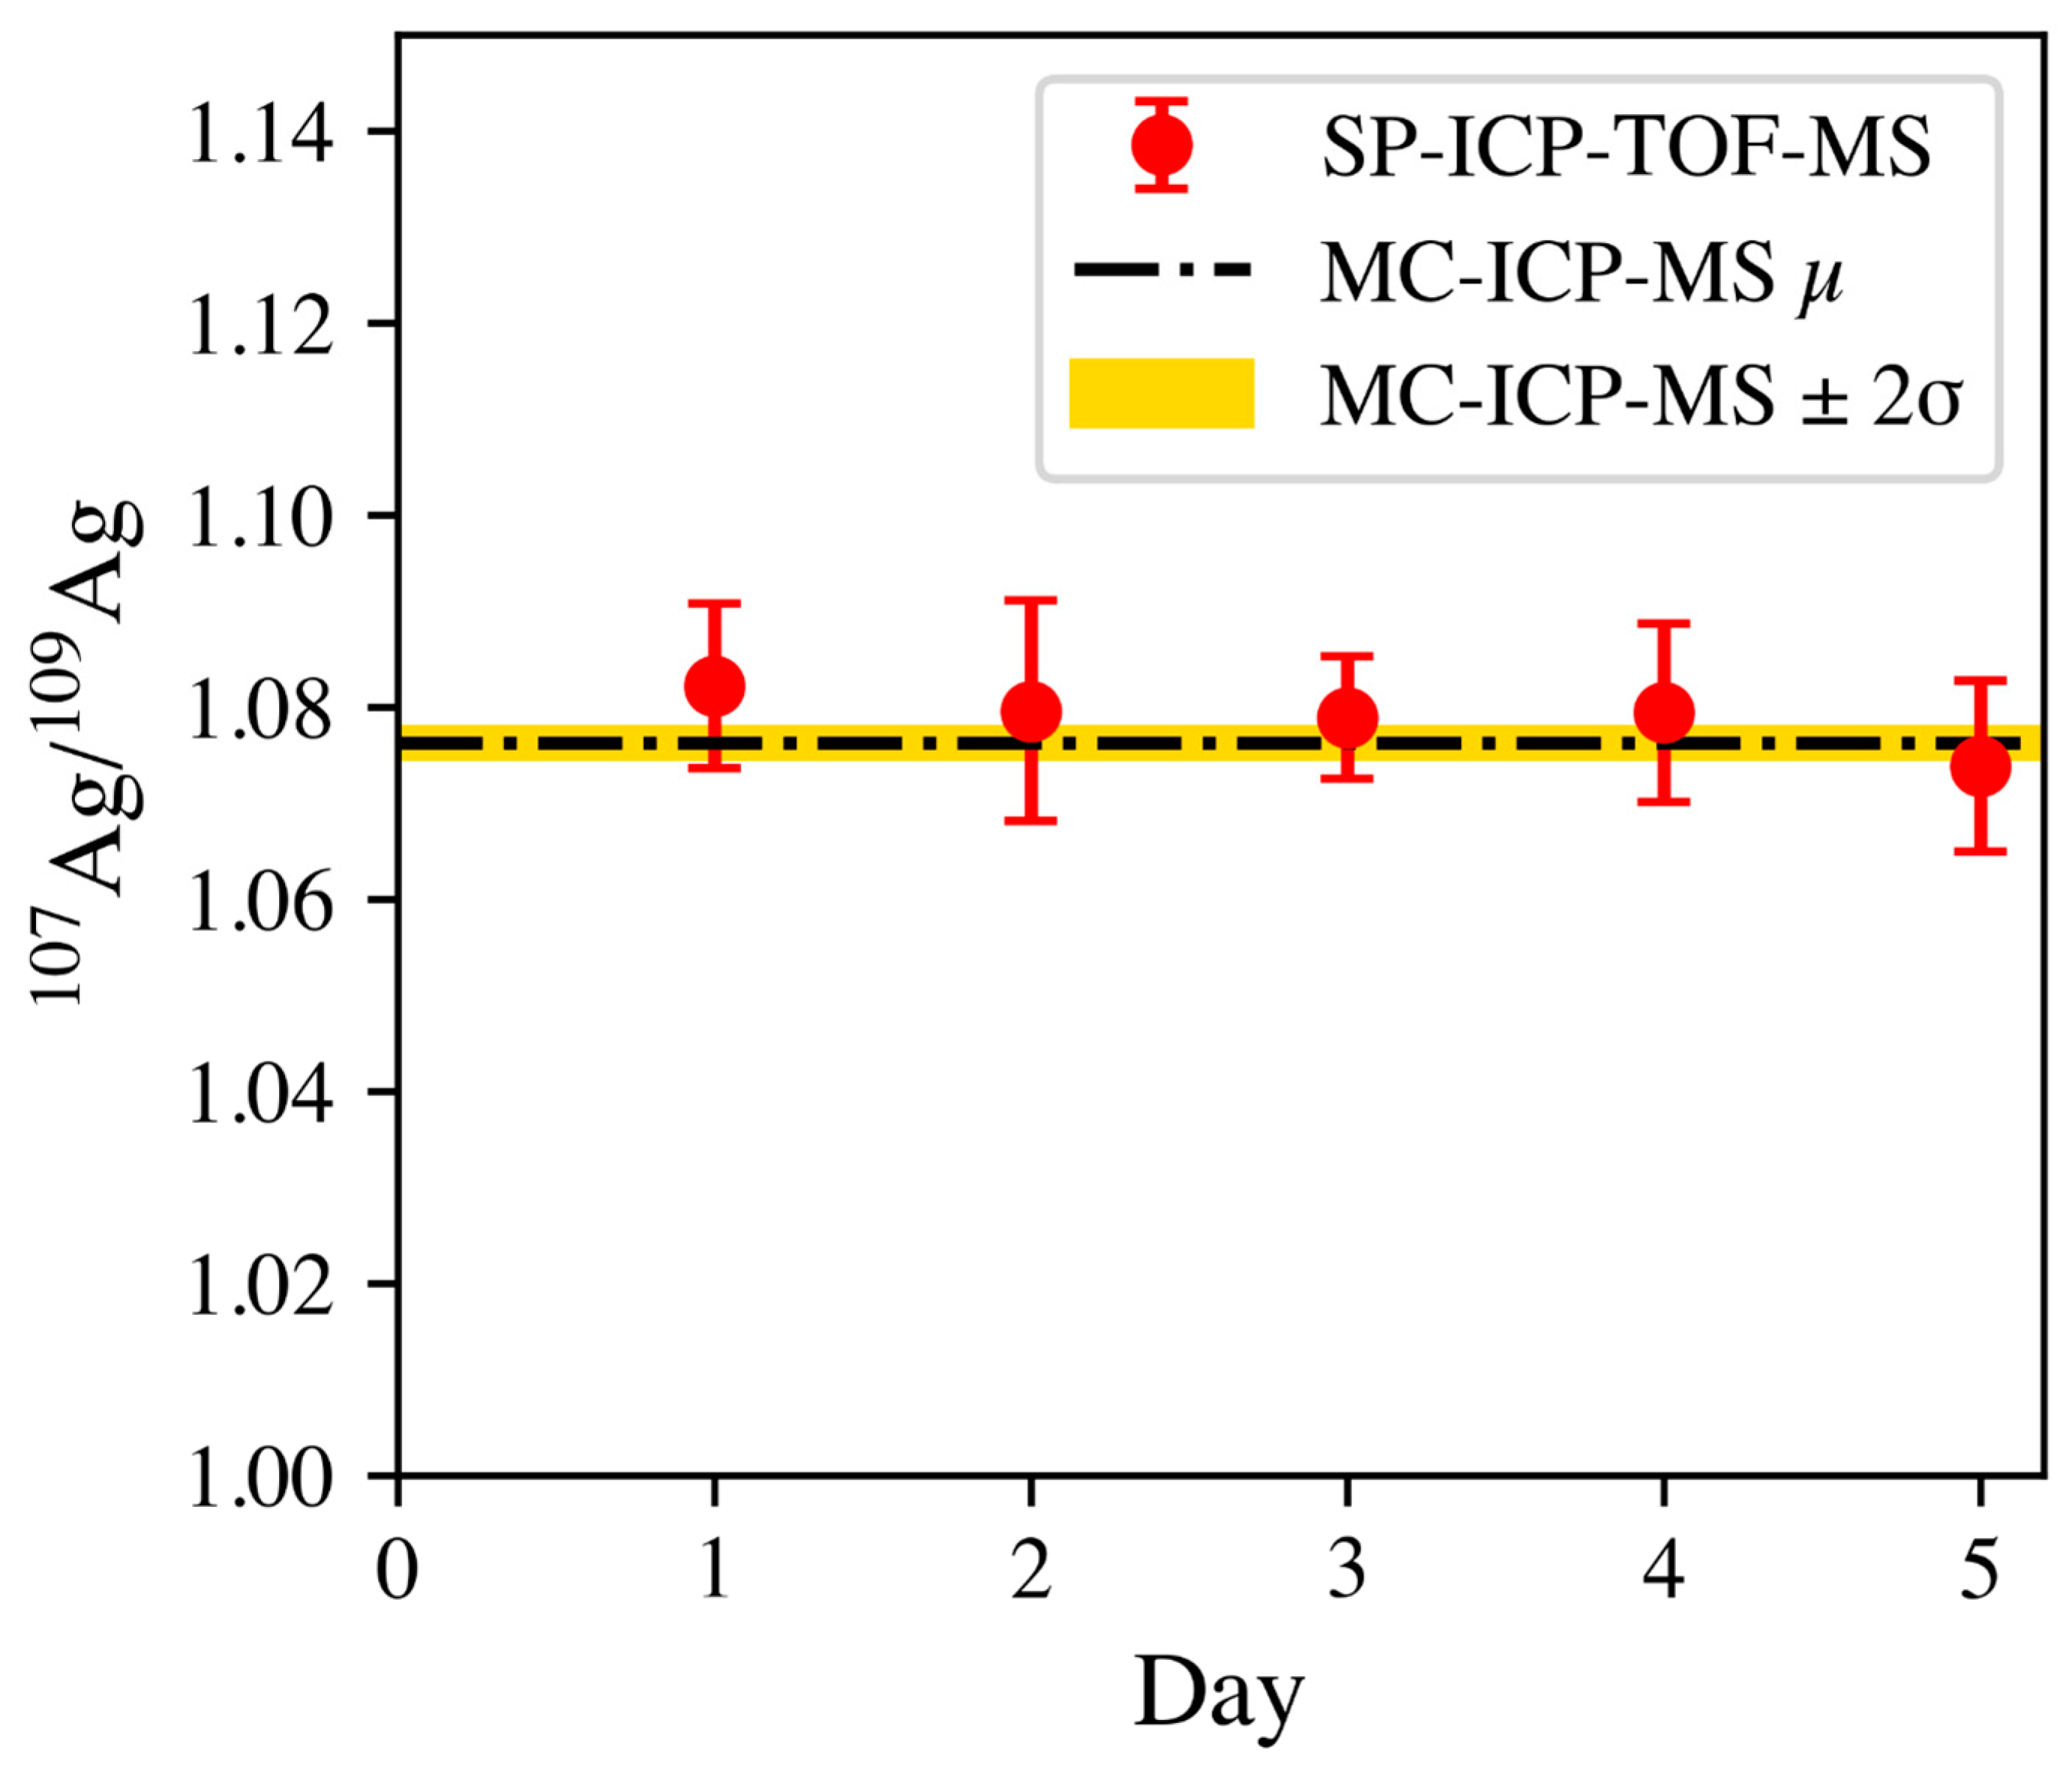
3.3. Isotopic Characterization of Nanoparticles

The isotopic ratio characterization of particles via SP-ICP-MS is of interest to various communities, including environmental [31], nuclear [32], and biological [25]. Typically, this measurement would require the ability to simultaneously measure multiple isotopes of interest, such that single particle discrimination can be achieved. To date, and the authors’ knowledge, SP-ICP-MS of suspension for isotopic determination has only been primarily investigated with either a TOF [25,31] or SF-MC [25,32,33,34] configuration, albeit a recent study demonstrated the effectiveness of a quadrupole-based ICP with the employment of O2 gas for transient broadening [23]. A recent study by Yin et al., explored the various ICP-based platforms to assess the figures of merit regarding isotope ratio measurements on single NPs and cells [25]. The conclusion for the Ag NPs (40 and 80 nm) and cells containing Ag (100 and 300 µg L−1) was that their ability to quasi-simultaneously (ICP-TOF) and simultaneously (MC-ICP-MS) outperformed the scanning quadruple-ICP-MS, as expected. Moreover, the MC-ICP-MS outperformed the ICP-TOF-MS such that all particle determinations were within ±5% deviation of the expected value, while the ICP-TOF-MS had 80% of the events within ±30%, although the ICP-TOF-MS ultimately offers the benefit of being able to monitor all isotopes of interest (e.g., 6Li–242Pu).
From the Au/Ag NPs, the 107Ag/109Ag isotope ratio was determined. For this determination, a direct mass bias correction was applied to the NPs based on the daily analysis of the Ag ionic standard. The isotopic data presented from the entirety of the study (5 days) are presented in Figure 5, which depicts the analysis of just over 132,000 particles. When looking at the mass (fg) plot (107Ag versus 109Ag) in Figure 5a, there is a strong positive and linear correlation of the data (r = 0.988), similar to what was determined by Yin et al., when comparing the ICP-TOF-MS to other ICP-based platforms [25]. Figure 5b provides an insight to the accuracy of the measurement with respect to the mass of the characterized particles. It should be noted that each 60 nm core-shell particle should contain 1 fg of Ag (0.52 and 0.48 fg for 107Ag and 109Ag, respectively). This is a significantly smaller mass than has previously been published regarding this measurement. Similar trends have been identified previously [23,33], primarily due to Poisson counting statistics such that accurate isotope ratio determination is often hindered when analyzing low signal particles. To summarize, 80.8% of the detection population was within ±30% RD, 61.6% was within ±20% RD, and 33.7% was within ±10% RD. When considering this as a function of mass, at levels > 1.8 fg and >9.2 fg, most of the respective population (≥99%) was within ±20 and 10% RD, respectively. Based on the deviation of low signal events and their impact on isotope ratio, a threshold equal to that of the largest daily LOD (0.19 fg 109Ag) was applied for the final isotope ratio calculations.
The day-to-day accuracy and precision of the isotopic determination of the Ag component within the Au/Ag NPs are presented in Figure 6. It is evident that the SP-ICP-TOF-MS method was accurate at determining this ratio when compared to the bulk digestion-based MC-ICP-MS measurement. The average ratio over the course of the days was determined to be 1.0788 ± 0.0030 (2σ) with respect to the MC-ICP-MS determination of 1.0763 ± 0.0014 (2σ). The % of RD was determined to be 0.23% over the course of the measurements.

4. Conclusions

Herein, the analysis of 50 nm Au, 100 nm Au, and 60 nm Au/Ag core-shell NPs employing an automated introduction system with ICP-TOF-MS was presented. This methodology includes sample mixing, precise injection, and efficient NP characterization. Ultimately, the sample was reproducibly delivered to the ICP-TOF-MS with an average %RSDs of 3.4% in-run and 9.5% day-to-day for the total number of detected particles per injection. Regarding the characterization of the NPs, all particle sizes were determined well within the certificate value with the day-to-day reproducibility of <1.03% RSD. The isotopic determination of the Ag shell of the 60 nm Au/Ag core-shell particle was also presented and had a strong linear correlation amongst the 107Ag/109Ag isotopic plot. The determined isotopic values of the 100,000+ particles were in excellent agreement (0.23% RD) with the comparator value from bulk digestion-MC-ICP-MS measurement. This methodology, automated sample introduction SP-ICP-TOF-MS, demonstrated its robustness and effectiveness regarding high in-run and day-to-day precision for NP characterization. This analytical technique lends itself to readily being applied to more routine applications where high-throughput particle characterization is warranted.

Author Contributions

Conceptualization, B.T.M., C.D.Q.J. and L.H.; methodology, B.T.M., L.H. and P.S.; instrument development, L.H. and P.S.; formal analysis, B.T.M., V.C.B., D.R.D., L.H. and H.B.A.; investigation, B.T.M. and V.C.B.; writing—original draft preparation, B.T.M., V.C.B. and H.B.A.; writing—review and editing, all authors; visualization, H.B.A.; supervision, B.T.M.; project administration, C.R.H.; funding acquisition, B.T.M. and H.B.A. All authors have read and agreed to the published version of the manuscript.

Funding

This work was supported by the Laboratory Directed Research and Development Program of Oak Ridge National Laboratory. This manuscript has been authored in part by UT-Battelle, LLC, under contract DE-AC05-00OR22725 with the US Department of Energy (DOE). The US government retains and the publisher, by accepting the article for publication, acknowledges that the US government retains a nonexclusive, paid-up, irrevocable, worldwide license to publish or reproduce the published form of this manuscript, or allow others to do so, for US government purposes. DOE will provide public access to these results of federally sponsored research in accordance with the DOE Public Access Plan (http://energy.gov/downloads/doe-public-access-plan, accessed on 20 March 2023).

Data Availability Statement

Data is available upon reasonable request.

Acknowledgments

The authors would like to acknowledge Laura McMahill (Elemental Scientific Inc.) for graphics support.

Conflicts of Interest

The authors declare no conflict of interest.

References

  1. Thomas, R. A Practical Guide to ICP-MS, 3rd ed.; Taylor and Francis Group: Boca Raton, FL, USA, 2013. [Google Scholar]
  2. Louvat, P.; Moureau, J.; Paris, G.; Bouchez, J.; Noireaux, J.; Gaillardet, J. A fully automated direct injection nebulizer (d-DIHEN) for MC-ICP-MS isotope analysis: Application to boron isotope ratio measurements. J. Anal. At. Spectrom. 2014, 29, 1698–1707. [Google Scholar] [CrossRef]
  3. Takasaki, Y.; Inagaki, K.; Akhmad, S.; Fujii, S.-i.; Iwahata, D.; Takatsu, A.; Chiba, K.; Umemura, T. Multielement analysis of micro-volume biological samples by ICP-MS with highly efficient sample introduction system. Talanta 2001, 87, 24–29. [Google Scholar] [CrossRef]
  4. Cao, Y.; Feng, J.; Tang, L.; Yu, C.; Mo, G.; Deng, B. A highly efficient introduction system for single cell- ICP-MS and its application to detection of copper in single human red blood cells. Talanta 2020, 206, 120174. [Google Scholar] [CrossRef]
  5. Sloop, J.T.; Bonilla, H.J.B.; Harville, T.; Jones, B.T.; Donati, G.L. Automated matrix-matching calibration using standard dilution analysis with two internal standards and a simple three-port mixing chamber. Talanta 2019, 205, 120160. [Google Scholar] [CrossRef] [PubMed]
  6. Zhu, Y.; Itoh, A.; Umemura, T.; Haraguchi, H.; Inagaki, K.; Chiba, K. Determination of REEs in natural water by ICP-MS with the aid of an automatic column changing system. J. Anal. At. Spectrom. 2010, 25, 1253–1258. [Google Scholar] [CrossRef]
  7. Manard, B.T.; Bostick, D.A.; Metzger, S.C.; Ticknor, B.W.; Zirakparvar, N.A.; Rogers, K.T.; Hexel, C.R. Rapid and automated separation of uranium ore concentrates for trace element analysis by inductively coupled plasma–optical emission spectroscopy/triple quadrupole mass spectrometry. Spectrochim. Acta Part B At. Spectrosc. 2021, 179, 106097. [Google Scholar] [CrossRef]
  8. Metzger, S.C.; Ticknor, B.W.; Rogers, K.T.; Bostick, D.A.; McBay, E.H.; Hexel, C.R. Automated separation of uranium and plutonium from environmental swipe samples for multiple collector inductively coupled plasma mass spectrometry. Anal. Chem. 2018, 90, 9441–9448. [Google Scholar] [CrossRef] [PubMed]
  9. Montoya, D.P.; Manard, B.T.; Xu, N. Novel sample introduction system to reduce ICP-OES sample size for plutonium metal trace impurity determination. J. Radioanal. Nucl. Chem. 2016, 307, 2009–2014. [Google Scholar] [CrossRef]
  10. Wylie, E.M.; Manard, B.T.; Quarles, C.D., Jr.; Meyers, L.A.; Xu, N. An automated micro-separation system for the chromatographic removal of uranium matrix for trace element analysis by ICP-OES. Talanta 2018, 189, 24–30. [Google Scholar] [CrossRef] [PubMed]
  11. Quarles, C.D., Jr.; Manard, B.T.; Wylie, E.M.; Xu, N. Trace elemental analysis of bulk uranium materials using an inline automated sample preparation technique for ICP-OES. Talanta 2018, 190, 460–465. [Google Scholar] [CrossRef] [PubMed]
  12. Quarles, C.D.; Szoltysik, M.; Sullivan, P.; Reijnen, M. A fully automated total metals and chromium speciation single platform introduction system for ICP-MS. J. Anal. At. Spectrom. 2019, 34, 284–291. [Google Scholar] [CrossRef]
  13. Romaniello, S.J.; Field, M.P.; Smith, H.B.; Gordon, G.W.; Kim, M.H.; Anbar, A.D. Fully automated chromatographic purification of Sr and Ca for isotopic analysis. J. Anal. At. Spectrom. 2015, 30, 1906–1912. [Google Scholar] [CrossRef]
  14. Quarles, C.D.; Sullivan, P.; Bohlim, N.; Saetveit, N. Rapid automated total arsenic and arsenic speciation by inductively coupled plasma mass spectrometry. J. Anal. At. Spectrom. 2022, 37, 1240–1246. [Google Scholar] [CrossRef]
  15. Quarles, C.D.; Bohlim, N.; Wiederin, K.; Saetveit, N.; Sullivan, P. Evaluation of blood and synthetic matrix-matched calibrations using manual and inline sample preparation methods. J. Anal. At. Spectrom. 2022, 37, 1512–1521. [Google Scholar] [CrossRef]
  16. Meermann, B.; Nischwitz, V. ICP-MS for the analysis at the nanoscale—A tutorial review. J. Anal. At. Spectrom. 2018, 33, 1432–1468. [Google Scholar] [CrossRef]
  17. Montaño, M.D.; Olesik, J.W.; Barber, A.G.; Challis, K.; Ranville, J.F. Single particle ICP-MS: Advances toward routine analysis of nanomaterials. Anal. Bioanal. Chem. 2016, 408, 5053–5074. [Google Scholar] [CrossRef]
  18. Mozhayeva, D.; Engelhard, C. A critical review of single particle inductively coupled plasma mass spectrometry–A step towards an ideal method for nanomaterial characterization. J. Anal. At. Spectrom. 2020, 35, 1740–1783. [Google Scholar] [CrossRef] [Green Version]
  19. Wei, X.; Zheng, D.-H.; Cai, Y.; Jiang, R.; Chen, M.-L.; Yang, T.; Xu, Z.-R.; Yu, Y.-L.; Wang, J.-H. High-throughput/high-precision sampling of single cells into ICP-MS for elucidating cellular nanoparticles. Anal. Chem. 2018, 90, 14543–14550. [Google Scholar] [CrossRef] [PubMed]
  20. Koolen, C.D.; Torrent, L.; Agarwal, A.; Meili-Borovinskaya, O.; Gasilova, N.; Li, M.; Luo, W.; Zuttel, A. High-Throughput Sizing, Counting, and Elemental Analysis of Anisotropic Multimetallic Nanoparticles with Single-Particle Inductively Coupled Plasma Mass Spectrometry. ACS Nano 2022, 16, 11968–11978. [Google Scholar] [CrossRef]
  21. Von der Au, M.; Schwinn, M.; Kuhlmeier, K.; Büchel, C.; Meermann, B. Development of an automated on-line purification HPLC single cell-ICP-MS approach for fast diatom analysis. Anal. Chim. Acta 2019, 1077, 87–94. [Google Scholar]
  22. Kocic, J.; Günther, D.; Hattendorf, B. Improving detection capability for single particle inductively coupled plasma mass spectrometry with microdroplet sample introduction. J. Anal. At. Spectrom. 2021, 36, 233–242. [Google Scholar] [CrossRef]
  23. Chun, K.-H.; Lum, J.T.-S.; Leung, K.S.-Y. Dual-elemental analysis of single particles using quadrupole-based inductively coupled plasma-mass spectrometry. Anal. Chim. Acta 2022, 1192, 339389. [Google Scholar] [CrossRef] [PubMed]
  24. Hendriks, L.; Gundlach-Graham, A.; Hattendorf, B.; Günther, D. Characterization of a new ICP-TOFMS instrument with continuous and discrete introduction of solutions. J. Anal. At. Spectrom. 2017, 32, 548–561. [Google Scholar] [CrossRef]
  25. Tian, X.; Jiang, H.; Wang, M.; Cui, W.; Guo, Y.; Zheng, L.; Hu, L.; Qu, G.; Yin, Y.; Cai, Y. Exploring the performance of quadrupole, time-of-flight, and multi-collector ICP-MS for dual-isotope detection on single nanoparticles and cells. Anal. Chim. Acta 2023, 1240, 340756. [Google Scholar] [CrossRef]
  26. Menero-Valdés, P.; Lores-Padín, A.; Fernández, B.; Quarles, C.D., Jr.; García, M.; González-Iglesias, H.; Pereiro, R. Determination and localization of specific proteins in individual ARPE-19 cells by single cell and laser ablation ICP-MS using iridium nanoclusters as label. Talanta 2023, 253, 123974. [Google Scholar] [CrossRef] [PubMed]
  27. Gundlach-Graham, A.; Hendriks, L.; Mehrabi, K.; Günther, D. Monte Carlo simulation of low-count signals in time-of-flight mass spectrometry and its application to single-particle detection. Anal. Chem. 2018, 90, 11847–11855. [Google Scholar] [CrossRef] [Green Version]
  28. Pace, H.E.; Rogers, N.J.; Jarolimek, C.; Coleman, V.A.; Higgins, C.P.; Ranville, J.F. Determining transport efficiency for the purpose of counting and sizing nanoparticles via single particle inductively coupled plasma mass spectrometry. Anal. Chem. 2011, 83, 9361–9369. [Google Scholar] [CrossRef] [PubMed] [Green Version]
  29. Pace, H.E.; Rogers, N.J.; Jarolimek, C.; Coleman, V.A.; Gray, E.P.; Higgins, C.P.; Ranville, J.F. Single particle inductively coupled plasma-mass spectrometry: A performance evaluation and method comparison in the determination of nanoparticle size. Environ. Sci. Technol. 2012, 46, 12272–12280. [Google Scholar] [CrossRef]
  30. Montoro Bustos, A.R.; Petersen, E.J.; Possolo, A.; Winchester, M.R. Post hoc interlaboratory comparison of single particle ICP-MS size measurements of NIST gold nanoparticle reference materials. Anal. Chem. 2015, 87, 8809–8817. [Google Scholar] [CrossRef] [PubMed]
  31. Bland, G.D.; Zhang, P.; Valsami-Jones, E.; Lowry, G.V. Application of Isotopically Labeled Engineered Nanomaterials for Detection and Quantification in Soils via Single-Particle Inductively Coupled Plasma Time-of-Flight Mass Spectrometry. Environ. Sci. Technol. 2022, 56, 15584–15593. [Google Scholar] [CrossRef]
  32. Su, Y.; Wang, W.; Li, Z.; Deng, H.; Zhou, G.; Xu, J.; Ren, X. Direct detection and isotope analysis of individual particles in suspension by single particle mode MC-ICP-MS for nuclear safety. J. Anal. At. Spectrom. 2015, 30, 1184–1190. [Google Scholar]
  33. Yamashita, S.; Ishida, M.; Suzuki, T.; Nakazato, M.; Hirata, T. Isotopic analysis of platinum from single nanoparticles using a high-time resolution multiple collector Inductively Coupled Plasma-Mass Spectroscopy. Spectrochim. Acta Part B 2020, 169, 105881. [Google Scholar] [CrossRef]
  34. Yamashita, S.; Yamamoto, K.; Takahashi, H.; Hirata, T. Size and isotopic ratio measurements of individual nanoparticles by a continuous ion-monitoring method using Faraday detectors equipped on a multi-collector-ICP-mass spectrometer. J. Anal. At. Spectrom. 2022, 37, 178–184. [Google Scholar] [CrossRef]
Figure 1. Illustration of the single particle (SP)-ICP-TOF-MS setup.
Nanomaterials 13 01322 g001
Figure 2. Detection of 50 nm Au (red), 100 nm Au (blue), and 60 nm Au/Ag core-shell (green) NPs presented as the average number of events within the replicate injections [50 nm NPs: n = 10, 100 nm and 60 nm Au/Ag NPs: n = 11] with its respective standard deviation (2σ) over the course of 5 days.
Nanomaterials 13 01322 g002
Figure 3. Representative demonstration of particle size calculation for the 50 nm Au NPs (n = 10) based on the (a) counts, (b) mass, and (c) calculated size presented as histograms regarding the frequencies of events.
Nanomaterials 13 01322 g003
Figure 4. Determination of the Au diameter by SP-ICP-TOF-MS presented for the 50 nm Au, 100 nm Au, and 60 nm Au/Ag NPs presented with the individual sample measurements for each day over the course of 5 days. Each day is presented with its average value (black line) and standard deviation at 2σ (orange shaded box). All data are compared to the certified value (orange dashed line) with its respective standard deviation (yellow shaded box).
Nanomaterials 13 01322 g004
Figure 5. Isotopic analysis of the 107Ag and 109Ag isotopes of the Au/Ag NPs represented as a mass plot (a) and a percent relative difference plot with respect to mass (b).
Nanomaterials 13 01322 g005
Figure 6. Depiction of the 107Ag/109Ag isotope ratio, determined by SP-ICP-TOF-MS, over the course of 5 days with respect to the determined value via bulk digestion-MC-ICP-MS (dashed line).
Nanomaterials 13 01322 g006
Table 1. Relevant characteristics of the nanoparticle samples.
Characteristic50 nm Au100 nm Au60 nm Ag/Au Core Shells
Diameter (nm)51.0 ± 1.9102.2 ± 4.259 ± 6 (total)
Au = 30 ± 3
Ag = 15 (calculated)
Surface Area (m2g−1)6.13.08.5
Mass Concentration (g L−1)0.0530.0530.8 (Ag); 0.24 (Au)
Particle Concentration
(particles mL−1)
3.9 × 10104.9 × 1098 × 1011
Working Particle Concentration (particles mL−1)3.9 × 1044.9 × 1048 × 104
Table 2. Autosampler sample introduction procedure.
StepActionVolume (µL)Speed
(µL min−1)
1Probe descends into sample vial
2–5Sample mixing3000
6Fill sample loop1502000
7Probe ascends
8Probe moves to rinse
9Probe descends into rinse
10Dispense from sample loop to ICP-MS10010
11Fill sample loop from rinse100025,000
12Probe moves to waste
13Dispense100025,000
14Probe moves to rinse
15Fill sample loop from rinse100025,000
16Probe moves to waste
17Dispense100025,000
Table 3. Single Particle (SP)-ICP-MS example sequence with respective integration (ms) and acquisition (s) time.
SampleIntegration Time (ms)Acquisition Time (s)
DI Water (×3)10060
Au standards (1, 5, 10 ng mL−1)10060
DI Water 10060
Ag standards (1, 5, 10 ng mL−1)10060
DI Water10060
50 nm Au NPs (×11)2450
DI Water10060
60 nm Au/Ag core-shell NPs (×11)2450
DI Water10060
100 nm Au NPs (×11)2450
DI Water10060
Disclaimer/Publisher’s Note: The statements, opinions and data contained in all publications are solely those of the individual author(s) and contributor(s) and not of MDPI and/or the editor(s). MDPI and/or the editor(s) disclaim responsibility for any injury to people or property resulting from any ideas, methods, instructions or products referred to in the content.

