Article

Temperature-Dependent Anisotropic Refractive Index in β-Ga2O3: Application in Interferometric Thermometers

1
Department Materials Physics, Faculty of Physics, Complutense University of Madrid, 28040 Madrid, Spain
2
Laser Processing Group, Instituto de Óptica (IO, CSIC), Serrano 121, 28006 Madrid, Spain
3
Institute of Solid State Physics, University of Bremen, Otto-Hahn-Allee 1, 28359 Bremen, Germany
4
Department de Física, Facultad de Ciencia y Tecnología, Universidad del País Vasco UPV/EHU, Apdo. 644, 48080 Bilbao, Spain
5
Crystals and Semiconductors Group, Institute of Materials Research, Washington State University, Pullman, WA 99164, USA
*
Author to whom correspondence should be addressed.
Nanomaterials 2023, 13(6), 1126; https://doi.org/10.3390/nano13061126
Submission received: 24 February 2023 / Revised: 17 March 2023 / Accepted: 19 March 2023 / Published: 21 March 2023

Abstract

:
An accurate knowledge of the optical properties of β-Ga2O3 is key to developing the full potential of this oxide for photonics applications. In particular, the dependence of these properties on temperature is still being studied. Optical micro- and nanocavities are promising for a wide range of applications. They can be created within microwires and nanowires via distributed Bragg reflectors (DBR), i.e., periodic patterns of the refractive index in dielectric materials, acting as tunable mirrors. In this work, the effect of temperature on the anisotropic refractive index of β-Ga2O3 n(λ,T) was analyzed with ellipsometry in a bulk crystal, and temperature-dependent dispersion relations were obtained, with them being fitted to Sellmeier formalism in the visible range. Micro-photoluminescence (μ-PL) spectroscopy of microcavities that developed within Cr-doped β-Ga2O3 nanowires shows the characteristic thermal shift of red–infrared Fabry–Perot optical resonances when excited with different laser powers. The origin of this shift is mainly related to the variation in the temperature of the refractive index. A comparison of these two experimental results was performed by finite-difference time-domain (FDTD) simulations, considering the exact morphology of the wires and the temperature-dependent, anisotropic refractive index. The shifts caused by temperature variations observed by μ-PL are similar, though slightly larger than those obtained with FDTD when implementing the n(λ,T) obtained with ellipsometry. The thermo-optic coefficient was calculated.

1. Introduction

Gallium oxide in its monoclinic phase, β-Ga2O3, is the most stable among the different polytypes of this oxide and has been increasingly studied during the last six decades. It presents exceptional optical and electronic properties including an ultra-wide bandgap (4.9 eV) and a very high critical electric field, as well as very high thermal and chemical stability and radiation resistance [1]. Due to all of these properties, it is considered one of the most promising semiconductors for high power devices [2]. In addition, β-Ga2O3 (from now on, this phase will be indicated as Ga2O3) offers strong potential in photonics applications. For example, Ga2O3 thin films have been proposed in solar-blind ultraviolet (UV) photodetectors for fire/flame detection [3], while tunable luminescent devices based on bulk [4,5] or nanocrystalline Ga2O3 [6] have also been proposed. As a wide bandgap material, Ga2O3 shows tunable luminescence when suitably doped with optically active impurities.
Semiconducting quasi-1 dimensional (1D) micro- and nanowires (μW and nW) allow the miniaturization and optimization of several photonic devices because their optical properties can be controlled by modifying the material and/or by patterning artificial optical structures, among which optical microcavities are key elements. One type of photonic structure used to create optical microcavities is the distributed Bragg reflector (DBR): a structure where the refractive index varies periodically in space along a specific direction. This results in forbidden frequency bands for light propagation, also called stopbands. Electromagnetic waves with these frequencies cannot propagate along the axis perpendicular to the DBR interfaces; hence, they are mostly reflected. In a μW or nW that emits a luminescence band, a couple of correctly designed DBRs that reflect such a band along the wire axis result in the effective spatial confinement of the band due to a combination of total internal reflection, i.e., waveguiding, and reflections in the DBRs. This gives rise to resonance frequencies that can be analyzed as longitudinal, Fabry–Perot (F-P).
Recently, we proposed optical microcavities based on distributed Bragg reflector (DBR) patterning created by focused ion beam (FIB) lithography in Cr-doped Ga2O3 μW or nW, working in the near-infrared (near-IR) or near-UV ranges [7,8]. Furthermore, we demonstrated the application of such cavities as micrometer dimensioned, wide dynamical range thermometers [9]. Part of this application is based on the temperature dependence of the Ga2O3 anisotropic refractive index.
Progress on the applications of Ga2O3 in photonic devices requires the knowledge of the dispersion relations, i.e., wavelength-dependent refractive index, as a function of temperature, n(λ,T). Furthermore, the inherent anisotropy of the monoclinic Ga2O3 phase is also translated into unique light–matter interaction in this oxide; hence, a rigorous study of dispersion relations in Ga2O3 should incorporate the anisotropic effects. A full study of n(λ,T) in this oxide still needs to be further discussed. Indeed, even though it is of great importance for the application of this very relevant material in photonics, just a few studies have been reported [9,10,11,12]. The work by Bhaumik et al. [10] used the prism method to obtain the refractive index at temperatures between room temperature (RT, 25 °C, i.e., 298 K) and 200 °C (473 K). However, the characterization was only performed for the refractive index along two crystal directions, i.e., [010] and perp.(100). On the other hand, Sturm et al. [11] used ellipsometry, and the analysis is similar to the one presented in this work. Nonetheless, there is a main difference because they studied the variation in the refractive index at low temperatures—from 10 K to 300 K (room temperature)—while we report data in the 295 K to 595 K range. It is not straightforward that the evolution of the refractive index at low temperatures can be extrapolated to higher temperatures.
In this paper, we fully analyze the refractive index temperature dependence in the three main crystal axes with the assistance of variable angle spectroscopic ellipsometry. Using that temperature dependence, complete simulations are performed, showing their accuracy by comparing them with the experimental μ-PL results in an actual microcavity where local temperature is varied by changing the excitation power of the laser.

2. Materials and Methods

Unintentionally doped (UID) Ga2O3 bulk crystal and Cr-doped Ga2O3 nW, both with (100) surfaces, were used to assess the anisotropic refractive index of Ga2O3 and optical resonances as a function of the temperature. All materials exhibit the monoclinic β-phase [9,13]. Bulk unintentionally doped (UID) crystals were grown by the Czochralski and vertical gradient freeze techniques, as recently summarized [13]. Cr-doped Ga2O3 nW were obtained by controlled thermally treated metal Ga at 1500 °C for 15 h under atmosphere conditions [7]. Selected nW were placed on a TEM grid and subsequently patterned with a FIB, FEI Helios NanoLab 650, in order to produce the designed DBRs that act as optical mirrors in an F-P cavity scheme, as described elsewhere [7,9]. In this way, an optical cavity with length in the range of micrometers successfully confines optical modes in the red range (690–750 nm), suitable for the Cr3+ intraionic emissions.
FDTD simulations were performed with the commercial OptiFDTD software, by Optiwave, to calculate the reflectivity of the DBRs, as well as the wavelength of the optical resonances resulting from the optical cavities at different temperatures using different models of n(λ,T).
The morphology of the optical cavities based on Ga2O3-microwires was assessed by scanning electron microscopy (SEM) in an FEI Inspec instrument. Micro-photoluminescence (µPL) was carried out in a Horiba Jobin Yvon LabRAM HR800 confocal microscope, with an HeCd 325 nm or a HeNe 632.8 nm lasers as excitation sources. The excitation power was selected by using filters with different optical densities, OD 0.3, 0.6, 1 or 2. The aims of the experiments in the confocal microscope were twofold: (i) to assess the optical F-P resonances and (ii) to use the laser as a local heat source to increase sample temperature.
The ellipsometry measurements were carried out with a Woollam VASE ellipsometer on bulk Ga2O3 (100)-oriented crystals placed onto a hot plate that allows controlled sample heating and cooling (INSTEC equipment). The crystal was glued to the surface of the hot plate with silver paint in order to optimize the heat transfer. The ellipsometry data were acquired and analyzed with the WVASE software using the Mueller matrix formalism as described in the work by Schubert et al. [14]. This approach is necessary due to the anisotropic nature of the β-Ga2O3 crystal and allows the optical sample properties at a given angle of incidence and sample orientation to be obtained. In this approach, the measured data must be analyzed through a best-match model calculation procedure. It should be noted that spectroscopic ellipsometry is an indirect method and requires detailed model analysis procedures in order to extract relevant physical parameters. In this work, the fitting was performed using input data acquired in two different orientations perpendicular to each other. The orientations were defined using proper Euler angles with the ZXZ convention. The orientations used correspond to Euler angles (0, 90, 90) and (90, 90, 90), as shown in Figure S1 in Supplementary Materials. As light incidence angles, we used 60°, 65° and 70°. The wavelength range of the measurement was from 600 nm to 1200 nm. Figure 1 shows a sketch of the orientations of the crystal and the reference system, for both microwires and bulk crystals.

3. Results and Discussion

3.1. Temperature Dependence of the Refractive Index

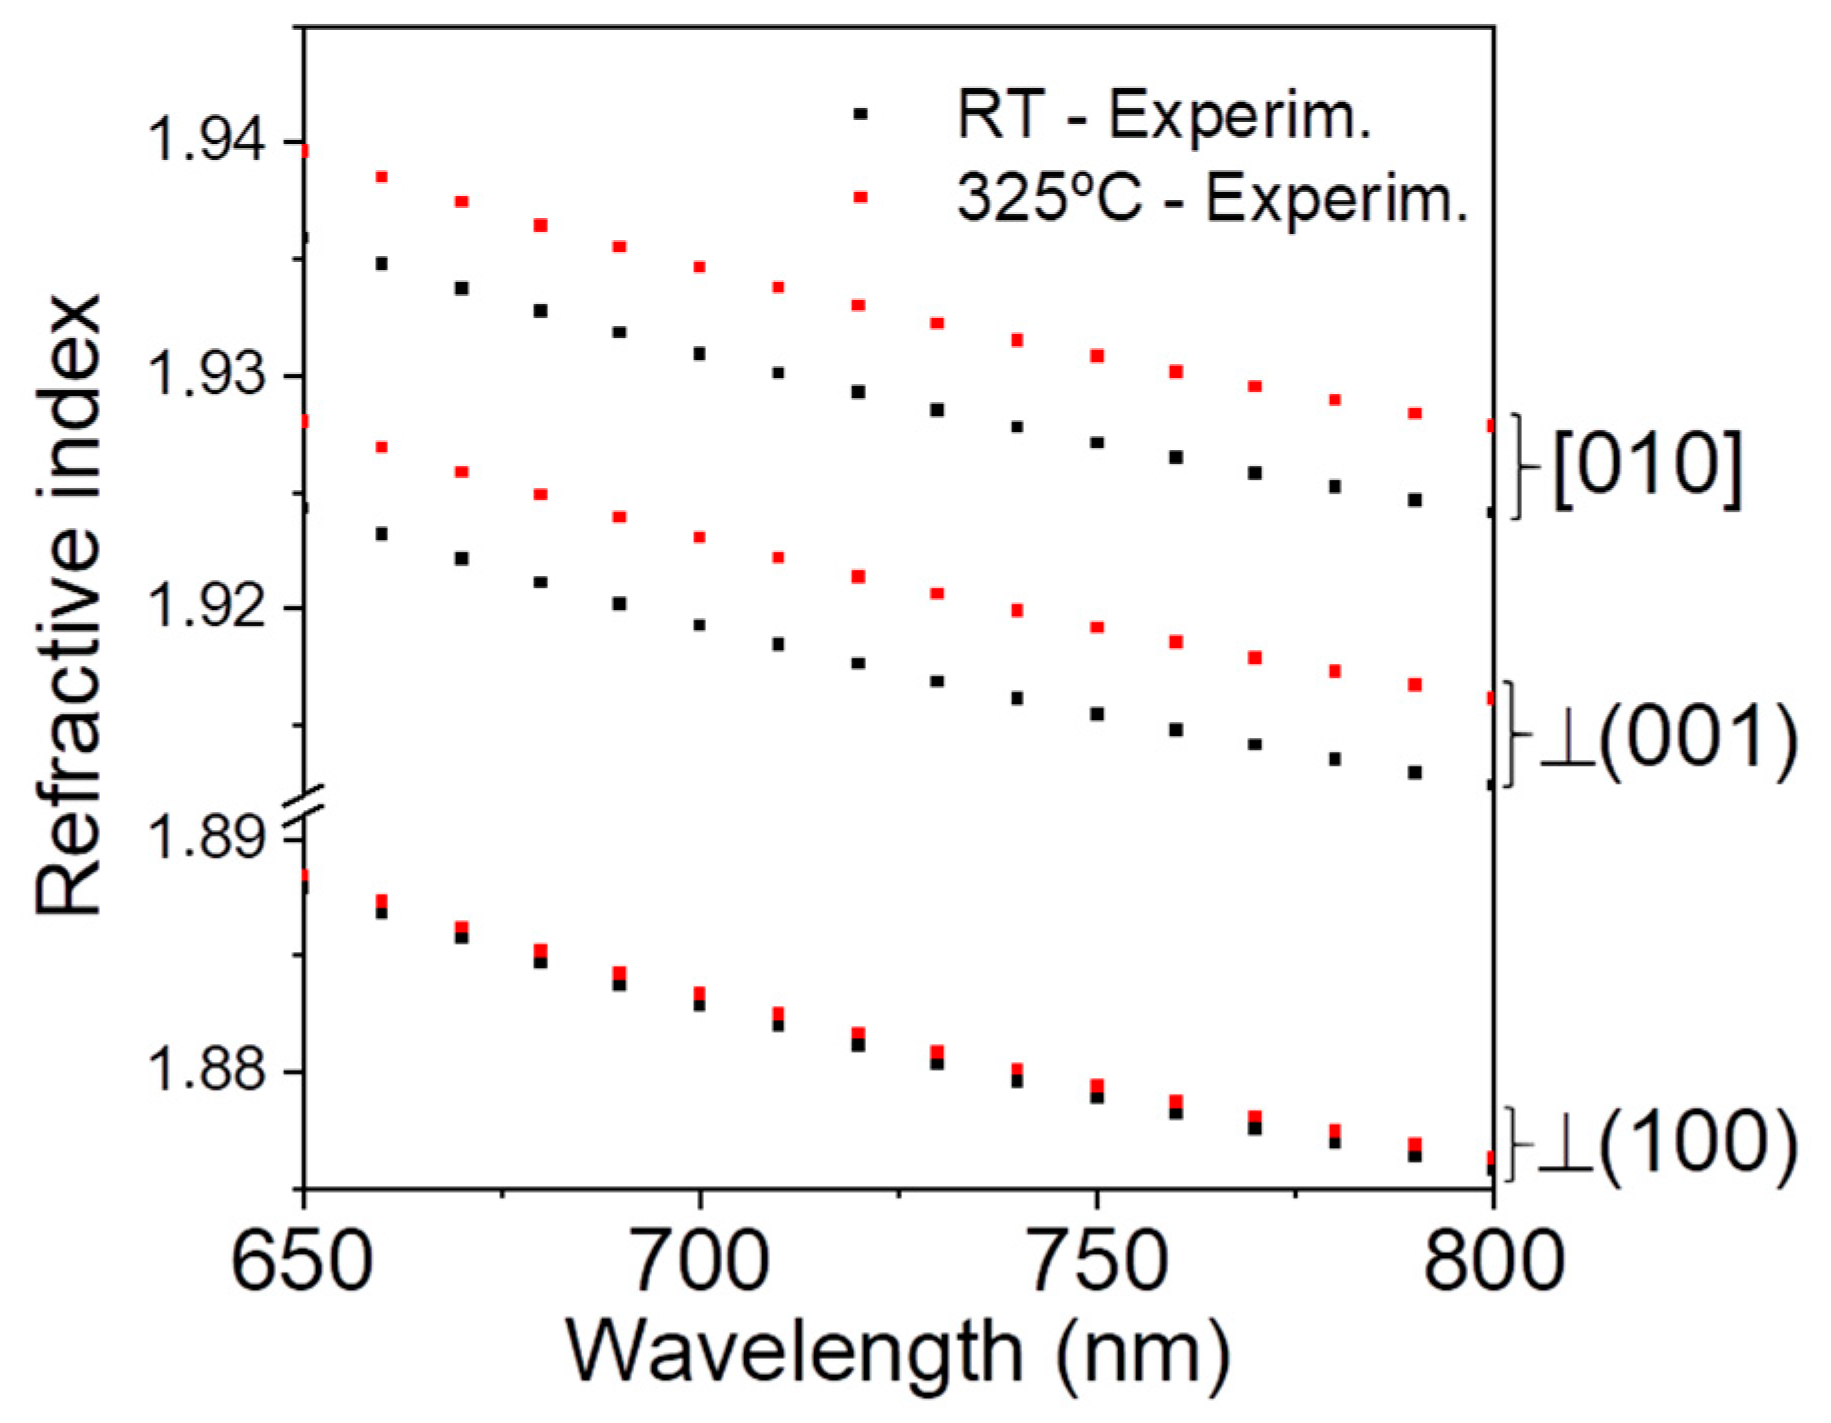
In order to obtain the temperature dependence of the dispersion relations in Ga2O3 in the visible range, where there is no absorption, ellipsometry analysis in a bulk (100) crystal at different temperatures was carried out. To analyze the ellipsometric data, we used the Mueller matrix formalism that enables the simultaneous fit of all the data measured at different angles and orientations [11,14,15]. Sturm et al. calculated the dielectric function (DF) tensor both at room temperature (RT) [15] and considering its temperature dependence in the range from 10 K to RT [11], where they reported a non-zero value for one of the non-diagonal terms. In the present work, dispersion relations were represented with Sellmeier formalism, considering the anisotropic nature of the crystal. This formalism was chosen because it is the one used in the OptiFDTD software. Figure 2 shows the refractive index values of the bulk sample derived from the ellipsometry measurements at room temperature, RT (298 K) and at 598 K. As it can be seen, a clear increase in the refractive indices when increasing T is observed for n(010) and n(001), while a much lower increment is obtained for n(100). The results are in agreement with previous works that used Mueller matrix formalism [11,14,15]. It is worth mentioning that slight variations were obtained in the different works at room temperature, showing uncertainty in the quantitative evaluation of the dielectric function.
The experimental points displayed in Figure 2 were fitted to the Sellmeier equation at each temperature, according to:
n j 2 ( λ , T ) = ε 1 , j ( T ) + A λ 2 λ 2 λ i 2
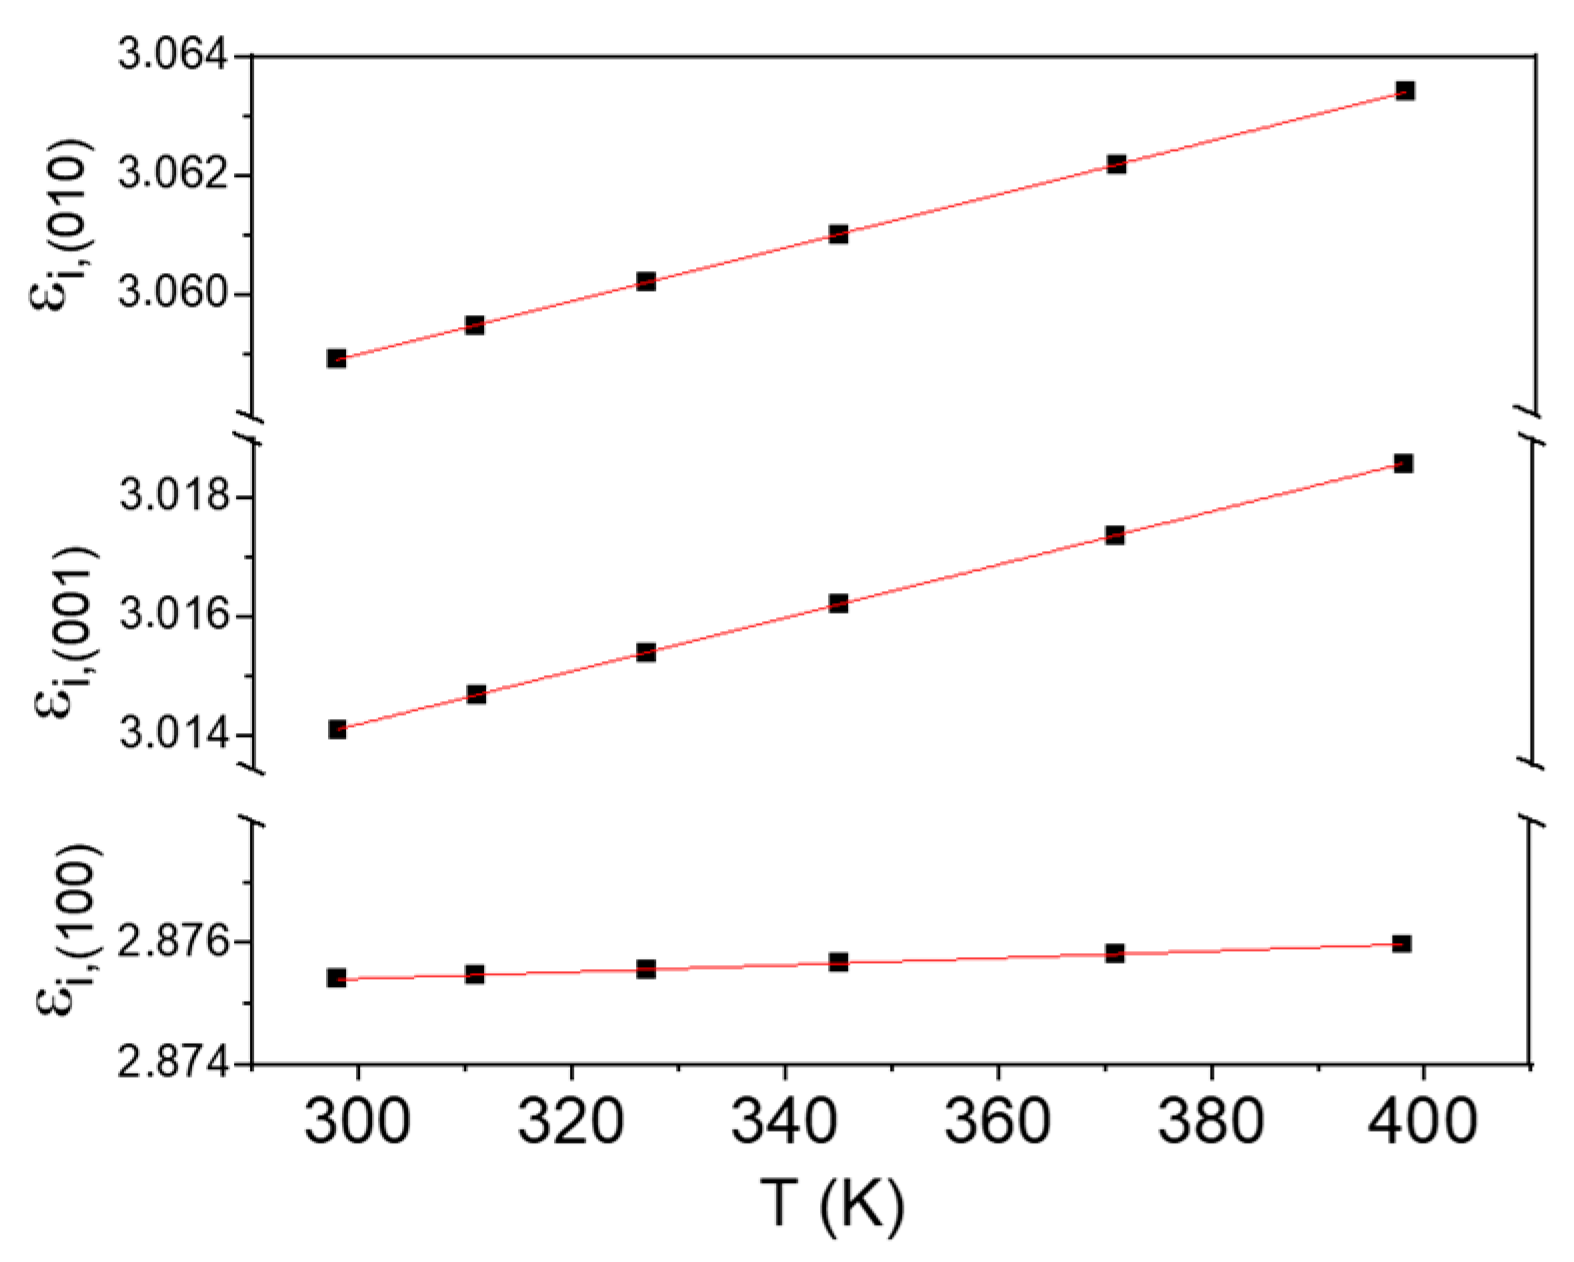
where A and λi are Sellmeier parameters, which we let be the same for the three directions and be temperature-independent; nj(λ,T) is the temperature-dependent (T-dependent) dispersion relation for each main crystal direction, i.e., j = (100), (010), (001); finally, εi,j(T) is the T-dependent static dielectric permittivity for direction j. These different, anisotropic values are used for FDTD simulations of both individual DBR reflectivity and light resonances in the Ga2O3 optical cavity, as described below. The εi,j (T) curves, as obtained from the fit of the ellipsometry data to the Sellmeier equation in the 300–400 K temperature range, are displayed in Figure 3. εi,j(T) show good fits to quadratic expressions (solid lines), in agreement with the dependence reported for other semiconducting materials [16]. Table 1 shows the explicit expressions of εi,j(T) obtained from these fits.

3.2. Fabry–Perot Resonances in Ga2O3 Optical Cavities

The previous results of the anisotropic nj(λ,T) are valuable in the analysis of photonic devices. Optical resonances in F-P cavities based on DBR mirrors built in a Cr-doped Ga2O3 nW, as described in the Experimental section, were analyzed. Figure 4a shows the SEM image of one analyzed microcavity. The cavity length between the DBRs is L = 13.0+/−0.1 μm, as it results from the SEM measurements. The comparison between room temperature (RT) μ-PL spectra from an as-grown nW and that of the microcavity are shown in Figure 4b. Excitation was obtained with the UV laser and an OD2 filter at RT. The spectral features of Cr3+-related intraionic transitions in the Ga2O3 host were observed: the sharp R lines at 689.8 and 696.6 nm (2E–4A2) as well as the phonon-assisted, broad band (4T24A2) [9,17,18]. Moreover, in the case of the microcavity, on top of the broad luminescence band, several sharp lines were observed, which were due to the F-P resonances caused by the spatial confinement of light. The detail of these resonances is shown in Figure 4c, where four main F-P peaks are well-defined at 714.2 nm, 723.0 nm, 732.1 nm and 741.3 nm. They were labeled #1, #2, #3 and #4, respectively. These peaks were previously shown to be of great interest for thermal sensing in a wide dynamic range (150–500 K) due to the nearly linear spectral redshift that they experience when the local temperature of the microcavity is increased. Furthermore, by μ-PL from one of these optical cavities introduced first in a cryostat and later in a heater, the calibration curves for the shift of these peaks were obtained between 150 K and 400 K for this sensing aim. The dependence of the peak positions with respect to temperature were nearly linear and are quantitatively expressed by the following expressions:
λ # 2 ( T ) = λ # 2 ( 295 K ) + 1.15 10 5 T 2 + 5.5 10 3 T 2.65
λ # 3 ( T ) = λ # 3 ( 295 K ) + 1.14 10 5 T 2 + 6.1 10 3 T 2.8
λ # 4 ( T ) = λ # 4 ( 295 K ) + 1.19 10 5 T 2 + 6.2 10 3 T 2.91
where λ is expressed in nm and T in K. [9].
Figure 4d shows detailed μ-PL spectra of peak #3 when the microcavity was excited with the red laser at different powers, showing a redshift as excitation power increased. The resonant peaks of the PL spectra were fitted to Lorentzian functions to obtain their position. Figure S4 in the Supplementary Materials shows the excellent fit with the Lorentzian curves of the experimental PL peaks at three excitation powers for peaks #3 and #4, with an uncertainty of the peak position Δλ = 0.002 nm. The center and the width of the Lorentzian peaks are shown in Table 2. The shift is a consequence of the local heating of the microcavity as the laser power increases, raising its local temperature from 299 K up to 360 K, as calculated from Equation (2b). These data were later used to compare the position of the experimental F-P resonances at different temperatures with those obtained by FDTD simulations.
The physical mechanism for the redshift of the F-P resonances is mainly the variation in the refractive index, n(T), and, to a lesser extent, thermal expansion of the microcavity with temperature, as described by the following equation:
d λ m d T = λ m 1 n λ m d n d T λ m + 1 L d L d T = λ m δ + α
where (1/nλmdn/dT|λm = δ is the thermo-optic coefficient—which in general depends on λm and T—and (1/L)·dL/dT = α is the thermal expansion coefficient of the material, which has been considered to have the value 3.1 × 10⁻⁶ K−1 [19]. The thermal expansion can be considered as linearly dependent on the temperature, i.e., Leff(T) = Leff (295 K) + α (T − 295). However, the thermo-optic coefficient in Ga2O3 has not been extensively studied so far. A value of δ ≈ 3.6–3.7 × 10⁻⁵ K−1 for the [010] and perp.(100) crystal directions was reported from prism coupling measurements [10], while an average value of δ ≈ 1.77 × 10⁻⁵ K−1 was calculated from the interferometry thermometry in [9]. These results are further discussed below, in the light of the FDTD simulations and experimental results obtained in this work.

3.3. FDTD Simulation of the Temperature-Dependent F-P Resonances’ Positions

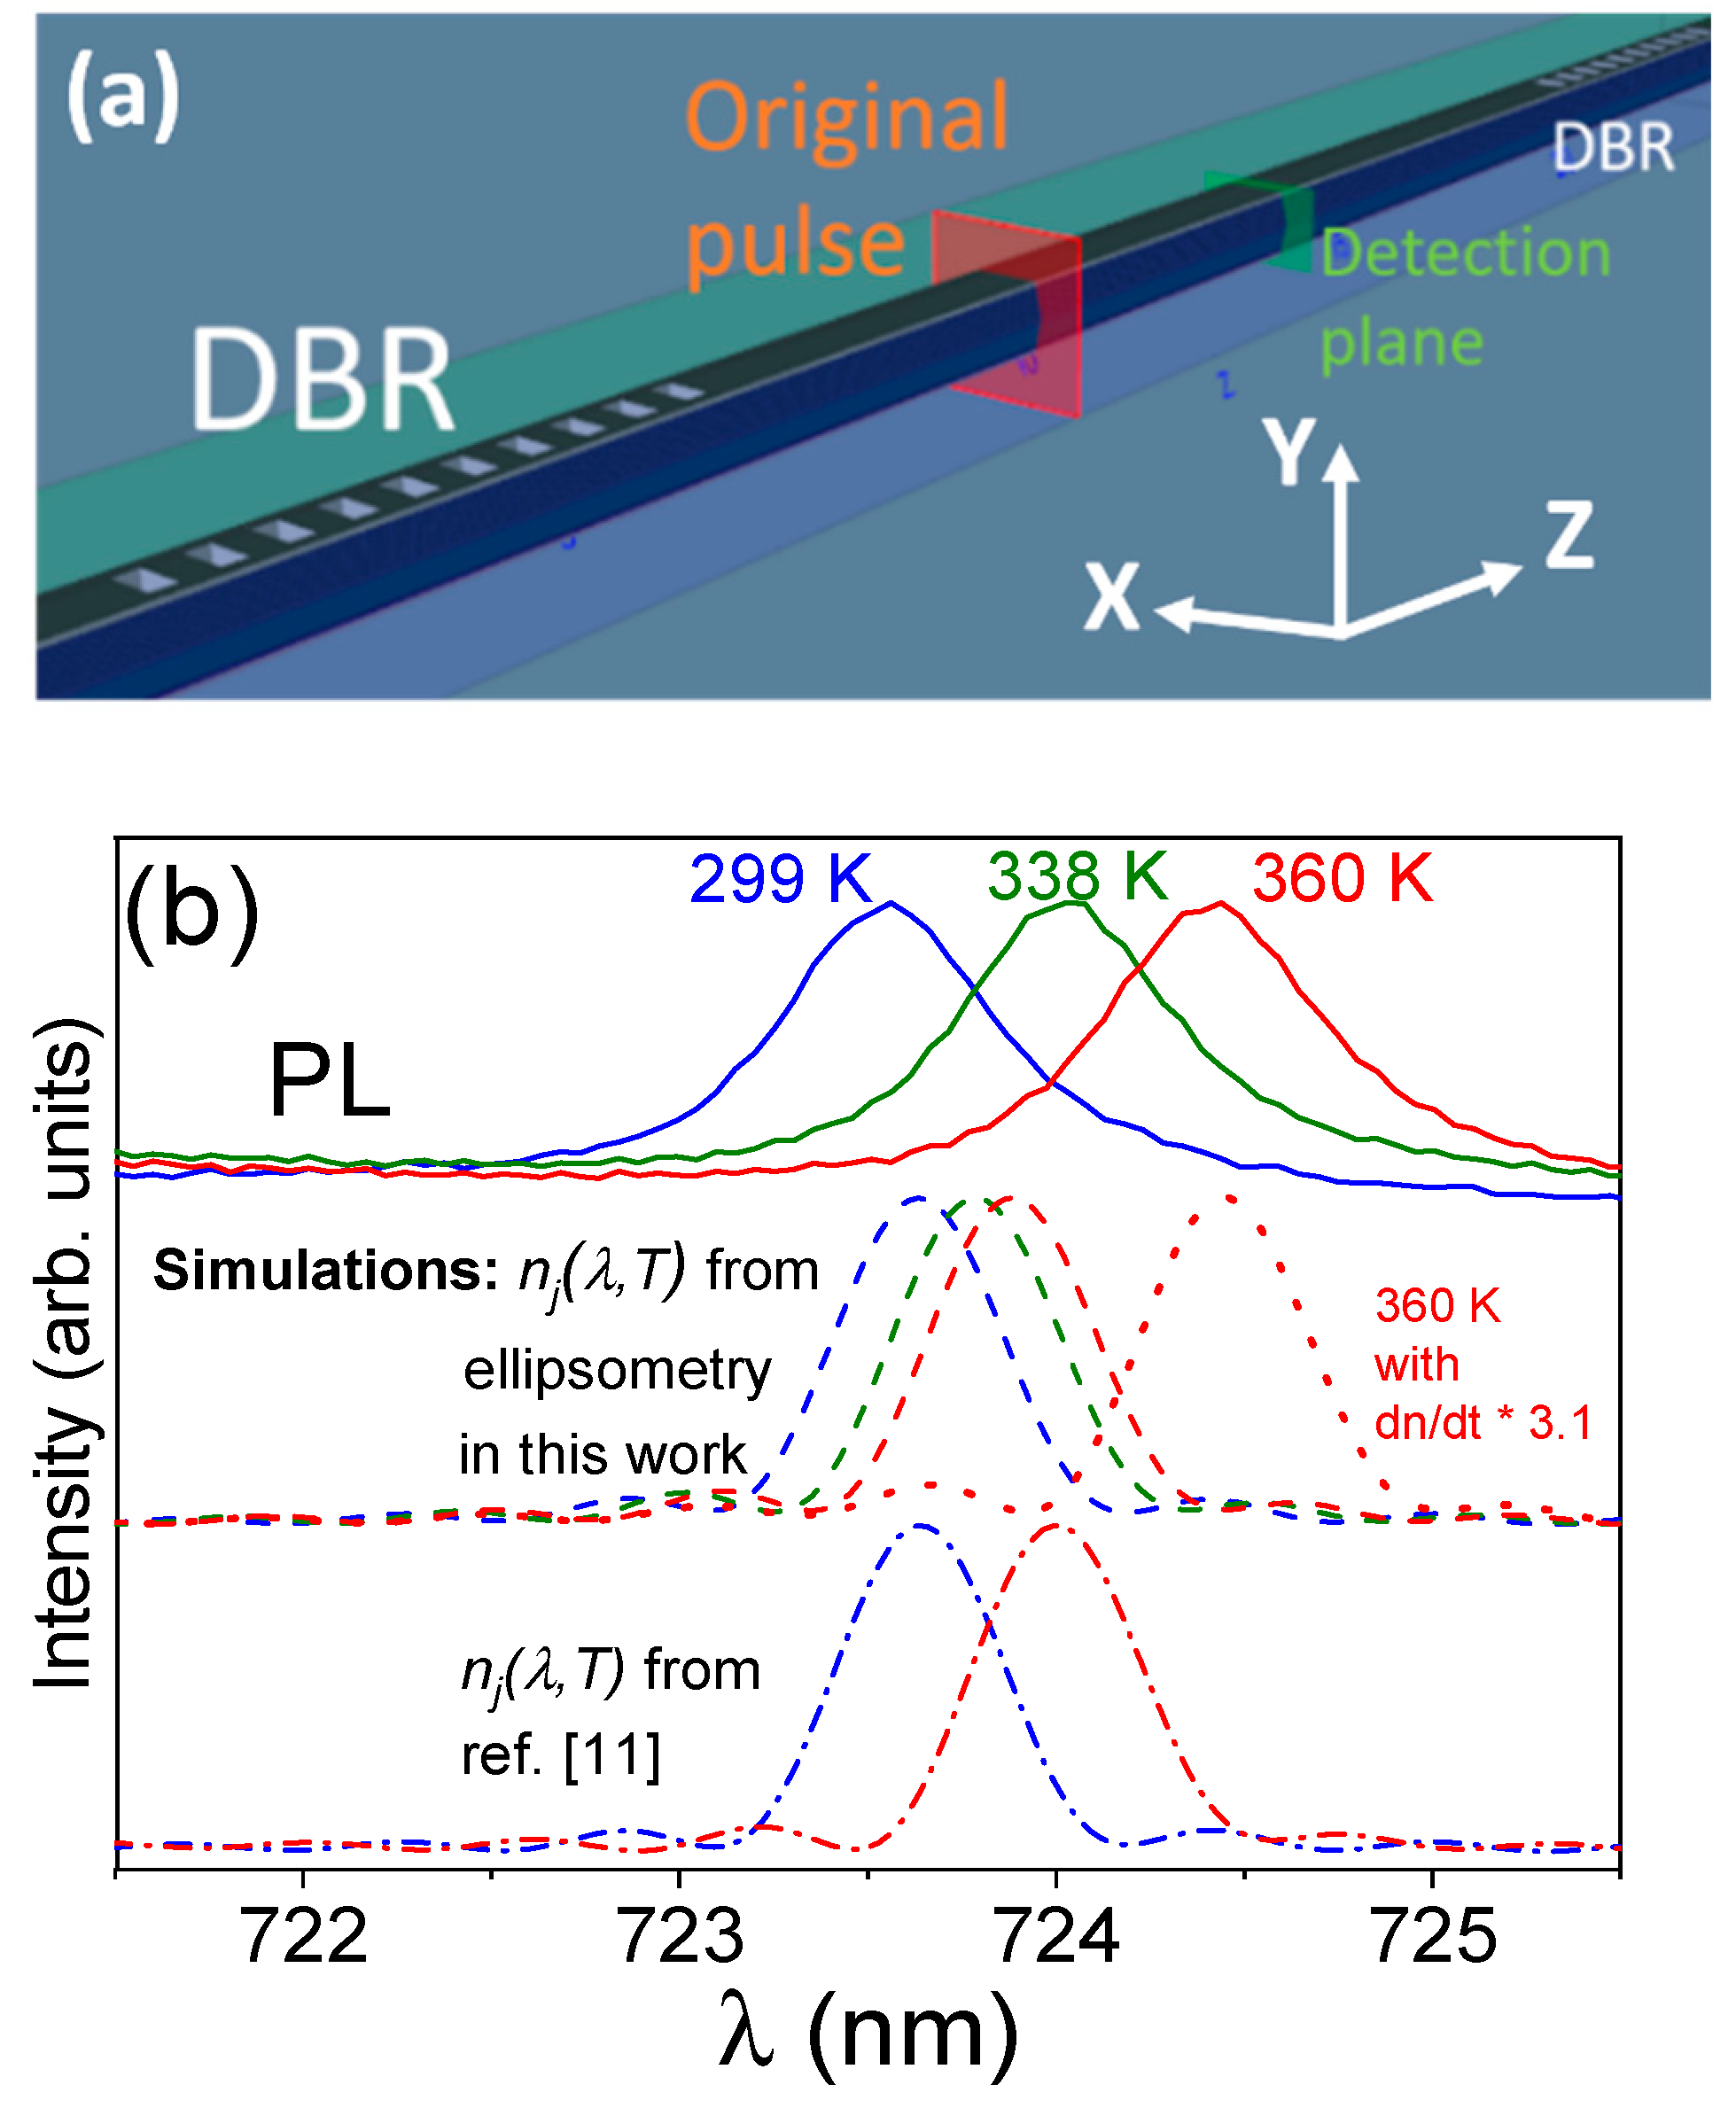
The achievement of reliable T-dependent dispersion relations, obtained by ellipsometry and using the Mueller matrix formalism, for the diagonal elements of the dielectric tensor, allows us to further analyse the optical resonances in the F-P cavity built on Ga2O3 microwires. The temperature dependence of the μ-PL resonances (F-P peaks) were simulated by FDTD simulations, taking into account the anisotropic character of the refractive index in Ga2O3 along the principal axes and the particular crystallographic directions in the studied microcavity. This is schematically shown in Figure 5a, where assignment of the crystal directions (see Figure 1a) is X (perpendicular to nW axis and to optical axis) corresponding to crystal direction [010], Y (parallel to optical axis) to the perp. (100) planes’ direction and Z (along nW axis) to the perp.(001) planes’ direction. Finally, Sellmeier parameters are calculated from the data in Table 1.
The detailed procedure of the FDTD simulations has been explained elsewhere [7,9]. In brief, a short pulse is allowed to propagate, starting from an inner position to the microcavity, for 4 × 10⁵ time steps of 10−17 s each. Its Poynting vector is integrated in a plane that covers the cross section of the wire in the middle of the microcavity, as shown in Figure 5a. As the pulse is bounced off the two DBRs, it is propagated back and forth within the cavity resulting in the interference pattern that, after many reflections, yields the FDTD-simulated resonance pattern.
Figure 5b shows normalized μ-PL spectra (solid lines) obtained by changing the excitation density of the laser spot so that the local temperature is 299 K (UV laser, OD 1 filter), 338 K (red laser, OD 0.3) and 360 K (red laser, no filter, full power), as calculated taking the maxima positions from Table 3. Simulated spectra (dashed lines and dot-dashed lines) at three different temperatures (RT, 338 K and 360 K) obtained with FDTD simulations are also shown. Dashed lines represent simulations using the anisotropic refractive index as obtained by ellipsometry in this work, while dot–dashed lines correspond to the same simulations using the anisotropic refractive index calculated from the data reported in ref. [11], but neglecting the contribution of the off-diagonal elements. A larger shift with temperature is observed for the experimental μ-PL spectra than that obtained with the FDTD simulations, i.e., simulations from the T-dependence of the refractive index obtained by ellipsometry underestimate the spectral shift when compared to that obtained from the measurement of the F-P resonances. This can also be expressed from the value of the thermo-optic coefficient as obtained from the previous works [9,10,11] and in this work, as shown in Table 3.
In spite of the results being similar to the previous works on the temperature-dependent refractive index of bulk β-Ga2O3 [10,11], the procedure to obtain the results presented in this work shows differences to those of other studies. The work by Bhaumik et al. used the prism method to obtain the refractive index at temperatures between room temperature (RT, 25 °C, i.e., 298 K) and 175 °C (448 K) [10]. They assumed that the reflected p and s components can be decoupled upon reflection. Although this is the case for isotropic materials, this is not the case for anisotropic materials, such as β-Ga2O3, in which the resulting reflection always shows a coupling of the p and s components. Moreover, their characterization only includes the refractive index along two crystal directions, the [010] and the direction perpendicular to the (100) planes. Although their approach might be a reasonable approximation, we believe that the use of generalized ellipsometry is a much better approach and should render more accurate data.
Regarding the work by Sturm et al. reported in [11], they used ellipsometry, and the analysis was similar to the one that we used. They had the advantage that they obtained the data with an additional orientation of the crystal, but had the disadvantage that they could not measure at multiple angles of incidence, only at 70° due to the use of a vacuum for their cryostat, which somehow limits the accuracy of their data. Note that we instead used three different angles of incidence, which means that for each crystal orientation, we have a factor three more data in different conditions for our fits. Nonetheless, the main difference between the work by Sturm et al. in [11] and the current work is the temperature range: they studied the variation in the refractive index at low temperatures—from 10 K to 300 K (room temperature)—while we report data in the 295 K to 595 K range. Even though the behaviour reported in [11] as a function of temperature could be extrapolated for higher temperatures, it is not straightforward that this would be a good approaching fact since it has already been reported that other properties of β-Ga2O3 do not show the same behaviour at temperatures below room temperature and at higher temperatures. For example, the electrical conductivity shows a much sharper change at temperatures below 300 K than above [20]. The trend is the same but the rate of variation is quite different.
In our previous work [9], the thermo-optic coefficient obtained from the F-P resonances was lower than that reported by the prism coupling technique in [10]. Therefore, while the trends as a function of temperature are the same, the value of this coefficient obtained with different experimental methods presents some variation. On the other hand, ellipsometry measurements, even though there is some uncertainty, are well-considered as a reliable way to assess the refractive index at RT for bulk materials. It is worth mentioning that heating in the ellipsometry experiments was conducted by placing the 2 mm thick crystal on a hot plate, while in the case of the F-P Ga2O3 cavities, the heating is localized at the laser spot region. Finally, it should also be pointed out that ellipsometry was performed in undoped material, while the nW-based cavities are Cr-doped. This might result in eventual changes in the refractive index due to Cr doping, as well as its behavior with temperature [21].

4. Conclusions

The anisotropic dispersion relations at different temperatures, ni(λ,T), in the 650–800 nm wavelength range are reported by ellipsometry in nominally undoped, bulk β-Ga2O3. The Mueller matrix formalism was used and good agreement with previous room temperature results was obtained. μ-PL spectra at different excitation laser powers from a Fabry–Perot microcavity built in a β-Ga2O3:Cr nanowire with DBRs were obtained. The spectral shift of the peaks allowed their local temperature at each excitation power to be calculated. Detailed FDTD simulations based on the obtained ni(λ,T) were carried out to assess such spectral shifts. The comparison of the FDTD simulations and the experimental results indicate an underestimation of the temperature dependence of the refractive index by ellipsometry as measured for the bulk crystal, and some other possible causes are discussed. The obtained thermo-optic coefficient is in the range of δ ≈ 10−5 K−1, although some variation in the values obtained by the different techniques is observed.

Supplementary Materials

The following supporting information can be downloaded at: https://www.mdpi.com/article/10.3390/nano13061126/s1, Figure S1: Geometry of the ellipsometry experimental setup and orientations; Figure S2: The measured experimental data are shown as points, the continuous lines are the fit to the data; Figure S3: Plots corresponding to measurements at 25 °C before and after heating up to 325 °C and the measurement at 325 °C for the Mueller matrix elements M12, M21, M33 and M34 at angle of incidence of 70º; Figure S4: (a) Evolution of Psi as a function of the temperature. (b) Evolution of average value of the refractive index during temperature variation. Figure S5: Fit with Lorentzian curves of the experimental PL peaks at three excitation powers for (a) peak #3 and (b) peak #4. References [9,15] are cited in the supplementary materials.

Author Contributions

Conceptualization, E.N. and B.M.; methodology, B.M., E.N., J.M.S.J., M.L.N. and R.S.; software, D.C. and E.N.; validation, E.N., R.S. and B.M.; formal analysis, D.C., M.A.-O., E.N.-P. and E.N.; investigation, D.C., E.N.-P. and J.J.; resources, E.N., B.M., R.S., J.S.M., J.M.S.J. and M.L.N.; data curation, D.C. and E.N.-P.; writing—original draft preparation, E.N.; writing—review and editing, all authors; visualization, D.C. and E.N.; supervision, B.M., R.S., J.M.S.J. and E.N.; funding acquisition, B.M., E.N., R.S., J.M.S.J., M.L.N. and J.S.M. All authors have read and agreed to the published version of the manuscript.

Funding

This work was supported by MICINN projects (RTI2018-097195-B-I00, RTI2018-096918-B-C41, PID2021-122562NB-I00 and PID2021-123190OB-I00/AEI/10.13039/501100011033/FEDER, UE). The authors acknowledge the financial support of the excellence research network RED2018-102609-T by MINECO. The authors acknowledge the support from the Air Force Office of Scientific Research under Award No. FA8655-20-1-7013 (Program Manager: Ali Sayir). M.A.-O. acknowledges financial support from MICINN (FPU contract No. FPU15/01982) and thanks the Central Research Development Fund (CRDF) of the University of Bremen for funding (ZF04/2021). J.S.M. and J.J. were supported by the Air Force Office of Scientific Research under award number FA9550–21–1–0507, monitored by Dr. Ali Sayir. Any opinions, finding, and conclusions or recommendations expressed in this material are those of the author and do not necessarily reflect the views of the United States Air Force.

Institutional Review Board Statement

Not applicable.

Informed Consent Statement

Not applicable.

Data Availability Statement

The data that support the findings of this study are available from the corresponding author upon reasonable request.

Acknowledgments

The authors acknowledge the use of the FIB facilities from the general services, SGIKER, of the University of the Basque Country.

Conflicts of Interest

The authors declare no conflict of interest.

References

  1. Pearton, S.J.; Yang, J.; Cary, P.H.; Kim, J.; Tadjer, M.J.; Mastro, M.A. A review of Ga2O3 materials, processing, and devices. Appl. Phys. Rev. 2018, 5, 011301. [Google Scholar] [CrossRef] [Green Version]
  2. Tadjer, M.J. Toward gallium oxide power electronics. Science 2022, 378, 724. [Google Scholar] [CrossRef] [PubMed]
  3. Wu, C.; Wu, F.; Hu, H.; Wang, S.; Liu, A.; Guo, D. Review of self-powered solar-blind photodetectors based on Ga2O3. Mater. Today Phys. 2022, 28, 100883. [Google Scholar] [CrossRef]
  4. Miyata, T.; Nakatani, T.; Minami, T. Gallium oxide as host material for multicolor emitting phosphors. J. Lumin. 2000, 87–89, 1183–1185. [Google Scholar] [CrossRef]
  5. Gollakota, P.; Dhawan, A.; Wellenius, P.; Lunardi, L.M.; Muth, J.F.; Saripalli, Y.N.; Peng, H.Y.; Everitt, H.O. Optical characterization of Eu-doped β-Ga2O3 thin films. App. Phys. Lett. 2006, 88, 221906. [Google Scholar] [CrossRef]
  6. Nogales, E.; Lopez, I.; Mendez, B.; Piqueras, J.; Lorenz, K.; Alves, E.; Garcia, J.A. Doped gallium oxide nanowires for photonics. Proc. SPIE Int. Soc. Opt. Eng. 2012, 8263, 82630B. [Google Scholar]
  7. Alonso-Orts, M.; Nogales, E.; San Juan, J.M.; No, M.L.; Piqueras, J.; Mendez, B. Modal Analysis of β-Ga2O3∶Cr Widely Tunable Luminescent Optical Microcavities. Phys. Rev. Appl. 2018, 9, 064004. [Google Scholar] [CrossRef] [Green Version]
  8. Alonso-Orts, M.; Chilla, G.; Hotzel, R.; Nogales, E.; San Juan, J.M.; No, M.L.; Eickhoff, M.; Mendez, B. Near-UV optical cavities in Ga2O3 nanowires. Opt. Lett. 2021, 46, 278. [Google Scholar] [CrossRef] [PubMed]
  9. Alonso-Orts, M.; Carrasco, D.; San Juan, J.M.; Nó, M.L.; de Andrés, A.; Nogales, E.; Mendez, B. Wide Dynamic Range Thermometer Based on Luminescent. Optical Cavities in Ga2O3:Cr Nanowires. Small 2022, 18, 2105355. [Google Scholar] [CrossRef] [PubMed]
  10. Bhaumik, I.; Bhatt, R.; Ganesamoorthy, S.; Saxena, A.; Karnal, A.K.; Gupta, P.K.; Sinha, A.K.; Deb, S.K. Temperature-dependent index of refraction of monoclinic Ga2O3 single crystal. Appl. Opt. 2011, 50, 6006. [Google Scholar] [CrossRef] [PubMed]
  11. Sturm, C.; Schmidt-Grund, R.; Zviagin, V.; Grundmann, M. Temperature dependence of the dielectric tensor of monoclinic Ga2O3 single crystals in the spectral range 1.0–8.5 eV. Appl. Phys. Lett. 2017, 111, 082102. [Google Scholar] [CrossRef] [Green Version]
  12. Mu, W.; Jia, Z.; Yin, Y.; Hu, Q.; Li, Y.; Wu, B.; Zhang, J.; Tao, X. High quality crystal growth and anisotropic physical characterization of β-Ga2O3 single crystals grown by EFG method. J. Alloys Compd. 2017, 714, 453. [Google Scholar] [CrossRef]
  13. McCloy, J.S.; Jesenovec, J.; Dutton, B.; Pansegrau, C.; Remple, C.; Weber, M.; Swain, S.; McCluskey, M.; Scarpulla, M. Growth and defect characterization of doped and undoped β-Ga2O3 crystals. In Proceedings of the Proc. SPIE, 12002 SPIE OPTO: Oxide-based Materials and Devices XIII, San Francisco, CA, USA, 22 January–28 February 2022; p. 1200205. [Google Scholar]
  14. Schubert, M.; Korlacki, R.; Knight, S.; Hofmann, T.; Schöche, S.; Darakchieva, V.; Janzén, E.; Monemar, B.; Gogova, D.; Thieu, Q.-T.; et al. Anisotropy, phonon modes, and free charge carrier parameters in monoclinic β-gallium oxide single crystals. Phys. Rev. B 2016, 93, 125209. [Google Scholar] [CrossRef] [Green Version]
  15. Sturm, C.; Furthmüller, J.; Bechstedt, F.; Schmidt-Grund, R.; Grundmann, M. Dielectric tensor of monoclinic Ga2O3 single crystals in the spectral range 0.5–8.5 eV. APL Mater. 2015, 3, 106106. [Google Scholar] [CrossRef] [Green Version]
  16. Wei, J.; Murray, J.M.; Barnes, J.O.; Krein, D.M.; Schunemann, P.G.; Guha, S. Temperature dependent Sellmeier equation for the refractive index of GaP. Opt. Mater. Express. 2018, 8, 485. [Google Scholar] [CrossRef]
  17. Nogales, E.; García, J.A.; Méndez, B.; Piqueras, J. Red luminescence of Cr in β-Ga2O3 nanowires. J. Appl. Phys. 2007, 101, 033517. [Google Scholar] [CrossRef] [Green Version]
  18. Remple, C.; Barmore, L.M.; Jesenovec, J.; McCloy, J.S.; McCluskey, M.D. Photoluminescence spectroscopy of Cr3+ in β-Ga2O3 and (Al0.1Ga0.9)2O3. J. Vac. Sci. Technol. A 2023, 41, 022702. [Google Scholar] [CrossRef]
  19. Orlandi, F.; Mezzadri, F.; Calestani, G.; Boschi, F.; Fornari, R. Thermal expansion coefficients of β-Ga2O3 single crystals. Appl. Phys. Express 2015, 8, 111101. [Google Scholar] [CrossRef]
  20. Golz, C.; Galazka, Z.; Lähnemann, J.; Hortelano, V.; Hatami, F.; Masselink, W.T.; Bierwagen, O. Electrical conductivity tensor of β−Ga2O3 analyzed by van der Pauw measurements: Inherent anisotropy, off-diagonal element, and the impact of grain boundaries. Phys. Rev. Mater. 2019, 3, 124604. [Google Scholar] [CrossRef] [Green Version]
  21. Caffrey, D.; Norton, E.; Coileáin, C.Ó.; Smith, C.M.; Bulfin, B.; Farrell, L.; Shvets, I.V.; Fleischer, K. Decoupling the refractive index from the electrical properties of transparent conducting oxides via periodic superlattices. Sci. Rep. 2016, 6, 33006. [Google Scholar] [CrossRef] [PubMed] [Green Version]
Figure 1. Sketch of the orientations of the crystal and the reference system, for both (a) nanowires and (b) bulk Ga2O3 crystals.
Nanomaterials 13 01126 g001
Figure 2. Refractive index values for the three axes at 25 °C (298 K) and 325 °C (598 K) obtained from ellipsometry data from Ga2O3 bulk crystal.
Nanomaterials 13 01126 g002
Figure 3. Anisotropic permittivity as a function of the temperature in the RT—400 K range.
Nanomaterials 13 01126 g003
Figure 4. (a) SEM image of the microcavity patterned in a Cr-doped Ga2O3 nanowire, with the two DBRs indicated. (b) Comparison between RT μ-PL spectra from an as-grown nanowire and the microcavity shown in (a). Spectra were normalized and vertically shifted for the sake of clarity. (c) Blow up from (b) of the four main F-P resonance peaks observed in the microcavity, overlapping the broad phonon-assisted band in the near-IR range. Their positions are 714.2 nm, 723.0 nm, 732.1 nm and 741.3 nm and were labeled #1, #2, #3 and #4, respectively. (d) Detail of the evolution of the #3 resonant peak when changing the excitation power.
Nanomaterials 13 01126 g004
Figure 5. (a) Simulation procedure, with the schematic of the OptiFDTD Designer module. The red plane is the pulse source, while the green plane is the Poynting vector detection plane. The defined axes are shown in the lower, right corner. (b) Comparison of normalized experimental μ-PL spectra of peak #2 at three different temperatures (solid lines) with simulations at such temperatures, using both the anisotropic, temperature-dependent refractive index calculated from ellipsometry in this work (dashed lines) and that calculated from the data by Sturm et al. [11]. Dotted line shows the resonance at 360 K by using nj(λ,T) obtained when multiplying by a 3.1 factor the dn/dT value calculated by ellipsometry in this work.
Nanomaterials 13 01126 g005
Table 1. T-dependent dispersion relations derived from ellipsometry measurements for (100), (010) and (001) directions.
CoefficientQuadratic Dependence with TAλi (μm)
εi,(100)(T) 2.874 + 3.199 × 10⁻⁶ T + 3.732 × 10⁻⁹ T20.570.27
εi,(010)(T) 3.046 + 4.416 × 10⁻⁵ T + 1.197 × 10⁻⁹ T20.570.27
εi,(001)(T) 3.001 + 4.418 × 10⁻⁵ T + 7.600 × 10⁻¹⁰ T20.570.27
Temperature is in K.
Table 2. Lorentzian fit parameters to PL curves excited with different powers, as shown in Figure 4d.
Peak #T (K)Center (nm)Width (nm)
299732.207 ± 0.0020.648 ± 0.008
3338732.6845 ± 0.00140.652 ± 0.007
360733.066 ± 0.0020.688 ± 0.009
299741.404 ± 0.0020.531 ± 0.011
4338741.880 ± 0.0020.550 ± 0.010
360742.262 ± 0.0020.592 ± 0.011
Table 3. Thermo-optic coefficient in β-Ga2O3 as calculated from results obtained in different works by several experimental methods.
δ (K−1)MethodTemperature Range (K)Reference
≈3.7 × 10⁻⁵Prism coupling298–448[10]
≈1.8 × 10⁻⁵Optical interferometry150–400[9]
≈6 × 10⁻⁶ Ellipsometry10–300[11]
≈5.7 × 10⁻⁶Ellipsometry295–595 KThis work
Disclaimer/Publisher’s Note: The statements, opinions and data contained in all publications are solely those of the individual author(s) and contributor(s) and not of MDPI and/or the editor(s). MDPI and/or the editor(s) disclaim responsibility for any injury to people or property resulting from any ideas, methods, instructions or products referred to in the content.