Article

Covalent Triazine Framework C6N6 as an Electrochemical Sensor for Hydrogen-Containing Industrial Pollutants. A DFT Study

1
Department of Chemistry, College of Science, King Faisal University, Al-Ahsa 31982, Saudi Arabia
2
Department of Chemistry, COMSATS University Islamabad, Abbottabad Campus, KPK, Islamabad 22060, Pakistan
*
Authors to whom correspondence should be addressed.
These authors contributed equally.
Nanomaterials 2023, 13(6), 1121; https://doi.org/10.3390/nano13061121
Submission received: 7 February 2023 / Revised: 7 March 2023 / Accepted: 15 March 2023 / Published: 21 March 2023
(This article belongs to the Special Issue Nanomaterials in Sensing Applications)

Abstract

:
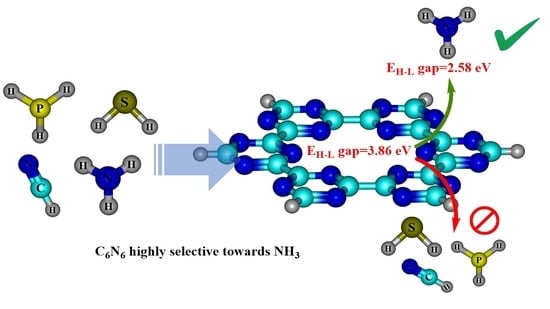
Industrial pollutants pose a serious threat to ecosystems. Hence, there is a need to search for new efficient sensor materials for the detection of pollutants. In the current study, we explored the electrochemical sensing potential of a C6N6 sheet for H-containing industrial pollutants (HCN, H2S, NH3 and PH3) through DFT simulations. The adsorption of industrial pollutants over C6N6 occurs through physisorption, with adsorption energies ranging from −9.36 kcal/mol to −16.46 kcal/mol. The non-covalent interactions of analyte@C6N6 complexes are quantified by symmetry adapted perturbation theory (SAPT0), quantum theory of atoms in molecules (QTAIM) and non-covalent interaction (NCI) analyses. SAPT0 analyses show that electrostatic and dispersion forces play a dominant role in the stabilization of analytes over C6N6 sheets. Similarly, NCI and QTAIM analyses also verified the results of SAPT0 and interaction energy analyses. The electronic properties of analyte@C6N6 complexes are investigated by electron density difference (EDD), natural bond orbital analyses (NBO) and frontier molecular orbital analyses (FMO). Charge is transferred from the C6N6 sheet to HCN, H2S, NH3 and PH3. The highest exchange of charge is noted for H2S (−0.026 e). The results of FMO analyses show that the interaction of all analytes results in changes in the EH-L gap of the C6N6 sheet. However, the highest decrease in the EH-L gap (2.58 eV) is observed for the NH3@C6N6 complex among all studied analyte@C6N6 complexes. The orbital density pattern shows that the HOMO density is completely concentrated on NH3, while the LUMO density is centred on the C6N6 surface. Such a type of electronic transition results in a significant change in the EH-L gap. Thus, it is concluded that C6N6 is highly selective towards NH3 compared to the other studied analytes.

Graphical Abstract

1. Introduction

In the last few decades, industrial pollutants have become serious threats to living beings. Industrial pollutants are adversely deteriorating our ecosystem. It is reported that every year, 4.2 million people are affected by direct exposure to industrial pollutants at levels beyond the safety limits [1]. Among industrial pollutants, hydrogen-containing substances such as HCN, H2S, NH3 and PH3 are highly poisonous to humans [2,3,4,5]. Hydrogen cyanide (HCN) is a poisonous gas with an almond-like odour. HCN is used as a reagent for the synthesis of various synthetic fibres, pesticides, plastics and dyes [6]. In cases of contact with skin, ingestion and inhalation, HCN is highly lethal to humans. HCN may cause suffocation, unconsciousness, cramps and heart problems. Hydrogen sulphide (H2S) is a gas with a rotten egg smell which is usually produced by decomposition of organic materials [7]. It rapidly reacts with the haemoglobin in blood and reduces the oxygen carrying capacity of vital organs. In addition, the detection and removal of H2S is particularly essential in petrochemical manufacturing and the coal industry. Another industrially demanding chemical is NH3, which is a colourless gas with a pungent smell. It is most widely used in the pharmaceutical and fertilizer industries [8,9]. Phosphine is another hydrogen-containing industrial pollutant, which is used to kill insects. In the semiconductor industry, PH3 is applied in silicon processing [10].
The above-mentioned facts demonstrate the need to design an effective electrochemical sensor for environmental monitoring of these hazardous gases. In the recent past, numerous materials such as ZrO2 nanoparticles [11], carbon nanotubes [10], metal organic frameworks [11,12], porous silica [13], carbon nitride (C2N) [13], hexagonal boron nitride [14], metal oxides [15] and zeolites [16] have been tested as adsorbents and gas sensors [12,17]. In addition, nanocages such as aluminium nitride [18], boron nitride [19], carbon nitride [20], metal clusters [21] and phosphorus carbide [22] have been applied as sensors. The essential pre-requisites for any material to act as a sensor are a high selectivity and sensitivity, a fast response, ease of handling, a low hazard to the environment, a high surface to volume ratio and a high recyclability [23,24]. Materials with a large surface to volume ratio can efficiently interact with analytes. The scientific community has developed new materials to overcome the existing limitations of designed materials, such as a low number of active sites, a lack of a tuneable band gap, a low recyclability, a high cost, a low surface area and selectivity and sensitivity issues. Graphene and graphene-doped materials are among the materials used as sensor materials for toxic and hazardous gases [25,26,27,28,29]. The honeycomb-like structure with a large surface area makes graphene an exceptional material for energy storage [23]; photonics [20]; chemical [22], mechanical [30] and DNA sensing [19]; electrocatalysis [2]; electrochemical sensing [31]; and electronic [19] applications. Similarly, other 2D materials such as germanene [32], transition metal dichalcogenides (TMDs) [33], silicene [34,35,36], phosphorene [37], etc., also offer abundant adsorption sites for separation and sensing of the desired materials. However, the zero band gap of graphene causes a switch off problem in optoelectronic devices [38]. Engineered graphene shows improved electronic charge mobility [39,40]. Many attempts have been made to increase the band gap of graphene through physiochemical engineering. Still, it is not easy to produce a material with a controlled pore size and a suitable band gap [41]. Certainly, the above-mentioned materials have many beneficial characteristics, but their limitations, such as low recyclability, low surface area, low number of active sites and high cost, cannot be ignored. In addition, many surfaces used as sensors contain heavy metals, causing a disposal issue.
Another newly developed class of 2D and 3D materials are covalent organic frameworks, which consist of a variety of organic units as monomers. In 2005, Yaghi et al. synthesized COF1 through a mechanism based on reticular chemistry [42]. Covalent organic frameworks are crystalline porous materials with controlled pore sizes, well-defined surface areas, low densities, light weights and high thermal stabilities. Due to these characteristics, COFs have attracted a lot of interest in various fields of material science, such as solar cells, gas storage, proton conductivity, catalysis, energy storage devices, etc. [43]. In the recent past, several COFs have been utilized as sensors [44] for trinitrotoluene (TNT), picric acid [45], chromium (Cr), arsenic (As) [46,47] and iodine [48]. Previous reports show that covalent triazine frameworks (CTFs) are better sensors compared to COFs due to their controlled porosity, high density nitrogen cavities, high surface areas, high chemical and thermal stabilities, reproducible sensing responses and tuneable electronic properties [49,50]. These characteristics provide suitable conditions for the trapping and detection of analytes and infer the increased potential of CTFs as sensor surfaces compared to COFs. However, CTFs have been studied experimentally as sensors for harmful gases and heavy metals [51,52,53].
Keeping in view the above-mentioned characteristics of covalent triazine frameworks (CTFs), we selected a recently designed covalent triazine framework (C6N6), which contains six nitrogens in its cavity. Recently, C6N6 has been used in many fields such as catalysis [54], sensing [55], drug delivery [56] and energy storage [57]. These findings show that the C6N6 surface is more comparable to other available COFs for the detection of H-containing industrial pollutants such as HCN, H2S, NH3 and PH3. The high amount of nitrogen in the C6N6 unit also leads to a high surface area and a cavity size of 5.46 Å, which can efficiently interact with various analytes through H bonding, π–π stacking or other types of chemical interactions. According to the best of our knowledge, C6N6 has not yet been tested as a sensor for the above-mentioned analytes. In the designed study, we used density functional theory simulations to investigate C6N6 as a sensor surface. Changes in geometrical properties are explored through NCI, QTAIM and SAPT0 analyses, while changes in the electronic properties of analytes in C6N6 complexes are determined by NBO, EDD and FMO analyses.

2. Computational Methodology

Gaussian 09 software was used to carry out the simulations in the current study. The selected geometries of bare C6N6 and analyte@C6N6 complexes were investigated at the Ꞷb97XD/6-31G (d, p) level of theory. The Ꞷb97XD functional was adopted in the current study because it is a range-separated functional which can effectively capture non-localized intermolecular interactions [58]. In Ꞷb97XD, the symbol “Ꞷ” represents the long range correction [59]. Additionally, the Ꞷb97XD functional also contains Grimme’s D2 dispersion factor to efficiently study the van der Waals (vdWs) interactions [59]. The changes in the electronic properties of C6N6 before and after adsorption of analytes were explored by NBO, EDD and FMO analyses at the B3LYP/6-31G(d) level of theory. B3LYP/6-31G(d) is considered as the best to study the electronic changes of interacted systems [60,61,62,63,64,65]. The most stable configurations of the analyte@C6N6 complexes were investigated by adsorption of analytes through different orientations of C6N6. A frequency analysis was performed to confirm that the geometries of the complexes were true minima on the potential energy surface. The energies of adsorbed analytes in C6N6 are determined by Equation (1):
∆E = [E(analytes@C6N6) − (EC6N6 + Eanalytes)]
where E(analytes@C6N6) is the interaction energy of the complexes, EC6N6 is the energy for bare C6N6 and Eanalytes is the energy of the industrial pollutants used as analytes.
A SAPT0 analysis was applied to determine the role of the individual components of the interaction energy in the stabilization of the analyte@C6N6 complexes [66]. The total SAPT0 energy is the sum of four factors: induction (∆Eind), dispersion (∆Edisp), electrostatic (∆Eelstat) and exchange (∆Eexch). Hence, the SAPT0 energy is calculated through Equation (2):
∆ESAPT0 = ∆Eelstat + ∆Eexch + ∆Eind + ∆Edisp
The nature of adsorption, such as the electrostatic, dispersive and repulsive forces between the analyte and C6N6, was examined by an NCI analysis. The nature and strength of non-covalent interactions is given by the reduced density (s), Equation (3) [67].
s = 1 2 ( 3 π 2 ) 1 3 ρ ρ 4 / 3
The value of electron density (ρ) for non-covalent interactions is generally very small. However, small changes in (ρ) result in prominent changes in RDG values, which appear in the form of spikes in a 2D-RGD plot. An NCI analysis characterizes non-covalent interactions through 3D-isosurfaces and 2D-RGD plots. These plots use ρ and the second eigen value (λ2) to differentiate between the nature of interactions [68,69,70].
The interaction between the analytes and C6N6 was further studied through a QTAIM analysis. Through a QTAIM analysis, we can examine the nature of the interactions, which cannot be explored through any other method. The major factor through which non-covalent interactions can be studied through QTAIM analysis is the bond critical point (BCP). BCPs are based on various parameters such as the Laplacian ( 2 ρ), electron density (ρ), total energy density (H), potential energy density (V) and the Lagrangian kinetic energy density (G) [71,72,73]. Multiwfn 3.7 and VMD software were used to perform the QTAIM, NCI and EDD analyses [74,75,76].

3. Results and Discussion

3.1. Geometry Optimization and Interaction Energy

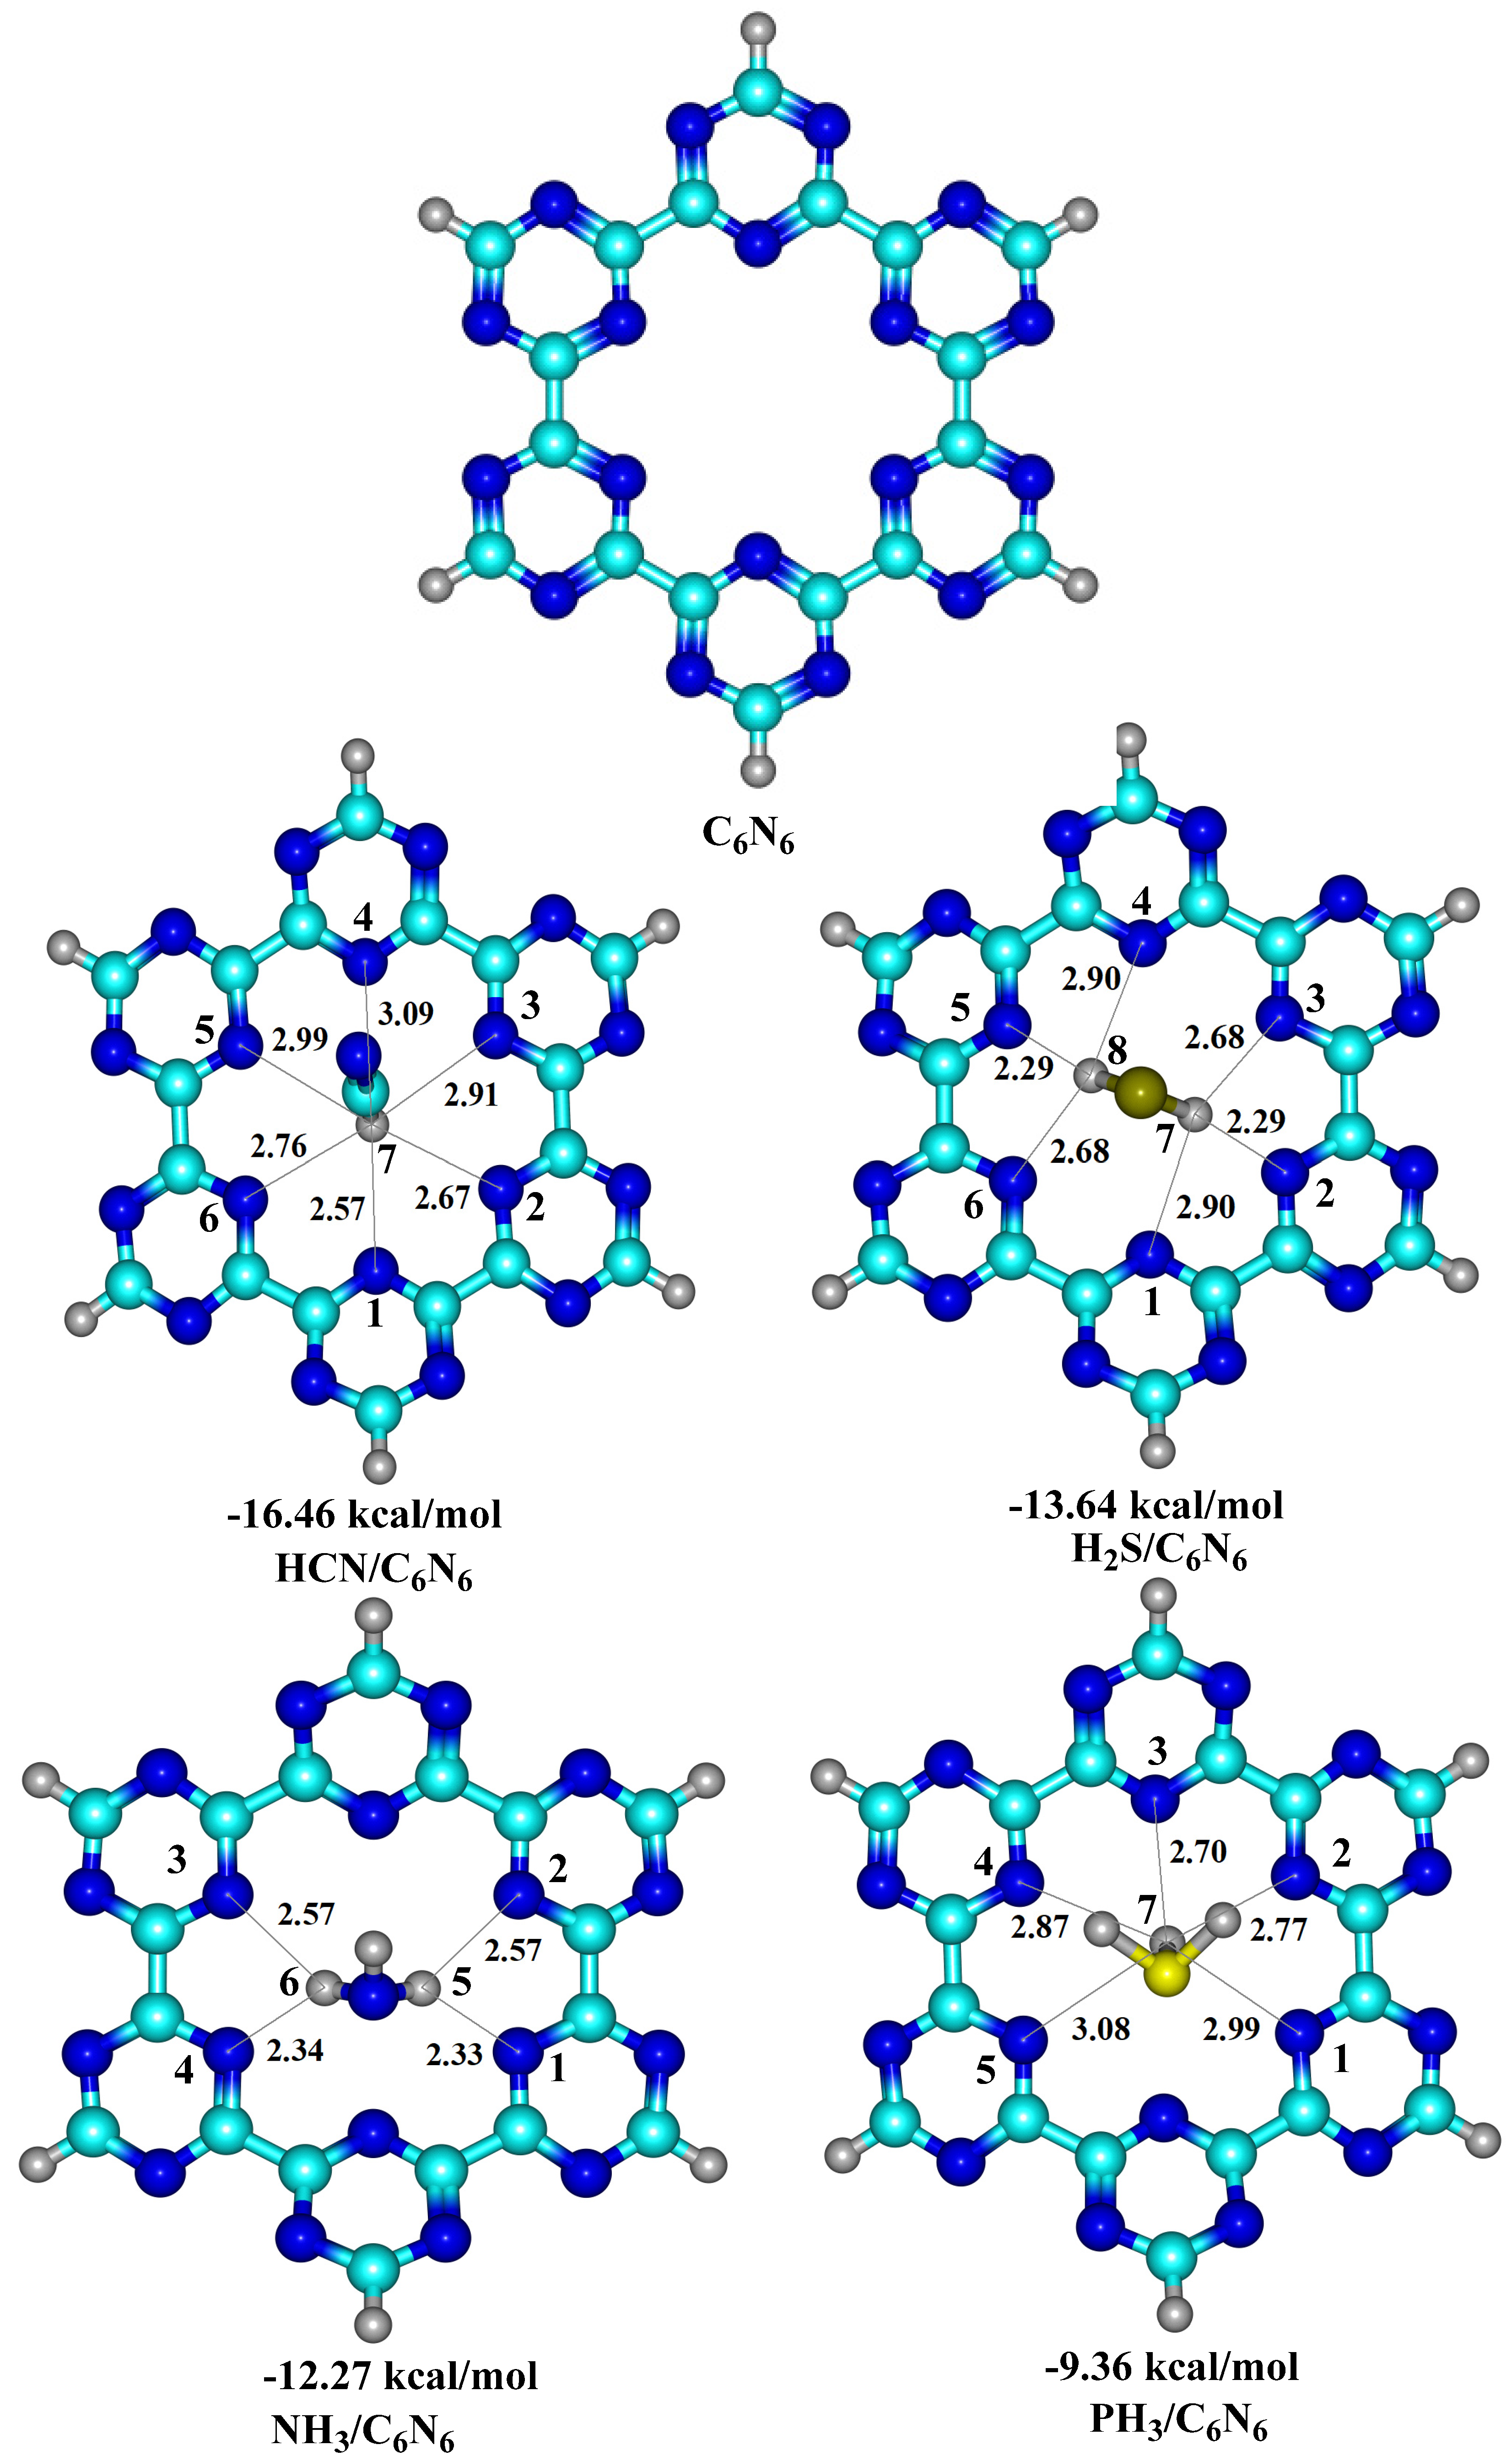
The optimized structure of the selected model of C6N6 is presented in Figure 1. The C-C and C-N bond lengths in C6N6 are 1.53 Å and 1.33 Å, respectively, which are consistent with previously reported theoretical and experimental values [77]. Each unit of C6N6 comprises of six C3N3 rings which are connected with each other through C-N bonds [55]. The cavity of the selected model of C6N6 has a high electron density due to the centring of the nitrogen atoms towards the cavity. The diameter of the C6N6 cavity (between two nitrogen atoms) is 5.46 Å [78]. The nitrogenated, high electron density cavity of C6N6 can act as a potential surface for the detection of hydrogen-containing industrial pollutants. The topologies of selected industrial pollutants (HCN, H2S, NH3 and PH3) were also simulated at the Ꞷb97XD/6-31G (d, p) level.
In order to obtain stable complexes of analyte@C6N6, several orientations of each analyte in C6N6 were considered. Figure 1 shows a graphical representation of the adsorption energies of analyte@C6N6 complexes. The most stable geometries of each analyte@C6N6 complex are reported in Figure 2, while the remaining geometries are given in Figure S1 (Supplementary Materials). The following order of the adsorption energies of the stable complexes is obtained: HCN@C6N6 > H2S@C6N6 > NH3@C6N6 > PH3@C6N6.
Among the analyte@C6N6 complexes, the most stable complex is formed between HCN and C6N6, with an adsorption energy value of −16.46 kcal/mol. In this complex, HCN is projected to be perpendicular to the C6N6 cavity (see Figure 2). The H atom of HCN interacts with the N atoms of C6N6 at bond distances of between 2.57 Å and 3.09 Å. Among these interactions, the strongest interaction is seen between the H7 atom of HCN and the N1 and N2 of C6N6, with interaction distances of 2.57 Å and 2.67 Å, respectively. These interaction distances show that HCN is more attracted to the two C3N3 rings containing N1 and N2 atoms. When the input geometry was altered to have the nitrogen atom of HCN pointing towards the cavity of C6N6, the calculation converged to the same complex mentioned above (hydrogen pointing towards the cavity). This happened because of the repulsion between the N atom of HCN and the N atoms of C6N6.
The stable complex of H2S@C6N6 is obtained with an adsorption energy of −13.64 kcal/mol, which is the 2nd most stable complex among all studied analyte@C6N6 complexes. The optimized topology of the H2S@C6N6 complex shows that both H atoms of H2S are positioned towards the C6N6 cavity. Interaction distances of 2.90 Å (N1---H7), 2.29 Å (N2---H7) and 2.68 Å N2---H7 are noted between N atoms (N1, N2 and N3) of C6N6 and the H atom (H7) of H2S (see Figure 2). Moreover, similar interaction distances are observed between N4---H8, N5---H8 and N6---H8, respectively. However, these interaction distances between the N atoms of C6N6 and the H atoms of H2S reveal that the adsorption of H2S occurred at the centre of cavity, while the S atom is pointing upwards.
The stable complex of NH3@C6N6 resulted in an adsorption energy of −12.27 kcal/mol, which is slightly lower than that of the H2S@C6N6 complex. In the stable configuration of NH3@C6N6, two H atoms of NH3 interact with the N atoms of C6N6, while the 3rd H atom is projected away from the cavity. Among the observed interactions, strong interactions are observed between N1 and H5 and N4 and H6 of C6N6 and H2S, with distances of 2.33 Å and 2.34 Å, respectively. The N2 and N3 of C6N6 interact with H5 and H6 of NH3, with an interaction distance of 2.57 Å. The lower adsorption energy of the NH3@C6N6 complex (−12.27 kcal/mol) compared to the H2S@C6N6 complex (−13.64 kcal/mol) is attributed to longer interaction distances between the H atoms of NH3 and the N atoms of C6N6 compared to H2S.
An adsorption energy of −9.36 kcal/mol is observed for the stable complex of PH3@C6N6, which is the lowest amongst all studied analyte@C6N6 complexes. The stable structure of the PH3@C6N6 complex consists of an inward pointing H atom of PH3, while the other two H atoms point upwards. The inward pointing H atom of PH3 is almost at the centre of the C6N6 cavity. The bond distances between the H atoms of PH3 and the N atoms of C6N6 range from 2.70 Å to 3.09 Å. The low adsorption energy (−9.36 kcal/mol) of the PH3@C6N6 complex is due to the low polarity of the H atoms of PH3 and the longer interaction distances. The results of adsorption energies (−9.36 kcal/mol to −16.46 kcal/mol) show all analytes (HCN, H2S, NH3 and PH3) physically absorb on the C6N6 sheet.

3.2. Symmetry Adapted Perturbation Theory (SAPT0) Analysis

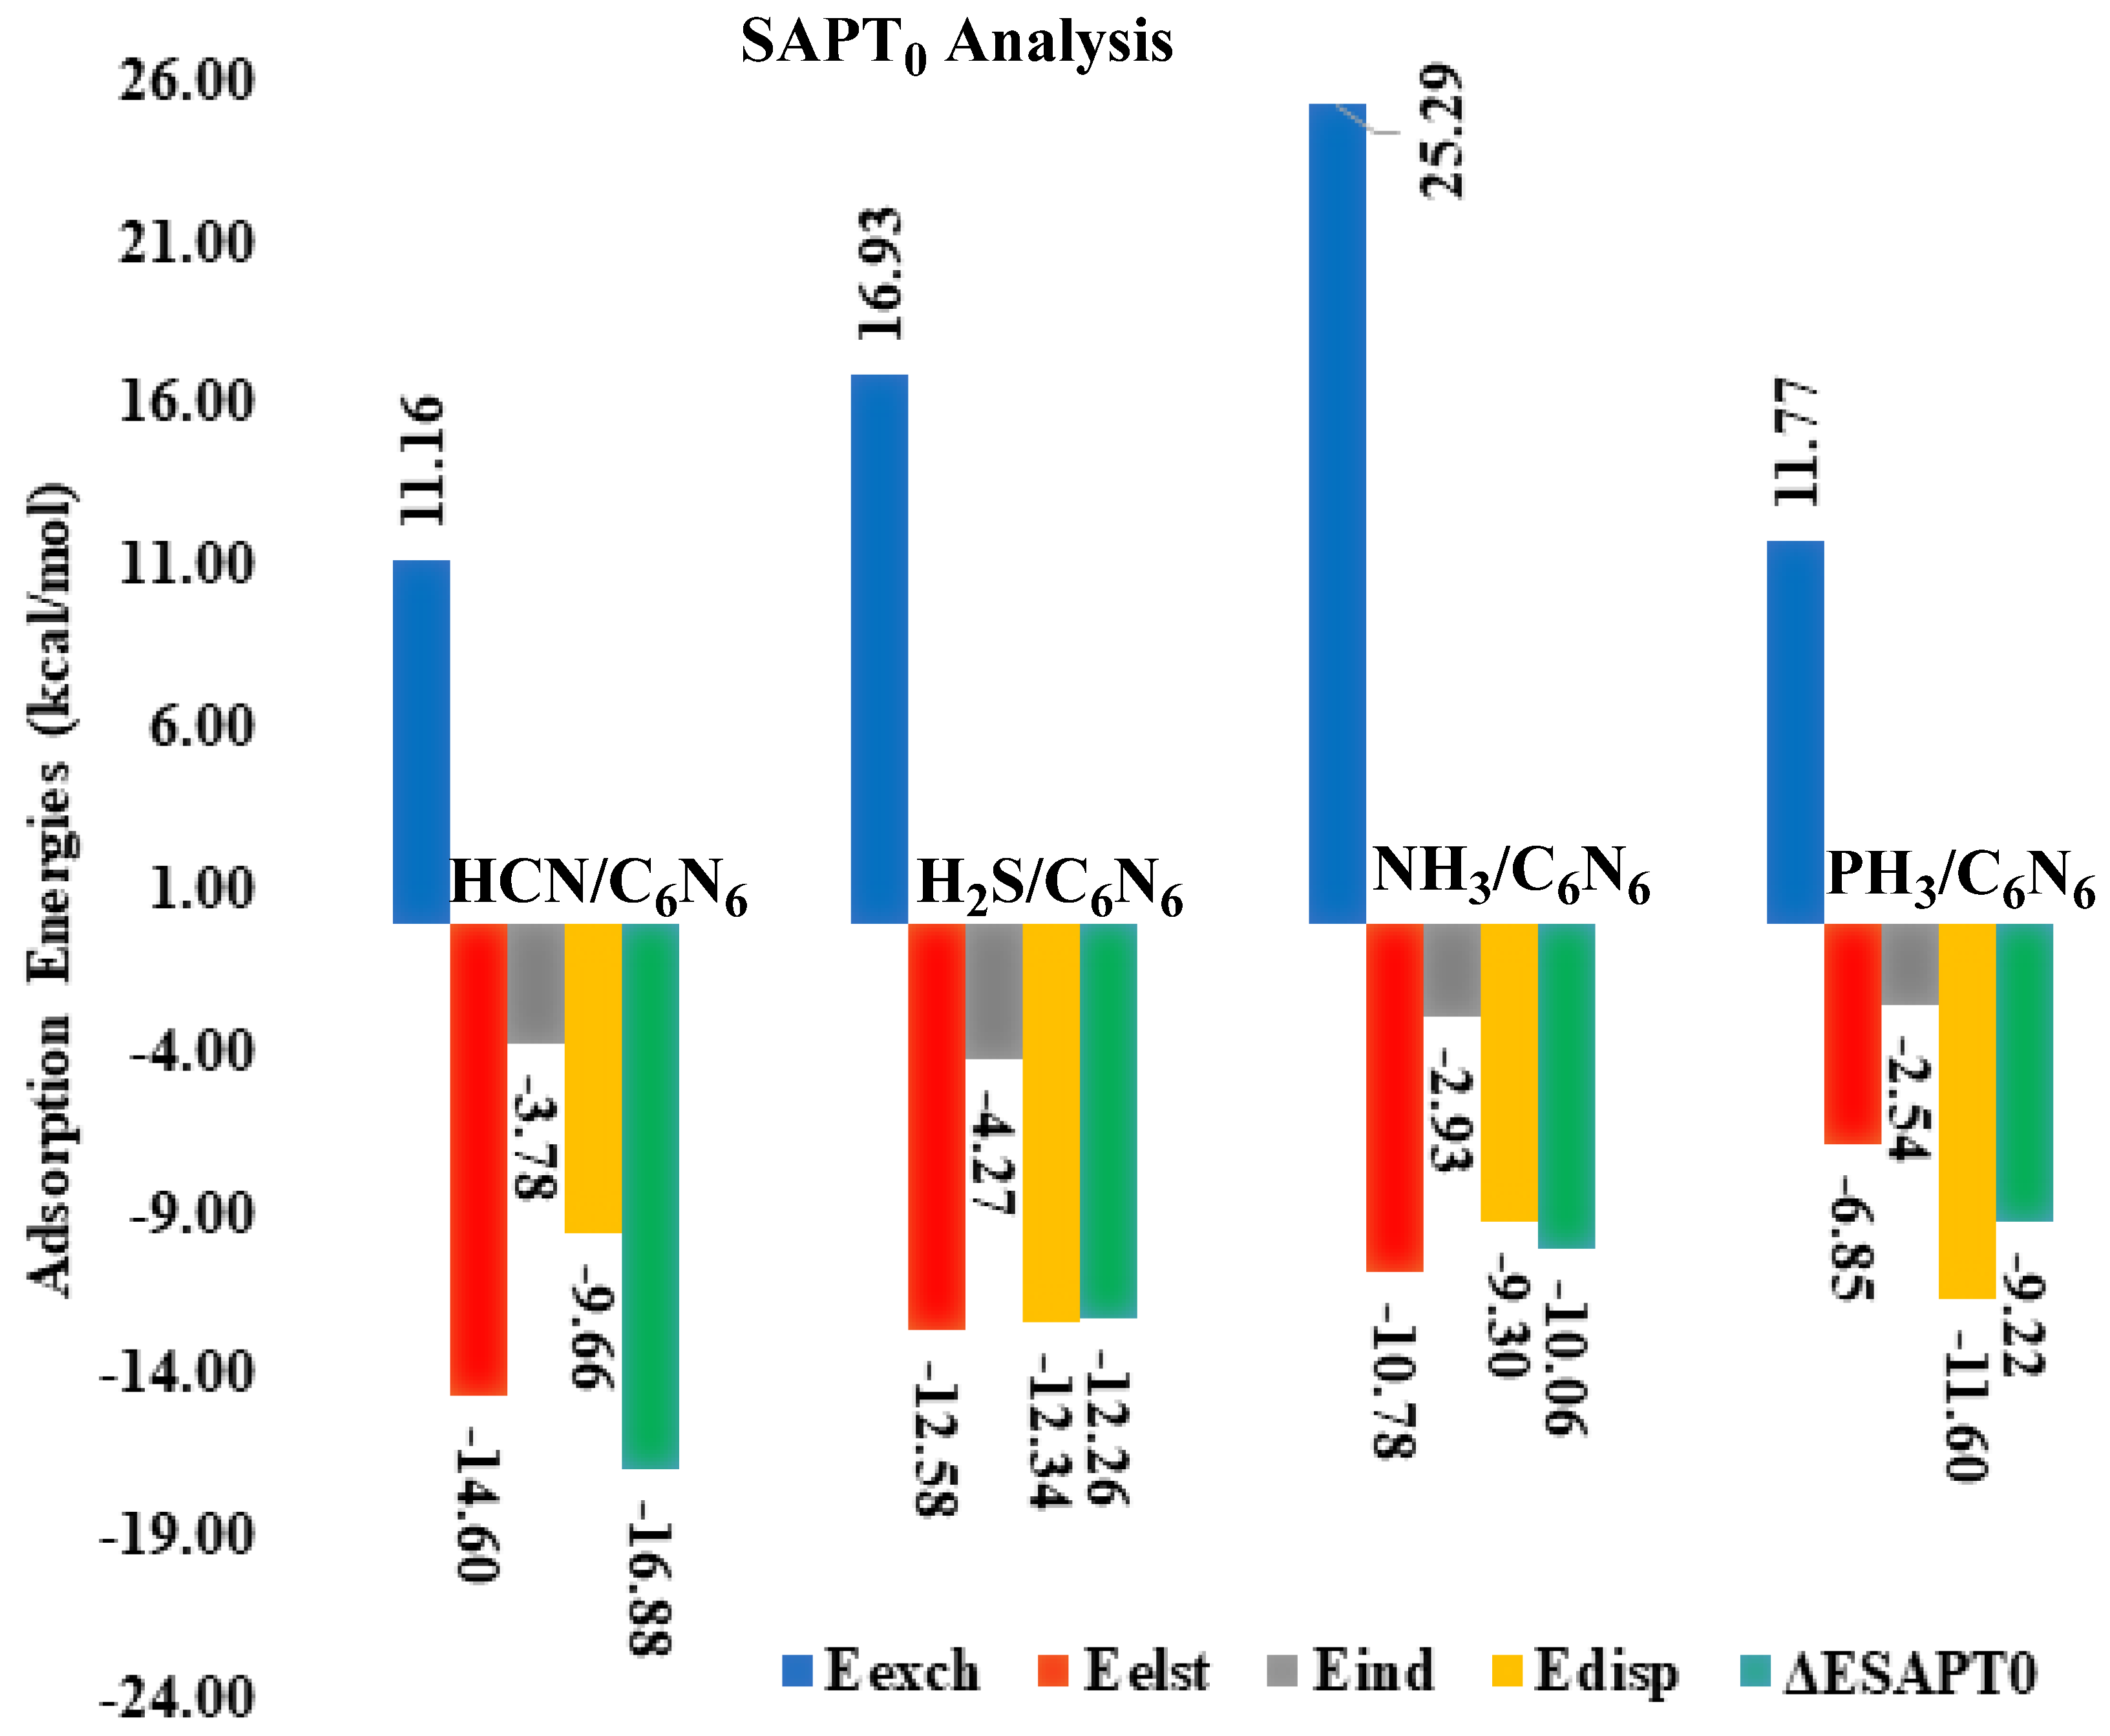
A SAPT0 analysis is the most effective method for quantifying non-covalent interactions. The SAPT0 interaction energy is the sum of four factors, including induction, exchange, electrostatic and dispersion. Therefore, in SAPT0, the role of each factor is investigated in the stabilization of analytes in C6N6. The SAPT0 results of all the studied complexes are presented in Table 1 and Figure 3. In the SAPT0 graph, five bars are shown for each complex. The last green bar represents the total SAPT0, which is the sum of the first four bars. Out of these four bars, three bars with negative signs indicate attractive interactions, while the bars with +ve signs indicate repulsive interactions. The negative sign of the green bar (total SAPT0) reveals the dominance of attractive forces over repulsive forces during the interaction of analytes with the C6N6 sheet.
The SAPT0 energies of all the complexes obtained through PSI4 are −16.88 kcal/mol (HCN@C6N6), −12.26 kcal/mol (H2S@C6N6), −10.06 kcal/mol (NH3@C6N6) and −9.22 kcal/mol (PH3@C6N6). Among the studied H-containing industrial pollutants over C6N6, the highest SAPT0 value (−16.88 kcal/mol) is obtained for the HCN@C6N6 complex, which is consistent with the results of the interaction energy analysis. The SAPT0 attractive component values for the HCN@C6N6 complex are Eelst (−14.60 kcal/mol: 52%), Eind (−3.78 kcal/mol: 13%) and Edisp (−9.66 kcal/mol: 34%). These values indicate that Eelst is the major stabilizing factor compared to Eind and Edisp. The highest value of Eelst results from the strong interactions of the H atom of HCN with the N atoms of C6N6 through a shorter interaction distance (vide supra).
The second highest SAPT0 value is seen for the H2S@C6N6 complex, at −12.26 kcal/mol. The energy values of the attractive components, i.e., Eelst, Eind and Edisp, observed for the H2S@C6N6 complex are −12.58 kcal/mol (43%), −4.27 kcal/mol (15%) and −12.34 kcal/mol (42%), respectively. These values of the attractive components show that Eelst (43%) and Edisp (42%) play a major role in the stabilization of the H2S@C6N6 complex, while a lower contribution is observed for Eind (15%). The SAPT0 values for the NH3@C6N6 and PH3@C6N6 complexes are −10.06 kcal/mol and −9.22 kcal/mol, respectively. The SAPT0 component analysis for the NH3@C6N6 complex reveals that Eelst (47%) and Edisp (40%) are dominant in the stabilization of NH3 over C6N6. Among the studied pollutant complexes, the lowest SAPT0 value is observed for the PH3@C6N6 complex (−9.22 kcal/mol). The lowest SAPT0 value for the PH3@C6N6 complex results from the lower polarity of the interacting H atoms of PH3 with the N atoms of C6N6. Among the SAPT0 energy, a key role is noted for Edisp (55%) in the stabilization of the PH3@C6N6 complex, while Eelst (33%) and Eind (12%) contribute less towards the total SAPT0 energy.
The SAPT0 analysis reveals that Eelst is the dominant contributing factor in the case of HCN@C6N6, whereas a good balance between Eelst and Edisp is observed for H2S and NH3. In the case of PH3, the dispersion interaction played a dominant role in the stabilization of PH3 over C6N6. The SAPT0 values of all the studied complexes are consistent with the interaction energy analysis.

3.3. Non-Covalent Interaction (NCI) Analysis

The nature of interactions between analytes and C6N6 was further explored through non-covalent interaction analyses. Through an NCI analysis, the van der Waals, electrostatic and repulsive interactions can be differentiated based on a colour scheme. An NCI analysis comprises 3D isosurfaces and 2D reduced density gradient (RDG) plots. The 3D isosurface topological analysis is based on three types of colours: red (repulsive), green (van der Waals) and blue (electrostatic interactions). These colours appear in the form of patches between the analytes and C6N6 through which the nature of interactions can be differentiated. A 2D RDG plot is obtained by taking the reduced density on the Y-axis and product of 2nd value of the Laplacian (sign(λ2)) and density gradient on the X-axis. A 2D RGD plot gives information about the strength of each type of interaction. In 2D RDG plots, non-covalent interactions appear as blue, green and red spikes in the low density gradient region. The vdWs interactions are indicated by the green spikes which form the when product of sign(λ2) ρ is in the range of −0.00 a.u. to −0.02 a.u. A large and negative value of the product of sign(λ2) ρ (above −0.02 a.u.) signifies the existence of electrostatic interactions (blue spikes). Red spikes in the 2D-RGD plot show repulsive interactions when the product of sign(λ2) ρ is positive and large.
The topologies obtained through NCI analyses are presented in Figure 4. In the studied complexes, the green spikes in the 2D RDG plots and the green isosurface in the 3D plots are explored. The green spikes and isosurface indicate vdWs interactions between the analytes and C6N6. The strength of the vdWs interaction in each complex is different, indicated by the variation in the thickness of 3D isosurface patches and a projection of green spikes in the 2D-RDG plots on the X-axis. In the case of the HCN@C6N6 complex, a ring on the green isosurface develops between the H atom of HCN and the six N atoms of C6N6. This shows that all six N atoms of C6N6 strongly interact with the H atom of HCN. Similarly, in the 2D-RDG plot, a mixture of bluish-green spikes arises at a low-density gradient between −0.01 and −0.02 a.u., which indicates that the complex is stabilized through electrostatic interactions. In the case of the H2S@C6N6 complex, a stronger interaction is observed, where the H atoms of H2S closely interact with the N atoms of C6N6 (see Figure 4). The rest of the interactions are present at longer distances due to the angular orientation of the H2S molecule over C6N6. The 3D isosurfaces and 2D-RGD plots of the NH3@C6N6 complex reveal the weak interaction compared to the HCN@C6N6 and H2S@C6N6 complexes. The scattered green spikes and shattered green isosurface in the 3D NCI plots are due to the weak interaction between NH3 and the C6N6 cavity. The weak interaction of NH3 is also described in the interaction energy section. In the case of the PH3@C6N6 complex, the green spikes and isosurface are not as thick and dense as projected in the rest of the studied complexes. Out of the three hydrogens atoms of PH3, only one H is oriented towards the C6N6 cavity. The H atom orientated towards the C6N6 cavity is not as polar as the H atom of HCN and NH3, due to which weak vdWs interactions are established between PH3 and the C6N6 cavity. The NCI analysis indicated that dispersion and electrostatic interactions are dominant, which is consistent with the SAPT0 and interaction energy results.

3.4. Quantum Theory of Atoms in Molecule (QTAIM) Analysis

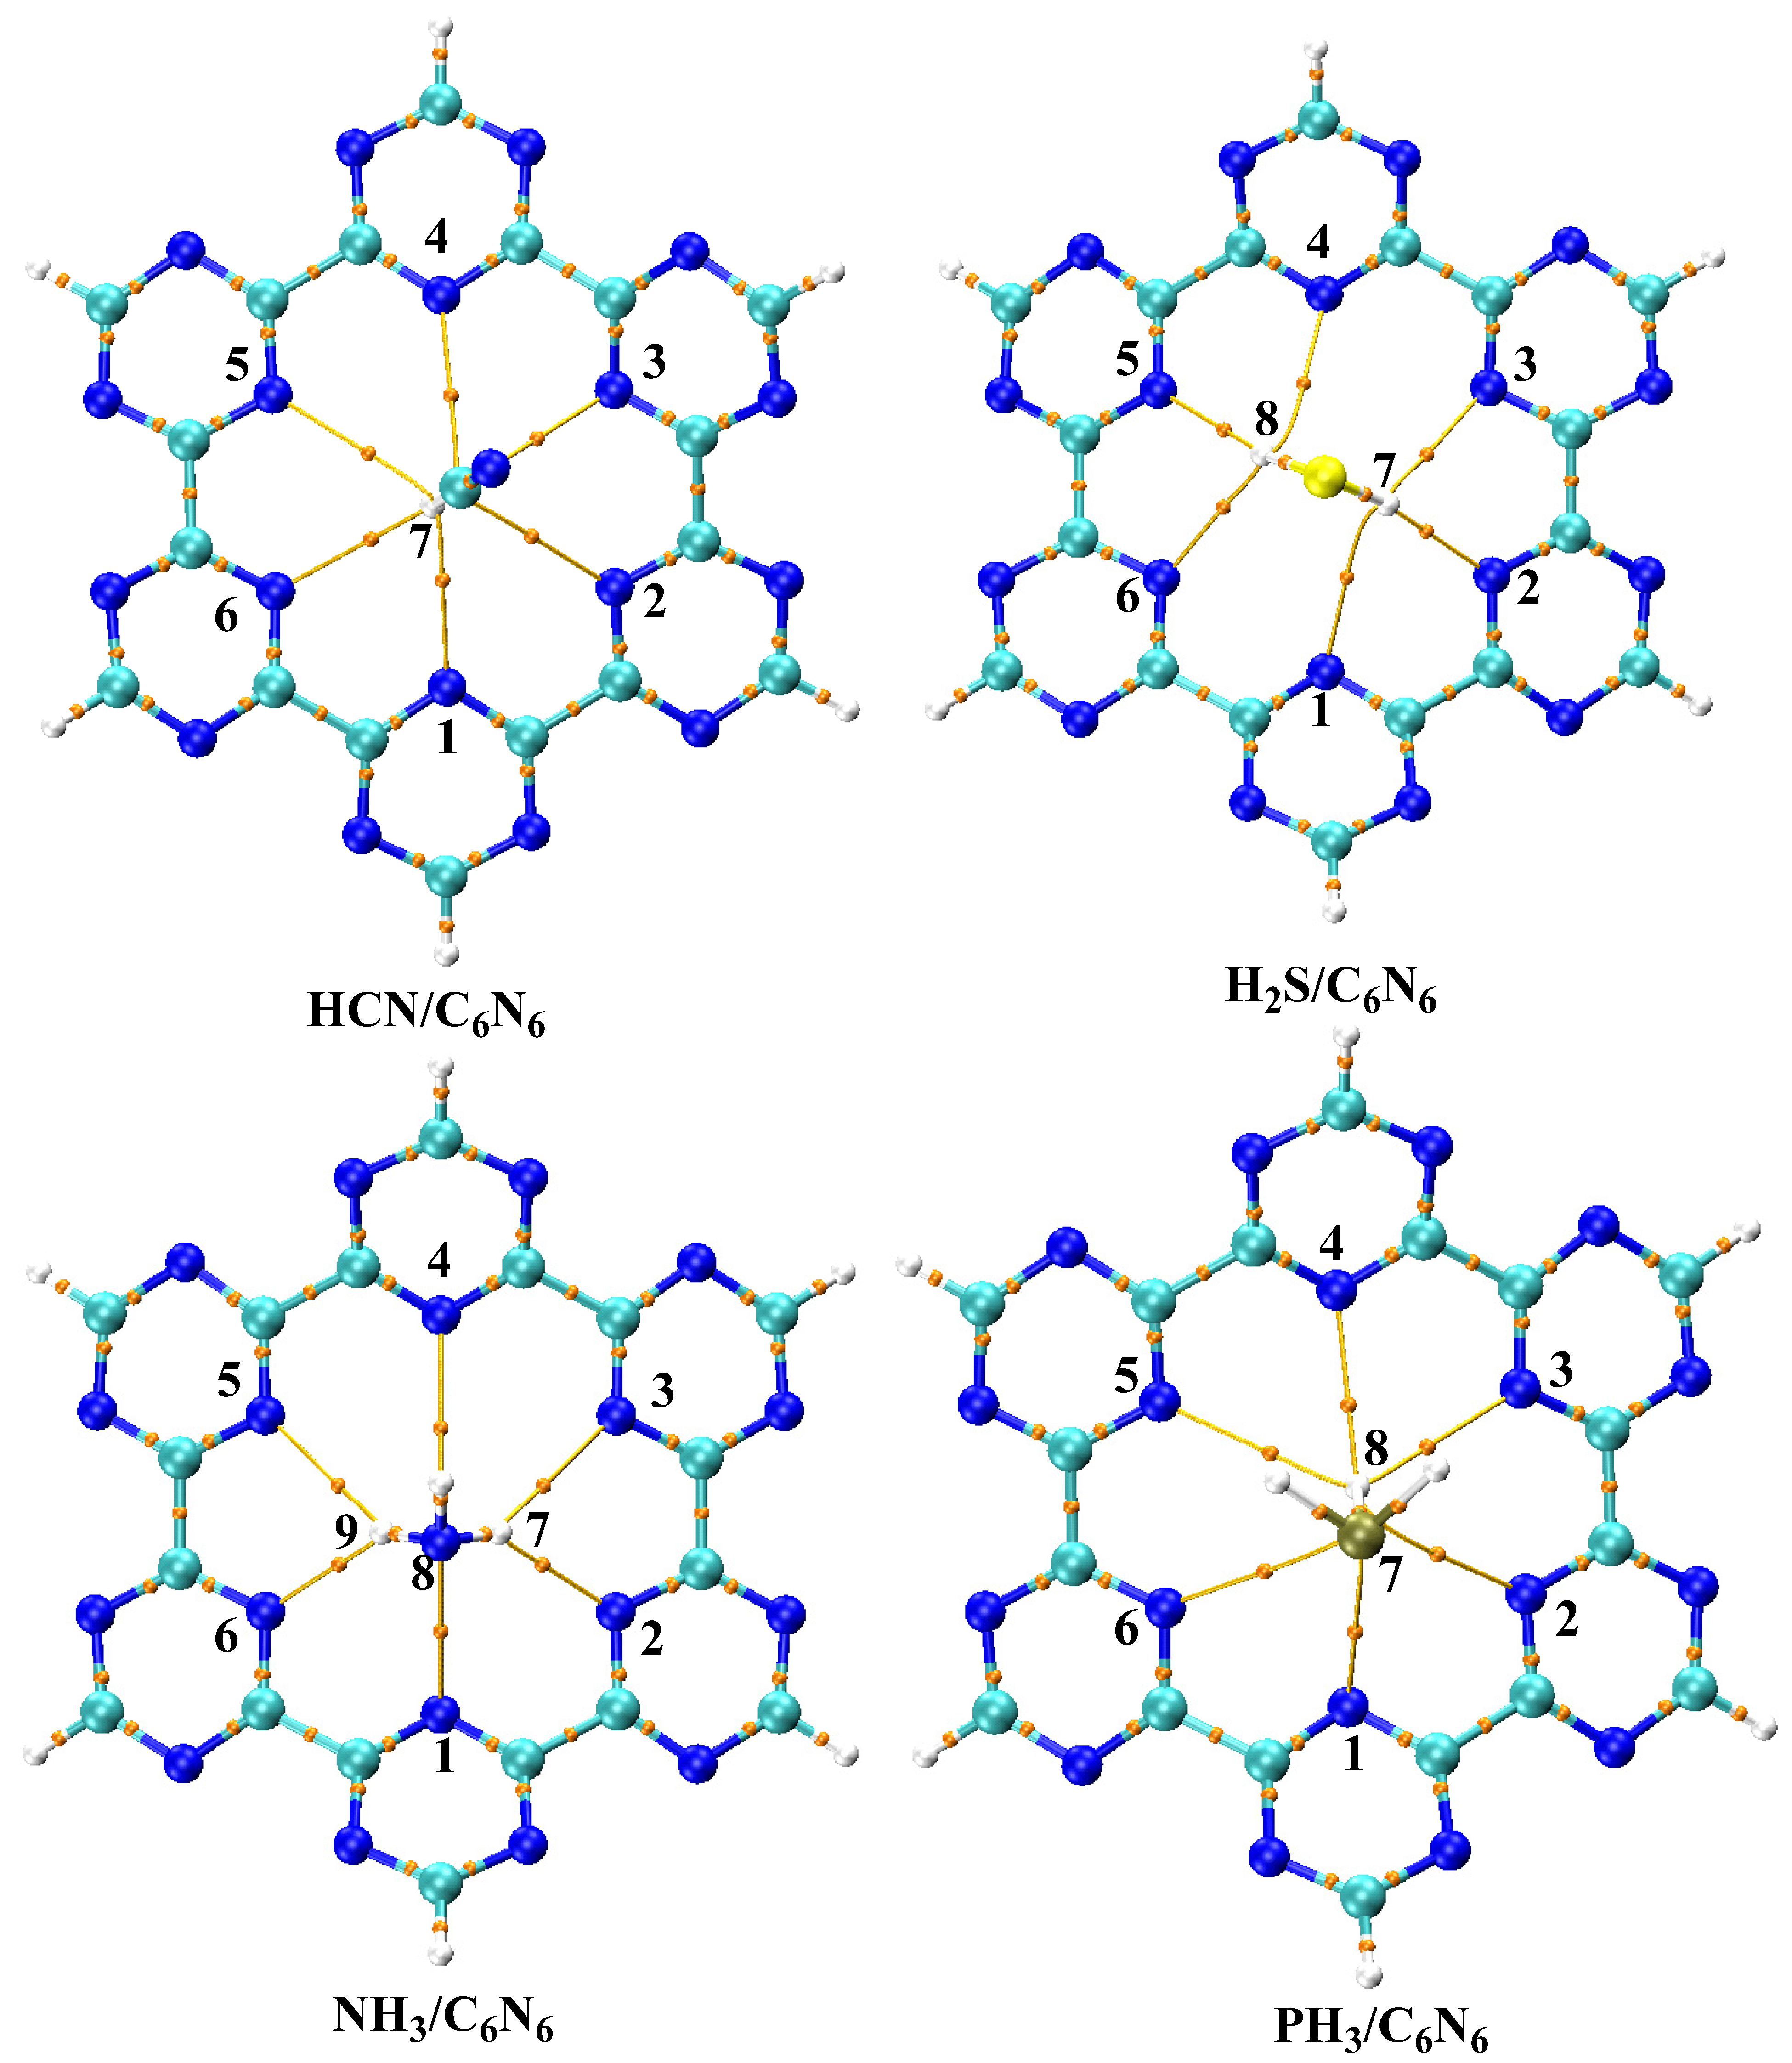
QTAIM analysis is a useful tool to investigate all non-covalent interactions which are impossible to capture through any other analysis. Through QTAIM analysis, inter- and intra-molecular interactions such as ionic interactions, hydrogen bonding, van der Waals interactions and covalent bonds can be studied. These inter- and intra-molecular interactions are studied by various parameters such as cage critical points (CCP), nuclear critical points (NCP), ring critical points (NCP) and bond critical points (BCPs). In QTAIM analyses, non-covalent interactions are best explained by BCPs. BCPs between two interacting systems are represented by a brown line (see Figure 5). The nature and strength of each BCP is explained through several parameters such as ( 2 ρ), (ρ), (H), (G) and (V). The values of the BCP parameters of all complexes are given in Table 2.
The nature of interaction is shared if 2 ρ(r) < 0, whereas for close shell interactions, the value of 2 ρ(r) > 0. For electrostatic interactions (H bonding), the values of ( 2 ρ) and (ρ) at BCPs are between 0.024 and 0.139 a.u. and 0.002 to 0.034 a.u., respectively [79,80]. In addition, a bond distance (N---H, O---H and F---H) of less than 1.2 Å indicates a strong interaction, while a bond distance greater than 1.8 Å shows a weak interaction [81]. The strength of an individual bond can also be characterized by the Espinosa approach, as presented in Equation (4) [82]. For H bonding, the energy value of an individual bond is >3 kcal/mol (in negative) [83].
E int   ( a . u . ) = 1 2 V ( r )
In addition, the BCP can further be investigated by Equation (5):
H(r) = G(r) + V(r)
where G, H and V are the kinetic, potential and total energy density at the BCPs, respectively. For close shell interactions, the value of H is usually positive, while it is negative for shared shell interactions. The type of bonding is generally indicated by 2 ρ and H. The values of 2 ρ and H are less than zero for shared shell interactions and greater than zero for close shell interactions. If the values of 2 ρ are greater than zero and H is less than zero, it indicates H bonding. Another parameter used to explain the BCP is the ratio -V/G. If the ratio of -V/G is >2, it indicates covalent bonding, and a ratio of −V/G of < 1 represents non-covalent interactions [84,85].
QTAIM analyses of all the complexes shows that number of BCPs is six in each case due to interactions of six N atoms in the C6N6 cavity with the H atoms of interacting analytes. However, the strengths and types of bonding in all complexes are different due to the different values of their BCP parameters (see Table 2). In the case of the HCN@C6N6 complex, the 2 ρ and ρ values are in the range of 0.02429 a.u. to 0.0284 a.u. and 0.00706 a.u. to 0.00814 a.u., respectively. The most stable interaction is observed between H7 of HCN and N6 of C6N6. The values of 2 ρ and ρ at BCPs between H7 and N6 are 0.0284 a.u. and 0.00814 a.u., respectively. In addition, the rest of the BCP parameter values of the HCN@C6N6 complex are in the range of electrostatic attractions, which is consistent with the SAPT0 analysis, where the dominant contribution was electrostatic. The other BCP parameters such as G, H, V, -V/G and Eint are in the range of electrostatic interactions.
A topological analysis of the H2S@C6N6 complex also shows six BCPs. Among these BCPs, two BCPs (H7---N2 and H8---N5) are in the strong electrostatic region, while the rest of the BCPs indicate dispersion interactions (see Table 2). Again, the results of the QTAIM analysis for the H2S@C6N6 complex are well matched with the SAPT0, where a good balance between electrostatic and dispersion interactions was observed. The highest values of 2 ρ (0.03965), ρ (.01586 a.u), H (0.00 a.u.) and Eint (−3.11 kcal/mol) are observed for H7---N2 and H8---N5, respectively. The BCP parameter such as 2 ρ, ρ and Eint of H7---N2 and H8---N5 are in the range of H bonding, but no such types of blue isosurface and spikes are seen in the 3D isosurfaces and 2D-RGD plots of NCI analysis. The interaction distances between H7 and N2 and H8 and N5 are 2.29 Å each, which is greater than the 1.8 Å required for interacting system to demonstrate H bonding [81].
The BCP parameter values of the NH3@C6N6 complex are in the range of medium to strong interactions between NH3 and C6N6. The strongest interactions are observed between H7 and N2 and H9 and N6 of NH3 and C6N6, respectively. The values of these two BCP parameters 2 ρ, ρ and Eint are almost comparable (see Table 2). The values of the rest of the five BCPs indicate vdWs interactions. The number of BCPs for the PH3@C6N6 complex are equal in number with other complexes. However, all BCP parameter values between the H atoms of PH3 and the N atoms of C6N6 are in the range of dispersion interactions, which is consistent with the SAPT0 interaction energy analysis, where PH3@C6N6 was the least stable complex. In all studied analyte@C6N6 complexes, the values of BCP parameters are in good agreement with NCI and SAPT0 analyses.

4. Electronic Properties

4.1. Natural Bond Orbital (NBO) and Electron Density Differences (EDD) Analyses

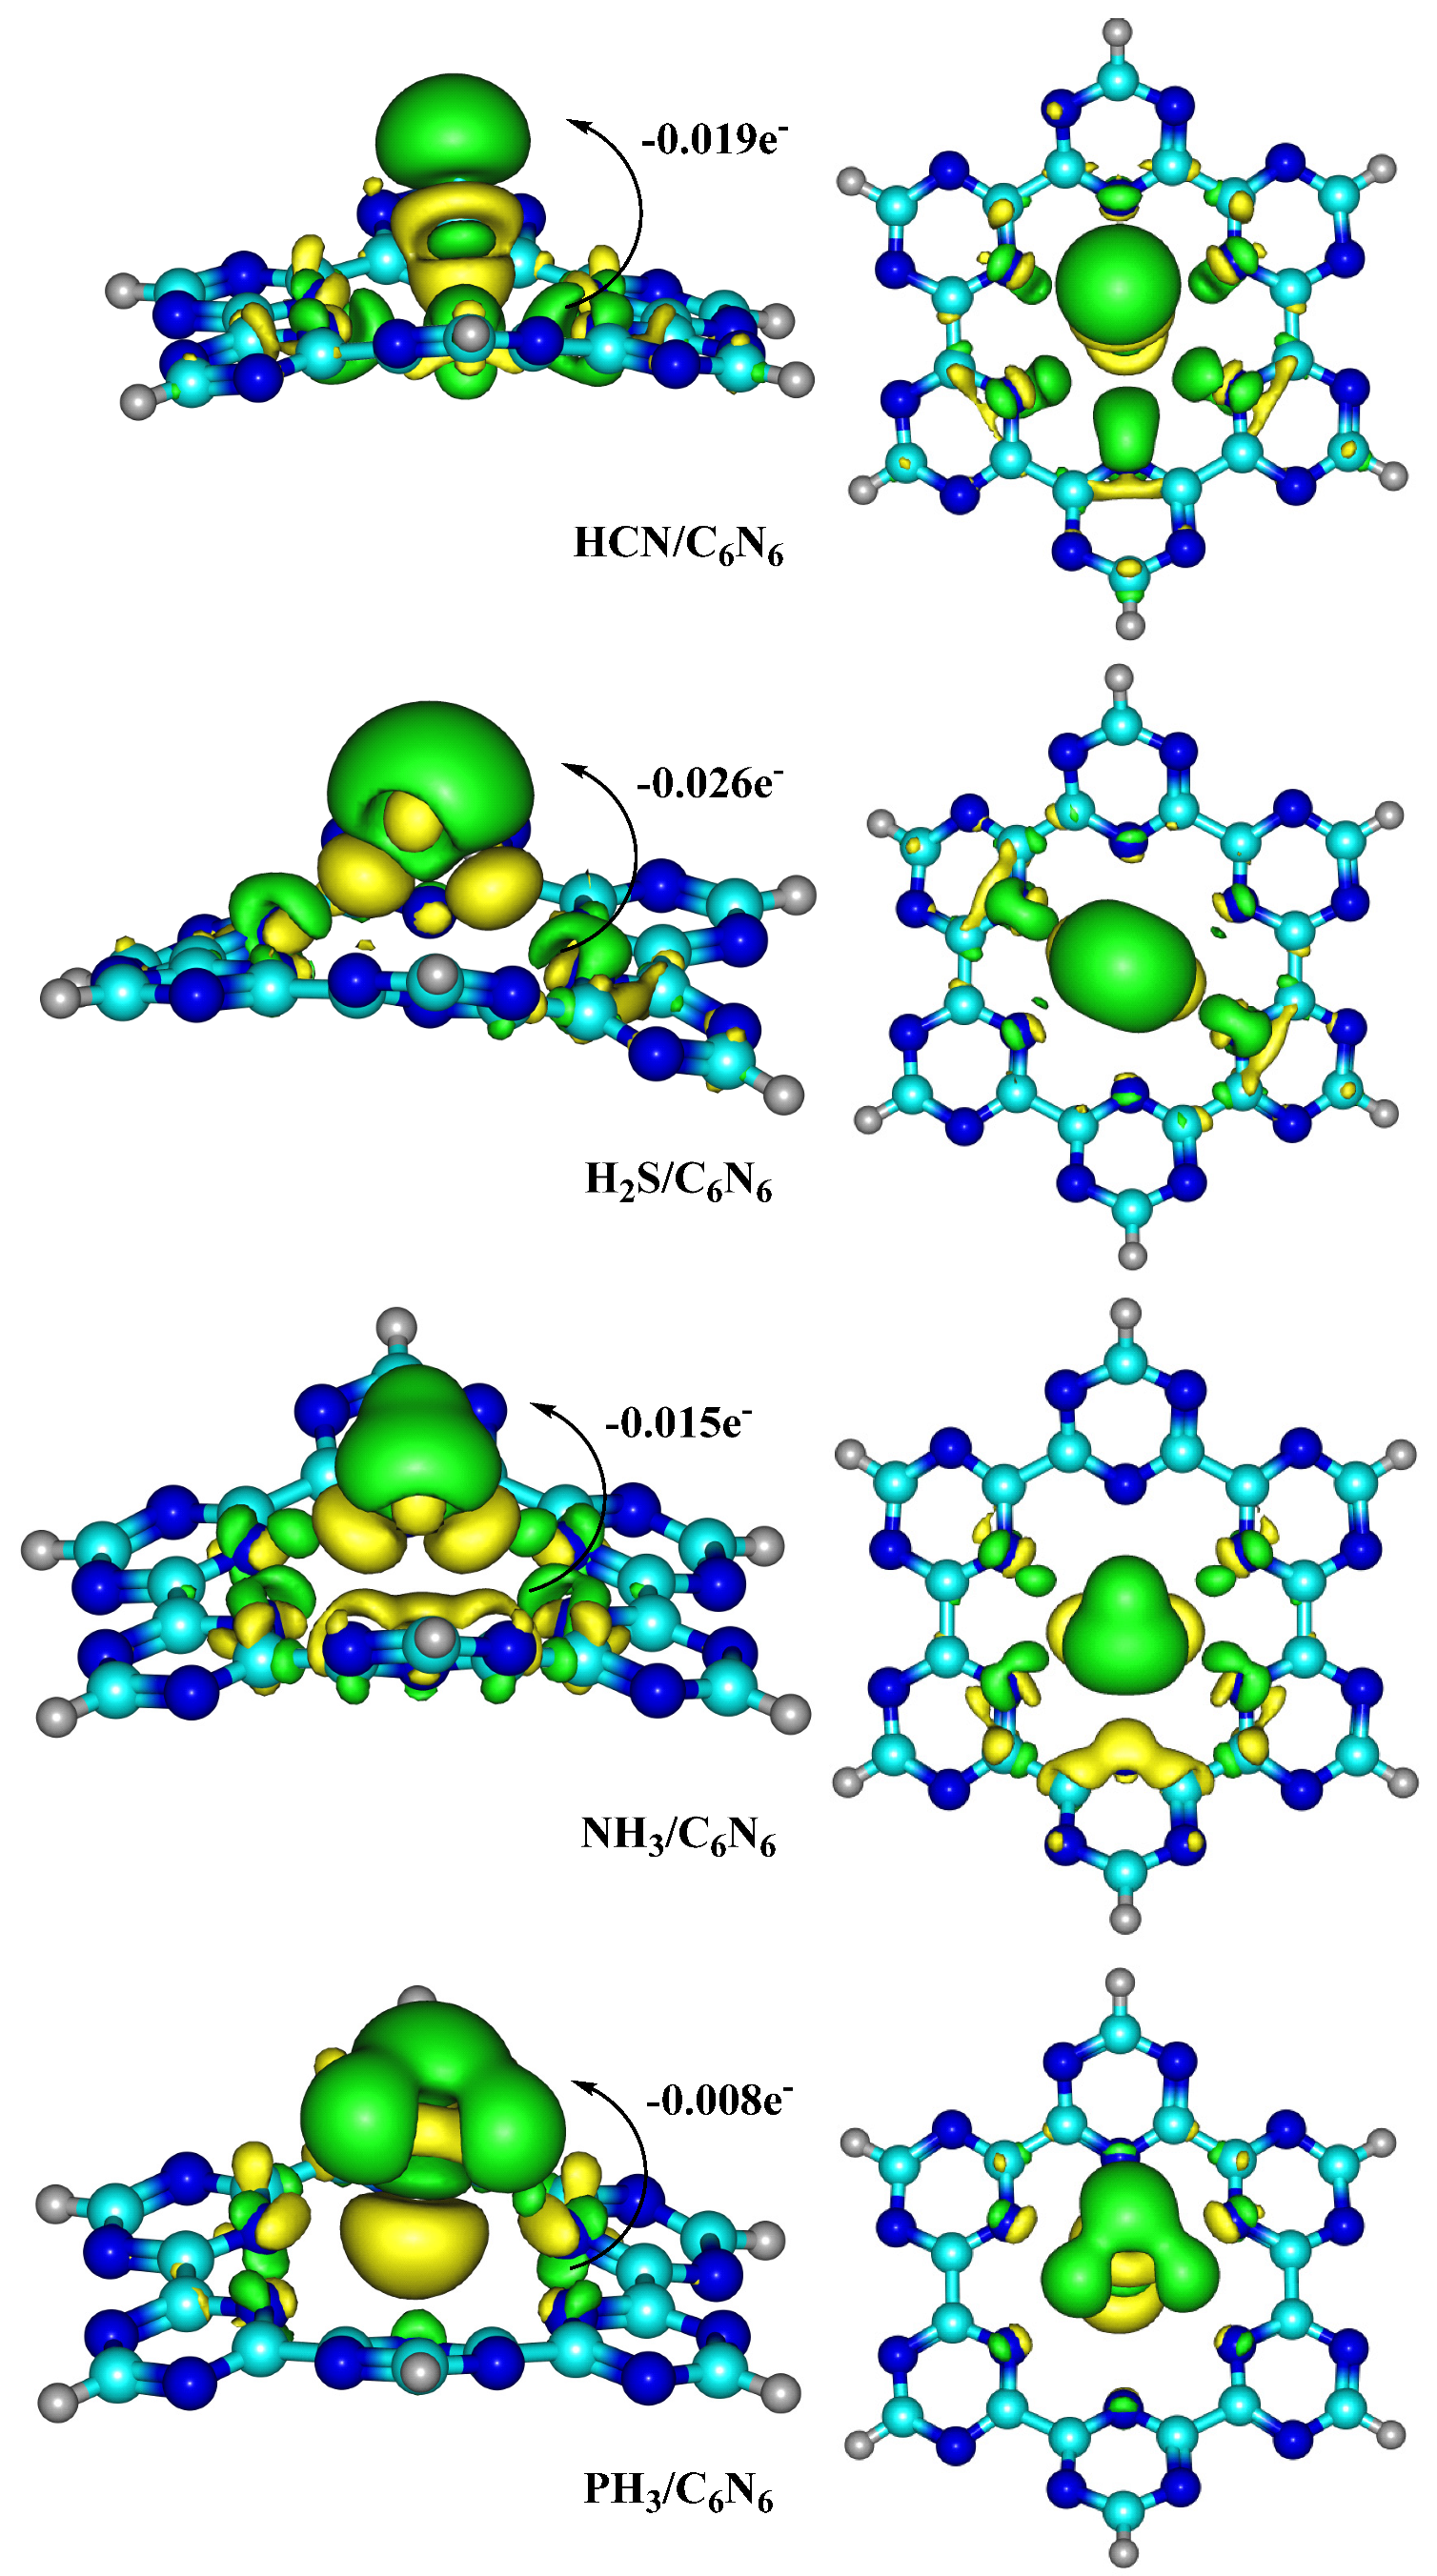
The electronic properties of complexes were explored by EDD and NBO analyses. Through these analyses of the nature of interactions, the stability, charge transfer and sensing ability of the designed surface for selected analytes can be explored. An EDD plot is obtained by subtracting the charges of individual fragments from the charge of the analyte@C6N6 complex. The topologies obtained through EDD analyses show two types of isosurface: yellow and green. The yellow surfaces reveal a depletion in charge, while a green colour illustrates an accumulation of charge. Among the studied complexes, both types of isosurface are observed in the adsorption site of analytes and the C6N6 surface, which indicates an exchange of electronic charge between them. The topologies of the complexes determined through EDD analyses are presented in Figure 6. In addition, the NBO charge values of each analyte over C6N6 are also displayed in Figure 6.
The charge transfer values from C6N6 to the analytes are −0.019 e (HCN), −0.026 e (H2S), −0.015 e (NH3) and −0.008 e (PH3). These values of charges show that the analytes extracted charge from C6N6. In all studied analytes, the H atoms of analytes interacted with the electron rich cavity of C6N6, due to which charge is transferred from C6N6 to the analytes. The highest charge value is extracted by H2S (−0.026 e) due to a close interaction of the H atoms of H2S with the N atoms of C6N6. Similarly, the accumulation and depletion of electron density in the interacting sites of C6N6 and H2S clearly indicate that the nitrogen of C6N6 transferred more charge towards H2S. In the case of HCN, a charge of −0.019 e is determined, which is contrary to its interaction energies. The EDD analysis of HCN adsorption over C6N6 shows that charge is transferred from the N atoms of C6N6 to the H atom of HCN. However, the lowest values of charge are observed in NH3 (−0.015 e) and PH3 (−0.008 e) due to the weak interactions of these analytes with the C6N6 sheet.

4.2. Frontier Molecular Orbital (FMO) Analysis

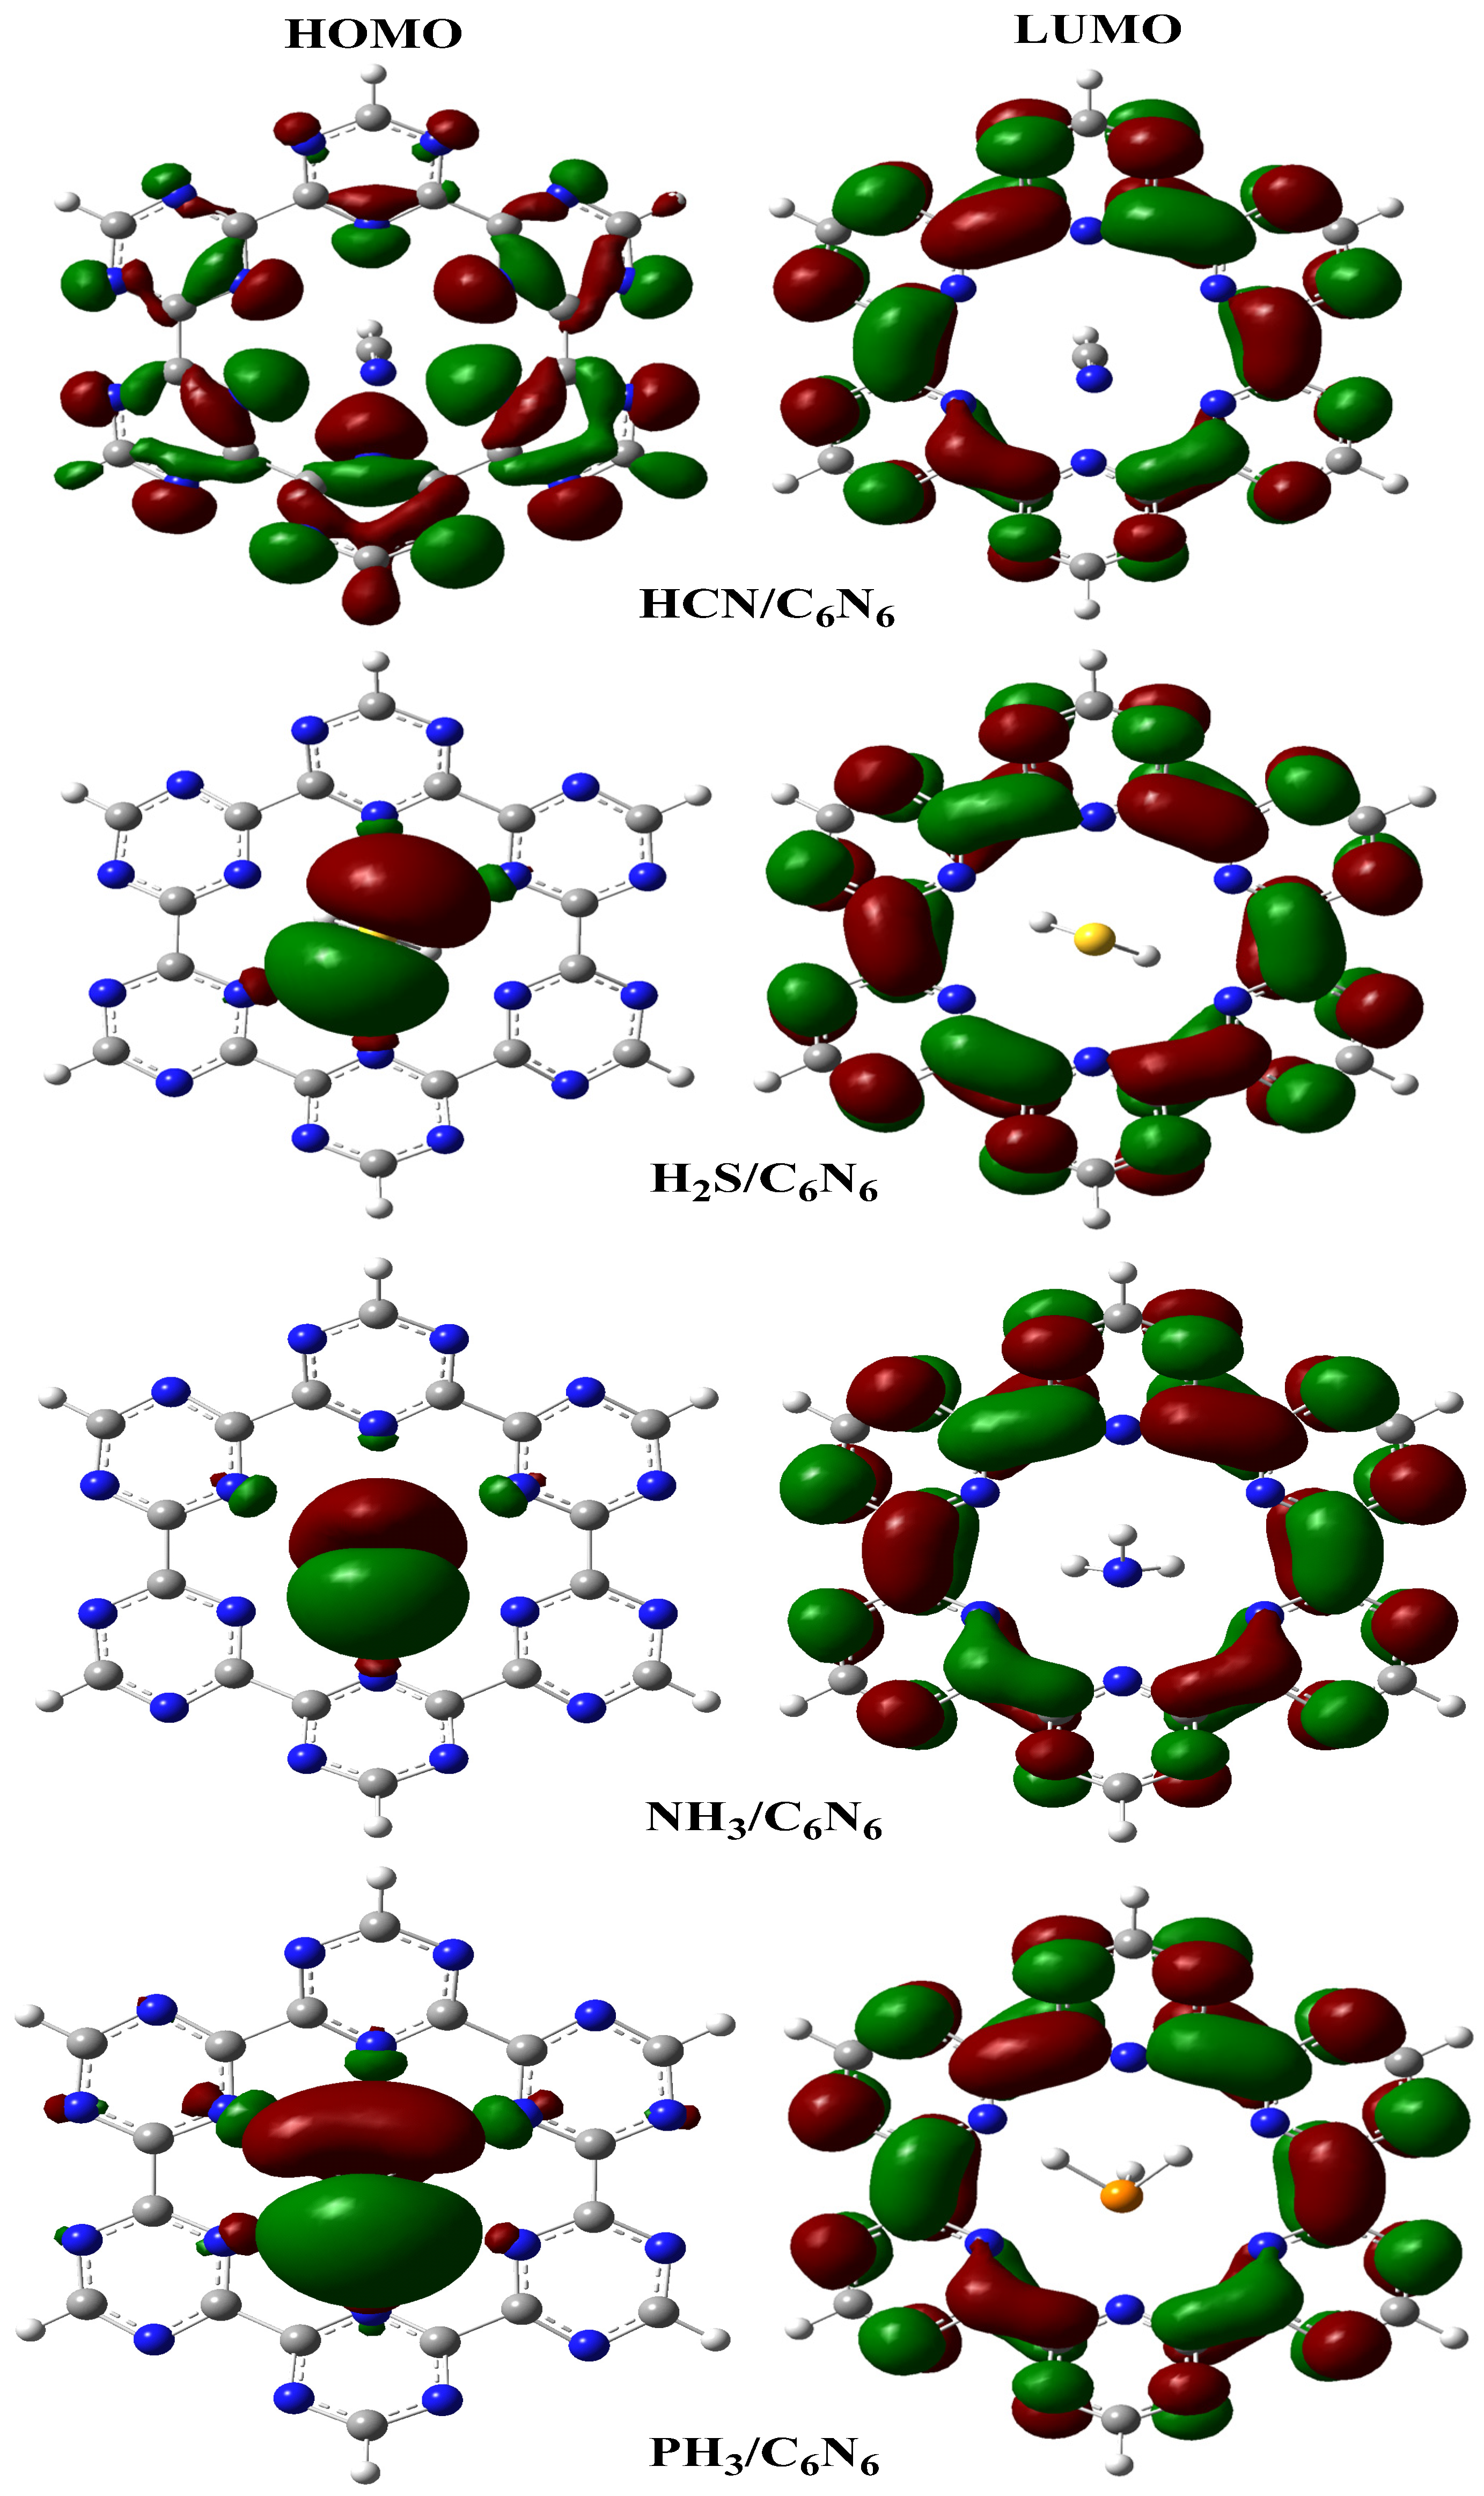
The electrical signal produced by an electrochemical sensor mainly depends on changes in its electronic properties after interaction with an analyte. To explore these changes in electronic properties of sensors, a frontier molecular orbital analysis was performed. The energy values determined from an FMO analysis of bare C6N6 and analyte@C6N6 complexes are shown in Table 3. The densities of HOMO and LUMO orbitals are presented in Figure 7. The energies of the HOMO and LUMO for C6N6 are −7.16 eV and −3.30 eV, respectively, with a HOMO–LUMO energy gap (EH-L gap) of 3.86 eV. The interaction of selected industrial pollutants with C6N6 causes prominent changes in the energy levels of the HOMO, LUMO and EH-L gap. The computed values of the EH-L gaps of HCN@C6N6, H2S@C6N6, NH3@C6N6 and PH3@C6N6 complexes are 4.02 eV, 2.76 eV, 2.58 eV and 3.35 eV, respectively.
The results presented in Table 3 show that adsorption of H2S, NH3 and PH3 on C6N6 causes a pronounced increase in the HOMO energy, while the LUMO energy of these complexes remains almost unchanged. However, adsorption of HCN shows the inverse behaviour, where a significant decrease in the HOMO energy (−7.43 eV) is noticed compared to C6N6 (−7.16 eV). A more pronounced decrease in the HOMO energy causes an increase in the EH-L gap (4.02 eV) of the HCN@C6N6 complex compared to bare C6N6 (3.86 eV). This increase in the EH-L gap of the HCN@C6N6 complex indicates a decrease in the conductivity of C6N6. As a result, C6N6 cannot act as a good sensor for HCN.
Adsorption of H2S onto C6N6 resulted in a prominent increase in the energy of the HOMO (−6.07 eV), while the LUMO energy (−3.31 eV) is almost comparable to bare C6N6 (−3.30 eV). This increase in the HOMO energy resulted in a pronounced reduction in the EH-L gap (2.76 eV) of the H2S@C6N6 complex. Among the different industrial pollutants adsorbed on C6N6, the most significant increase in electrical conductivity is observed for the NH3@C6N6 complex due to an appreciable decrease in the EH-L gap. The energies of the HOMO and LUMO for the NH3@C6N6 complex are 5.85 eV and −3.27 eV, respectively. The interaction of PH3 changes the HOMO (−6.62 eV) and LUMO (−3.27 eV) energies in such a way that a negligible decrease in the EH-L gap (3.35 eV) is observed for the PH3@C6N6 complex. Among the studied analyte@C6N6 complexes, the highest decrease in the EH-L gap is observed for NH3@C6N6. This indicates that C6N6 can act as potential surface for this analyte. Thus, it is concluded that C6N6 is highly selective towards NH3 compared to the other studied analytes.
After adsorption of industrial pollutants (HCN, H2S, NH3 and PH3) onto C6N6, the dispersal of orbitals densities was also explored in order to comprehend the sensing abilities of C6N6. We observed three types of orbital distribution patterns. In the case of the HCN@C6N6 complex, the orbital densities are localized on the triazine ring. In the HOMO, the orbital densities are observed on the carbon and nitrogen of the triazine ring, while in the LUMO, the orbital densities are shifted to the carbon of the triazine ring. This shows that analytes do not participate in the electronic shift from the HOMO to the LUMO (see Figure 7).
The intra shift of electronic orbital densities causes an increase in the EH-L gap compared to bare C6N6. In H2S@C6N6 and PH3@C6N6 complexes, the major portion of the HOMO density is located on the analyte, with some sharing with the N atoms of C6N6, while the LUMO density is completely shifted onto C6N6. Such a type of electronic transition causes a significant change in the EH-L gap. A third type of electronic transition is observed in the NH3@C6N6 complex, where the HOMO is completely located on NH3, while the LUMO is shifted to C6N6 (see Figure 7). Such a type of electronic transition brings about a significant change in the EH-L gap. The same sort of behaviour was observed by us previously in a study of the same analytes over C2N. The transition of orbital density from analytes to the C2N surface causes considerable changes in the EH-L gaps [34,71,72].
We compared the adsorption energies of our studied system with those available in the literature for different COFs. The adsorption energies of H-containing analytes are comparable or somewhat higher than already reported values on other surfaces. An adsorption energy of −12.27 kcal/mol is observed for the NH3@C6N6 complex, whereas in the literature, adsorption energies of −5.27 kcal/mol, −10.68 kcal/mol and −6.65 kcal/mol are observed for NH3@CTF-FUM, NH3@C2N and NH3@CTF-0 complexes, respectively. In addition, interaction energies of −15.24 kcal/mol, −3.79 kcal/mol and −2.34 kcal/mol are observed for HCN@CTF-FUM, H2S@CTF-FUM and PH3@CTF-FUM, respectively. The adsorption energies of the rest of the complexes are given in Table 4 and reveal that C6N6 can act as a better surface for electrochemical sensing of H-containing analytes.

5. Conclusions

The electrochemical sensing application of C6N6 is evaluated by DFT simulations at the wb97xd/6-31g(d,p) level of theory. The adsorption of industrial pollutants over C6N6 occurred through physisorption, with adsorption energies ranging from −9.36 kcal/mol to −16.46 kcal/mol. Among the considered analytes, the maximum energy is observed for HCN@C6N6 (−16.46 kcal/mol). The non-covalent interactions of analyte@C6N6 complexes are explored through symmetry-adapted perturbation theory (SAPT0), quantum theory of atoms in molecules (QTAIM) analyses and non-covalent interaction (NCI) analyses. The attractive components in SAPT0 analyses show that electrostatic and dispersive interactions play a dominant role in the stabilization of analytes in the C6N6 cavity. Similarly, NCI and QTAIM analyses also verified the findings of SAPT0 and interaction energy analyses. In addition, the electron density (ρBCP) and Laplacian of electron density (∇2ρbcp) remained high for the HCN@C6N6 complex, which is consistent with the NCI and SAPT0 results. The electronic properties of analyte@C6N6 complexes are investigated by electron density difference (EDD), natural bond orbital analyses (NBO) and frontier molecular orbital analyses (FMO). Charge is transferred from the C6N6 sheet to HCN, H2S, NH3 and PH3. The highest exchange of charge is noted for H2S (−0.026 e). The results of FMO analyses show that the interaction of all analytes results in changes in the EH-L gap of the C6N6 sheet. However, the highest decrease in the EH-L gap (2.58 eV) is observed for the NH3@C6N6 complex compared to other studied analyte@C6N6 complexes. The orbital density pattern shows that the HOMO density is completely concentrated on NH3, while the LUMO density is transferred towards C6N6. This indicates that C6N6 can act as potential surface for these analytes. Hence, which analyte is more selective towards C6N6 depends on its electrical conductivity and not its adsorption. Thus, it is concluded that C6N6 is highly selective towards NH3 compared to the other studied analytes.

Supplementary Materials

The following supporting information can be downloaded at: https://www.mdpi.com/article/10.3390/nano13061121/s1, Figure S1 caption: Optimized geometries of least stable complexes of each analyte over C6N6 at Ꞷb97XD/6-31G (d,p) level of theory.(HCN/C6N6 complexes (A-C), H2S/C6N6 complexes (D-F), NH3/C6N6 complexes (G-I), PH3/C6N6 complexes (J).

Author Contributions

Conceptualization, M.Y. and H.H.H.; methodology, K.A.; software, K.A.; validation, K.A. and I.B.; formal analysis, I.B.; investigation, M.Y.; resources, H.H.H.; data curation, M.Y.; writing—original draft preparation, H.H.H. and M.Y.; writing—review and editing, K.A.; visualization, M.Y.; supervision, H.H.H. and K.A.; project administration, H.H.H.; funding acquisition, H.H.H. All authors have read and agreed to the published version of the manuscript.

Funding

This research work was funded by the Deputyship for Research and Innovation, Ministry of Education in Saudi Arabia, project number INST158.

Acknowledgments

The authors extend their appreciation to the Deputyship for Research and Innovation, Ministry of Education in Saudi Arabia, for funding this research work (project number INST158).

Conflicts of Interest

The authors declare no conflict of interest.

References

  1. Laplaza, R.; Peccati, F.; Boto, R.A.; Quan, C.; Carbone, A.; Piquemal, J.P.; Maday, Y.; Contreras-García, J. NCIPLOT and the Analysis of Noncovalent Interactions Using the Reduced Density Gradient. Wiley Interdiscip. Rev. Comput. Mol. Sci. 2021, 11, e1497. [Google Scholar] [CrossRef]
  2. Wang, Y.; Ning, P.; Zhao, R.; Li, K.; Wang, C.; Sun, X.; Song, X.; Lin, Q. A Cu-Modified Active Carbon Fiber Significantly Promoted H2S and PH3 Simultaneous Removal at a Low Reaction Temperature. Front. Environ. Sci. Eng. 2021, 15, 132. [Google Scholar] [CrossRef]
  3. Haridas, V.; Sukhananazerin, A.; Sneha, J.M.; Pullithadathil, B.; Narayanan, B. α-Fe2O3 Loaded Less-Defective Graphene Sheets as Chemiresistive Gas Sensor for Selective Sensing of NH3. Appl. Surf. Sci. 2020, 517, 146158. [Google Scholar] [CrossRef]
  4. Farooqi, B.A.; Yar, M.; Ashraf, A.; Farooq, U.; Ayub, K. Polyaniline emeraldine salt as selective electrochemical sensor for HBr over HCl: A systematic density functional theory study through oligomer approach. J. Mol. Model. 2020, 26, 332. [Google Scholar] [CrossRef] [PubMed]
  5. Khan, S.; Yar, M.; Kosar, N.; Ayub, K.; Arshad, M.; Zahid, N.; Mahmood, T. First-principles study for exploring the adsorption behavior of G-series nerve agents on graphdyine surface. Comput. Theor. Chem. 2020, 1191, 113043. [Google Scholar] [CrossRef]
  6. Matthews, C.N. Dark Matter in the Solar System: Hydrogen Cyanide Polymers. Orig. Life Evol. Biosph. 1991, 21, 421–434. [Google Scholar] [CrossRef]
  7. Ding, Y.; Li, X.; Chen, C.; Ling, J.; Li, W.; Guo, Y.; Yan, J.; Zha, L.; Cai, J. A Rapid Evaluation of Acute Hydrogen Sulfide Poisoning in Blood Based on DNA-Cu/Ag Nanocluster Fluorescence Probe. Sci. Rep. 2017, 7, 9638. [Google Scholar] [CrossRef]
  8. Lemus, J.; Bedia, J.; Moya, C.; Alonso-Morales, N.; Gilarranz, M.A.; Palomar, J.; Rodriguez, J.J. Ammonia Capture from the Gas Phase by Encapsulated Ionic Liquids (ENILs). RSC Adv. 2016, 6, 61650–61660. [Google Scholar] [CrossRef] [Green Version]
  9. Bai, Z.; Dong, Y.; Wang, Z.; Zhu, T. Emission of Ammonia from Indoor Concrete Wall and Assessment of Human Exposure. Environ. Int. 2006, 32, 303–311. [Google Scholar] [CrossRef]
  10. Nath, N.S.; Bhattacharya, I.; Tuck, A.G.; Schlipalius, D.I.; Ebert, P.R. Mechanisms of Phosphine Toxicity. J. Toxicol. 2011, 2011, 494168. [Google Scholar] [CrossRef] [Green Version]
  11. Zhou, X.; Su, Z.; Chen, H.; Xiao, X.; Qin, Y.; Yang, L.; Yan, Z.; Sun, W. Capture of Pure Toxic Gases through Porous Materials from Molecular Simulations. Mol. Phys. 2018, 116, 2095–2107. [Google Scholar] [CrossRef]
  12. Li, J.-R.; Kuppler, R.J.; Zhou, H.-C. Selective Gas Adsorption and Separation in Metal–Organic Frameworks. Chem. Soc. Rev. 2009, 38, 1477. [Google Scholar] [CrossRef] [PubMed]
  13. Yar, M.; Ahsan, F.; Gulzar, A.; Ayub, K. Adsorption and Sensor Applications of C2N Surface for G-Series and Mustard Series Chemical Warfare Agents. Microporous Mesoporous Mater. 2021, 317, 110984. [Google Scholar] [CrossRef]
  14. He, Y.; Li, D.; Gao, W.; Yin, H.; Chen, F.; Sun, Y. High-Performance NO2 Sensors based on Spontaneously Functionalized Hexagonal Boron Nitride Nanosheets via Chemical Exfoliation. Nanoscale 2019, 11, 21909–21916. [Google Scholar] [CrossRef]
  15. Wang, C.; Yin, L.; Zhang, L.; Xiang, D.; Gao, R. Metal Oxide Gas Sensors: Sensitivity and Influencing Factors. Sensors 2010, 10, 2088–2106. [Google Scholar] [CrossRef] [PubMed] [Green Version]
  16. Lu, G.; Hupp, J.T. Metal−Organic Frameworks as Sensors: A ZIF-8 Based Fabry−Pérot Device as a Selective Sensor for Chemical Vapors and Gases. J. Am. Chem. Soc. 2010, 132, 7832–7833. [Google Scholar] [CrossRef] [Green Version]
  17. Rowsell, J.L.C.; Yaghi, O.M. Effects of Functionalization, Catenation, and Variation of the Metal Oxide and Organic Linking Units on the Low-Pressure Hydrogen Adsorption Properties of Metal−Organic Frameworks. J. Am. Chem. Soc. 2006, 128, 1304–1315. [Google Scholar] [CrossRef]
  18. Rostami, Z.; Soleymanabadi, H. Investigation of Phosgene Adsorption Behavior on Aluminum Nitride Nanocones: Density Functional Study. J. Mol. Liq. 2017, 248, 473–478. [Google Scholar] [CrossRef]
  19. Deng, Z.-Y.; Zhang, J.-M.; Xu, K.-W. Adsorption of SO2 Molecule on Doped (8, 0) Boron Nitride Nanotube: A First-Principles Study. Phys. E Low Dimens. Syst. Nanostruct. 2016, 76, 47–51. [Google Scholar] [CrossRef]
  20. Broitman, E.; Gueorguiev, G.K.; Furlan, A.; Son, N.T.; Gellman, A.J.; Stafström, S.; Hultman, L. Water Adsorption on Fullerene-like Carbon Nitride Overcoats. Thin Solid Films 2008, 517, 1106–1110. [Google Scholar] [CrossRef]
  21. Yuan, J.; Li, G.; Yang, B.; Zhang, J.; Li, Z.; Chen, H. Selective Adsorption of Ethylene on Bimetallic CuVn+/0 (n = 1–5) Clusters: A Theoretical Study. Comput. Mater. Sci. 2016, 111, 489–496. [Google Scholar] [CrossRef]
  22. Broitman, E.; Furlan, A.; Gueorguiev, G.K.; Czigány, Z.; Tarditi, A.M.; Gellman, A.J.; Stafström, S.; Hultman, L. Water Adsorption on Phosphorous-Carbide Thin Films. Surf. Coat. Technol. 2009, 204, 1035–1039. [Google Scholar] [CrossRef]
  23. Korotcenkov, G. Metal Oxides for Solid-State Gas Sensors: What Determines Our Choice? Mater. Sci. Eng. B 2007, 139, 1–23. [Google Scholar] [CrossRef]
  24. Sahoo, H.R.; Kralj, J.G.; Jensen, K.F. Multistep Continuous-Flow Microchemical Synthesis Involving Multiple Reactions and Separations. Angew. Chemie Int. Ed. 2007, 46, 5704–5708. [Google Scholar] [CrossRef] [PubMed]
  25. Sangiovanni, D.G.; Gueorguiev, G.K.; Kakanakova-Georgieva, A. Ab Initio Molecular Dynamics of Atomic-Scale Surface Reactions: Insights into Metal Organic Chemical Vapor Deposition of AlN on Graphene. Phys. Chem. Chem. Phys. 2018, 20, 17751–17761. [Google Scholar] [CrossRef] [Green Version]
  26. Anota, E.C.; Juárez, A.R.; Castro, M.; Cocoletzi, H.H. A Density Functional Theory Analysis for the Adsorption of the Amine Group on Graphene and Boron Nitride Nanosheets. J. Mol. Model. 2013, 19, 321–328. [Google Scholar] [CrossRef]
  27. Limon, P.; Miralrio, A.; Castro, M. Adsorption and Dissociation of Carbon Monoxide on Iron and Iron-Carbon Clusters: Fen + 2CO and FenC + 2CO, N = 4 and 7. A Theoretical Study. Comput. Theor. Chem. 2018, 1129, 37–47. [Google Scholar] [CrossRef]
  28. Online, V.A. RSC Advances Long Range Corrected-WPBE Based Analysis of the H2O Adsorption on Magnetic BC3 Nanosheets. RSC Adv. 2016, 6, 20409–20421. [Google Scholar] [CrossRef]
  29. Baughman, R.H. Carbon Nanotubes—The Route Toward Applications. Science 2002, 297, 787–792. [Google Scholar] [CrossRef] [Green Version]
  30. Rafiee, M.A.; Rafiee, J.; Wang, Z.; Song, H.; Yu, Z.-Z.; Koratkar, N. Enhanced Mechanical Properties of Nanocomposites at Low Graphene Content. ACS Nano 2009, 3, 3884–3890. [Google Scholar] [CrossRef]
  31. Yang, X.; Cheng, C.; Wang, Y.; Qiu, L.; Li, D. Liquid-Mediated Dense Integration of Graphene Materials for Compact Capacitive Energy Storage. Science 2013, 341, 534–537. [Google Scholar] [CrossRef] [PubMed]
  32. Ni, Z.; Liu, Q.; Tang, K.; Zheng, J.; Zhou, J.; Qin, R.; Gao, Z.; Yu, D.; Lu, J. Tunable Bandgap in Silicene and Germanene. Nano Lett. 2012, 12, 113–118. [Google Scholar] [CrossRef] [PubMed]
  33. Wang, Q.H.; Kalantar-Zadeh, K.; Kis, A.; Coleman, J.N.; Strano, M.S. Electronics and Optoelectronics of Two-Dimensional Transition Metal Dichalcogenides. Nat. Nanotechnol. 2012, 7, 699–712. [Google Scholar] [CrossRef] [PubMed]
  34. Xu, M.; Liang, T.; Shi, M.; Chen, H. Graphene-Like Two-Dimensional Materials. Chem. Rev. 2013, 113, 3766–3798. [Google Scholar] [CrossRef]
  35. Vogt, P.; De Padova, P.; Quaresima, C.; Avila, J.; Frantzeskakis, E.; Asensio, M.C.; Resta, A.; Ealet, B.; Le Lay, G. Silicene: Compelling Experimental Evidence for Graphenelike Two-Dimensional Silicon. Phys. Rev. Lett. 2012, 108, 155501. [Google Scholar] [CrossRef] [PubMed]
  36. Jose, D.; Datta, A. Structures and Chemical Properties of Silicene: Unlike Graphene. Acc. Chem. Res. 2014, 47, 593–602. [Google Scholar] [CrossRef]
  37. Liu, H.; Neal, A.T.; Zhu, Z.; Luo, Z.; Xu, X.; Tománek, D.; Ye, P.D. Phosphorene: An Unexplored 2D Semiconductor with a High Hole Mobility. ACS Nano 2014, 8, 4033–4041. [Google Scholar] [CrossRef] [Green Version]
  38. Meric, I.; Han, M.Y.; Young, A.F.; Ozyilmaz, B.; Kim, P.; Shepard, K.L. Current Saturation in Zero-Bandgap, Top-Gated Graphene Field-Effect Transistors. Nat. Nanotechnol. 2008, 3, 654–659. [Google Scholar] [CrossRef]
  39. Zhang, Y.-H.; Chen, Y.-B.; Zhou, K.-G.; Liu, C.-H.; Zeng, J.; Zhang, H.-L.; Peng, Y. Improving Gas Sensing Properties of Graphene by Introducing Dopants and Defects: A First-Principles Study. Nanotechnology 2009, 20, 185504. [Google Scholar] [CrossRef] [Green Version]
  40. Wang, X.; Sun, G.; Routh, P.; Kim, D.-H.; Huang, W.; Chen, P. Heteroatom-Doped Graphene Materials: Syntheses, Properties and Applications. Chem. Soc. Rev. 2014, 43, 7067–7098. [Google Scholar] [CrossRef] [Green Version]
  41. Zhang, W.; Lin, C.-T.; Liu, K.-K.; Tite, T.; Su, C.-Y.; Chang, C.-H.; Lee, Y.-H.; Chu, C.-W.; Wei, K.-H.; Kuo, J.-L.; et al. Opening an Electrical Band Gap of Bilayer Graphene with Molecular Doping. ACS Nano 2011, 5, 7517–7524. [Google Scholar] [CrossRef]
  42. Cote, A.P. Porous, Crystalline, Covalent Organic Frameworks. Science 2005, 310, 1166–1170. [Google Scholar] [CrossRef] [Green Version]
  43. Ma, H.; Liu, B.; Li, B.; Zhang, L.; Li, Y.-G.; Tan, H.-Q.; Zang, H.-Y.; Zhu, G. Cationic Covalent Organic Frameworks: A Simple Platform of Anionic Exchange for Porosity Tuning and Proton Conduction. J. Am. Chem. Soc. 2016, 138, 5897–5903. [Google Scholar] [CrossRef]
  44. Ning, G.-H.; Liu, C.; Loh, K.P.; Leng, K.; Tang, W.; Gao, Q.; Xu, H.-S.; Tian, B.; Li, X. Highly Photoluminescent Two-Dimensional Imine-Based Covalent Organic Frameworks for Chemical Sensing. Chem. Commun. 2018, 54, 2349–2352. [Google Scholar] [CrossRef]
  45. Zhu, M.W.; Xu, S.Q.; Wang, X.Z.; Chen, Y.; Dai, L.; Zhao, X. The Construction of Fluorescent Heteropore Covalent Organic Frameworks and Their Applications in Spectroscopic and Visual Detection of Trinitrophenol with High Selectivity and Sensitivity. Chem. Commun. 2018, 54, 2308–2311. [Google Scholar] [CrossRef]
  46. Cui, F.; Liang, R.; Qi, Q.; Jiang, G.; Zhao, X. Efficient Removal of Cr(VI) from Aqueous Solutions by a Dual-Pore Covalent Organic Framework. Adv. Sustain. Syst. 2019, 3, 1800150. [Google Scholar] [CrossRef]
  47. Jansone-Popova, S.; Moinel, A.; Schott, J.A.; Mahurin, S.M.; Popovs, I.; Veith, G.M.; Moyer, B.A. Guanidinium-Based Ionic Covalent Organic Framework for Rapid and Selective Removal of Toxic Cr(VI) Oxoanions from Water. Environ. Sci. Technol. 2019, 53, 878–883. [Google Scholar] [CrossRef]
  48. Jiang, Q.; Huang, H.; Tang, Y.; Zhang, Y.; Zhong, C. Highly Porous Covalent Triazine Frameworks for Reversible Iodine Capture and Efficient Removal of Dye. Ind. Eng. Chem. Res. 2018, 57, 15114–15121. [Google Scholar] [CrossRef]
  49. Fayyaz, F.; Yar, M.; Gulzar, A.; Ayub, K. First principles calculations of the adsorption of fluorouracil and nitrosourea on CTF-0; organic frameworks as drug delivery systems for cancer treatment. J. Mol. Liq. 2022, 356, 118941. [Google Scholar] [CrossRef]
  50. Liao, L.; Li, M.; Yin, Y.; Chen, J.; Zhong, Q.; Du, R.; Liu, S.; He, Y.; Fu, W.; Zeng, F. Advances in the Synthesis of Covalent Triazine Frameworks. ACS Omega 2023, 8, 4527–4542. [Google Scholar] [CrossRef]
  51. Sarfaraz, S.; Yar, M.; Ans, M.; Gilani, M.A.; Ludwig, R.; Hashmi, M.A.; Hussain, M.; Muhammad, S.; Ayub, K. Computational Investigation of a Covalent Triazine Framework (CTF-0) as an Efficient Electrochemical Sensor. RSC Adv. 2022, 12, 3909–3923. [Google Scholar] [CrossRef] [PubMed]
  52. Yang, K.; Yuan, W.; Hua, Z.; Tang, Y.; Yin, F.; Xia, D. Triazine-Based Two-Dimensional Organic Polymer for Selective NO2 Sensing with Excellent Performance. ACS Appl. Mater. Interfaces 2020, 12, 3919–3927. [Google Scholar] [CrossRef] [PubMed]
  53. Liu, M.; Guo, L.; Jin, S.; Tan, B. Covalent Triazine Frameworks: Synthesis and Applications. J. Mater. Chem. A 2019, 7, 5153–5172. [Google Scholar] [CrossRef]
  54. Liang, D.; Jing, T.; Ma, Y.; Hao, J.; Sun, G.; Deng, M. Photocatalytic Properties of G-C6N6/g-C3N4 Heterostructure: A Theoretical Study. J. Phys. Chem. C 2016, 120, 24023–24029. [Google Scholar] [CrossRef]
  55. Zhang, W.X.; Yan, H.M.; He, C. G-C6N6 Monolayer: A Highly Sensitive Molecule Sensor for Biomarker Volatiles of Liver Cirrhosis. Appl. Surf. Sci. 2021, 566, 150716. [Google Scholar] [CrossRef]
  56. Alkhalifah, M.A.; Yar, M.; Bayach, I.; Sheikh, N.S.; Ayub, K. Covalent Organic Framework (C6N6) as a Drug Delivery Platform for Fluorouracil to Treat Cancerous Cells: A DFT Study. Materials 2022, 15, 7425. [Google Scholar] [CrossRef]
  57. Bafekry, A.; Stampfl, C.; Akgenc, B.; Mortazavi, B.; Ghergherehchi, M.; Nguyen, C.V. Embedding of Atoms into the Nanopore Sites of the C6N6 and C6N8 Porous Carbon Nitride Monolayers with Tunable Electronic Properties. Phys. Chem. Chem. Phys. 2020, 22, 6418–6433. [Google Scholar] [CrossRef]
  58. Pagliai, M.; Caporali, S.; Muniz-Miranda, M.; Pratesi, G.; Schettino, V. SERS, XPS, and DFT Study of Adenine Adsorption on Silver and Gold Surfaces. J. Phys. Chem. Lett. 2012, 3, 242–245. [Google Scholar] [CrossRef]
  59. Chai, J.-D.; Head-Gordon, M. Long-Range Corrected Hybrid Density Functionals with Damped Atom–Atom Dispersion Corrections. Phys. Chem. Chem. Phys. 2008, 10, 6615. [Google Scholar] [CrossRef] [Green Version]
  60. Zhang, H.-J.; Qi, S.-D.; Niu, X.-Y.; Hu, J.; Ren, C.-L.; Chen, H.-L.; Chen, X.-G. Metallic nanoparticles immobilized in magnetic metal-organic frameworks: Preparation and application as highly active, magnetically isolable and reusable catalysts. Catal. Sci. Technol. 2014, 4, 3013–3024. [Google Scholar] [CrossRef]
  61. Yar, M.; Ayub, K. Expanding the Horizons of Covalent Organic Frameworks to Electrochemical Sensors; A Case Study of CTF-FUM. Microporous Mesoporous Mater. 2020, 300, 110146. [Google Scholar] [CrossRef]
  62. Farooqi, B.A.; Yar, M.; Ashraf, A.; Farooq, U.; Ayub, K. Graphene-Polyaniline Composite as Superior Electrochemical Sensor for Detection of Cyano Explosives. Eur. Polym. J. 2020, 138, 109981. [Google Scholar] [CrossRef]
  63. Yar, M.; Hashmi, M.A.; Ayub, K. Nitrogenated Holey Graphene (C2N) Surface as Highly Selective Electrochemical Sensor for Ammonia. J. Mol. Liq. 2019, 296, 111929. [Google Scholar] [CrossRef]
  64. Yar, M.; Hashmi, M.A.; Ayub, K. The C2N Surface as a Highly Selective Sensor for the Detection of Nitrogen Iodide from a Mixture of NX3 (X = Cl, Br, I) Explosives. RSC Adv. 2020, 10, 31997–32010. [Google Scholar] [CrossRef]
  65. Kazachenko, A.S.; Tomilin, F.N.; Pozdnyakova, A.A.; Vasilyeva, N.Y.; Malyar, Y.N.; Kuznetsova, S.A.; Avramov, P.V. Theoretical DFT Interpretation of Infrared Spectra of Biologically Active Arabinogalactan Sulphated Derivatives. Chem. Pap. 2020, 74, 4103–4113. [Google Scholar] [CrossRef]
  66. Jeziorski, B.; Moszynski, R.; Szalewicz, K. Perturbation Theory Approach to Intermolecular Potential Energy Surfaces of van Der Waals Complexes. Chem. Rev. 1994, 94, 1887–1930. [Google Scholar] [CrossRef]
  67. Pan, S.; Saha, R.; Mandal, S.; Mondal, S.; Gupta, A.; Fernández-Herrera, M.A.; Merino, G.; Chattaraj, P.K. Selectivity in Gas Adsorption by Molecular Cucurbit[6]Uril. J. Phys. Chem. C 2016, 120, 13911–13921. [Google Scholar] [CrossRef]
  68. Keinan, S.; Contreras-García, J.; Johnson, E.R.; Yang, W.; Mori-Sánchez, P.; Cohen, A.J. Revealing Noncovalent Interactions. J. Am. Chem. Soc. 2010, 132, 6498–6506. [Google Scholar] [CrossRef] [Green Version]
  69. Contreras-García, J.; Johnson, E.R.; Keinan, S.; Chaudret, R.; Piquemal, J.-P.; Beratan, D.N.; Yang, W. NCIPLOT: A Program for Plotting Noncovalent Interaction Regions. J. Chem. Theory Comput. 2011, 7, 625–632. [Google Scholar] [CrossRef]
  70. Contreras-García, J.; Yang, W.; Johnson, E.R. Analysis of Hydrogen-Bond Interaction Potentials from the Electron Density: Integration of Noncovalent Interaction Regions. J. Phys. Chem. A 2011, 115, 12983–12990. [Google Scholar] [CrossRef] [Green Version]
  71. Venkataramanan, N.S.; Suvitha, A.; Kawazoe, Y. Unravelling the Nature of Binding of Cubane and Substituted Cubanes within Cucurbiturils: A DFT and NCI Study. J. Mol. Liq. 2018, 260, 18–29. [Google Scholar] [CrossRef]
  72. Mohammadi, M.D.; Abdullah, H.Y. The Adsorption of Chlorofluoromethane on Pristine, Al-, Ga-, P-, and As-Doped Boron Nitride Nanotubes: A PBC-DFT, NBO, and QTAIM Study. ChemistrySelect 2020, 5, 12115–12124. [Google Scholar] [CrossRef]
  73. Chu, Z.Q.; Stampfl, C.; Duan, X.M. Boron-Doped g-C6N6 Layer as a Metal-Free Photoelectrocatalyst for N2 Reduction Reaction. J. Phys. Chem. C 2019, 123, 28739–28743. [Google Scholar] [CrossRef]
  74. Wang, L.; Liu, Y.-L.; Wang, M.-S. Effects of Atypical Hydrogen Bonds and π–π Interactions on Nonlinear Optical Properties: Dimers of Triangular Structures Based on Perylene, Naphthalene, and Pyromellitic Diimides. Langmuir 2022, 39, 357–366. [Google Scholar] [CrossRef]
  75. Lu, T.; Chen, F. Quantitative analysis of molecular surface based on improved Marching Tetrahedra algorithm. J. Mol. Graph. Model. 2012, 38, 314–323. [Google Scholar] [CrossRef] [PubMed]
  76. Munir, M.; Ahsan, F.; Yar, M.; Ayub, K. Theoretical Investigation of Double-Cubed Polycationic Cluster (Sb7Se8Cl2)3+ for the Storage of Helium and Neon. Mater. Sci. Semicond. Process. 2022, 148, 106756. [Google Scholar] [CrossRef]
  77. Srinivasu, K.; Modak, B.; Ghosh, S.K. Porous Graphitic Carbon Nitride: A Possible Metal-Free Photocatalyst for Water Splitting. J. Phys. Chem. C 2014, 118, 26479–26484. [Google Scholar] [CrossRef]
  78. Li, T.; Zhang, W.-D.; Liu, Y.; Li, Y.; Cheng, C.; Zhu, H.; Yan, X.; Li, Z.; Gu, Z.-G. A Two-Dimensional Semiconducting Covalent Organic Framework with Nickel(ii) Coordination for High Capacitive Performance. J. Mater. Chem. A 2019, 7, 19676–19681. [Google Scholar] [CrossRef]
  79. Trendafilova, N.; Bauer, G.; Mihaylov, T. DFT and AIM Studies of Intramolecular Hydrogen Bonds in Dicoumarols. Chem. Phys. 2004, 302, 95–104. [Google Scholar] [CrossRef]
  80. Ghogomu, J.N.; Nkungli, N.K. DFT Studies and Topological Analyses of Electron Density on Acetophenone and Propiophenone Thiosemicarbazone Derivatives as Covalent Inhibitors of Falcipain-2, a Major Plasmodium Falciparum Cysteine Protease. Phys. Chem. Res 2017, 5, 795–817. [Google Scholar] [CrossRef]
  81. Alkorta, I.; Elguero, J.; Solimannejad, M.; Grabowski, S.J. Dihydrogen Bonding vs Metal−σ Interaction in Complexes between H2 and Metal Hydride. J. Phys. Chem. A 2011, 115, 201–210. [Google Scholar] [CrossRef]
  82. Espinosa, E.; Molins, E.; Lecomte, C. Hydrogen Bond Strengths Revealed by Topological Analyses of Experimentally Observed Electron Densities. Chem. Phys. Lett. 1998, 285, 170–173. [Google Scholar] [CrossRef]
  83. Steiner, T. The Hydrogen Bond in the Solid State. Angew. Chemie Int. Ed. 2002, 41, 48–76. [Google Scholar] [CrossRef]
  84. Cremer, D.; Kraka, E. Theoretical Determination of Molecular Structure and Conformation. 15. Three-Membered Rings: Bent Bonds, Ring Strain, and Surface Delocalization. J. Am. Chem. Soc. 1985, 107, 3800–3810. [Google Scholar] [CrossRef]
  85. Du, J.; Sun, X.; Jiang, G. Exploring the Interaction Natures in Plutonyl (VI) Complexes with Topological Analyses of Electron Density. Int. J. Mol. Sci. 2016, 17, 414. [Google Scholar] [CrossRef] [Green Version]
  86. Sarfaraz, S.; Yar, M.; Ayub, K. Covalent Triazine Framework (CTF-0) Surface as a Smart Sensing Material for the Detection of CWAs and Industrial Pollutants. Mater. Sci. Semicond. Process. 2022, 139, 106334. [Google Scholar] [CrossRef]
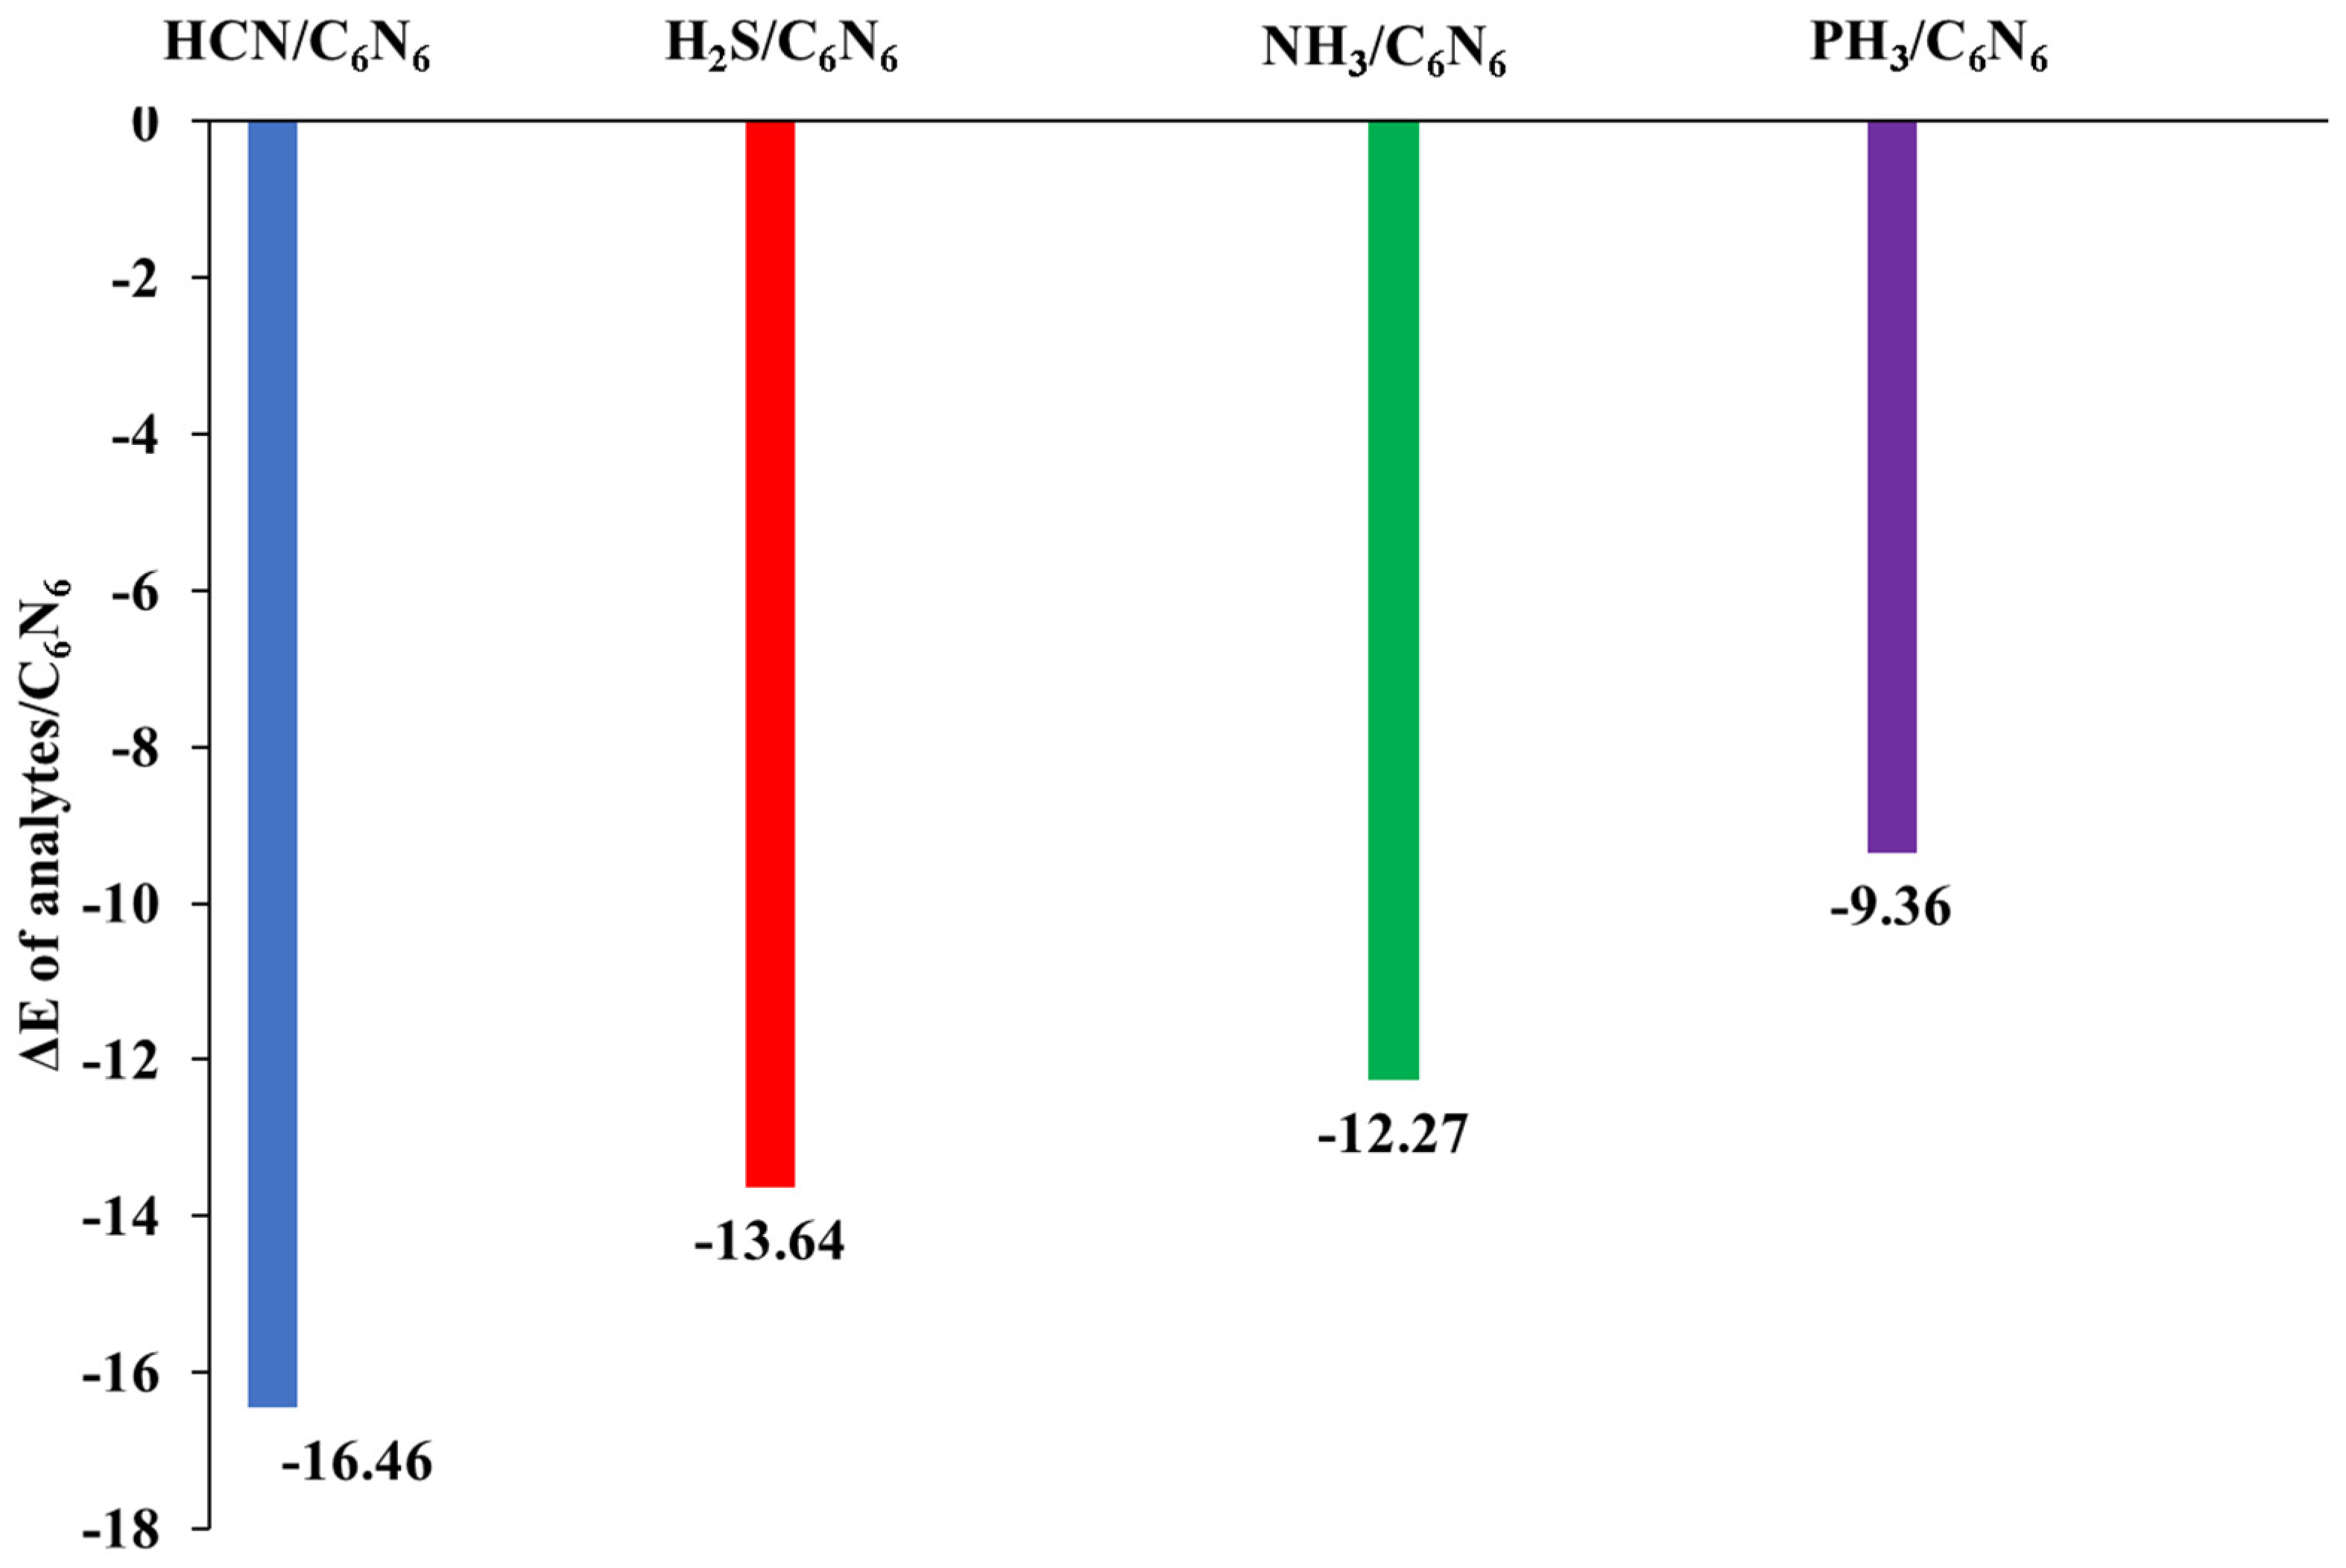
Figure 1. Graphical representation of adsorption energies of analyte@C6N6 complexes at the Ꞷb97XD/6-31G (d,p) level of theory.
Nanomaterials 13 01121 g001
Figure 2. Top view of optimized structures of the analyte@C6N6 complexes at the Ꞷb97XD/6-31G (d,p) level of theory.
Nanomaterials 13 01121 g002
Figure 3. Graphical projection of the SAPT0 energy and its components for analyte@C6N6 complexes.
Nanomaterials 13 01121 g003
Figure 4. NCI analyses of analyte@C6N6 complexes at an iso-value of 0.002 a.u.
Nanomaterials 13 01121 g004
Figure 5. Topological analysis of analyte@C6N6 complexes obtained through QTAIM analysis.
Nanomaterials 13 01121 g005
Figure 6. The topologies of analyte@C6N6 complexes determined through EDD analysis (Isovalue = 0.0019 a.u.).
Nanomaterials 13 01121 g006
Figure 7. Orbital distribution pattern of analyte@C6N6 complexes computed through a FMO analysis (isovalue = 0.02 a.u.). Green orbital densities indicate a positive wavefunction, while red orbital densities show a negative wavefunction.
Nanomaterials 13 01121 g007
Table 1. Stabilization energies of analyte@C6N6 complexes obtained through SAPT0 analyses.
Analytes@C6N6EexchEelst(%)Eind(%)Edisp(%)ESAPT0
HCN@C6N611.16−14.60(52)−3.78(13)−9.66(34)−16.88
H2S@C6N616.93−12.58(43)−4.27(15)−12.34(42)−12.26
NH3@C6N625.29−10.78(47)−2.93(13)−9.30(40)−10.06
PH3@C6N611.77−6.85(33)−2.54(12)−11.60(55)−9.22
Table 2. BCP parameters values of analyte@C6N6 complexes determined by QTAIM analyses.
Analyte@C6N6Analyte-C6N6ρ2ρG (r)V (r)H (r)V(r)/G(r)Eint
(kcal/mol)
HCN@C6N6H7-N10.007240.026870.00540−0.004080.00132−0.76−1.28
H7-N20.007060.024290.00494−0.003810.00113−0.77−1.19
H7-N30.007800.026220.00547−0.004390.00108−0.80−1.38
H7-N40.007350.024510.00508−0.004040.00104−0.79−1.27
H7-N50.006590.025090.00489−0.003520.00138−0.72−1.10
H7-N60.008140.028470.00597−0.004830.00115−0.81−1.51
H2S@ C6N6H7-N10.005490.018950.00380−0.002850.00000−0.75−0.90
H7-N20.015860.039650.00992−0.009920.00000−1.00−3.11
H8-N30.007630.025520.00536−0.004340.00102−0.81−1.36
H8-N40.005490.018950.00379−0.002850.00094−0.75−0.89
H8-N50.015850.039630.00991−0.009910.00000−1.00−3.11
H7-N60.007630.025520.00536−0.004340.00102−0.81−1.36
NH3@C6N6N8-N10.007730.025580.00573−0.005060.00067−0.88−1.59
H7-N20.013650.042270.00991−0.009250.00066−0.93−2.90
H7-N30.008670.028560.00627−0.005400.00087−0.86−1.69
N8-N40.003570.012220.00261−0.002170.00044−0.83−0.68
H9-N50.008740.028710.00631−0.005450.00087−0.86−1.71
H9-N60.013600.042240.00989−0.009220.00067−0.93−2.89
PH3@C6N6P7-N10.006870.020640.00445−0.003740.00071−0.84−1.17
H8-N20.005620.019240.00390−0.003000.00091−0.77−0.94
H8-N30.006730.022150.00456−0.003580.00098−0.79−1.12
H8-N40.007300.023050.00482−0.003880.00094−0.80−1.22
H8-N50.006010.020700.00416−0.003150.00101−0.76−0.99
H7-N60.006250.020240.00435−0.003650.00071−0.84−1.14
Table 3. The energies of the HOMO, LUMO and HOMO–LUMO energy gap (EH–L gap) of analyte@C6N6 complexes.
Analyte@C6N6HOMO (eV)LUMO (eV)Gap
C6N6−7.16−3.303.86
HCN@C6N6−7.43−3.414.02
H2S@C6N6−6.07−3.312.76
NH3@C6N6−5.85−3.272.58
PH3@C6N6−6.62−3.273.35
Table 4. Comparison of adsorption energy of H-containing industrial pollutants over C6N6 with already reported values of different analytes over C6N6 and other COFs.
S.NoComplexesEads (kcal/mol)RefS.NoComplexesEads (kcal/mol)Ref
1NH3@CTF-FUM−5.27[5]8HCN@CTF-0−5.99[86]
2H2S@CTF-FUM−3.799H2S@CTF-0−5.46
3PH3@CTF-FUM−2.4310NH3@CTF-0−6.65
4HCN@C2N−15.24 HCN@C6N6−16.46current work
5NH3@C2N−10.68PH3@C6N6−13.64
6H2S@C2N−8.54NH3@C6N6−12.27
7PH3@C2N−6.91PH3@C6N6−9.36
Disclaimer/Publisher’s Note: The statements, opinions and data contained in all publications are solely those of the individual author(s) and contributor(s) and not of MDPI and/or the editor(s). MDPI and/or the editor(s) disclaim responsibility for any injury to people or property resulting from any ideas, methods, instructions or products referred to in the content.