Article

Microwave Synthesis of Visible-Light-Activated g-C3N4/TiO2 Photocatalysts

1
CENIMAT|i3N, Department of Materials Science, School of Science and Technology, NOVA University Lisbon and CEMOP/UNINOVA, 2829-516 Caparica, Portugal
2
LAQV-REQUIMTE, Department of Chemistry, NOVA School of Science and Technology, Universidade NOVA de Lisboa, Campus de Caparica, 2829-516 Caparica, Portugal
3
Physics Department & I3N, Aveiro University, Campus Universitário de Santiago, 3810-193 Aveiro, Portugal
*
Authors to whom correspondence should be addressed.
Nanomaterials 2023, 13(6), 1090; https://doi.org/10.3390/nano13061090
Submission received: 25 February 2023 / Revised: 11 March 2023 / Accepted: 13 March 2023 / Published: 17 March 2023
(This article belongs to the Section Energy and Catalysis)

Abstract

:
The preparation of visible-light-driven photocatalysts has become highly appealing for environmental remediation through simple, fast and green chemical methods. The current study reports the synthesis and characterization of graphitic carbon nitride/titanium dioxide (g-C3N4/TiO2) heterostructures through a fast (1 h) and simple microwave-assisted approach. Different g-C3N4 amounts mixed with TiO2 (15, 30 and 45 wt. %) were investigated for the photocatalytic degradation of a recalcitrant azo dye (methyl orange (MO)) under solar simulating light. X-ray diffraction (XRD) revealed the anatase TiO2 phase for the pure material and all heterostructures produced. Scanning electron microscopy (SEM) showed that by increasing the amount of g-C3N4 in the synthesis, large TiO2 aggregates composed of irregularly shaped particles were disintegrated and resulted in smaller ones, composing a film that covered the g-C3N4 nanosheets. Scanning transmission electron microscopy (STEM) analyses confirmed the existence of an effective interface between a g-C3N4 nanosheet and a TiO2 nanocrystal. X-ray photoelectron spectroscopy (XPS) evidenced no chemical alterations to both g-C3N4 and TiO2 at the heterostructure. The visible-light absorption shift was indicated by the red shift in the absorption onset through the ultraviolet-visible (UV-VIS) absorption spectra. The 30 wt. % of g-C3N4/TiO2 heterostructure showed the best photocatalytic performance, with a MO dye degradation of 85% in 4 h, corresponding to an enhanced efficiency of almost 2 and 10 times greater than that of pure TiO2 and g-C3N4 nanosheets, respectively. Superoxide radical species were found to be the most active radical species in the MO photodegradation process. The creation of a type-II heterostructure is highly suggested due to the negligible participation of hydroxyl radical species in the photodegradation process. The superior photocatalytic activity was attributed to the synergy of g-C3N4 and TiO2 materials.

Graphical Abstract

1. Introduction

The earth’s surface is composed of 71% of water, with only 1% suitable for human consumption [1]. Not only is potable water scarce, but several factors, such as climate change, population growth, development of industrialization and water misuse, have also increased the production of atmospheric pollution [2] and have led to a deterioration of the available water in terms of quantity (e.g., over-exploitation and droughts) and also quality (e.g., eutrophication) [3,4,5]. According to the WHO (World Health Organization, 2022 [6]), over 2 billion people live in water-stressed countries, and millions of people die of severe diseases due to contaminated water and poor sanitation [6,7].
Dyes from textile industries significantly contribute to the water contamination problem [8], and in this regard, it is predicted that around 700,000 tonnes of dyes is produced annually worldwide [1], where 10–15% of that production ends up being discharged into the environment [9], threatening the human health and the ecosystem [10]. Consequently, the scientific output on the topic of dye removal has grown over the last few years [10]. Dyes can be divided into different groups according to their chemical structure, type of application [11], and they can also be separated into anionic, cationic and non-ionic dyes [11]. The largest and most important group of organic dyes is the azo dyes class [9]. This class of dyes is extensively used in many sectors, such as the textile, food, pharmaceutical and cosmetic industries [12]. Among azo dyes, methyl orange is one of the most stable. It is commonly used in the textile industry and as an acid-base indicator. Simultaneously, its environmental impact is of great concern, since it is resistant to biodegradation and can potentially induce severe consequences for animals and humans, such as gene mutations and cancer [12,13,14].
Different methods can be employed for the removal of textile dyes from effluents, including physical, chemical and biological treatments. Physical methods (such as adsorption and membrane filtration) have proved to be efficient in the treatment of industrial dye effluents. However, their major drawback is the increased sludge formation volume. Moreover, filtration methods, for instance, typically require high maintenance costs, which does not make them cost effective [11]. Biological treatments are generally considered an inexpensive and eco-friendly alternative to physical methods, consisting of dye degradation through the metabolic pathways or adsorption of living/dead biomass [15]. Nevertheless, these treatments fail to fully mineralize dyes if more complex compounds are present [10]. However, advanced oxidation processes (AOPs) have emerged as promising choices for the complete mineralization of organic contaminants. In particular, photocatalysis, a process included in the AOPs, allows the generation of hydroxyl radicals by using solar energy for complete mineralization of hazardous organic chemicals into carbon dioxide, water and mineral acids [16,17]. Additionally, photocatalytic experiments can be performed at room temperature (RT) [18] and do not generate secondary pollution [19], which makes this technique highly attractive for worldwide water remediation [20].
Lately, a lot of attention has been paid to semiconductors with visible-light absorption as photocatalysts due to the abundance of visible light on the solar spectrum [16,21,22,23,24]. Although titanium dioxide (TiO2) is a widely employed semiconductor in photocatalysis owing to its low toxicity, reduced cost and excellent photochemical stability [25], it mainly absorbs in the UV region [22], limiting its use in photocatalytic applications [16]. TiO2 naturally has three polymorphs at RT: anatase, rutile (tetragonal structures) and brookite (orthorhombic structure). The rutile phase is the most stable, whereas anatase and brookite phases are metastable and are easily converted to the rutile phase with temperatures higher than 600 °C [16,25,26,27]. Generally, anatase and rutile phases are the most studied in photocatalysis due to the difficulty in obtaining brookite [25,28]. TiO2 is an n-type semiconductor, displaying optical band gap energies around 3.0 eV, 3.2 eV and values from 3.13 to 3.40 eV for rutile, anatase and brookite phases, respectively [29,30]. However, these values might suffer variations arising from the presence of impurities or doping and depend on the synthesis’ approach [31,32].
Several techniques have already been studied to improve the photocatalytic performance of TiO2 under visible light, such as doping with metals [33]/non-metals [34], modification of surface defects [35] and the fabrication of heterostructures [21,36]. Among them, the formation of an enhanced heterostructure was proved not only to suppress the photogenerated charge carriers’ recombination rate but also to extend visible-light absorption, thereby improving the photocatalytic activity under visible light [21,37]. One material, which has started to be used to produce visible-light-activated photocatalysts based on heterostructures with TiO2, is graphitic carbon nitride [27,38,39].
Graphitic carbon nitride (g-C3N4) is a polymeric material with electron-rich properties, basic surface functionalities and H-bonding motifs, which make it suitable for catalytic applications [40]. In terms of the basic structure, this material is composed of layers of tri-s-triazine ring structures, connected by N atoms, wherein van der Waals forces hold its layered stacking to form a 2D π-conjugated polymeric network [41,42,43,44]. Moreover, it presents high thermal stability (up to 600 °C in air) and hydrothermal stability (it is insoluble in acidic, neutral or basic medium) [40]. This material is generally produced by thermal polycondensation of low-cost precursors, between 500 and 600 °C in air or inert atmosphere [45], involving carbon- and nitrogen-rich organic compounds [46], such as dicyandiamide [47], melamine [48,49], urea [49,50] and thiourea [49,51]. g-C3N4 presents reduced toxicity [52]; it is composed of two abundant earth elements (C and N), and hence, it is not considered a critical raw material [53]. It has a low band gap energy, between 2.7 and 2.8 eV, corresponding to a wavelength of 450–460 nm, which allows the absorption of visible light [54,55,56]. Furthermore, the photoreduction capability of this material is strongly promoted by its high redox potential of −1.3 V (vs. normal hydrogen electrode (NHE) at pH = 7 compared to the potential of −0.5 V for pure TiO2). However, its top energy level of the valence band (VB) is 1.4 V (vs. NHE at pH = 7 compared to 2.7 V for pure TiO2). Consequently, it has weak oxidative capability for water oxidation, resulting in insufficient hydroxyl radicals’ production [54]. Furthermore, the hybridization of the N 2p and C 2p states in the conduction band (CB) results in a fast recombination rate of photogenerated charge carriers. Moreover, this material is difficult to separate from water, may cause secondary pollution due to its dissolution and has low specific surface area, which restricts its use in photocatalytic applications. Among the possible strategies to tackle these issues, effective coupling of g-C3N4 with other semiconductors has previously shown to be advantageous in charge separation and improved absorption in the visible region [57,58,59,60].
A summary of the photocatalytic activities in the degradation of MO with different g-C3N4/TiO2 nanostructures can be seen in Table 1.
Several approaches have already been used to fabricate g-C3N4/TiO2 heterostructures, such as sol-gel [65], hydrothermal [58]/solvothermal syntheses [66], wet impregnation [67] and microwave-assisted methods [68,69]. Apart from the microwave irradiation process, these methods typically require high temperatures and/or long reaction times, hence being energy consuming [58,66,67,70,71]. Taking into account the minimization of energy, microwave irradiation appears as a good alternative for the synthesis of complex inorganic materials, since higher reaction yields can be obtained in such a short amount of time. Additionally, the method is simple, energy efficient, eco-friendly, offers uniform and selective heating (electromagnetic radiation is directly transferred to the reactive species, resulting in a localized superheating of the material [72]), and the selectivity of reactions can be improved [26,68,73,74].
To the best of our knowledge, no reports have yet demonstrated a simple and fast microwave-assisted approach to produce an enhanced g-C3N4/TiO2 heterostructure for the degradation of MO under visible light. From this viewpoint, this paper reports the fabrication of g-C3N4/TiO2 heterostructures through a simple, seed-layer-free, cost-effective and fast microwave-assisted approach, together with the evaluation of their photocatalytic activity. The structural, optical and electrochemical characterizations were performed by XRD, SEM and STEM, all equipped with energy-dispersive X-ray spectroscopy (EDS) detectors, atomic force microscopy (AFM), XPS, UV-VIS absorption and photoluminescence (PL) spectroscopies, and Mott–Schottky plots. The photocatalytic performance of different g-C3N4 amounts in TiO2 was investigated for the degradation of MO using a solar simulator for up to 240 min (4 h). For a better understanding of the species involved in the photocatalytic degradation process, experiments were performed with reactive oxygen species scavengers. Reusability tests were also carried out up to five consecutive cycles.

2. Experimental Procedure

2.1. Synthesis of g-C3N4 Nanopowder

g-C3N4 in powder form was directly prepared by calcination of 20 g of urea (from Sigma-Aldrich CAS: 57-13-6), which was transferred into a ceramic crucible and heated in a muffle furnace at 550 °C for 2 h, with a heating ramp of 35 min. The crucible was sealed to avoid nanopowder loss. The reaction was carried out with the exhaustion system turned on, since the thermal decomposition of urea releases toxic gases and vapors (such as ammonia) [75]. In the end, a pale-yellow powdered product was obtained.

2.2. Microwave Synthesis of the g-C3N4/TiO2 Heterostructures

For the synthesis of the g-C3N4/TiO2 heterostructures, the obtained g-C3N4 nanopowder was dispersed in 23 mL of ethanol (96%), and the solution was ultrasonically dispersed for 15 min to achieve homogeneity. Afterward, 0.3 mL of hydrochloric acid (HCl, 37% purity from Merck, Germany) was added, followed by 0.8 mL of dropwise Titanium (IV) isopropoxide (TTIP, 97% purity from Sigma-Aldrich, St. Louis, MO, USA (CAS: 546-68-9)). The solution was left to stir for 10 min. A volume of 20 mL of the prepared solution was then transferred to a 35 mL Pyrex vessel, which was placed in a CEM Discovery SP microwave (from CEM, Matthews, NC, USA). The synthesis was carried out for 1 h at 150 °C with a maximum power of 100 W and a maximum pressure of 250 psi. The resulting g-C3N4/TiO2 nanopowders were washed alternately with deionized water and isopropyl alcohol (IPA) several times using a centrifuge at 5320 rpm for 5 min each time and dried in a desiccator at 80 °C, under vacuum. Pure TiO2 was also obtained by performing a microwave synthesis under the same experimental conditions, except for the addition of g-C3N4 nanopowder. The materials produced will hereafter be called 15-GCN-T, 30-GCN-T and 45-GCN-T for the 15, 30 and 45 weight (wt.) % of g-C3N4 in TiO2, respectively. A schematic of the experimental procedure for the synthesis of g-C3N4/TiO2 heterostructures by microwave is visible in Figure 1.

2.3. Structural and Optical Characterization of the Nanostructures

XRD experiments were performed using a PANalytical’s X’Pert PRO MPD diffractometer (Almelo, The Netherlands) equipped with an X’Celerator detector and using CuKα radiation (λ = 1.540598 Å). XRD data were recorded from 10° to 90° 2θ range with a step of 0.05° in the Bragg–Brentano configuration. The simulated TiO2 brookite phase was indexed using the Inorganic Crystal Structure Database (ICSD) file No. 36408, while the simulated TiO2 rutile phase corresponded to ICSD file No. 9161 and the simulated TiO2 anatase phase to ICSD file No. 9852.
SEM images of the nanopowders were acquired with a Hitachi Regulus 8220 Scanning Electron Microscope (Mito, Japan) equipped with an Oxford EDS detector.
STEM, including high-angle annular dark-field (HAADF) imaging, and transmission electron microscopy (TEM) observations were carried out with a Hitachi HF5000 field-emission transmission electron microscope operated at 200 kV (Mito, Japan). This is a cold FEG TEM/STEM with a spherical aberration corrector for the probe, and it is equipped with one 100 mm2 EDS detector from Oxford Instruments. A drop of the sonicated dispersion was deposited onto lacey-carbon copper grids and allowed to dry before observation. The average particle size and standard deviation of the TiO2 nanostructures were calculated based on the SEM and TEM images obtained from the dimensions of 40 particles using ImageJ software [76].
AFM images were acquired with an Asylum Research MFP-3D Standalone system (Oxford Instruments, Abingdon, UK) operated under ambient conditions, in alternate contact mode, using commercially available silicon probes (Olympus AC160TS, f0 = 300 kHz, k = 26 N/m; Olympus Corporation, Tokyo, Japan). The images and height profiles were exported using Asylum Research’s software packages, after low-level plane fitting.
XPS measurements were performed with a Kratos Axis Supra (Kratos Analytical, Manchester, UK), using monochromated Al Kα irradiation (1486.6 eV). Detailed scans were acquired with an X-ray power of 120 W and a pass energy of 10 eV. The powder samples were mounted in an aluminum crucible and showed charge accumulation during the measurement. Charge neutralization with an electron flood gun was employed, and the lowest binding energy component of C 1s was referenced at 284.8 eV in CasaXPS, which was the software used for data analysis.
RT PL measurements were performed using a PerkinElmer LS55 luminescence spectrometer (PerkinElmer, Waltham, MA, USA) equipped with a Xenon lamp as an excitation source. The PL data were acquired from 400 to 600 nm, using an excitation wavelength of 350 nm.
Total reflectance and absorbance measurements were recorded by using a double-beam UV-VIS-NIR Shimadzu spectrophotometer with an integrating sphere in the range of 280–800 nm. The specular reflectance was also recorded in the same range to obtain the diffuse reflectance data (DRS) and estimate the band gap energies (Eg). BaSO4 white powder was used as the reference. Measurements were carried out at RT.

2.4. Characterization of the Nanostructures as Photocatalysts in the Degradation of MO under Solar Simulating Light

The photocatalytic activities of pure TiO2, g-C3N4 and heterostructures 15, 30 and 45-GCN-T (in powder form) were evaluated at RT, considering the degradation of MO (C14H14N3NaO3S) from Sigma-Aldrich under a solar light simulating source. For each experiment, 25 mg of each nanopowder was dispersed with 50 mL of the MO solution (12.5 mg/L) and stirred for 30 min in the dark to establish the absorption–desorption equilibrium. Solar light exposure was conducted by using a WAVELABS LS-2 LED solar simulator (Germany) with AM 1.5 spectrum, at an intensity of 100 mW/cm2. The experiments were conducted under low constant magnetic agitation at 130 rpm. Absorption spectra were recorded using a PerkinElmer double-beam LAMBDA 365+ UV/Vis Spectrometer (Waltham, MA, USA), with different time intervals, up to a total of 240 min (4 h). The measurements were performed in the 300–600 nm range. Photolysis was also investigated by irradiating the MO solution without any photocatalyst.
For the reusability experiments, the catalysts were recovered by centrifugation at 6000 rpm for 5 min with further discarding of the supernatant. The nanopowders were then dried at 60 °C for 12 h, prior to the next exposure. Afterward, the recovered nanopowders were poured into a fresh solution and exposed to solar light under the same exposure times. Additional parallel photocatalytic experiments were performed to guarantee the same photocatalyst mass in each cycle (in this case, 25 mg).
To investigate the main active species involved in the photocatalytic degradation of MO, several reactive oxygen species (ROS) scavengers were added to the methyl orange solution prior to the addition of the catalyst. To evaluate the role of these species, ethylene diamine tetra acetic acid (EDTA, C10H16N2O8, ≥98% purity from Sigma-Aldrich, CAS: 60-00-4), isopropanol (IPA, C3H8O, 99.8% purity from Sigma-Aldrich) and p-benzoquinone (BQ, C6H4O2, ≥98% purity from Midland Scientific (Sigma-Aldrich), CAS: 106-51-4) were used, respectively, as hole scavengers (h+), hydroxyl radical scavengers (·OH) and superoxide radical scavengers (·O2) [21,77]. The trapping experiments were conducted under the same conditions as those to evaluate the photocatalytic performance, additionally including 5 mL of a 0.5 mM aqueous solution of each scavenger [78]. A solution in the presence of the photocatalyst and 5 mL of deionized water (without scavenger) was also irradiated for comparison.

2.5. Electrochemical Characterization

To evaluate the electrochemical performance of the produced materials, a solution was prepared with 2.5 mg of each nanopowder, 10 μL of Nafion perfluorinated resin (5 wt. % in lower aliphatic alcohols and water, containing 15–20% of water content, from Sigma-Aldrich, CAS: 31175-20-9) and 0.25 mL of DMF (N,N-dimethylformamide, with ≥99% purity from Sigma-Aldrich). Then, indium tin oxide (ITO) glass samples were cut with dimensions of 2 cm ×  1 cm, and an appropriate amount of the solution was evenly coated on a sample area of around 1 cm2. Each layer was left to dry at 50 °C before applying a new layer. The photoelectrochemical properties were assessed on a standard three-electrode system (Gamry Reference 600, Warminster, PA, USA) by using a potentiostat model 600 from Gamry Instruments, Inc., Warminster, PA, USA and with an electrochemical interface (Gamry Echem Analyst). ITO glass coated with the photocatalyst, platinum wire and the standard electrode Ag/AgCl (3 M KCL) were used as the working electrode, the counter electrode and the reference electrode, respectively. The electrolyte was a solution with 0.5 M of Na2SO4 at pH = 6.3. The Mott–Schottky curves were measured at 1 kHz. The potentials measured against the (Ag/AgCl) reference were converted into normal hydrogen electrode (NHE) potentials, following Equation (1) [79]:
E FB   NHE = E Ag / AgCl + E Ag / AgCl ° ( E Ag / AgCl ° = 0.1976   V   vs .   NHE   at   25 ° C )

3. Results and Discussion

3.1. Structural Characterization

3.1.1. XRD

The produced nanopowders, i.e., pure TiO2, pure g-C3N4, 15-GCN-T, 30-GCN-T and 45-GCN-T, were investigated by XRD. As seen in Figure 2, after heat treating urea at 550 °C for 2 h, two diffraction maxima at 13.2° and 27° (2θ) appear, indexed to the planes (100) and (002) of g-C3N4, respectively [80]. According to previous studies, the broad diffraction maximum detected at 13.2° is ascribed to the in-planar structure of repeated N-bridged tri-s-triazine units, whereas the maximum at 27° is attributed to the stacking of the conjugated aromatic systems. A slight shift could be observed in the diffractogram of the produced g-C3N4 nanopowder compared to the database, and for that reason, the simulated g-C3N4 was not presented. Nevertheless, the XRD data are consistent with the literature for this material [80,81,82,83]. For the pure TiO2 nanopowder, the experimental XRD diffractograms could be fully ascribed to the anatase TiO2 phase (ICSD file No. 9852). When it comes to the heterostructures, for all conditions, the TiO2 anatase diffractograms are also present. On the other hand, when g-C3N4 content is increased with respect to TiO2, a diffraction maximum at 27° appears, indicating the presence of graphitic carbon nitride. This can be observed in the 30-GCN-T and 45-GCN-T nanopowders (identified with orange arrows in Figure 2), confirming the co-existence of both materials (TiO2 and g-C3N4). The absence of graphitic carbon nitride patterns in the 15-GCN-T nanopowder is likely due to the low percentage present in this material. No further XRD maxima or impurities were detected in all the materials produced.

3.1.2. Electron Microscopy
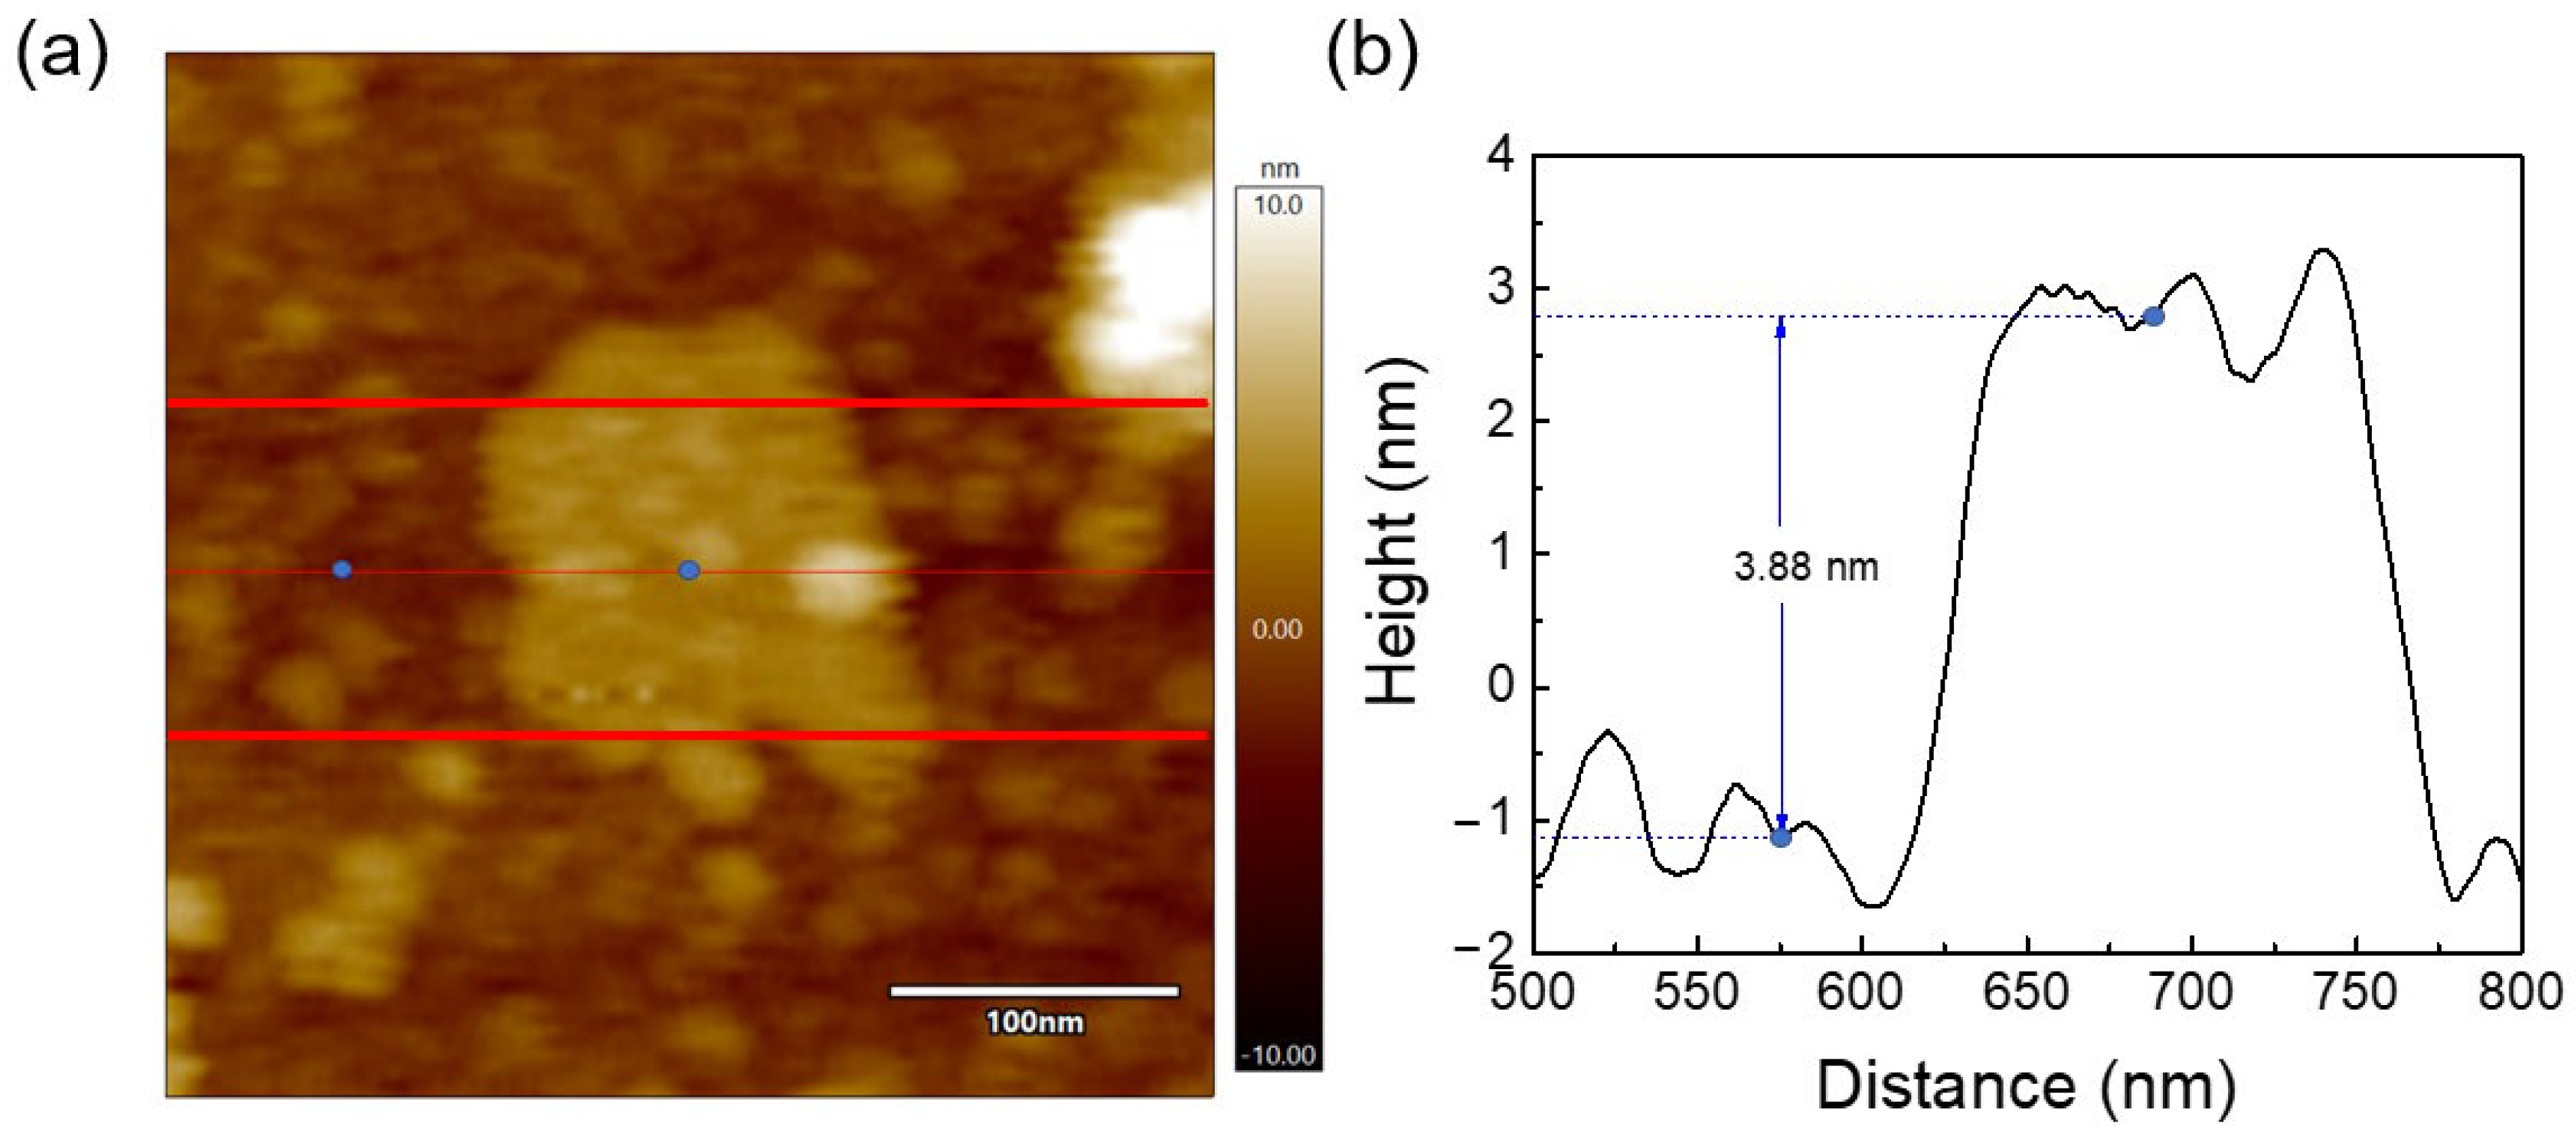
Figure 3 displays the SEM images of TiO2, g-C3N4 and g-C3N4/TiO2 heterostructures. As can be seen in Figure 3a, the microwave synthesis in the presence of ethanol as solvent resulted in several irregularly shaped particles with an average particle size of 543 ± 135 nm (Figure 3b). It is clearly seen in Figure 3b that the larger particles are composed of aggregates of TiO2 nanocrystals. A hollow sphere is evidenced on the inset of Figure 3b. The SEM images of g-C3N4 are shown in Figure 3c,d. Graphitic carbon nitride produced by direct calcination resulted in a two-dimensional (2D) structure composed of a stack of thin sheets with wrinkles and irregular shapes. Some micro-holes are also perceptible at the surface of the sheets, which were probably formed due to the escape of gases, such as NH3, during the high-temperature synthesis of g-C3N4. Consequently, the gas release could have etched the s-triazine network structure [84]. Figure 3e–j show the SEM images of the g-C3N4/TiO2 heterostructures. The similar shape and size of the TiO2 particles observed previously in Figure 3a are present in the 15-GCN-T material, covering some areas of the g-C3N4 sheets. A TiO2 film was also formed at the surface of the sheets (Figure 3f). Nevertheless, this film did not completely cover the g-C3N4 sheets for the 15-GCN-T material. Interestingly, when g-C3N4 content was further increased, as shown in Figure 3g–j, the larger TiO2 particles disintegrated, and smaller TiO2 agglomerates were formed, composing a film that was expressively thick for the 45-GCN-T material (Figure 3j). The close contact between the two materials is thus essential to improve the charge separation and strengthen the photocatalytic activity [85].
Due to the high amount of g-C3N4 in the 45-GCN-T material, some g-C3N4 nanosheets were not covered by TiO2, which could result in a faster recombination rate of photogenerated charge carriers, and lastly, a decrease in photocatalytic activity. For this reason, the 30-GCN-T material was selected for further investigation.
The 30-GCN-T material was investigated using STEM (Figure 4). In both STEM and bright-field TEM images (Figure 4a–d and Figure S1), the presence of a thin 2D nanostructure with a sheet-like structure is clear. The TiO2 nanostructures are also clearly discernible in the STEM and TEM images (Figure 4a–g). The ring diffraction pattern in Figure 4d attested that these particles are solely in the anatase TiO2 phase.
In accordance with the SEM results, it can be observed that the g-C3N4 sheets are covered with TiO2 nanostructures—however, not forming a continuous film—and larger agglomerates are also detected (Figure 4a–f) but, as observed previously, are expressively smaller than those for the pure TiO2 material. As reported in an analogous study [86], it can be seen that these agglomerates are formed by very fine TiO2 nanoparticles with irregular shapes, where near spherical nanocrystals and more elongated ones can be observed (Figure 4g–i). The average TiO2 particle size was found to be 5.17 ± 1.37 nm, and it can be seen from the particle size distribution (inset of Figure 4d) that smaller particles in the range of 4–7 nm are more likely to be found.
The STEM images (Figure 4g–i) confirm the close contact between the g-C3N4 sheets and the TiO2 nanocrystals, where the in-depth analysis conducted using detailed HAADF imaging (Figure 4i) revealed a clear interface between the TiO2 nanocrystal and the g-C3N4 sheet. As reported earlier in the literature [87], low crystallinity of g-C3N4 sheets was detected in the TEM measurements. From the atomic-resolution HAADF-STEM image in Figure 4i, the atomic columns are clearly visible, and given the Z-contrast, it can be assumed that the visible spots must correspond to Ti atoms [88]. These Ti atomic columns are perpendicular to each other, and a lattice spacing of ≈ 0.189 nm was measured, which perfectly matches the (200) and (020) atomic planes of anatase [89]. Two other distinct TiO2 nanocrystals were investigated in Figure 5a,b, revealing the (100) and (010) atomic planes of anatase with a lattice spacing of ≈ 0.378 nm [88]. The insets presented in Figure 4i and Figure 5a,b represent the fast Fourier transformation (FFT) images generated from areas indicated as A, B and C, respectively. As observed in the [001] zone axis, it is evident from the FFT patterns that the angles between (200) and (020) or between (100) and (010) are 90°, in accordance with the theoretical value reported for pure crystalline anatase TiO2 (ICSD file No. 9852). From the atomic-resolution HAADF images and FFT patterns, the tetragonal atomic arrangement on the (001) surface of the TiO2 nanocrystals can be inferred [89].
Energy-dispersive X-ray spectroscopy analyses were also carried out for the 30-GCN-T material. Figure 6a shows a magnified SE-STEM image of a g-C3N4 sheet with TiO2 agglomerates on its surface. From the EDS analysis, it is confirmed that the sheet is mainly composed of C (Figure 6b), N (Figure 6c) and O (Figure 6d), while Ti is present on the agglomerates, revealing a uniform distribution of this element (Figure 6e).

3.1.3. AFM

AFM measurements were performed to determine the average height/thickness of the produced g-C3N4 nanosheets. The average thickness of g-C3N4 nanosheets was calculated based on several scans, which were taken from AFM images, and the value was found to be around 4 nm. One of those scans is depicted in Figure 7. Thin g-C3N4 nanosheets were also inferred from STEM analysis (Figure 4), where transparent nanosheets were observed. In accordance with previous studies, similar size thicknesses ranging from 2 to 15 nm were reported for g-C3N4 nanosheets [90,91,92].

3.1.4. XPS

The surface chemical compositions of TiO2, g-C3N4 and 30-GCN-T materials were analyzed by XPS. Figure 8a shows the survey spectra of TiO2, g-C3N4 and 30-GCN-T materials, revealing the existence of C and N elements in the g-C3N4 nanopowder. Through the analysis of the survey spectra, the characteristic peaks of Ti and O appear in TiO2 along with Ti, O, N and C elements in 30-GCN-T, which confirms the purity of the produced materials. High-resolution XPS spectra of each element present in the materials (TiO2, g-C3N4 and 30-GCN-T) are presented in Figure 8b–e. Figure 8b shows the comparison between the deconvoluted C 1s core level spectra of g-C3N4, TiO2 and 30-GCN-T. The g-C3N4 sample was fitted with peaks at 284.8, 286.1 and 288.2 eV of equal full width at half maximum and a broader peak at 293.5 eV. The peaks at 284.8 eV and 286.1 eV are identified as C–C and C–O bonds of adventitious carbon, respectively. The most intense peak at 288.2 eV corresponds to sp2 C atoms in the N=C−N aromatic ring of g-C3N4, whereas the peak at 293.5 eV is related to the three-coordinate C atoms C−NH2 [93,94,95]. The C 1s emission of TiO2 only presents emissions from adventitious carbon. The 30-GCN-T material presents a mixture of g-C3N4 and TiO2 cases. Since an excellent fit of the 30-GCN-T C 1s emission could be obtained by applying the peak models of both g-C3N4 and TiO2 (with fixed relative binding energies and relative peak areas, respectively), it can be concluded that no significant change occurred in the chemistry of both g-C3N4 and TiO2 when forming the heterostructure. XPS high-resolution O 1s core level spectra for g-C3N4, TiO2 and 30-GCN-T are also shown in Figure 8c. Only a very small amount of oxygen is present in g-C3N4, in accordance with the C−O bond of adventitious carbon. For TiO2, a typical set of peaks related to Ti−O bonds, undercoordinated oxygen, hydroxyl groups and surface-adsorbed water are found (in ascending order of binding energy) [93,96]. These peaks do not change significantly in their relative areas in a comparison of the TiO2 material with the 30-GCN-T material, indicating no chemical change in TiO2 upon formation of the heterostructure.
Figure 8d shows the high-resolution Ti 2p core level spectra of TiO2 and 30-GCN-T. For TiO2, the binding energy values of Ti 2p 3/2 and Ti 2p 1/2 obtained at 458.5 and 464.3 eV can be assigned to Ti4+ species in the form of TiO2 agglomerates [97], and the peak positions are consistent with the reported values for pure TiO2 nanostructures [23]. The Ti 2p spectrum of 30-GCN-T is similar to the one of TiO2, both in shape and in peak position. Note that it is not possible to comment on eventual binding energy shifts due to the necessary usage of an electron flood gun during the measurement.
Regarding the deconvoluted high-resolution N 1 s spectra of g-C3N4 and 30-GCN-T (Figure 8e), both materials exhibit five peaks at 398.7, 399.3, 400.0, 401.1, 404.3 eV and 406.6 eV, corresponding to the binding states of sp2-hybridized aromatic N atoms bonded to carbon atoms (–C–N=C), tertiary nitrogen N–(C)3, C–N–H groups [98], respectively, and two satellite peaks at higher binding energies [99]. No shifts in N 1s spectra were observed.
The N/C ratio of g-C3N4 was also obtained, and its value was close to the theoretical value of ideal g-C3N4 (≈1.30). Using the C 1s peak model to determine the carbon of g-C3N4 inside the 30-GCN-T material also allows quantifying the C/N ratio in 30-GCN-T, which amounts to 1.4, which is very close to pristine g-C3N4.

3.2. Optical Characterization

The optical properties of the produced materials were investigated by UV-VIS absorption and PL spectroscopies (Figure 9). As observed in Figure 9a, pure g-C3N4 shows an absorption maximum at around 384 nm (3.23 eV), arising from the n → π* transitions caused by the electron transfer from a nitrogen non-bonding orbital to an aromatic anti-bonding orbital [100,101], and an absorption onset at ca. 450 nm. Meanwhile, pure anatase TiO2 exhibits an absorption maximum in the UV region and an absorption onset at ca. 390 nm (3.18 eV). The absorption onsets correspond to the optical band gap values (Eg) of the materials (around 2.8 and 3.2 eV, respectively, for pure g-C3N4 and pure TiO2). These results are in good agreement with the band gap values obtained from DRS spectra by means of the Kubelka–Munk function [102], as depicted in the inset of Figure 9a, and fairly in line with the reported band gap values for these materials [25,103,104,105]. For 30-GCN-T nanostructures, it is clearly seen that two absorption peaks appear: one in the UV region, placed at the same wavelength value as for the absorption maximum of pure TiO2, and another one with a lower absorption at ca. 384 nm, most likely related to the presence of g-C3N4. In addition, compared with pure TiO2, these nanostructures exhibited a red shift in the absorption onset, from 390 nm (pure TiO2) to around 450 nm, hence suggesting the ability of these materials to absorb in the visible region and a possible enhancement of their photocatalytic activity under visible light.
The PL spectra of TiO2, g-C3N4 and 30-GCN-T materials are also presented in Figure 9b. In the case of pure TiO2, barely any emission was detected, while pure g-C3N4 and 30-GCN-T materials exhibited a similar broad and asymmetric emission band, typical of graphitic carbon nitride [106,107]. The inset of Figure 9b reveals a slight shift in the peak position between the two materials, with the band associated with pure g-C3N4 peaking at 450 nm (~2.75 eV) while 30-GCN-T exhibiting its maximum at ~446 nm (~2.78 eV). Figure S2 depicts the spectral deconvolution of the broad bands for each material using three Gaussian functions. In both cases, the same bands were identified, peaking at 2.817 eV (~440 nm), 2.709 eV (~458 nm) and 2.494 eV (~497 nm), which indicates the contribution of the same optical centers to the overall PL emission. These findings are in line with reports from Yuan et al. and Das et al., who demonstrated that after deconvolution of the g-C3N4 PL spectrum, three emission centers could be observed in this material at around 431, 458 and 491 nm, originating from the σ*– lone pair (LP), π*–LP and π*–π transition pathways, respectively [108,109]. The slight shift in the peak position observed in the present materials is due to different relative intensities of the deconvoluted bands, specifically, an increase in the relative intensity of the band peaking at the highest energy, while the bands at lower energies experience a reduction in their relative intensity. Although not shown, the same results were observed for 15-GCN-T and 45-GCN-T, attesting to the reproducibility of this behavior. This change in the relative intensity of the PL components can be related to the interaction between the g-C3N4 nanosheets and the TiO2 particles, namely charge transfer phenomena, as reported in other works [110,111], which will be highly beneficial for photocatalytic applications.

3.3. Photocatalytic Performance in the Degradation of MO under Solar Simulating Light

The produced nanomaterials in powder form were tested as photocatalysts for the degradation of MO under solar simulating light. The degradation rate was monitored by recording the decay in the absorbance peak intensity at 464 nm [112] using a UV-VIS spectrophotometer in intervals of 30 min (for the first 2 h) and every 1 h up to 240 min (4 h) subsequently (Figure S3a–e). After this time, a transparent solution could be observed (Figure S3f). The MO degradation ratio (%) was calculated based on Equation (2):
Degradation   % = A 0 A A 0 × 100
where A 0 is the initial absorbance of the MO solution before irradiation, and A is the absorbance of the MO solution after a certain exposure time (t) [23,78,86,113,114]. Based on Figure S3a–e, it is possible to calculate the ratio between the maximum value of each absorbance spectrum ( A ) at each exposure time and the initial absorbance of the solution ( A 0 ), as depicted in Figure 10a. As shown in Figure 10a, MO degradation without the catalyst was insignificant in the dark and under solar simulating light, which indicates that the MO solution is highly stable under light exposure cycles. In fact, a slight increase in MO intensity is observed over time, likely associated with the evaporation of the solvent [86].
MO degradation ratios were obtained through Equation (2), and a minimal MO degradation percentage was obtained (18%) in the presence of pure g-C3N4 within 4 h under solar simulating light. This phenomenon can be explained by the fast electron–hole recombination in this material, which lowers its photocatalytic activity [115]. In contrast, a substantial increase to 60% of MO degradation was achieved with pure TiO2 for the same exposure time.
Many factors influence TiO2 photocatalytic behavior, such as the crystalline phase, specific surface area, active facets and particle size [30,116]. Regarding the effect of particle size, large TiO2 aggregates composed of nanocrystals were obtained (with an average size of ~543 nm, as confirmed by SEM). It is well known that larger particles possess lower specific surface area and surface-to-volume ratio [86]. In spite of that, some hollow spheres were also observed (Figure 3b), providing more active sites for photocatalytic reactions. In terms of TiO2 active surfaces, as revealed by STEM, the (100) surface was exposed in TiO2 nanocrystals, which is one of the most active surfaces for photocatalysis. This is due to its superior surface atomic structure (100% five-coordinate Ti atoms (Ti5c)), and it possesses a greater electronic band structure, where higher reductive and oxidative photoexcited charge carriers can be generated and transferred to the TiO2 surface to react with the pollutant molecules, resulting in higher photocatalytic performance [117,118]. The crystalline phase also plays a key role in photocatalytic activity. Although the synergistic effect of a mixture of TiO2 phases seems to be beneficial for photocatalysis, among the different TiO2 polymorphs and when it comes to a single phase, TiO2 anatase is considered the most photoactive phase. Pure TiO2 brookite may present superior photocatalytic activity compared to the other two phases. However, it is difficult to synthesize, making it the less studied TiO2 polymorph in photocatalysis [119]. Comparing TiO2 rutile and anatase, TiO2 rutile suffers from low generation and high recombination rate of charge carriers because of deep electron traps, despite having a lower band gap energy value (~3.0 eV) than TiO2 anatase (~3.2 eV). Studies also indicate that TiO2 anatase shows a slower charge carrier recombination, since it has the lightest average effective mass of photogenerated electrons and holes, hence the lowest recombination rate of charge carriers [119,120]. In addition, TiO2 anatase is considered an indirect band gap semiconductor, thus exhibiting a longer lifetime of photoexcited electrons and holes, since direct transitions of photogenerated electrons from the conduction band to the valence band of anatase are not possible [121].
Notably, all g-C3N4/TiO2 nanostructures exhibited superior photocatalytic performance compared to pure TiO2 and pure g-C3N4 (Figure 10a). As observed previously through the HAADF-STEM image in Figure 4i, an obvious interface was revealed between the TiO2 nanocrystal and the g-C3N4 sheet. Therefore, the enhancement of MO photocatalytic degradation under solar simulating light is expected to be due to an efficient photogenerated charge carriers’ separation at the g-C3N4–TiO2 anatase interface. The 15-GCN-T and 45-GCN-T materials exhibited similar MO photocatalytic degradation percentages (75 and 77%, respectively, in 4 h). The SEM images in Figure 3a show the presence of large TiO2 agglomerates in the 15-GCN-T material, leaving some uncovered areas of the g-C3N4 nanostructures by TiO2. The low content of g-C3N4 may also lead to insufficient visible-light absorption to excite the electrons and holes [122]. With the highest g-C3N4 content, not all g-C3N4 nanosheets were covered by TiO2 nanoparticles, and thus, this could have induced recombination of photogenerated charges, as previously reported [122].
The material with an intermediate amount of g-C3N4 (30-GCN-T) demonstrated the best photocatalytic performance, and in the presence of this material, MO degradation of 84% was achieved in 4 h. Therefore, the optimum g-C3N4 loading in TiO2 was found to be 30% in weight.
To determine the MO degradation kinetics, the Langmuir–Hinshelwood model was used, and the simplified pseudo-first-order kinetics equation was applied, as represented in Equation (3).
ln C C 0 = k ap t
In Equation (3), k ap is the photodegradation apparent rate constant (min−1), t is the time (min), C 0 is the initial concentration (mg/L), and C is the concentration at a certain time (mg/L) [86,114].
The photodegradation apparent rate constants ( k ap ) were obtained from the plots of ln C C 0 as a function of time (t), as seen in Figure 10b, where the apparent rate constants correspond to the slopes of the linear regressions. Table 2 summarizes the kinetic parameters (rate constants ( k ap ) and linear regression coefficients R2) obtained for the degradation of MO under solar simulating light up to 4 h.
Through the analysis of Table 2, it can be concluded that the photocatalytic dye degradation follows pseudo-first-order kinetics for all synthesized nanostructures, since a good correlation for the fitted lines was obtained (R2 > 0.95) [86,114]. A much higher photocatalytic degradation rate in the presence of g-C3N4/TiO2 nanostructures (15-GCN-T, 30-GCN-T and 45-GCN-T) was exhibited compared to the pure materials of TiO2 and g-C3N4. In fact, comparing the rate constant obtained with the best photocatalyst (30-GCN-T), an enhanced efficiency of almost 1.97 and 10 times greater than that of TiO2 and g-C3N4 nanosheets was achieved, respectively. Considering the present results, the improvement of the visible light utilization (Figure 9a), the suppression in the recombination rate of photogenerated charge carriers with respect to g-C3N4 (Figure 9b) and the interaction between g-C3N4 and TiO2 (Figure 4i and Figure 8) might have helped in boosting the photocatalytic activity in this material.
A direct comparison of related studies, such as the ones presented in Table 1, is not straightforward due to the distinct parameters employed during photocatalytic experiments. Nonetheless, it is noteworthy to mention the simplicity of the method used to prepare g-C3N4/TiO2 heterostructures by using a lower temperature and shorter reaction time.
In future studies, to avoid the drawbacks associated with the recovery and recyclability of powder catalysts, this heterostructure should be synthesized or immobilized on low-cost substrates through a simple and fast approach, such as microwave irradiation, and without the need for using toxic reagents, which has proved to be of great interest in photocatalytic applications [23,86].

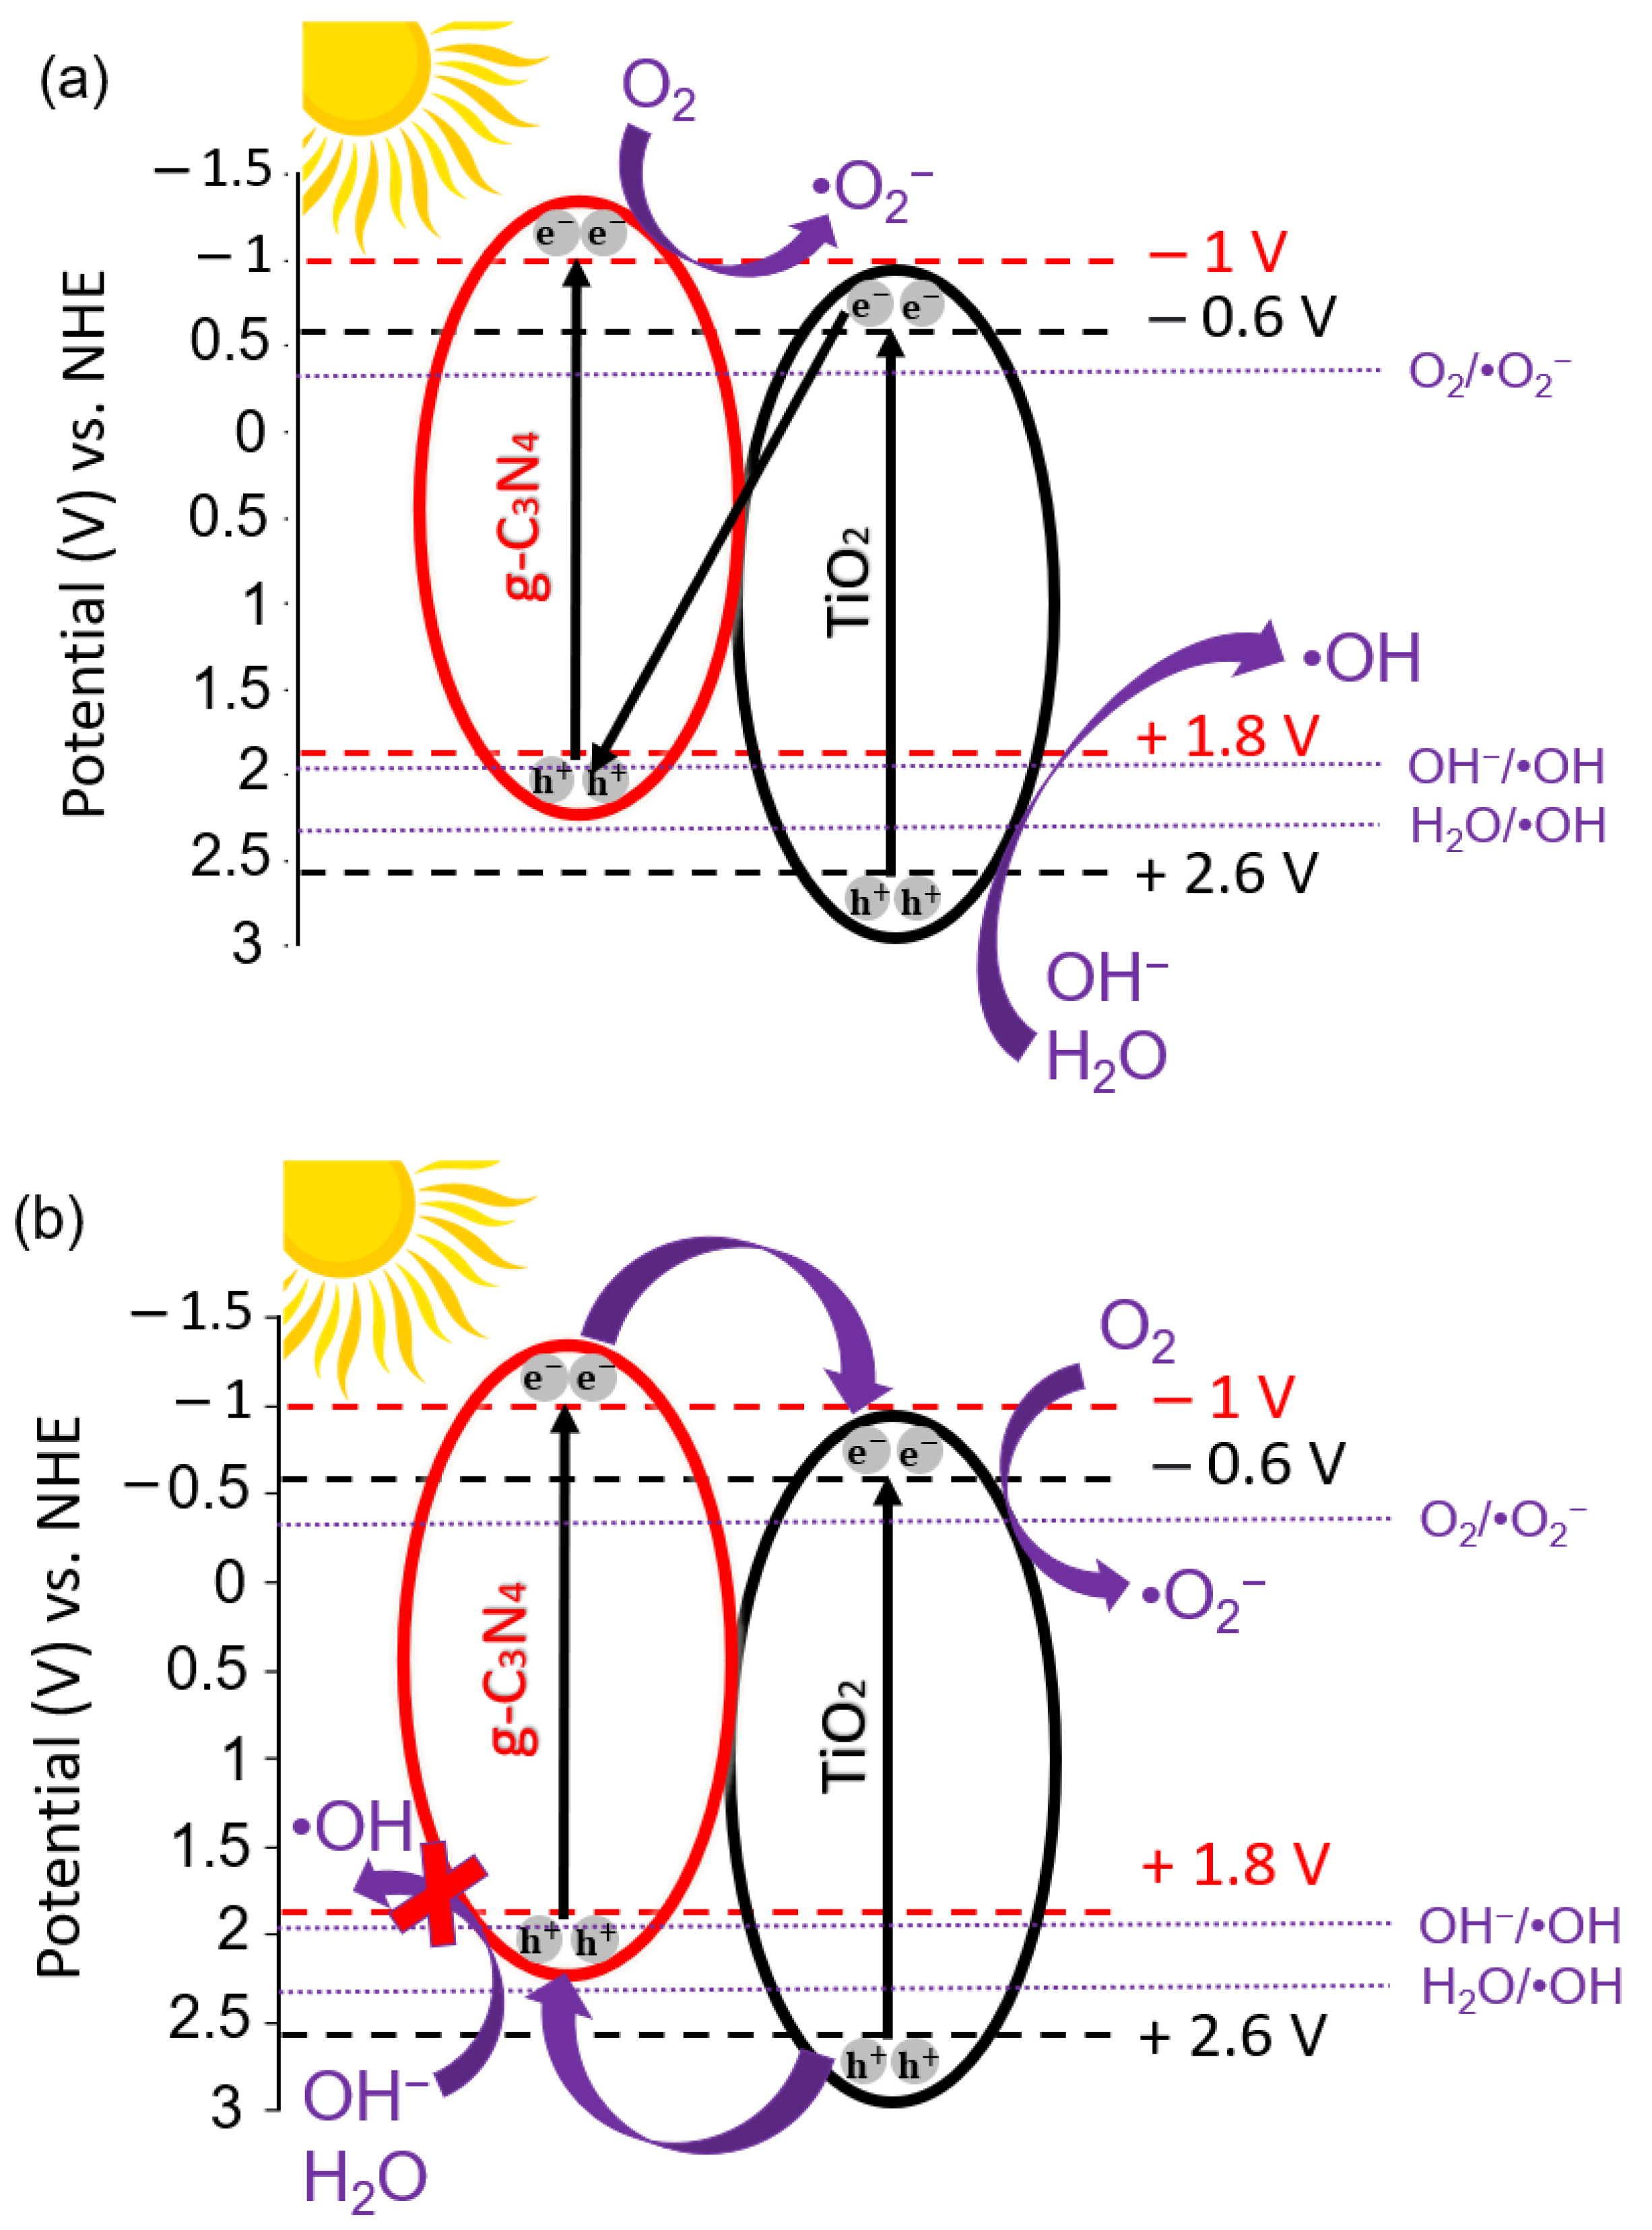
Reusability Tests and Possible Photocatalytic Degradation Mechanism

Recyclability tests were carried out with the best photocatalyst (30-GCN-T) under solar simulating light along five consecutive cycles of 4 h each. Figure 11a shows the C/C0 comparison of photocatalytic MO degradation by 30-GCN-T nanostructures along five cycles. A gradual decrease in the degradation efficiency is observed between cycles, and a degradation loss efficiency of around 20% is obtained at the end of the fifth cycle. A high percentage of MO molecules or reaction products could have remained adsorbed on the surface of the catalyst, retarding the photocatalytic degradation process [123].
The contribution of different ROS to the degradation rate of MO dye using the 30-GCN-T nanostructures was investigated under solar simulating light for 4 h. Although various ROS contribute to the photocatalytic degradation process [78,114], studies have shown that MO degradation is mainly driven by holes (h+), hydroxyl radicals (·OH) and superoxide ions (·O2) radicals [124,125]. Therefore, in this study, EDTA, IPA and BQ were used as specific scavengers of holes (h+), hydroxyl radicals (·OH) and superoxide ions (·O2). Photocatalytic degradation in the absence and presence of the different scavengers is presented as a MO degradation rate constant (Figure 11b). As shown in Figure 11b, all scavengers inhibited MO degradation. The addition of IPA had little effect on the MO degradation rate, revealing negligible participation of ·OH radicals in the degradation process. Unlike IPA, upon the use of BQ, the removal rate of MO dye by 30-GCN-T was significantly suppressed, thus suggesting that superoxide ions are the primary active species involved in the photocatalytic degradation process. This trend was followed by holes, since the addition of EDTA also showed a significant decrease in the reaction rate. Similar results are also reported in the literature, where superoxide radicals were the main active species, and holes acted as complementary species in MO photodegradation [126].

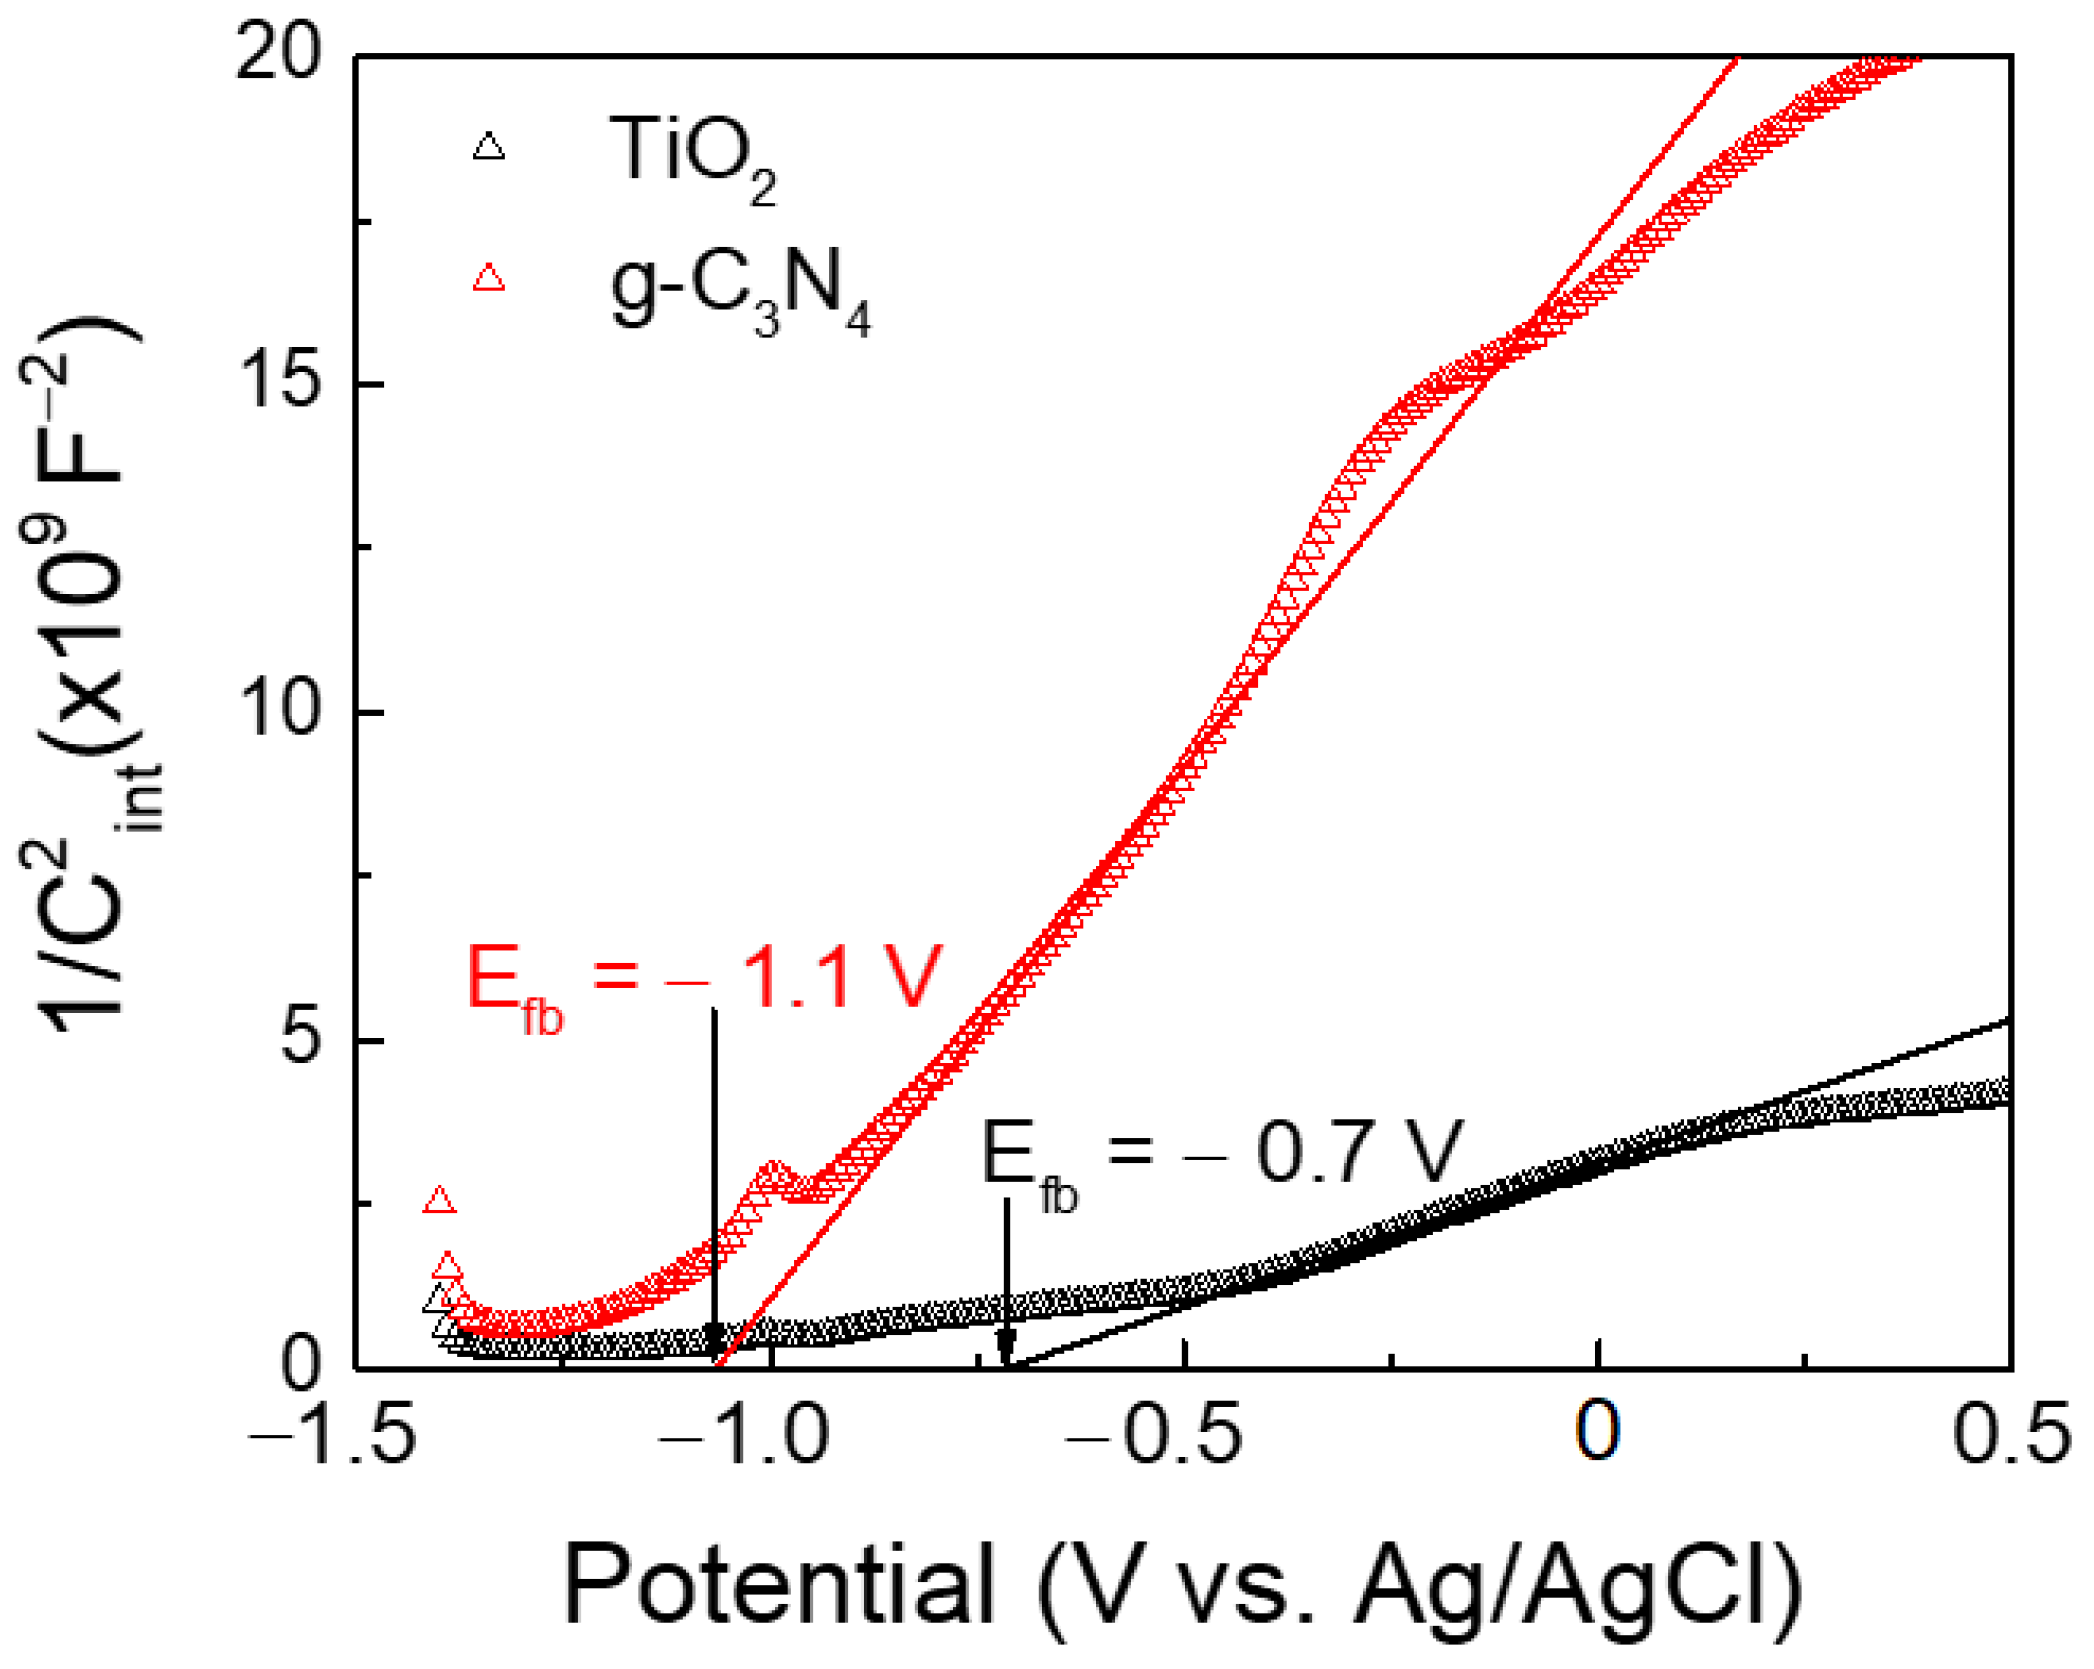
3.4. Electrochemical Characterization

For better insight into the charge transfer process and band alignment of the 30-GCN-T material, the flat band potentials (EFB) of TiO2 and g-C3N4 were obtained under 1 kHz from Mott–Schottky plots (M–S plots), as shown in Figure 12. The values were estimated based on the M–S relation (4):
1 C int 2 = 2 e ε ε 0 N d × E E FB KT e
where C int 2 is the interfacial capacitance; e is the electron charge; ε is the dielectric constant of the materials; ε 0 is the vacuum permittivity (8.85 × 10⁻¹² Fm−1); N d is the electron donor density; E is the applied potential; E FB is the flat band potential; K is the Boltzmann constant (1.38 × 10⁻²³ JK−1); and T is the temperature [79,127]. At RT, KT e is negligible [79]. Flat band potentials can be estimated by plotting a graph of 1/ C int 2 as a function of the potential (V) and can thus be estimated from the intercept of the linear portion of these graphs with the potential axis (y axis = 0) [128].
As visible in Figure 12, the positive slope on M–S plot curves suggests that both TiO2 and g-C3N4 materials exhibit an n-type semiconductor behavior [129,130,131]. The flat band potential values against Ag/AgCl were also estimated to be −0.7 V for TiO2 and −1.1 V for g-C3N4. These values are close to the previously reported data under 1 kHz [132,133]. The potentials were recalculated against NHE, according to Equation (1), and values of −0.50 V and −0.90 V were found for TiO2 and g-C3N4, respectively. Moreover, an approximation of the conduction band potential values (ECB) can also be performed, whereby for n-type semiconductors, it is often considered that EFB vs. NHE values are more positive at 0.1 V than ECB values [133,134]; therefore, ECB values were determined as −0.6 V and −1 V for TiO2 and g-C3N4. Based on the predicted optical band gap values, as visible in Figure 9a, it is possible to estimate the valence band potential values (EVB), which are obtained by adding the ECB values to the optical band gap values [135], resulting in +2.6 V and +1.8 V for TiO2 and g-C3N4, respectively.
Based on the experimental results above, two possible MO degradation mechanisms of the 30-GCN-T material are proposed (Figure 13). Under solar simulating light, electrons are excited from the valence band (VB) of TiO2 and g-C3N4 to the conduction band (CB) and generate electron–hole pairs. Regarding the first mechanism, since the VB potential of g-C3N4 (+1.8 V vs. NHE) is less positive than the reduction–oxidation potential of OH/·OH (+1.99 V vs. NHE) and H2O/·OH (+2.37 V vs. NHE), the holes will not be able to oxidize OH or H2O into ·OH radical species. Nevertheless, a small decrease in the photodegradation percentage of MO was observed previously after the addition of IPA (Figure 11b). Therefore, hydroxyl radicals participated in the degradation process. This was further supported by the decreased percentage of MO degradation after the addition of EDTA because the presence of holes was detected, which could contribute to the generation of ·OH radicals. Therefore, the formation of a Z-scheme mechanism seems possible [136]. In this scheme, the photogenerated electrons in TiO2 recombine with the holes in g-C3N4 through the built-in electrostatic field, resulting in a more efficient separation of photogenerated charge carriers. Due to the more positive VB potential in TiO2 (+2.6 V vs. NHE) than that in OH/·OH (+1.99 V vs. NHE) and H2O/·OH (+2.37 V vs. NHE) [137], the holes can form hydroxyl radicals by reacting with adsorbed water molecules or surface hydroxyls at the surface of TiO2. At the same time, the electrons on the CB of g-C3N4 could be captured by O2 to form ·O2 radical species due to the more cathodic CB potential (−1 V vs. NHE) compared to the redox potential of O2/·O2 (−0.33 V vs. NHE) radicals [137,138]. These hydroxyl and superoxide radical species (OH and ·O2, respectively) will further reduce and oxidize MO dye to H2O and CO2, with a major contribution from the superoxide radicals, as observed in the photodegradation experiments with ROS (Figure 11b) [139,140]. In this case, the good coupling between TiO2 and g-C3N4 leads to a stronger reduction and oxidation abilities, which will confer improved efficiency to the heterostructure for MO photocatalytic degradation under sunlight.
In contrast to this mechanism, and as revealed before, only a small fraction of hydroxyl radicals was formed during the photocatalytic reaction due to the slight inhibition with IPA. These hydroxyl radicals could have been produced by the reaction of remaining TiO2 holes and hydroxyl groups. In this mechanism (type-II heterostructure), electron–hole pairs are produced and separated in both materials upon light irradiation. Photogenerated holes are transferred from TiO2 to g-C3N4 and do not produce hydroxyl radicals, although they might directly oxidize MO dye. Meanwhile, the electrons in g-C3N4 flow to the conduction band of TiO2 and are subsequently scavenged by oxygen on the surface of the catalyst to generate superoxide radicals [111]. Efficient separation of electron–hole pairs is expected, thereby prolonging the lifetime of photogenerated charge carriers, resulting in improvement of the photocatalytic efficiency of the photocatalyst [141].

4. Conclusions

In conclusion, visible-light-activated photocatalysts based on g-C3N4 and TiO2 were produced through a simple and fast microwave-assisted approach, contrary to the frequently employed time- and energy-consuming fabrication methods reported in the literature. Different g-C3N4 amounts in TiO2 were investigated, and the produced nanopowders (15-GCN-T, 30-GCN-T and 45-GCN-T) were tested for the degradation of MO under solar simulating light. XRD data indicated the presence of solely anatase TiO2 and g-C3N4 in 30-GCN-T and 45-GCN-T heterostructures, while only the TiO2 anatase phase was detected in the 15-GCN-T material, likely due to the low percentage of g-C3N4 in the heterostructure. The SEM results showed that the use of ethanol as solvent resulted in irregularly shaped TiO2 particles, which formed large aggregates. The increase in the amount of g-C3N4 in TiO2 led to the disintegration of these larger particles, and smaller TiO2 agglomerates were formed, along with the formation of a TiO2 film, which covered the porous g-C3N4 nanosheets. For the 30-GCN-T material, STEM revealed an established interface between a TiO2 crystal and a g-C3N4 sheet, while XPS confirmed both components to be chemically intact in the heterostructure. The ability to use visible light was demonstrated by the red shift in the absorption onset compared with pure TiO2. The best photocatalytic performance was achieved with the 30-GCN-T heterostructure. This heterostructure can degrade 84% of MO dye in 4 h under solar simulating light, corresponding to an enhanced efficiency of almost 2 and 10 times greater than that of TiO2 and g-C3N4 nanosheets, respectively. Two photocatalytic degradation mechanisms were proposed: type-II heterostructure and Z-scheme, where the latter seemed more plausible owing to the small fraction of hydroxyl radical species detected, whereas superoxide radicals were the main active species observed in the ROS scavengers’ experiment. An easy strategy was employed in this study, without the need for pre- or post-treatment processes, in which g-C3N4/TiO2 heterostructures were synthesized through a microwave-assisted solvothermal method with great potential for water decontamination.

Supplementary Materials

The following supporting information can be downloaded at: https://www.mdpi.com/article/10.3390/nano13061090/s1, Figure S1: BF-TEM image of the 30-GCN-T material, demonstrating a g-C3N4 sheet with TiO2 nanocrystals.; Figure S2: Spectral deconvolution of the broad visible bands into three components for (a) g-C3N4 and (b) 30-GCN-T materials. An adequate fitting was obtained using three Gaussian functions peaked at ~2.817 eV, ~2.709 eV and ~2.494 eV, as described in the main text.; Figure S3: Absorbance spectra of the MO photocatalytic degradation under solar simulating light using the synthesized nanopowders of (a) TiO2, (b) g-C3N4, (c) 15-GCN-T, (d) 30-GCN-T and (e) 45-GCN-T. Photographic image of the MO solution before and after its degradation in 240 min under solar simulating light and in the presence of 30-GCN-T photocatalyst.

Author Contributions

M.L.M. was responsible for the production and characterization of the materials and photocatalytic measurements, as well as for writing the manuscript. T.C. was responsible for the AFM measurements, and J.D. performed the XPS analysis. A.P. and D.N. were responsible for the overall scientific orientation and revision of the manuscript. A.P. was also responsible for the XRD measurements, and D.N. performed the STEM observations and analysis. J.R. was responsible for the optical measurements, respective analyses and revision of the manuscript. A.S.R.-M. was responsible for the electrochemical measurements. E.F. and R.M. were responsible for supervising all the processes and obtaining the funding. All authors have read and agreed to the published version of the manuscript.

Funding

This work was financed by national funds from FCT-Fundação para a Ciência e a Tecnologia, I.P., within the scope of projects UI/BD/151292/2021 (Ph.D. research scholarship), LA/P/0037/2020, UIDP/50025/2020 and UIDB/50025/2020 of the Associate Laboratory Institute of Nanostructures, Nanomodelling, and Nanofabrication-i3N, but also the 2021.03825.CEECIND. Acknowledgments are also given to the EC project SYNERGY H2020-WIDESPREAD-2020-5, CSA, proposal nº 952169, EMERGE-2020-INFRAIA-2020-1, proposal nº 101008701, and to the European Community’s H2020 program under grant agreement No. 787410 (ERC-2018-AdG DIGISMART).

Data Availability Statement

The authors confirm that the data supporting the findings of this study are available within the article and its Supplementary Materials.

Conflicts of Interest

The authors declare no conflict of interest.

References

  1. Samsami, S.; Mohamadi, M.; Sarrafzadeh, M.H.; Rene, E.R.; Firoozbahr, M. Recent advances in the treatment of dye-containing wastewater from textile industries: Overview and perspectives. Process Saf. Environ. Prot. 2020, 143, 138–163. [Google Scholar] [CrossRef]
  2. Ju, L.; Tang, X.; Li, X.; Liu, B.; Qiao, X.; Wang, Z.; Yin, H. NO2 Physical-to-Chemical Adsorption Transition on Janus WSSe Monolayers Realized by Defect Introduction. Molecules 2023, 28, 1644. [Google Scholar] [CrossRef] [PubMed]
  3. Nan Chong, M.; Jin, B.; Chow, C.W.; Saint, C. Recent developments in photocatalytic water treatment technology: A review. Water Res. 2010, 44, 2997–3027. [Google Scholar] [CrossRef] [PubMed]
  4. Al-Tohamy, R.; Ali, S.S.; Li, F.; Okasha, K.M.; Mahmoud, Y.A.G.; Elsamahy, T.; Jiao, H.; Fu, Y.; Sun, J. A critical review on the treatment of dye-containing wastewater: Ecotoxicological and health concerns of textile dyes and possible remediation approaches for environmental safety. Ecotoxicol. Environ. Saf. 2022, 231, 113160. [Google Scholar] [CrossRef] [PubMed]
  5. Aich, V.; Ehlert, K. (Eds.) Drought and Water Scarcity. In Global Water Partnership and World Meteorological Organization; WMO: Geneva, Switzerland, 2022; pp. 1–24. [Google Scholar]
  6. World Health Organization Drinking-Water. Available online: https://www.who.int/news-room/factsheets/detail/drinking-water (accessed on 29 November 2022).
  7. Malato, S.; Fernández-Ibáñez, P.; Maldonado, M.I.; Blanco, J.; Gernjak, W. Decontamination and disinfection of water by solar photocatalysis: Recent overview and trends. Catal. Today 2009, 147, 1–59. [Google Scholar] [CrossRef]
  8. Zhai, H.; Liu, Z.; Xu, L.; Liu, T.; Fan, Y.; Jin, L.; Dong, R.; Yi, Y.; Li, Y. Waste Textile Reutilization Via a Scalable Dyeing Technology: A Strategy to Enhance Dyestuffs Degradation Efficiency. Adv. Fiber Mater. 2022, 4, 1595–1608. [Google Scholar] [CrossRef]
  9. Moussavi, G.; Mahmoudi, M. Removal of azo and anthraquinone reactive dyes from industrial wastewaters using MgO nanoparticles. J. Hazard. Mater. 2009, 168, 806–812. [Google Scholar] [CrossRef]
  10. Dutta, S.; Gupta, B.; Srivastava, S.K.; Gupta, A.K. Recent advances on the removal of dyes from wastewater using various adsorbents: A critical review. Mater. Adv. 2021, 2, 4497–4531. [Google Scholar] [CrossRef]
  11. Anisuzzaman, S.M.; Joseph, C.G.; Pang, C.K.; Affandi, N.A.; Maruja, S.N.; Vijayan, V. Current Trends in the Utilization of Photolysis and Photocatalysis Treatment Processes for the Remediation of Dye Wastewater: A Short Review. ChemEngineering 2022, 6, 58. [Google Scholar] [CrossRef]
  12. Sheikh, M.U.D.; Naikoo, G.A.; Thomas, M.; Bano, M.; Khan, F. Solar-assisted photocatalytic reduction of methyl orange azo dye over porous TiO2 nanostructures. New J. Chem. 2016, 40, 5483–5494. [Google Scholar] [CrossRef]
  13. Sandoval, C.; Molina, G.; Vargas Jentzsch, P.; Pérez, J.; Muñoz, F. Photocatalytic Degradation of Azo Dyes Over Semiconductors Supported on Polyethylene Terephthalate and Polystyrene Substrates. J. Adv. Oxid. Technol. 2017, 20, 20170006. [Google Scholar] [CrossRef] [Green Version]
  14. Sha, Y.; Mathew, I.; Cui, Q.; Clay, M.; Gao, F.; Zhang, X.J.; Gu, Z. Rapid degradation of azo dye methyl orange using hollow cobalt nanoparticles. Chemosphere 2016, 144, 1530–1535. [Google Scholar] [CrossRef]
  15. Paz, A.; Carballo, J.; Pérez, M.J.; Domínguez, J.M. Biological treatment of model dyes and textile wastewaters. Chemosphere 2017, 181, 168–177. [Google Scholar] [CrossRef]
  16. Nunes, D.; Pimentel, A.; Branquinho, R.; Fortunato, E.; Martins, R. Metal oxide-based photocatalytic paper: A green alternative for environmental remediation. Catalysts 2021, 11, 504. [Google Scholar] [CrossRef]
  17. Ren, G.; Han, H.; Wang, Y.; Liu, S.; Zhao, J.; Meng, X.; Li, Z. Recent Advances of Photocatalytic Application in Water Treatment: A Review. Nanomaterials 2021, 11, 1804. [Google Scholar] [CrossRef]
  18. Kumar, S.; Ahlawat, W.; Bhanjana, G.; Heydarifard, S.; Nazhad, M.M.; Dilbaghi, N. Nanotechnology-based water treatment strategies. J. Nanosci. Nanotechnol. 2014, 14, 1838–1858. [Google Scholar] [CrossRef]
  19. Zhang, F.; Wang, X.; Liu, H.; Liu, C.; Wan, Y.; Long, Y.; Cai, Z. Recent Advances and Applications of Semiconductor Photocatalytic Technology. Appl. Sci. 2019, 9, 2489. [Google Scholar] [CrossRef] [Green Version]
  20. Sahu, O.; Karthikeyan, M.R. Reduction of Textile Dye by Using Heterogeneous Photocatalysis. Am. J. Environ. Prot. 2013, 2, 94. [Google Scholar] [CrossRef]
  21. Kuldeep, A.R.; Dhabbe, R.S.; Garadkar, K.M. Development of g-C3N4-TiO2 visible active hybrid photocatalyst for the photodegradation of methyl orange. Res. Chem. Intermed. 2021, 47, 5155–5174. [Google Scholar] [CrossRef]
  22. Nunes, D.; Pimentel, A.; Araujo, A.; Calmeiro, T.R.; Panigrahi, S.; Pinto, J.V.; Barquinha, P.; Gama, M.; Fortunato, E.; Martins, R. Enhanced UV Flexible Photodetectors and Photocatalysts Based on TiO2 Nanoplatforms. Top. Catal. 2018, 61, 1591–1606. [Google Scholar] [CrossRef] [Green Version]
  23. Matias, M.L.; Pimentel, A.; Reis-Machado, A.S.; Rodrigues, J.; Deuermeier, J.; Fortunato, E.; Martins, R.; Nunes, D. Enhanced Fe-TiO2 Solar Photocatalysts on Porous Platforms for Water Purification. Nanomaterials 2022, 12, 1005. [Google Scholar] [CrossRef] [PubMed]
  24. Zhang, Z.; Zou, C.; Yang, S.; Yang, Z.; Yang, Y. Ferroelectric polarization effect promoting the bulk charge separation for enhance the efficiency of photocatalytic degradation. Chem. Eng. J. 2021, 410, 128430. [Google Scholar] [CrossRef]
  25. Nunes, D.; Pimentel, A.; Santos, L.; Barquinha, P.; Fortunato, E.; Martins, R. Photocatalytic TiO2 Nanorod Spheres and Arrays Compatible with Flexible Applications. Catalysts 2017, 7, 60. [Google Scholar] [CrossRef] [Green Version]
  26. Nunes, D.; Pimentel, A.; Pinto, J.V.; Calmeiro, T.R.; Nandy, S.; Barquinha, P.; Pereira, L.; Carvalho, P.A.; Fortunato, E.; Martins, R. Photocatalytic behavior of TiO2 films synthesized by microwave irradiation. Catal. Today 2016, 278, 262–270. [Google Scholar] [CrossRef]
  27. Ratshiedana, R.; Kuvarega, A.T.; Mishra, A.K. Titanium dioxide and graphitic carbon nitride–based nanocomposites and nanofibres for the degradation of organic pollutants in water: A review. Environ. Sci. Pollut. Res. 2021, 28, 10357–10374. [Google Scholar] [CrossRef]
  28. Jeon, J.P.; Kweon, D.H.; Jang, B.J.; Ju, M.J.; Baek, J.B. Enhancing the Photocatalytic Activity of TiO2 Catalysts. Adv. Sustain. Syst. 2020, 4, 2000197. [Google Scholar] [CrossRef]
  29. Pimentel, A.; Nunes, D.; Pereira, S.; Martins, R.; Fortunato, E. Photocatalytic Activity of TiO2 Nanostructured Arrays Prepared by Microwave-Assisted Solvothermal Method. In Semiconductor Photocatalysis—Materials, Mechanisms and Applications; IntechOpen: London, UK, 2016; Chapter 3. [Google Scholar]
  30. Freire, T.; Fragoso, A.R.; Matias, M.; Vaz Pinto, J.; Marques, A.C.; Pimentel, A.; Barquinha, P.; Huertas, R.; Fortunato, E.; Martins, R.; et al. Enhanced solar photocatalysis of TiO2 nanoparticles and nanostructured thin films grown on paper. Nano Express 2021, 2, 040002. [Google Scholar] [CrossRef]
  31. Ansari, S.A.; Cho, M.H. Highly Visible Light Responsive, Narrow Band gap TiO2 Nanoparticles Modified by Elemental Red Phosphorus for Photocatalysis and Photoelectrochemical Applications. Sci. Rep. 2016, 6, 25405. [Google Scholar] [CrossRef] [Green Version]
  32. Valencia, S.; Marín, J.M.; Restrepo, G. Study of the bandgap of synthesized titanium dioxide nanoparticules using the sol-gel method and a hydrothermal treatment. Open Mater. Sci. J. 2010, 4, 9–14. [Google Scholar] [CrossRef]
  33. Ibrahim, N.S.; Leaw, W.L.; Mohamad, D.; Alias, S.H.; Nur, H. A critical review of metal-doped TiO2 and its structure–physical properties–photocatalytic activity relationship in hydrogen production. Int. J. Hydrog. Energy 2020, 45, 28553–28565. [Google Scholar] [CrossRef]
  34. Szkoda, M.; Siuzdak, K.; Lisowska-Oleksiak, A. Non-metal doped TiO2 nanotube arrays for high efficiency photocatalytic decomposition of organic species in water. Phys. E: Low-Dimens. Syst. Nanostructures 2016, 84, 141–145. [Google Scholar] [CrossRef]
  35. Park, K.; Meunier, V.; Pan, M.; Plummer, W. Defect-Driven Restructuring of TiO2 Surface and Modified Reactivity Toward Deposited Gold Atoms. Catalysts 2013, 3, 276–287. [Google Scholar] [CrossRef] [Green Version]
  36. Zhang, Z.; Ma, Y.; Bu, X.; Wu, Q.; Hang, Z.; Dong, Z.; Wu, X. Facile one-step synthesis of TiO2/Ag/SnO2 ternary heterostructures with enhanced visible light photocatalytic activity. Sci. Rep. 2018, 8, 10532. [Google Scholar] [CrossRef] [Green Version]
  37. Angel, R.D.; Durán-Álvarez, J.C.; Zanella, R.; Angel, R.D.; Durán-Álvarez, J.C.; Zanella, R. TiO2-Low Band Gap Semiconductor Heterostructures for Water Treatment Using Sunlight-Driven Photocatalysis. In Titanium Dioxide—Material for a Sustainable Environment; IntechOpen: London, UK, 2018; ISBN 978-1-78923-327-8. [Google Scholar]
  38. Zhang, X.; Li, L.; Zeng, Y.; Liu, F.; Yuan, J.; Li, X.; Yu, Y.; Zhu, X.; Xiong, Z.; Yu, H.; et al. TiO2/Graphitic Carbon Nitride Nanosheets for the Photocatalytic Degradation of Rhodamine B under Simulated Sunlight. ACS Appl. Nano Mater. 2019, 2, 7255–7265. [Google Scholar] [CrossRef]
  39. Pham, M.T.; Luu, H.Q.; Nguyen, T.M.T.; Tran, H.H.; You, S.J.; Wang, Y.F. Rapid and Scalable Fabrication of TiO2@g-C3N4 Heterojunction for Highly Efficient Photocatalytic NO Removal under Visible Light. Aerosol Air Qual. Res. 2021, 21, 210276. [Google Scholar] [CrossRef]
  40. Zhu, J.; Xiao, P.; Li, H.; Carabineiro, S.A.C. Graphitic carbon nitride: Synthesis, properties, and applications in catalysis. ACS Appl. Mater. Interfaces 2014, 6, 16449–16465. [Google Scholar] [CrossRef]
  41. Tripathi, A.; Narayanan, S. Structural modification of a 2D π-conjugated polymeric material (g-C3N4) through boron doping for extended visible light absorption. Synth. Met. 2020, 260, 116284. [Google Scholar] [CrossRef]
  42. Zhang, Y.; Pan, Q.; Chai, G.; Liang, M.; Dong, G.; Zhang, Q.; Qiu, J. Synthesis and luminescence mechanism of multicolor-emitting g-C3N4 nanopowders by low temperature thermal condensation of melamine. Sci. Rep. 2013, 3, 1943. [Google Scholar] [CrossRef] [Green Version]
  43. Iqbal, W.; Yang, B.; Zhao, X.; Rauf, M.; Waqas, M.; Gong, Y.; Zhang, J.; Mao, Y. Controllable synthesis of graphitic carbon nitride nanomaterials for solar energy conversion and environmental remediation: The road travelled and the way forward. Catal. Sci. Technol. 2018, 8, 4576–4599. [Google Scholar] [CrossRef]
  44. Fu, J.; Wang, S.; Wang, Z.; Liu, K.; Li, H.; Liu, H.; Hu, J.; Xu, X.; Li, H.; Liu, M. Graphitic carbon nitride based single-atom photocatalysts. Front. Phys. 2020, 15, 33201. [Google Scholar] [CrossRef]
  45. Ye, S.; Wang, R.; Wu, M.Z.; Yuan, Y.P. A review on g-C3N4 for photocatalytic water splitting and CO2 reduction. Appl. Surf. Sci. 2015, 358, 15–27. [Google Scholar] [CrossRef]
  46. Xu, H.Y.; Wu, L.C.; Zhao, H.; Jin, L.G.; Qi, S.Y. Synergic Effect between Adsorption and Photocatalysis of Metal-Free g-C3N4 Derived from Different Precursors. PLoS ONE 2015, 10, e0142616. [Google Scholar] [CrossRef] [PubMed] [Green Version]
  47. Yang, L.; Liu, X.; Liu, Z.; Wang, C.; Liu, G.; Li, Q.; Feng, X. Enhanced photocatalytic activity of g-C3N4 2D nanosheets through thermal exfoliation using dicyandiamide as precursor. Ceram. Int. 2018, 44, 20613–20619. [Google Scholar] [CrossRef]
  48. Yan, S.C.; Li, Z.S.; Zou, Z.G. Photodegradation performance of g-C3N4 fabricated by directly heating melamine. Langmuir 2009, 25, 10397–10401. [Google Scholar] [CrossRef] [PubMed]
  49. Li, L.; Hasan, I.M.U.; Qiao, J.; He, R.; Peng, L.; Xu, N.; Niazi, N.K.; Zhang, J.-N.; Farwa, F. Copper as a single metal atom based photo-, electro-, and photoelectrochemical catalyst decorated on carbon nitride surface for efficient CO2 reduction: A review. Nano Res. Energy 2022, 1, e9120015. [Google Scholar] [CrossRef]
  50. Thurston, J.H.; Hunter, N.M.; Wayment, L.J.; Cornell, K.A. Urea-derived graphitic carbon nitride (u-g-C3N4) films with highly enhanced antimicrobial and sporicidal activity. J. Colloid Interface Sci. 2017, 505, 910. [Google Scholar] [CrossRef]
  51. Dong, F.; Sun, Y.; Wu, L.; Fu, M.; Wu, Z. Facile transformation of low cost thiourea into nitrogen-rich graphitic carbon nitride nanocatalyst with high visible light photocatalytic performance. Catal. Sci. Technol. 2012, 2, 1332–1335. [Google Scholar] [CrossRef]
  52. Asaithambi, S.; Sakthivel, P.; Karuppaiah, M.; Yuvakkumar, R.; Velauthapillai, D.; Ahamad, T.; Khan, M.A.M.; Mohammed, M.K.A.; Vijayaprabhu, N.; Ravi, G. The bifunctional performance analysis of synthesized Ce doped SnO2/g-C3N4 composites for asymmetric supercapacitor and visible light photocatalytic applications. J. Alloy. Compd. 2021, 866, 158807. [Google Scholar] [CrossRef]
  53. International Energy Agency. Final List of Critical Minerals 2022. Available online: https://www.iea.org/policies/15271-final-list-of-critical-minerals-2022 (accessed on 30 December 2022).
  54. Song, G.; Chu, Z.; Jin, W.; Sun, H. Enhanced performance of g-C3N4/TiO2 photocatalysts for degradation of organic pollutants under visible light. Chin. J. Chem. Eng. 2015, 23, 1326–1334. [Google Scholar] [CrossRef]
  55. Guo, Y.; Sun, X.; Chen, Q.; Liu, Y.; Lou, X.; Zhang, L.; Zhang, X.; Li, Y.; Guan, J. Photocatalytic Applications of g-C3N4 Based on Bibliometric Analysis. Catalysts 2022, 12, 1017. [Google Scholar] [CrossRef]
  56. Le, S.; Zhu, C.; Cao, Y.; Wang, P.; Liu, Q.; Zhou, H.; Chen, C.; Wang, S.; Duan, X. V2O5 nanodot-decorated laminar C3N4 for sustainable photodegradation of amoxicillin under solar light. Appl. Catal. B Environ. 2022, 303, 120903. [Google Scholar] [CrossRef]
  57. Acharya, R.; Parida, K. A review on TiO2/g-C3N4 visible-light- responsive photocatalysts for sustainable energy generation and environmental remediation. J. Environ. Chem. Eng. 2020, 8, 103896. [Google Scholar] [CrossRef]
  58. Kobkeatthawin, T.; Chaveanghong, S.; Trakulmututa, J.; Amornsakchai, T.; Kajitvichyanukul, P.; Smith, S.M. Photocatalytic Activity of TiO2/g-C3N4 Nanocomposites for Removal of Monochlorophenols from Water. Nanomaterials 2022, 12, 2852. [Google Scholar] [CrossRef]
  59. Wang, Q.; Fang, Z.; Zhang, W.; Zhang, D. High-Efficiency g-C3N4 Based Photocatalysts for CO2 Reduction: Modification Methods. Adv. Fiber Mater. 2022, 4, 342–360. [Google Scholar] [CrossRef]
  60. Huang, Q.; Wang, C.; Hao, D.; Wei, W.; Wang, L.; Ni, B.J. Ultralight biodegradable 3D-g-C3N4 aerogel for advanced oxidation water treatment driven by oxygen delivery channels and triphase interfaces. J. Clean. Prod. 2021, 288, 125091. [Google Scholar] [CrossRef]
  61. Li, Y.; Wang, J.; Yang, Y.; Zhang, Y.; He, D.; An, Q.; Cao, G. Seed-induced growing various TiO2 nanostructures on g-C3N4 nanosheets with much enhanced photocatalytic activity under visible light. J. Hazard. Mater. 2015, 292, 79–89. [Google Scholar] [CrossRef]
  62. Zang, Y.; Li, L.; Xu, Y.; Zuo, Y.; Li, G. Hybridization of brookite TiO2 with g-C3N4: A visible-light-driven photocatalyst for As3+ oxidation, MO degradation and water splitting for hydrogen evolution. J. Mater. Chem. A 2014, 2, 15774–15780. [Google Scholar] [CrossRef]
  63. Zeng, L.; He, Z.; Luo, Y.; Xu, J.; Chen, J.; Wu, L.; Huang, P.; Xu, S. A Simple g-C3N4/TNTs Heterojunction for Improving the Photoelectrocatalytic Degradation of Methyl Orange. J. Electrochem. Soc. 2021, 168, 116520. [Google Scholar] [CrossRef]
  64. Mohini, R.; Lakshminarasimhan, N. Coupled semiconductor nanocomposite g-C3N4/TiO2 with enhanced visible light photocatalytic activity. Mater. Res. Bull. 2016, 76, 370–375. [Google Scholar] [CrossRef]
  65. Liu, X.; Chen, N.; Li, Y.; Deng, D.; Xing, X.; Wang, Y. A general nonaqueous sol-gel route to g-C3N4-coupling photocatalysts: The case of Z-scheme g-C3N4/TiO2 with enhanced photodegradation toward RhB under visible-light. Sci. Rep. 2016, 6, 39531. [Google Scholar] [CrossRef] [Green Version]
  66. Imbar, A.; Vadivel, V.K.; Mamane, H. Solvothermal Synthesis of g-C3N4/TiO2 Hybrid Photocatalyst with a Broaden Activation Spectrum. Catalysts 2023, 13, 46. [Google Scholar] [CrossRef]
  67. Miranda, C.; Mansilla, H.; Yáñez, J.; Obregón, S.; Colón, G. Improved photocatalytic activity of g-C3N4/TiO2 composites prepared by a simple impregnation method. J. Photochem. Photobiol. A Chem. 2013, 253, 16–21. [Google Scholar] [CrossRef]
  68. Wang, X.J.; Yang, W.Y.; Li, F.T.; Xue, Y.B.; Liu, R.H.; Hao, Y.J. In situ microwave-assisted synthesis of porous N-TiO2/g-C3N4 heterojunctions with enhanced visible-light photocatalytic properties. Ind. Eng. Chem. Res. 2013, 52, 17140–17150. [Google Scholar] [CrossRef]
  69. Liu, Y.; Tian, J.; Wei, L.; Wang, Q.; Wang, C.; Yang, C. A novel microwave-assisted impregnation method with water as the dispersion medium to synthesize modified g-C3N4/TiO2 heterojunction photocatalysts. Opt. Mater. 2020, 107, 110128. [Google Scholar] [CrossRef]
  70. Negrescu, A.M.; Killian, M.S.; Raghu, S.N.V.; Schmuki, P.; Mazare, A.; Cimpean, A. Metal Oxide Nanoparticles: Review of Synthesis, Characterization and Biological Effects. J. Funct. Biomater. 2022, 13, 274. [Google Scholar] [CrossRef]
  71. Raza, G. Titanium Dioxide Nanomaterials, Synthesis, Stability and Mobility in Natural and Synthetic Porous Media. Ph.D. Thesis, The University of Birmingham, Birmingham, UK, 2016. [Google Scholar]
  72. Pimentel, A.; Rodrigues, J.; Duarte, P.; Nunes, D.; Costa, F.M.; Monteiro, T.; Martins, R.; Fortunato, E. Effect of solvents on ZnO nanostructures synthesized by solvothermal method assisted by microwave radiation: A photocatalytic study. J. Mater. Sci. 2015, 50, 5777–5787. [Google Scholar] [CrossRef]
  73. Tiwari, S.; Talreja, S. Green Chemistry and Microwave Irradiation Technique: A Review. J. Pharm. Res. Int. 2022, 34, 74–79. [Google Scholar] [CrossRef]
  74. Pimentel, A.; Samouco, A.; Nunes, D.; Araújo, A.; Martins, R.; Fortunato, E. Ultra-Fast Microwave Synthesis of ZnO Nanorods on Cellulose Substrates for UV Sensor Applications. Materials 2017, 10, 1308. [Google Scholar] [CrossRef] [Green Version]
  75. Zou, X.X.; Li, G.D.; Wang, Y.N.; Zhao, J.; Yan, C.; Guo, M.Y.; Li, L.; Chen, J.S. Direct conversion of urea into graphitic carbon nitride over mesoporous TiO2 spheres under mild condition. Chem. Commun. 2011, 47, 1066–1068. [Google Scholar] [CrossRef]
  76. Schneider, C.A.; Rasband, W.S.; Eliceiri, K.W. NIH Image to ImageJ: 25 years of image analysis. Nat. Methods 2012, 9, 671–675. [Google Scholar] [CrossRef]
  77. Guan, R.; Li, J.; Zhang, J.; Zhao, Z.; Wang, D.; Zhai, H.; Sun, D. Photocatalytic Performance and Mechanistic Research of ZnO/g-C3N4 on Degradation of Methyl Orange. ACS Omega 2019, 4, 20742–20747. [Google Scholar] [CrossRef] [Green Version]
  78. Rovisco, A.; Morais, M.; Branquinho, R.; Fortunato, E.; Martins, R.; Barquinha, P. Microwave-Assisted Synthesis of Zn2SnO4 Nanostructures for Photodegradation of Rhodamine B under UV and Sunlight. Nanomaterials 2022, 12, 2119. [Google Scholar] [CrossRef]
  79. Ma, Y.; Zhang, Z.; Jiang, X.; Sun, R.; Xie, M.; Han, W. Supporting Information: Direct Z-scheme Sn-In2O3/In2S3 heterojunction nanostructures for enhanced photocatalytic CO2 reduction activity. J. Mater. Chem. C 2021, 9, 3987–3997. [Google Scholar] [CrossRef]
  80. Fina, F.; Callear, S.K.; Carins, G.M.; Irvine, J.T.S. Structural investigation of graphitic carbon nitride via XRD and neutron diffraction. Chem. Mater. 2015, 27, 2612–2618. [Google Scholar] [CrossRef] [Green Version]
  81. Zhang, H.; Liu, F.; Wu, H.; Cao, X.; Sun, J.; Lei, W. In situ synthesis of g-C3N4/TiO2 heterostructures with enhanced photocatalytic hydrogen evolution under visible light. RSC Adv. 2017, 7, 40327–40333. [Google Scholar] [CrossRef] [Green Version]
  82. Li, J.; Ma, Y.; Xu, Y.; Li, P.; Guo, J. Enhanced photocatalytic degradation activity of Z-scheme heterojunction BiVO4/Cu/g-C3N4 under visible light irradiation. Water Environ. Res. 2021, 93, 2010–2024. [Google Scholar] [CrossRef]
  83. Mo, Z.; She, X.; Li, Y.; Liu, L.; Huang, L.; Chen, Z.; Zhang, Q.; Xu, H.; Li, H. Synthesis of g-C3N4 at different temperatures for superior visible/UV photocatalytic performance and photoelectrochemical sensing of MB solution. RSC Adv. 2015, 5, 101552–101562. [Google Scholar] [CrossRef]
  84. Dong, J.; Zhang, Y.; Hussain, M.I.; Zhou, W.; Chen, Y.; Wang, L.N. g-C3N4: Properties, Pore Modifications, and Photocatalytic Applications. Nanomaterials 2022, 12, 121. [Google Scholar] [CrossRef]
  85. Rhimi, B.; Wang, C.; Bahnemann, D.W. Latest progress in g-C3N4 based heterojunctions for hydrogen production via photocatalytic water splitting: A mini review. J. Phys Energy 2020, 2, 042003. [Google Scholar] [CrossRef]
  86. Matias, M.L.; Morais, M.; Pimentel, A.; Vasconcelos, F.X.; Reis Machado, A.S.; Rodrigues, J.; Fortunato, E.; Martins, R.; Nunes, D. Floating TiO2-Cork Nano-Photocatalysts for Water Purification Using Sunlight. Sustainability 2022, 14, 9645. [Google Scholar] [CrossRef]
  87. Shakeelur Raheman, A.R.; Wilson, H.M.; Momin, B.M.; Annapure, U.S.; Jha, N. TiO2 nanosheet/ultra-thin layer g-C3N4 core-shell structure: Bifunctional visible-light photocatalyst for H2 evolution and removal of organic pollutants from water. Appl. Surf. Sci. 2020, 528, 146930. [Google Scholar] [CrossRef]
  88. DeRita, L.; Resasco, J.; Dai, S.; Boubnov, A.; Thang, H.V.; Hoffman, A.S.; Ro, I.; Graham, G.W.; Bare, S.R.; Pacchioni, G.; et al. Structural evolution of atomically dispersed Pt catalysts dictates reactivity. Nat. Mater. 2019, 18, 746–751. [Google Scholar] [CrossRef] [PubMed]
  89. Yang, H.G.; Sun, C.H.; Qiao, S.Z.; Zou, J.; Liu, G.; Smith, S.C.; Cheng, H.M.; Lu, G.Q. Anatase TiO2 single crystals with a large percentage of reactive facets. Nature 2008, 453, 638–641. [Google Scholar] [CrossRef] [Green Version]
  90. Sun, K.; Shen, J.; Liu, Q.; Tang, H.; Zhang, M.; Zulfiqar, S.; Lei, C. Synergistic effect of Co(II)-hole and Pt-electron cocatalysts for enhanced photocatalytic hydrogen evolution performance of P-doped g-C3N4. Chin. J. Catal. 2020, 41, 72–81. [Google Scholar] [CrossRef]
  91. Zhao, Z.; Sun, Y.; Luo, Q.; Dong, F.; Li, H.; Ho, W.K. Mass-Controlled Direct Synthesis of Graphene-like Carbon Nitride Nanosheets with Exceptional High Visible Light Activity. Less is Better. Sci. Rep. 2015, 5, 14643. [Google Scholar] [CrossRef]
  92. Zhang, S.; Hang, N.T.; Zhang, Z.; Yue, H.; Yang, W. Preparation of g-C3N4/Graphene Composite for Detecting NO2 at Room Temperature. Nanomaterials 2017, 7, 12. [Google Scholar] [CrossRef] [Green Version]
  93. Li, K.; Gao, S.; Wang, Q.; Xu, H.; Wang, Z.; Huang, B.; Dai, Y.; Lu, J. In-situ-reduced synthesis of Ti3+ self-doped TiO2/g-C3N4 heterojunctions with high photocatalytic performance under LED light irradiation. ACS Appl. Mater. Interfaces 2015, 7, 9023–9030. [Google Scholar] [CrossRef]
  94. Alcudia-Ramos, M.A.; Fuentez-Torres, M.O.; Ortiz-Chi, F.; Espinosa-González, C.G.; Hernández-Como, N.; García-Zaleta, D.S.; Kesarla, M.K.; Torres-Torres, J.G.; Collins-Martínez, V.; Godavarthi, S. Fabrication of g-C3N4/TiO2 heterojunction composite for enhanced photocatalytic hydrogen production. Ceram. Int. 2020, 46, 38–45. [Google Scholar] [CrossRef]
  95. Cao, J.; Qin, C.; Wang, Y.; Zhang, H.; Sun, G.; Zhang, Z. Solid-state method synthesis of SnO2-decorated g-C3N4 nanocomposites with enhanced gas-sensing property to ethanol. Materials 2017, 10, 604. [Google Scholar] [CrossRef] [Green Version]
  96. Gong, S.; Jiang, Z.; Zhu, S.; Fan, J.; Xu, Q.; Min, Y. The synthesis of graphene-TiO2/g-C3N4 super-thin heterojunctions with enhanced visible-light photocatalytic activities. J. Nanoparticle Res. 2018, 20, 310. [Google Scholar] [CrossRef]
  97. Boonprakob, N.; Wetchakun, N.; Phanichphant, S.; Waxler, D.; Sherrell, P.; Nattestad, A.; Chen, J.; Inceesungvorn, B. Enhanced visible-light photocatalytic activity of g-C3N4/TiO2 films. J. Colloid Interface Sci. 2014, 417, 402–409. [Google Scholar] [CrossRef]
  98. Shen, L.; Xing, Z.; Zou, J.; Li, Z.; Wu, X.; Zhang, Y.; Zhu, Q.; Yang, S.; Zhou, W. Black TiO2 nanobelts/g-C3N4 nanosheets Laminated Heterojunctions with Efficient Visible-Light-Driven Photocatalytic Performance. Sci. Rep. 2017, 7, 41978. [Google Scholar] [CrossRef] [Green Version]
  99. Hutchings, G.J.; Davies, P.R.; Pattisson, S.; Davies, T.E.; Morgan, D.J.; Dlamini, M.W. Facile synthesis of a porous 3D g-C3N4 photocatalyst for the degradation of organics in shale gas brines. Catal. Commun. 2022, 169, 106480. [Google Scholar] [CrossRef]
  100. Kumar, A.; Kumar, P.; Joshi, C.; Manchanda, M.; Boukherroub, R.; Jain, S.L. Nickel decorated on phosphorous-doped carbon nitride as an efficient photocatalyst for reduction of nitrobenzenes. Nanomaterials 2016, 6, 59. [Google Scholar] [CrossRef]
  101. Chen, J.; Zhang, Y.; Wu, B.; Ning, Z.; Song, M.; Zhang, H.; Sun, X.; Wan, D.; Li, B. Porous g-C3N4 with defects for the efficient dye photodegradation under visible light. Water Sci. Technol. 2021, 84, 1354–1365. [Google Scholar] [CrossRef]
  102. Landi, S.; Segundo, I.R.; Freitas, E.; Vasilevskiy, M.; Carneiro, J.; Tavares, C.J. Use and misuse of the Kubelka-Munk function to obtain the band gap energy from diffuse reflectance measurements. Solid State Commun. 2022, 341, 114573. [Google Scholar] [CrossRef]
  103. Giannakopoulou, T.; Papailias, I.; Todorova, N.; Boukos, N.; Liu, Y.; Yu, J.; Trapalis, C. Tailoring the energy band gap and edges’ potentials of g-C3N4/TiO2 composite photocatalysts for NOx removal. Chem. Eng. J. 2017, 310, 571–580. [Google Scholar] [CrossRef]
  104. Abdel-Moniem, S.M.; El-Liethy, M.A.; Ibrahim, H.S.; Ali, M.E.M. Innovative green/non-toxic Bi2S3@g-C3N4 nanosheets for dark antimicrobial activity and photocatalytic depollution: Turnover assessment. Ecotoxicol. Environ. Saf. 2021, 226, 112808. [Google Scholar] [CrossRef]
  105. Dong, F.; Zhao, Z.; Xiong, T.; Ni, Z.; Zhang, W.; Sun, Y.; Ho, W.-K. In Situ Construction of g-C3N4/g-C3N4 Metal-Free Heterojunction for Enhanced Visible-Light Photocatalysis. ACS Appl. Mater. Interfaces 2013, 5, 11392–11401. [Google Scholar] [CrossRef] [PubMed]
  106. Pattnaik, S.P.; Behera, A.; Martha, S.; Acharya, R.; Parida, K. Facile synthesis of exfoliated graphitic carbon nitride for photocatalytic degradation of ciprofloxacin under solar irradiation. J. Mater. Sci. 2019, 54, 5726–5742. [Google Scholar] [CrossRef]
  107. Jia, T.; Li, J.; Long, F.; Fu, F.; Zhao, J.; Deng, Z.; Wang, X.; Zhang, Y. Ultrathin g-C3N4 nanosheet-modified biocl hierarchical flower-like plate heterostructure with enhanced photostability and photocatalytic performance. Crystals 2017, 7, 266. [Google Scholar] [CrossRef] [Green Version]
  108. Das, D.; Shinde, S.L.; Nanda, K.K. Temperature-Dependent Photoluminescence of g-C3N4: Implication for Temperature Sensing. ACS Appl. Mater. Interfaces 2016, 8, 2181–2186. [Google Scholar] [CrossRef] [PubMed]
  109. Yuan, Y.; Zhang, L.; Xing, J.; Utama, M.I.B.; Lu, X.; Du, K.; Li, Y.; Hu, X.; Wang, S.; Genç, A.; et al. High-yield synthesis and optical properties of g-C3N4. Nanoscale 2015, 7, 12343–12350. [Google Scholar] [CrossRef] [PubMed] [Green Version]
  110. Fu, M.; Liao, J.; Dong, F.; Li, H.; Liu, H. Growth of g-C3N4 layer on commercial TiO2 for enhanced visible light photocatalytic activity. J. Nanomater. 2014, 2014, 86909. [Google Scholar] [CrossRef] [Green Version]
  111. Lin, T.H.; Chang, Y.H.; Chiang, K.P.; Wang, J.C.; Wu, M.C. Nanoscale Multidimensional Pd/TiO2/g-C3N4 Catalyst for Efficient Solar-Driven Photocatalytic Hydrogen Production. Catalysts 2021, 11, 59. [Google Scholar] [CrossRef]
  112. Farahani, N.; Kelly, P.J.; West, G.; Ratova, M.; Hill, C.; Vishnyakov, V. An investigation into W or Nb or ZnFe2O4 Doped Titania nanocomposites deposited from Blended powder targets for UV/Visible photocatalysis. Coatings 2013, 3, 153–165. [Google Scholar] [CrossRef] [Green Version]
  113. Ling, Y.; Wang, G.; Chen, T.; Fei, X.; Hu, S.; Shan, Q.; Hei, D.; Feng, H.; Jia, W. Irradiation-catalysed degradation of methyl orange using BaF2–TiO2 nanocomposite catalysts prepared by a sol–gel method. R. Soc. Open Sci. 2019, 6, 191156. [Google Scholar] [CrossRef] [Green Version]
  114. Hassan, F.; Bonnet, P.; Dangwang Dikdim, J.M.; Gatcha Bandjoun, N.; Caperaa, C.; Dalhatou, S.; Kane, A.; Zeghioud, H. Synthesis and Investigation of TiO2/g-C3N4 Performance for Photocatalytic Degradation of Bromophenol Blue and Eriochrome Black T: Experimental Design Optimization and Reactive Oxygen Species Contribution. Water 2022, 14, 3331. [Google Scholar] [CrossRef]
  115. Zhang, T.; Souza, I.P.A.F.; Xu, J.; Almeida, V.C.; Asefa, T. Mesoporous Graphitic Carbon Nitrides Decorated with Cu Nanoparticles: Efficient Photocatalysts for Degradation of Tartrazine Yellow Dye. Nanomaterials 2018, 8, 636. [Google Scholar] [CrossRef] [Green Version]
  116. Guo, Y.; Li, H.; Chen, J.; Wu, X.; Zhou, L. TiO2 mesocrystals built of nanocrystals with exposed {001} facets: Facile synthesis and superior photocatalytic ability. J. Mater. Chem. A 2014, 2, 19589–19593. [Google Scholar] [CrossRef]
  117. Pan, F.; Wu, K.; Li, H.; Xu, G.; Chen, W. Synthesis of {100} Facet Dominant Anatase TiO2 Nanobelts and the Origin of Facet-Dependent Photoreactivity. Chem. —A Eur. J. 2014, 20, 15095–15101. [Google Scholar] [CrossRef]
  118. Xu, H.; Ouyang, S.; Li, P.; Kako, T.; Ye, J. High-active anatase TiO2 nanosheets exposed with 95% {100} facets toward efficient H2 evolution and CO2 photoreduction. ACS Appl. Mater. Interfaces 2013, 5, 1348–1354. [Google Scholar] [CrossRef]
  119. Zerjav, G.; Zizek, K.; Zavasnik, J.; Pintar, A. Brookite vs. rutile vs. anatase: What’s behind their various photocatalytic activities? J. Environ. Chem. Eng. 2022, 10, 107722. [Google Scholar] [CrossRef]
  120. Luttrell, T.; Halpegamage, S.; Tao, J.; Kramer, A.; Sutter, E.; Batzill, M. Why is anatase a better photocatalyst than rutile?—Model studies on epitaxial TiO2 films. Sci. Rep. 2014, 4, 4043. [Google Scholar] [CrossRef] [Green Version]
  121. Zhang, J.; Zhou, P.; Liu, J.; Yu, J. New understanding of the difference of photocatalytic activity among anatase, rutile and brookite TiO2. Phys. Chem. Chem. Phys. 2014, 16, 20382–20386. [Google Scholar] [CrossRef]
  122. Lin, P.; Hu, H.; Lv, H.; Ding, Z.; Xu, L.; Qian, D.; Wang, P.; Pan, J.; Li, C.; Cui, C. Hybrid reduced graphene oxide/TiO2/graphitic carbon nitride composites with improved photocatalytic activity for organic pollutant degradation. Appl. Phys. A Mater. Sci. Process. 2018, 124, 510. [Google Scholar] [CrossRef]
  123. Kobkeatthawin, T.; Trakulmututa, J.; Amornsakchai, T.; Kajitvichyanukul, P.; Smith, S.M. Identification of Active Species in Photodegradation of Aqueous Imidacloprid over g-C3N4/TiO2 Nanocomposites. Catalysts 2022, 12, 120. [Google Scholar] [CrossRef]
  124. Li, W.; Li, D.; Lin, Y.; Wang, P.; Chen, W.; Fu, X.; Shao, Y. Evidence for the active species involved in the photodegradation process of methyl Orange on TiO2. J. Phys. Chem. C 2012, 116, 3552–3560. [Google Scholar] [CrossRef]
  125. Mahalakshmi, G.; Rajeswari, M.; Ponnarasi, P. Synthesis of few-layer g-C3N4 nanosheets-coated MoS2/TiO2 heterojunction photocatalysts for photo-degradation of methyl orange (MO) and 4-nitrophenol (4-NP) pollutants. Inorg. Chem. Commun. 2020, 120, 108146. [Google Scholar] [CrossRef]
  126. Jiang, D.; Li, J.; Xing, C.; Zhang, Z.; Meng, S.; Chen, M. Two-Dimensional CaIn2S4/g-C3N4 Heterojunction Nanocomposite with Enhanced Visible-Light Photocatalytic Activities: Interfacial Engineering and Mechanism Insight. ACS Appl. Mater. Interfaces 2015, 7, 19234–19242. [Google Scholar] [CrossRef]
  127. Hong, S.J.; Lee, S.; Jang, J.S.; Lee, J.S. Heterojunction BiVO4/WO3 electrodes for enhanced photoactivity of water oxidation. Energy Environ. Sci. 2011, 4, 1781–1787. [Google Scholar] [CrossRef] [Green Version]
  128. Hankin, A.; Bedoya-Lora, F.E.; Alexander, J.C.; Regoutz, A.; Kelsall, G.H. Flat band potential determination: Avoiding the pitfalls. J. Mater. Chem. A 2019, 7, 26162–26176. [Google Scholar] [CrossRef] [Green Version]
  129. Drisya, K.T.; Solís-López, M.; Ríos-Ramírez, J.J.; Durán-Álvarez, J.C.; Rousseau, A.; Velumani, S.; Asomoza, R.; Kassiba, A.; Jantrania, A.; Castaneda, H. Electronic and optical competence of TiO2/BiVO4 nanocomposites in the photocatalytic processes. Sci. Rep. 2020, 10, 13507. [Google Scholar] [CrossRef] [PubMed]
  130. Jing, J.; Chen, Z.; Feng, C.; Sun, M.; Hou, J. Transforming g-C3N4 from amphoteric to n-type semiconductor: The important role of p/n type on photoelectrochemical cathodic protection. J. Alloy. Compd. 2021, 851, 156820. [Google Scholar] [CrossRef]
  131. Nunes, D.; Fragoso, A.R.; Freire, T.; Matias, M.; Marques, A.C.; Martins, R.; Fortunato, E.; Pimentel, A. Ultrafast Microwave Synthesis of WO3 Nanostructured Films for Solar Photocatalysis. Phys. Status Solidi (RRL)—Rapid Res. Lett. 2021, 15, 2100196. [Google Scholar] [CrossRef]
  132. Naeem, R.; Ehsan, M.A.; Rehman, A.; Yamani, Z.H.; Hakeem, A.S.; Mazhar, M. Single step aerosol assisted chemical vapor deposition of p-n Sn(II) oxide-Ti(IV) oxide nanocomposite thin film electrodes for investigation of photoelectrochemical properties. New J. Chem. 2018, 42, 5256–5266. [Google Scholar] [CrossRef]
  133. Ismael, M.; Wu, Y. A facile synthesis method for fabrication of LaFeO3/g-C3N4 nanocomposite as efficient visible-light-driven photocatalyst for photodegradation of RhB and 4-CP. New J. Chem. 2019, 43, 13783–13793. [Google Scholar] [CrossRef]
  134. Tang, Y.; Huang, J.; Jiang, M.; Yu, J.; Wang, Q.; Zhao, J.; Li, J.; Yu, X.; Zhao, J. Photo-induced synthesis of nanostructured Pt-on-Au/g-C3N4 composites for visible light photocatalytic hydrogen production. J. Mater. Sci. 2020, 55, 15574–15587. [Google Scholar] [CrossRef]
  135. Beranek, R. (Photo)electrochemical methods for the determination of the band edge positions of TiO2-based nanomaterials. Adv. Phys. Chem. 2011, 2011, 786759. [Google Scholar] [CrossRef] [Green Version]
  136. Jo, W.K.; Natarajan, T.S. Influence of TiO2 morphology on the photocatalytic efficiency of direct Z-scheme g-C3N4/TiO2 photocatalysts for isoniazid degradation. Chem. Eng. J. 2015, 281, 549–565. [Google Scholar] [CrossRef]
  137. Gao, Y.; Duan, J.; Zhai, X.; Guan, F.; Wang, X.; Zhang, J.; Hou, B. Photocatalytic degradation and antibacterial properties of Fe3+-doped alkalized carbon nitride. Nanomaterials 2020, 10, 1751. [Google Scholar] [CrossRef]
  138. Yu, J.; Wang, S.; Low, J.; Xiao, W. Enhanced photocatalytic performance of direct Z-scheme g-C3N4-TiO2 photocatalysts for the decomposition of formaldehyde in air. Phys. Chem. Chem. Phys. 2013, 15, 16883–16890. [Google Scholar] [CrossRef]
  139. Liu, M.; Wei, S.; Chen, W.; Gao, L.; Li, X.; Mao, L.; Dang, H. Construction of direct Z-scheme g-C3N4/TiO2 nanorod composites for promoting photocatalytic activity. J. Chin. Chem. Soc. 2019, 67, 246–252. [Google Scholar] [CrossRef]
  140. Sewnet, A.; Abebe, M.; Asaithambi, P.; Alemayehu, E. Visible-Light-Driven g-C3N4/TiO2 Based Heterojunction Nanocomposites for Photocatalytic Degradation of Organic Dyes in Wastewater: A Review. Air Soil Water Res. 2022, 15, 1–23. [Google Scholar] [CrossRef]
  141. Naveed, A.B.; Javaid, A.; Zia, A.; Ishaq, M.T.; Amin, M.; Farooqi, Z.U.R.; Mahmood, A. TiO2/g-C3N4 Binary Composite as an Efficient Photocatalyst for Biodiesel Production from Jatropha Oil and Dye Degradation. ACS Omega 2022, 8, 2173–2182. [Google Scholar] [CrossRef]
Figure 1. Schematic diagram for the microwave synthesis of g-C3N4/TiO2 heterostructures. The schematic in the orange box represents the first steps for the synthesis of g-C3N4/TiO2 heterostructures, while the schematic in the green box represents the last steps for the synthesis of g-C3N4/TiO2 heterostructures.
Nanomaterials 13 01090 g001
Figure 2. XRD diffractograms of the pure TiO2, pure g-C3N4 and heterostructures composed of TiO2 with different weight loading percentages of g-C3N4 (15-GCN-T, 30-GCN-T and 45-GCN-T). The simulated brookite, rutile and anatase TiO2 are also shown for comparison. Orange arrows indicate the diffraction maximum at 27º likely associated with the presence of graphitic carbon nitride.
Nanomaterials 13 01090 g002
Figure 3. SEM images of the produced materials (a) TiO2, (c) g-C3N4, (e) 15-GCN-T, (g) 30-GCT and (i) 45-GCN-T. The respective high-magnification SEM images are shown in (b,d,f,h,j). (b) also displays an amplified SEM image of a hollow TiO2 sphere.
Nanomaterials 13 01090 g003
Figure 4. (a) Secondary electron (SE) STEM image of the 30-GCN-T material, (b) Bright-field (BF) STEM image of the same area of (a), (c) HAADF-STEM image of the area in (a,d) Bright-field TEM image of the area in (a). The insets in (d) depict the electron diffraction pattern of TiO2 nanoparticles with the anatase phase and the particle size distribution of the TiO2 nanoparticles measured by TEM analyses. (e,f) Magnified SE-STEM and HAADF-STEM images of the area analyzed in (a), respectively. (g) SE-STEM and (h) HAADF-STEM image of a TiO2 nanocrystal attached to the g-C3N4 sheet, and (i) atomic-resolution HAADF-STEM image of the area in (g,h), where the interface between the TiO2 nanocrystal and the g-C3N4 sheet is clear. The inset in (i) shows the FFT image of the area indicated as A (white square).
Nanomaterials 13 01090 g004
Figure 5. (a,b) Atomic-resolution HAADF-STEM images of two distinct TiO2 nanocrystals. The insets in (a,b) show the FFT images of areas indicated as B and C, respectively (black squares).
Nanomaterials 13 01090 g005
Figure 6. Artificially colored (mixed) SE-STEM image of the 30-GCN-T material (a), together with the corresponding EDS maps of C (b), N (c), O (d) and Ti (e).
Nanomaterials 13 01090 g006
Figure 7. (a) AFM image of a g-C3N4 nanosheet and (b) corresponding average height values measured between the red lines.
Nanomaterials 13 01090 g007
Figure 8. (a) XPS survey spectra of TiO2, g-C3N4 and 30-GCN-T materials. (b) Deconvolution of XPS C 1s of TiO2, g-C3N4 and 30-GCN-T spectra. (c) Deconvolution of XPS O 1s spectra of TiO2, g-C3N4 and 30-GCN-T. (d) XPS Ti 2p spectra of TiO2 and 30-GCN-T. (e) Deconvolution of XPS N 1s spectra of g-C3N4 and 30-GCN-T.
Nanomaterials 13 01090 g008
Figure 9. (a) RT absorption spectra of TiO2, g-C3N4 and 30-GCN-T nanopowders. The inset shows the Kubelka–Munk plots (from DRS spectra of TiO2 and g-C3N4 nanopowders). For the determination of the optical band gap values, TiO2 and g-C3N4 materials were considered as indirect band gap semiconductors. (b) RT PL spectra of TiO2, g-C3N4 and 30-GCN-T nanostructures from 400 to 600 nm using an excitation wavelength of 350 nm. The inset shows the RT PL spectra (normalized intensity as a function of the wavelength from 428 to 470 nm) of g-C3N4 and 30-GCN-T nanostructures.
Nanomaterials 13 01090 g009
Figure 10. (a) Degradation curves (C/C0 as a function of the exposure time) under solar simulating light up to 4 h without photocatalyst (photolysis) and for TiO2, g-C3N4, 15-GCN-T, 30-GCN-T,45-GCN-T photocatalysts. The lines are for eye guidance only. (b) Pseudo-first-order kinetics for MO degradation in the presence of TiO2, g-C3N4, 15-GCN-T, 30-GCN-T and 45-GCN-T photocatalysts. The lines represent the linear fittings of the pseudo-first-order kinetics equation.
Nanomaterials 13 01090 g010
Figure 11. (a) MO degradation curves (C/C0 as a function of the exposure time) in the presence of 30-GCN-T heterostructures up to 4 h under five consecutive cycles. The lines are for eye guidance only. (b) Comparison of the degradation rates of MO under solar simulating light using the 30-GCN-T heterostructure with no scavengers (NS) and 5 mL of water, and in the presence of trapping reagents (EDTA, BQ and IPA).
Nanomaterials 13 01090 g011
Figure 12. Mott–Schottky analyses performed at 1 kHz in 0.5 M Na2SO4 electrolyte for TiO2 and g-C3N4. The potentials were measured against the Ag/AgCl reference. The flat band potentials (Efb) can be estimated from the linear portion of the graphs, represented in black and red lines, respectively, for TiO2 and g-C3N4.
Nanomaterials 13 01090 g012
Figure 13. Illustrated mechanism of the photocatalytic activity of the 30-GCN-T heterostructure under solar simulating light. The potentials (V) relative to NHE scale are also represented. Black and red dashed lines correspond to the CB/VB potentials of TiO2 and g-C3N4, respectively. Purple dot lines are related to the redox potentials of the common reactive species in photocatalysis. (a) represents a possible Z-scheme photocatalytic degradation mechanism of the 30-GCN-T heterostructure, and (b) represents a possible type-II photocatalytic degradation mechanism of the 30-GCN-T heterostructure.
Nanomaterials 13 01090 g013
Table 1. Summary of g-C3N4/TiO2 nanostructures reported in the literature for the degradation of MO using different preparation methods.
MaterialPreparation MethodLight SourceMO ConcentrationOptimum LoadingDegradation Efficiency (%)Kinetic Constant (min−1)Reference
g-C3N4/seed
grown
mesoporous
TiO2
Seed induced solvothermal
(MW: 105 °C/48 h)
Visible light10 mg/LTi:g-C3N4
(1 molar ratio)
Around 100% MO degradation in 60 min
(pH = 3)
0.1014[61]
g-C3N4/TiO2 (brookite)Calcination
(400 °C/1 h)
Visible light10 mg/Lg-C3N4:TiO2
(35% weight ratio)
55% MO degradation in 180 minNo data[62]
g-C3N4/TiO2 nanotube arrayAnodic oxidation method/ultrasonic loadingXe lamp irradiation (intensity 100 mW/cm2)15 mg/LNo data84.6% MO degradation in 120 minNo data[63]
g-C3N4 nanosheets/mesoporous TiO2Hydrothermal synthesis
(MW: 180 °C/6 h)
300 W Xe lamp irradiation with a cut-off filter (λ > 420 nm)32.7 mg/L (100 μM)g-C3N4:TiO2 (2:1 weight ratio)Around 60% MO degradation in 300 min (pH = 3)No data[64]
g-C3N4 nanosheets/TiO2 nanoflakes in situ sol-gel
(400 °C/3 h)
UV-VIS light20 mg/Lg-C3N4:TiO2 (1:4 weight ratio)97% MO degradation in 80 min 0.0718[21]
Table 2. Pseudo-first-order kinetic parameters (rate constants and linear regression coefficients) for the photocatalytic degradation of MO under solar simulating light in 4 h by TiO2, g-C3N4, 15-GCN-T, 30-GCN-T and 45-GCN-T nanostructures.
Nanostructures k a p   ( min 1 ) R2
TiO20.00360.99
g-C3N40.00070.95
15-GCN-T0.00530.97
30-GCN-T0.00710.99
45-GCN-T0.00620.98
Disclaimer/Publisher’s Note: The statements, opinions and data contained in all publications are solely those of the individual author(s) and contributor(s) and not of MDPI and/or the editor(s). MDPI and/or the editor(s) disclaim responsibility for any injury to people or property resulting from any ideas, methods, instructions or products referred to in the content.

