Abstract
Compared to the widely used compound semiconductor photoelectric sensors, all-silicon photoelectric sensors have the advantage of easy mass production because they are compatible with the complementary metal-oxide-semiconductor (CMOS) fabrication technique. In this paper, we propose an all-silicon photoelectric biosensor with a simple process and that is integrated, miniature, and with low loss. This biosensor is based on monolithic integration technology, and its light source is a PN junction cascaded polysilicon nanostructure. The detection device utilizes a simple refractive index sensing method. According to our simulation, when the refractive index of the detected material is more than 1.52, evanescent wave intensity decreases with the growth of the refractive index. Thus, refractive index sensing can be achieved. Moreover, it was also shown that, compared to a slab waveguide, the embedded waveguide designed in this paper has a lower loss. With these features, our all-silicon photoelectric biosensor (ASPB) demonstrates its potential in the application of handheld biosensors.
1. Introduction
Optical sensors [1] and carrier-based sensors [2,3] have been studied extensively as media for humans to perceive things around them. Since the 1980s, scientists have explored light-based biosensors as a medium for human perception [4]. As one of the major branches of biosensors, photoelectric biosensors are essential for many application areas, such as medical diagnosis, agricultural ecology, environmental security, etc. [5,6,7,8]. They are used to detect various parameters, such as water and sun radiation. They have different sensing mechanisms, which are a refractive index, absorption, and fluorescence sensing [9,10,11]. A photoelectric biosensor can detect light quantity variation, such as the substance’s type, composition, and concentration. The photoelectric biosensor has a high detection sensitivity, simple operation, and low loss, and can be applied to real-time detection and monitor the dynamic process of biological reactions. However, at the moment, the photoelectric biosensors’ mobility, complexity, accuracy, and response time are insufficient to satisfy high-demand events accurately.
Therefore, researchers are committed to finding optoelectronic integrated biosensors with low loss, a fast response speed, miniature size, simple repeatability, and low cost [12,13,14,15,16,17,18]. In 2015, Chaudhuri et al. [19] conducted in-depth research regarding sensor miniaturization and designed a chip-sensing platform with heterogeneous integration on a silicon substrate. In 2017, Okhai et al. [14] studied biodetection waveguide technology and realized the micro-electro-optical biosensor on a chip. The advent of on-chip technology has brought small sizes and high integration. Due to extensive research, the performance of the light source [20], optical waveguide (OW) [21,22], and photodetector [23,24,25,26,27] of the on-chip microsystem have been significantly improved now.
Most light sources nowadays use III-V compound semiconductor light sources, such as gallium arsenide (GaAs) and indium phosphide (InP), which have high luminous efficiency. Nevertheless, they are not monolithic, and their growing process is complicated, which makes them expensive. On the other hand, silicon has dominated the semiconductor industry for years because its manufacturing process is mature and cost-effective. Thus, if silicon can be used to form the light sources, the cost of the devices will become much lower.
Si3N4 can be used to form the OW in a silicon-based optical system. In the visible band, Si3N4 is a medium refractive index material and compatible with the CMOS fabrication process. In addition, Si3N4 has a good chemical inertia [28], thermal stability, and low loss [29]. This makes Si3N4 a good candidate to serve as the OW in an on-chip sensor. In this paper, we developed an ASPB with monolithic integration technology, a simple process, miniature size, and low loss.
2. System Design and Device Structure
Figure 1 illustrates the sketch of the developed ASPB, which included silicon-based avalanche light-emitting devices, OWs, silicon-based detectors, signal amplification, and processing circuits.

Figure 1.
In ASPB, the light generated by the silicon-based avalanche light-emitting device was transmitted to the OW and coupled with the material to be detected, resulting in light attenuation. Then, the attenuated light was detected by the silicon-based detector and converted into an electrical signal. Finally, the sensing results were output by the processing circuit.
The luminous efficiency of the light source plays a decisive role in the performance of the whole ASPB. The structure of the PN junction cascade light source adopted in this paper is illustrated in Figure 2. The polysilicon light source comprised a monocrystalline silicon substrate layer, a silicon dioxide insulation layer, a polysilicon layer, and a silicon dioxide layer (from bottom to top). A 670 μm thick monocrystalline silicon layer was used as the substrate, and a 600 nm thick silicon dioxide layer was placed above it to isolate and support the monocrystalline substrate from the polysilicon layers. The polycrystalline silicon layer deposited on the silicon dioxide insulation layer had a thickness of 540 nm and served as the emitting region of the light source. Finally, the silicon dioxide layer deposited on the polysilicon had a thickness of 520 nm, preventing the polysilicon from oxidizing. The topmost silicon dioxide layer was etched at both ends, and metallic aluminum was deposited as the electrode. The polycrystalline silicon region had a 22.3 μm N+ region, an 11.3 μm P region, a 10.2 μm N+ region, an 11.4 μm P region, and a 23.4 μm N+ region (from left to right). The structure of the light source was symmetrical, so both ends of the electrode could be arbitrarily connected to the positive or negative poles of the power supply. Since silicon has the disadvantage of an indirect band gap, its radiation recombination efficiency is low. Therefore, carrier injection technology was adopted, and we used a mask plate to inject boron (with an injection energy of 60 keV) and phosphorus (with an injection energy of 100 keV) into the designated area, followed by annealing at 950 °C for 36 min to obtain P-type silicon and N-type silicon. The concentration of the P zone was 1.85 × 1017 cm−3, and the concentration of the N+ zone was 1.58 × 1020 cm−3. The polysilicon layer had four PN junctions in series, including two forward bias junctions and two reverse bias junctions, to improve the luminescence intensity. The doping concentration in the P region was much lower than that in the N+ region, where the electric field increased as the depletion region extended into the next N+ region. This configuration enhanced the avalanche multiplier effect in the low doping P region. The number of carriers decreased sharply in the first reverse bias junction due to the radiation recombination. This concentration increased in the following forward bias junction, and the recombination occurred again in the subsequent reverse bias junction.

Figure 2.
The structure of the polysilicon light source.
Figure 3 presents the propagation path of light in the OW structure, which enters the core layer at an incident angle θ2 and a refraction angle θ1. After entering the OW, the light experiences total reflection in the core layer, according to Snell’s Law (1):
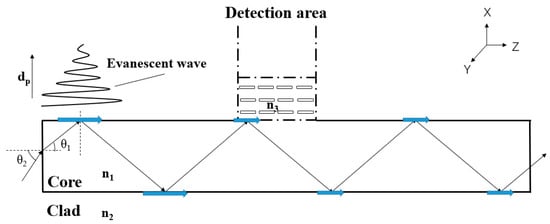
Figure 3.
The light path in the OW.
In order to allow light to propagate in the OW with total reflection, the maximum θ1 is 43.82°, and the maximum θ2 is 73.67°.
When light is transmitted with total reflection in the core layer, the incident point and the reflection point are not at the same position, but are separated by several wavelengths, called the Goose–Hansen displacement [30]. This light wave, which flows along the cladding surface, is called an evanescent wave [31].
The amplitude of an evanescent wave is perpendicular to the interface direction and exhibits an exponential attenuation trend, which can be expressed as:
where E0 is the amplitude of the incident field, x is the distance between the light wave and the interface, and dp is the transmission depth, which is determined by Formula (3):
where k0 is the wave number, and θ is the incident angle.
The intensity of the evanescent wave decreases exponentially with the increase in the distance from the interface, so the evanescent wave exists only on the reflected surface. The scattering caused by the mode mismatch between the OW and the detecting material leads to light attenuation. In the detection area, the refractive index of the material to be detected should be at least greater than the clad layer.
The OW structure transmission efficiency is crucial to achieving highly efficient light transmission. Since Si3N4 is a composite material with good radiation and heat stability, it shows great potential in addressing the limitations of silicon-based OWs, such as optical modulation and highly sensitive and low-loss sensors, and it is compatible with the CMOS process. In addition, Si3N4 is not affected by near-infrared nonlinear loss, because of its large bandwidth and high thermal damage threshold. In this paper, silicon dioxide and Si3N4 were combined to explore a new OW transmission structure. On the one hand, silicon dioxide acts as a cladding to confine light in the core layer. It also acts as an insulating layer between the Si3N4 and the silicon substrate. In addition, we used a strip-based OW structure in this paper, which is more suitable for the geometry of the semiconductor platform, to reduce the process difficulty. The OW structure is shown in Figure 4, with silicon dioxide as the cladding and Si3N4 as the core. The detection area was located in the middle of the OW. The large size of the core layer facilitated the light to enter the OW more easily, but the sensitivity of an ASPB increases with the reduction of the cross-sectional area of the OW [32]. Therefore, the size of the cross-sectional area required a proper trade-off. The OW structure comprised two parts. Si3N4 was covered between the material to be detected and silicon dioxide in the detection area, and the rest of the area was fully covered with silicon dioxide. It is worth noting that the detection structure designed in this paper was embedded in the core of the OW, which promoted the interaction between light and the material to be detected. Moreover, this kind of OW is called an embedded OW.
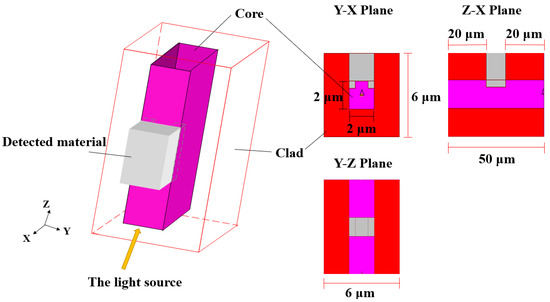
Figure 4.
The structure of the embedded OW.
In addition, the detector structure used in this work was silicon-based. This type of detector has a mature process and can be well compatible with the light source and the OW.
3. Results and Discussion
Figure 5 depicts the luminous lines. Figure 6 illustrates the electroluminescence spectra of the polycrystalline silicon cascade light source under a 20 V driving voltage and 20 mA driving current, which provided the conditions to simulate the OW propagation of this paper. In this condition, the light in the 400–900 nm wavelength range is stronger. Figure 6 highlights the presence of five peaks at wavelengths of 550 nm, 580 nm, 620 nm, 680 nm, and 770 nm. According to our analysis, the peak values at 2.26 eV and 2.14 eV may be due to direct band-to-band transitions between high-field carrier clusters. Defects introduced by carrier injection technology during the preparation phase could be the source of the 2 eV peak. The peak at 1.83 eV may be related to the indirect radiation recombination between the conduction band and the valence band, and the peak at 1.61 eV may be related to the transmission spectrum of the polysilicon layer [33].
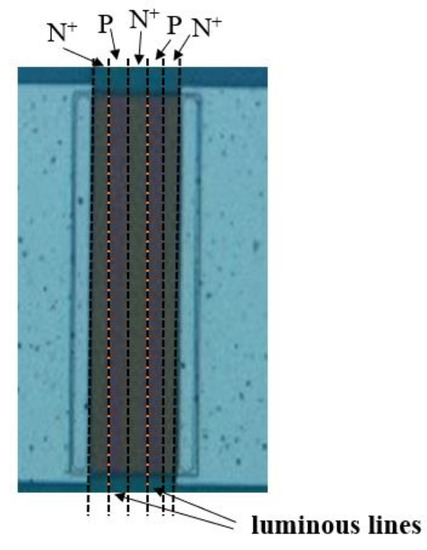
Figure 5.
Micrograph of the light source under experimental conditions.
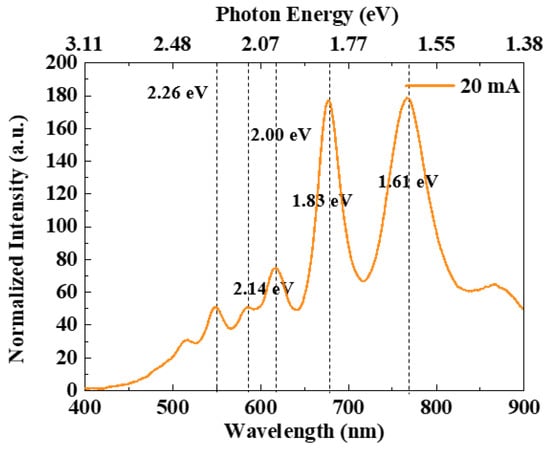
Figure 6.
Electroluminescence spectra of the light source.
Quantum efficiency is the ratio of the number of photons to the number of electrons emitted, directly affecting the light source’s brightness. The quantum efficiency ηQ is calculated as follows:
where Popt is the optical power, h is the Planck constant, υ is the photon frequency, and I is the driving current. Under the experimental conditions, the total luminous power was 2.154 μW, and the quantum efficiency ηQ = 5.78 × 10⁻⁵.
In addition, photoelectric conversion efficiency represents energy utilization. When the driver voltage is constant, the photoelectric conversion efficiency of the light source is proportional to the quantum efficiency. The calculation formula for photoelectric conversion efficiency is:
where U is the driving voltage. The photoelectric conversion efficiency was 5.4 × 10⁻⁶. Table 1 compares the numerical results of various silicon-based light sources, revealing that the cascade light source had higher ηQ and ηw.

Table 1.
Comparison of properties of several silicon-based light sources.
In order to simplify the model, the light source with a wavelength of 680 nm was used in the simulation of the waveguide, and it was incident at an angle of 30° into the core layer of the OW. The simulation results demonstrated that the energy efficiency of the embedded OW can reach 95.7% (the loss was 0.19 dB). Under this condition, the refractive index of Si3N4 and silicon dioxide was n1 = 2.018 and n2 = 1.456. The relative refractive index difference between the cladding and the core was 23.97%, and a small refractive index difference could significantly reduce the multimode dispersion. Although some light energy escaped from the core layer in the form of evanescent waves, the majority of light energy was transmitted through the core layer.
Transmission loss (TL) is a highlight of this work, calculated by:
where Pin is the power of the incident light wave in OW, and Pout is the power at the end of OW.
This paper used the finite-difference time-domain beam propagation method (FD-BPM) of the BeamPROW module during the simulations. The OW length was 50 μm, and the detection region was between 20 and 30 μm (Figure 4).
In order to verify the feasibility of the embedded OW model, this work simulated the change in the light energy at the end of the OW through varying refractive indexes of the materials, which ranged from 1.33 to 1.83. Figure 7a–f illustrates the energy distribution in the core of the embedded OW when the detected materials had refractive indexes, respectively, of 1.33, 1.43, 1.53, 1.63, 1.73, and 1.83. In the X-Z plane, on the side where the detecting material was located (i.e., on the right side of the core layer), energy loss increased with the increasing refractive index when the refractive index of the detected material was greater than that of the cladding. However, it is worth noting that there was a clear correlation between energy dissipation and refractive index variation on the left side of the waveguide core layer when the refractive index of the detected material ranged from 1.63 to 1.83. This may be because the refractive index variation in the detection region caused a slight change in the angle of light propagation in the core layer, leading to the escape of energy from the left side of the core layer, and thus having higher sensitivity. Typically, loss increases with an increasing refractive index.
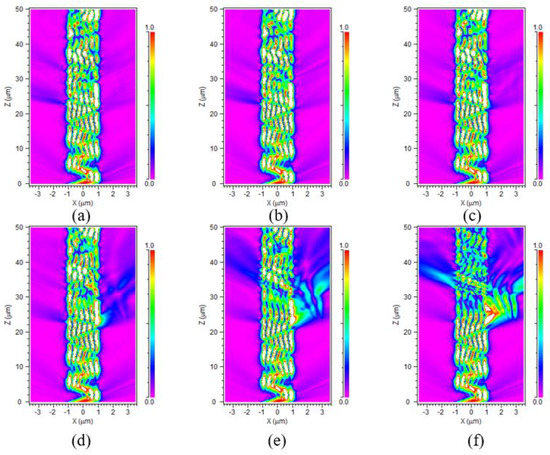
Figure 7.
The light distribution of the OW when (a) n = 1.33, (b) n = 1.43, (c) n = 1.53, (d) n = 1.63, (e) n = 1.73, and (f) n = 1.83. n is the refractive index of the detected material.
In Figure 8, the attenuation amplitude has almost no difference within the refractive index range of 1.33–1.53. For one thing, the refractive index of the detected material was smaller than that of the clad layer, so it was more difficult for light to spill out to the detected material. For another, it may be due to light scattering. The attenuation trend is obvious in the refractive index range of 1.63–1.83. Moreover, as the refractive index increased, the light energy loss was greater after a length of 20 μm, and the energy of the core layer decreased significantly. Furthermore, the core energy decreased faster as the refractive index increased.
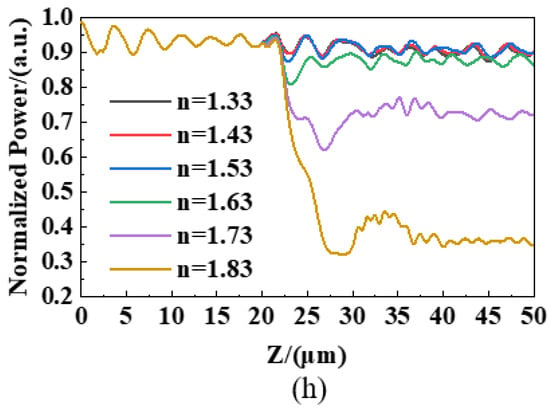
Figure 8.
The dependence of the normalized output power of the embedded OW on refractive indexes of the detected material.
Compared to the conventional slab structure, the embedded OW structure designed in this paper had a lower detection loss. Specifically, we analyzed the energy distribution at the end of the waveguide for two types of structures with different refractive index materials and took the refractive index change gradient as 0.01. The normalized power of the two structures is depicted in Figure 9. The energy attenuation is obvious when it ranges between 1.61 and 1.67, and the light energy decreases from 87.5% to 84.5% in the embedded OW. This is because some light was transmitted into the detected material and dissipated. When the refractive index ranged from 1.68 to 1.83, the OW core energy decreased rapidly, and the light power decreased from 83.5% to 34.3%. When the refractive index exceeded 1.83, the energy loss was excessive, and it was difficult for the photodetector to identify the optical signal accurately. At the same time, the transmission loss of the embedded OW was smaller than that of the strip OW when the refractive index was greater than 1.61. For subsequent photodetectors, the lower the transmission loss in the OW, the more accurate the identification of optical signals. This work calculated that when the refractive index range was 1.61–1.67, the power decreased by 1.1%/0.01 RIU. When the refractive index range was 1.68–1.83, the energy decreased by 3.29%/0.01 RIU.
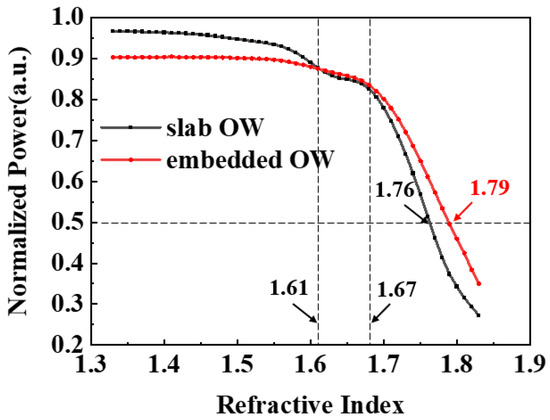
Figure 9.
The comparison with the transmission loss of the embedded OW and that of the slab OW.
To confirm the accuracy of the ASPB, we simulated the light of the four other peak wavelengths of the PN junction cascade light source spectrum as the incident light source under the same experimental conditions. The relationship between the power at the end of the waveguide and the refractive index is illustrated in Figure 10a, revealing that the variation trend of these curves is consistent with those of a 680 nm wavelength light source. Further details are reported in Table 2, highlighting that the detection characteristics of the ASPB are consistent with the rules presented in the previous analysis. In addition, for the optical transmission characteristics of the ASPB, the average power value of all peaks in the light source spectrum represents the performance of the ASPB. When the refractive index of the detected material exceeded 1.52, the energy decreased with the increase of the refractive index, showing monotonicity. Figure 10b infers that when the refractive index increases, the energy attenuation trend increases, and the sensitivities of different ranges were calculated as shown in Table 3. The simulation results highlighted that the ASPB could detect some organic solvents in the laboratory, such as chlorobenzene, nitrobenzene, and bromobenzene. A detailed comparison of the ASPB with other types of sensors is presented in Table 4. Although the sensitivity of the ASPB was not outstanding, its monolithic integrated characteristic is worth further investigation.
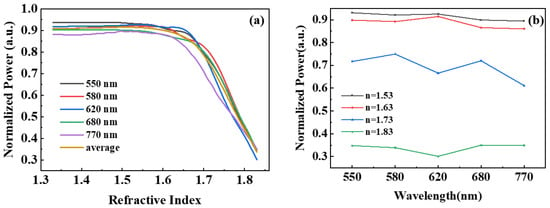
Figure 10.
The dependence of the normalized output power of the OW on (a) the refractive index of detected material and (b) the wavelength of light.

Table 2.
The impact of light wavelength on the detection range.

Table 3.
The dependence of our device’s sensitivity on the refractive index of the material to be detected.

Table 4.
Comparison of the ASPB with the reported sensors with different structures.
4. Conclusions
In this paper, we designed an ASPB light source and OW, which affords a luminous efficiency of 5.4 × 10⁻⁶ and a quantum efficiency of ηQ = 5.78 × 10⁻⁵ under normal working conditions. Based on the CMOS process platform, the designed light source and OW can achieve all-silicon monolithic integration. When the refractive index of the detected material exceeds 1.61, the detection loss of the embedded OW is smaller than that of the slab OW. In addition, by simulating the five peak wavelengths of light sources in the spectrogram, the changes in light energy caused by materials with different refractive indexes were detected, suggesting that the fitted average power could represent the performance of the ASPB, and materials with a refractive index greater than 1.52 could be detected. Due to the low loss, high detection accuracy, low cost, and fast speed, the ASPB based on the PN junction cascade light source and the embedded OW can be applied in many fields, such as detecting different organic solvents in the lab.
Author Contributions
Y.T.: methodology, software, formal analysis, and writing—original draft; Q.L.: investigation; Y.C.: visualization and validation; K.X.: conceptualization, data curation, funding acquisition, project administration, supervision, and writing—review and editing. All authors have read and agreed to the published version of the manuscript.
Funding
This research was funded by the National Natural Science Foundation of China under Grant (62174018), the Sichuan Province's Science Fund for Distinguished Young Scholars under Con-tract (2020JDJQ0022), the National Key Research and Development Program of China under Contract (2018YFE0181500), and the Key R&D project of Science and Technology Department of Sichuan Province (2023YFG0141).
Conflicts of Interest
The authors declare no conflict of interest.
References
- Gavela, A.F.; García, D.G.; Ramirez, J.C.; Lechuga, L.M. Last Advances in Silicon-Based Optical Biosensors. Sensors 2016, 16, 285. [Google Scholar] [CrossRef]
- Dastgeer, G.; Shahzad, Z.M.; Chae, H.; Kim, Y.H.; Ko, B.M.; Eom, J. Bipolar Junction Transistor Exhibiting Excellent Output Characteristics with a Prompt Response against the Selective Protein. Adv. Funct. Mater. 2022, 32, 38. [Google Scholar] [CrossRef]
- Dastgeer, G.; Afzal, A.; Jaffery, S.; Imran, M.; Assiri, M.; Nisar, S. Gate modulation of the spin current in gra-phene/WSe2 van der Waals heterostructure at room temperature. J. Alloy. Compd. 2022, 919, 165815. [Google Scholar] [CrossRef]
- Mignani, A.G.; Baldini, F. Biomedical sensors using optical fibres. Rep. Prog. Phys. 1996, 59, 1–28. [Google Scholar] [CrossRef]
- Correia, R.; James, S.W.; Lee, S.-W.; Morgan, S.P.; Korposh, S. Biomedical application of optical fibre sensors. J. Opt. 2018, 20, 073003. [Google Scholar] [CrossRef]
- Pospíšilová, M.; Kuncová, G.; Trögl, J. Fiber-Optic Chemical Sensors and Fiber-Optic Bio-Sensors. Sensors 2015, 15, 25208–25259. [Google Scholar] [CrossRef] [PubMed]
- Wang, X.; Wolfbeis, O. Fiber-optic chemical sensors and biosensors. Anal. Chem. 2016, 88, 203–227. [Google Scholar] [CrossRef]
- Krupin, O.; Wong, W.R.; Beland, P.; Adikan, F.R.M.; Berini, P. Long-Range Surface Plasmon-Polariton Waveguide Bi-osensors for Disease Detection. J. Light. Technol. 2016, 34, 4673–4681. [Google Scholar] [CrossRef]
- Wu, B.; Lu, Y.; Hao, C.; Duan, L.; Musideke, M.; Yao, J. A photonic crystal fiber sensor based on differential optical absorption spectroscopy for mixed gases detection. Optik 2014, 125, 2909–2911. [Google Scholar] [CrossRef]
- Bahrami, F.; Maisonneuve, M.; Meunier, M.; Aitchison, J.S.; Mojahedi, M. An improved refractive index sensor based on genetic optimization of plasmon waveguide resonance. Opt. Express 2013, 21, 20863–20872. [Google Scholar] [CrossRef]
- Sudarsono, S.; Yudoyono, G.; Prajitno, G.; Sunarno, H.; Rohedi, A.Y.; Indarto, B.; Pramono, Y.H. Detection of salinity in the process of heating seawater by using a directional coupler of the multimode plastic optical fiber with a plane mirror as a reflector. J. Opt. 2020, 49, 48–52. [Google Scholar] [CrossRef]
- Liu, Q.; Gu, Z.; Park, M.; Chung, J. Experimental demonstration of highly sensitive optical sensor based on grat-ing-assisted light coupling between strip and slot waveguides. Opt. Express 2016, 24, 12549. [Google Scholar] [CrossRef] [PubMed]
- Guan, X.; Wang, X.; Frandsen, L.H. Optical temperature sensor with enhanced sensitivity by employing hybrid waveguides in a silicon Mach-Zehnder interferometer. Opt. Express 2016, 24, 16349–16356. [Google Scholar] [CrossRef] [PubMed]
- Okhai, T.A.; Snyman, L.W.; Polleux, J.-L. Wavelength dispersion characteristics of integrated silicon avalanche LEDs: Potential applications in futuristic on-chip micro- and nano-biosensors. SPIE 2017, 10036, 26–47. [Google Scholar] [CrossRef]
- Okhai, T.A.; Snyman, L.W.; Polleux, J.-L. Wavelength dispersion phenomena observed for emitted optical radiation from a p+nn+ silicon avalanche mode light-emitting device in a radio frequency bipolar-integrated circuitry. Opt. Eng. 2019, 58, 017104. [Google Scholar] [CrossRef]
- Okhai, T.; Snyman, L. Realizing micro-and nano-optical biosensors on chip. Proc. SPIE 2019, 11043, 1104308. [Google Scholar]
- Zhang, J.; Luo, C.; Zhao, Z. Design and Application of Integrated Optics Sensor for Measurement of Intense Pulsed Electric Field. J. Light. Technol. 2019, 37, 1440–1448. [Google Scholar] [CrossRef]
- Xu, K.; Chen, Y.; Okhai, T.A.; Snyman, L.W. Micro optical sensors based on avalanching silicon light-emitting devices monolithically integrated on chips. Opt. Mater. Express 2019, 9, 3985–3997. [Google Scholar] [CrossRef]
- Chaudhuri, R.; Song, Y.; Seo, S. Heterogeneously integrated optical detection platform for on-chip sensing applica-tions. J. Opt. 2015, 17, 105804. [Google Scholar] [CrossRef]
- Xu, K.; Huang, L.; Zhang, Z.; Zhao, J.; Zhang, Z.; Snyman, L.W.; Swart, J.W. Light emission from a poly-silicon device with carrier injection engineering. Mater. Sci. Eng. B 2018, 231, 28–31. [Google Scholar] [CrossRef]
- Badri, S.H.; Gilarlue, M. Coupling Si3N4 waveguide to SOI waveguide using transformation optics. Opt. Commun. 2019, 460, 125089. [Google Scholar] [CrossRef]
- Guo, W.; Ding, H.; Zhou, P.; Wang, Y.; Su, B. Electrochemiluminescence Waveguide in Single Crystalline Molecular Wires. Angew. Chem. Int. Ed. 2020, 59, 6745–6749. [Google Scholar] [CrossRef]
- Xu, L.; Liu, N.; Zhou, S.; Zhang, L.; Li, J. Dual-spectroscopy technique based on quartz crystal tuning fork detector. Sens. Actuators A: Phys. 2020, 304, 111873. [Google Scholar] [CrossRef]
- Bai, R.; Zhang, C.; Liu, Z.; Chen, X.; Chen, H. Electric field effects on organic photovoltaic heterojunction in-terfaces: The model case of pentacene/C60. J. Theor. Comput. Chem. 2020, 1186, 112914. [Google Scholar] [CrossRef]
- Yamada, S.; Shirayanagi, Y.; Narihara, T.; Kumada, M.; Porponth, S.; Ichikawa, Y.; Miyajima, S.; Konagai, M. Photovoltaic effect in Si/SiO2 superlattice microdisk array solar cell structure. Superlattices Microstruct. 2020, 145, 106640. [Google Scholar] [CrossRef]
- Zheng, Z.; Luo, Q.; Xu, K.; Liu, Z.; Zhu, K. All-silicon PIN photodetector based on black silicon microstructure. Opto-Electron. Eng. 2021, 48, 200364. [Google Scholar]
- Song, F.; Xiao, J.; Xie, A.J.; Seo, S.-W. A polymer waveguide grating sensor integrated with a thin-film photodetector. J. Opt. 2013, 16, 015503. [Google Scholar] [CrossRef] [PubMed]
- Wang, Z. Research progress of silicon nitride ceramic. Mater. Sci. Technol. 2009, 17, 155–158. [Google Scholar]
- Fan, Z.; Chen, Z.; Zhou, X.; He, X.; Jiang, S.; Dong, J. Recent advances in silicon nitride-based photonic devices and applications. Chin. Opt. 2021, 14, 0998–1018. [Google Scholar]
- Tang, Y.; Liu, H. Study of Goos-Hanchen displacement and evanescent wave’s depth penetration based on the polarization. Basic Sci. J. Text. Univ. 2003, 16, 320–322. [Google Scholar]
- Lou, J.; Xu, H.-Z.; Xu, B.; Huang, J.; Li, B.-C.; Shen, W.-M. Fiber-optic evanescent wave sensor with a segmented structure. Appl. Opt. 2014, 53, 4200–4205. [Google Scholar] [CrossRef] [PubMed]
- Kishore, P.; Dinakar, D.; Rao, P.V.; Srimannarayana, K. Study the effect of fiber-dia on the alongside dual-plastic optical fiber vibration sensor. J. Opt. 2015, 44, 128–135. [Google Scholar] [CrossRef]
- Ai, K.; Cheng, J.; Zhu, K.; Wu, K.; Liu, Z.; Liu, Z.; Zhao, J.; Huang, L.; Xu, K. Design and realization of a novel poly-silicon light-emitting device based on standard CMOS technology. Chin. J. Lasers 2020, 47, 0701027. [Google Scholar]
- Xu, K.; Li, G.P. A Three-Terminal Silicon-PMOSFET-Like Light-Emitting Device (LED) for Optical Intensity Modulation. IEEE Photon- J. 2012, 4, 2159–2168. [Google Scholar] [CrossRef]
- Huang, B.; Zhang, X.; Wang, W.; Dong, Z.; Guan, N.; Zhang, Z.; Chen, H. CMOS monolithic optoelectronic integrated circuit for on-chip optical interconnection. Opt. Commun. 2011, 284, 3924–3927. [Google Scholar] [CrossRef]
- Zhang, H.; Zhou, C.; Fan, D.; Zhou, A.; Zhao, Y. Fiber cavity ring-down refractive index sensing method based on frequency-shifted interferometry. Laser Optoelectron. Prog. 2019, 56, 170627. [Google Scholar] [CrossRef]
- Wu, D.; Huang, W.; Wang, G.-Y.; Fu, J.-Y.; Chen, Y.-Y. In-line fiber Fabry–Perot refractive index tip sensor based on photonic crystal fiber and spectrum differential integration method. Opt. Commun. 2014, 313, 270–275. [Google Scholar] [CrossRef]
- Zhang, J.; Sun, H.; Wang, R.; Su, D.; Guo, T.; Feng, Z.; Hu, M.; Qiao, X. Simultaneous Measurement of Refractive Index and Temperature Using a Michelson Fiber Interferometer With a Hi-Bi Fiber Probe. IEEE Sens. J. 2013, 13, 2061–2065. [Google Scholar] [CrossRef]
Disclaimer/Publisher’s Note: The statements, opinions and data contained in all publications are solely those of the individual author(s) and contributor(s) and not of MDPI and/or the editor(s). MDPI and/or the editor(s) disclaim responsibility for any injury to people or property resulting from any ideas, methods, instructions or products referred to in the content. |
© 2023 by the authors. Licensee MDPI, Basel, Switzerland. This article is an open access article distributed under the terms and conditions of the Creative Commons Attribution (CC BY) license (https://creativecommons.org/licenses/by/4.0/).