Abstract
Acetaminophen (AC) is one of the most popular pharmacologically active substances used as an analgesic and antipyretic drug. Herein, a new type of hollow Fe3O4-rGO/GCE electrode was prepared for electrochemical detection of AC through a three-step approach involving a solvothermal method for the synthesis of hollow Fe3O4 and the chemical reduction of graphene oxide (GO) for reduced graphene oxide (rGO) and Fe3O4-rGO nanocomposites modified on the glassy carbon electrode (GCE) surface. The as-prepared Fe3O4-rGO nanocomposites were characterized using a transmission electron microscope (TEM), X-ray diffraction (XRD), and a magnetic measurement system (SQUID-VSM). The magnetic Fe3O4-rGO/GCE electrodes were employed for the electrochemical detection of AC using cyclic voltammetry (CV), electrochemical impedance spectroscopy (EIS), and square wave voltammetry (SWV) and exhibited an ultra-high selectivity and accuracy, a low detection limit of 0.11 µmol/L with a wider linear range from 5 × 10⁻⁷ to 10−4 mol/L, and high recovery between 100.52% and 101.43%. The obtained Fe3O4-rGO-modified GCE displays great practical significance for the detection of AC in drug analysis.
1. Introduction
Acetaminophen (AC), also known as paracetamol, is one of the most commonly used antipyretic and analgesic drugs in clinical practice. It is used for fever, headache, joint pain, cancer pain and postoperative pain relief [1]. AC has a good curative effect and quick effect and basically has no adverse reactions at conventional doses. However, when the drug is overdosed, symptoms such as nausea, vomiting, stomach pain and other symptoms appear quickly, and liver damage will occur. An excessive dose will lead to liver failure, renal tubular necrosis, and even death due to renal failure [2,3]. In order to avoid the harm caused by AC to the human body, the accurate and efficient detection and analysis of AC components and content are particularly important. The traditional AC detection methods include high-performance liquid chromatography (HPLC) [4,5,6], liquid chromatography/mass spectrometry (HPLC/MS) [7,8], spectrophotometry [9], etc. These methods have high accuracy, but their equipment is expensive, and their detection rate is slow. It is of great significance to establish a convenient, sensitive and accurate analytical method for acetaminophen in vitro and in vivo. A promising alternative method in this respect is the electrochemical detection method, which possesses the advantages of high sensitivity, convenience, efficiency, and accuracy and exhibits great advantages in the detection of AC [10,11,12,13,14,15].
In recent research, nanocomposites were used in electrochemical applications, including as sensors, owing to their high surface area, high conductivity, and good electrocatalytic properties [3,16,17,18,19,20,21]. More recently, magnetic Fe3O4 nanoparticles have shown excellent magnetic properties, electrical conductivity, chemical stability, biocompatibility, and low toxicity. Therefore, Fe3O4 nanoparticles have received increasing attention as potential electrode modification materials or have been widely applied in electrochemical sensors and biosensors [22,23,24,25]. In addition, magnetic Fe3O4 nanoparticles with hollow structures can provide a larger electrochemically active area [26,27]. To further increase their electrochemically active area, hollow Fe3O4 nanoparticles were combined with reduced graphene oxide (rGO). Reduced graphene oxide consists of a layer of sp2-bonded carbon atoms that act as electron donor groups, thus exhibiting excellent electrical conductivity, large electrochemically active areas, and good chemical stability, and can be used as a high-quality conductor and carrier [3,28,29,30,31,32].
In this paper, we have prepared a new type of magnetic hollow Fe3O4-rGO nanocomposite-modified glassy carbon electrode (GCE) electrode for the detection of AC. The strategy for the process of preparing magnetic Fe3O4-rGO nanocomposites is depicted in Scheme 1. The electrochemical behaviors of AC were investigated by different electrochemical characterization methods. Furthermore, the detection conditions, such as the type and pH value of the buffer solution, the amount of Fe3O4-rGO, waiting time, etc., were optimized. The detection method has the advantages of simple operation, high sensitivity, and good selectivity and is used for the detection of AC content in compound tablets, demonstrating a low detection limit and prominent repeatability.
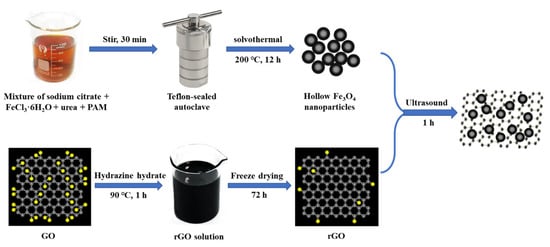
Scheme 1.
Schematic representation of the synthesis of Fe3O4-rGO nanocomposites.
2. Materials and Methods
2.1. Materials
Acetaminophen, graphene oxide (GO) and polyethyleneimine (PEI) were purchased from Aladdin Reagents (Shanghai, China). Iron chloride hexahydrate (FeCl3·6H2O), chromium trichloride (CrCl3·6H2O), sodium citrate, sodium carbonate, urea, polyacrylamide (PAM), hydrazine hydrate, potassium chloride (KCl), potassium ferricyanide (K3[Fe(CN)6]), potassium hexacyanoferrate(II) (K4[Fe(CN)6]), alumina (Al2O3) powders, glucose, uric acid, rutin, catechol, hydroquinone, and absolute ethanol were obtained from Tianjin Chemical Factory (China). The 0.2 mol/L phosphate buffer solution (PBS, pH 5.0, containing 0.9% NaCl) was used as the supporting electrolyte in the detection of AC, which was composed of 0.2 mol/L Na2HPO4 and 0.2 mol/L NaH2PO4. The standard solution of 0.01 mol/L AC was prepared using deionized water as a solvent. All chemical reagents and solvents used in this research were of analytical grade. Deionized water was used throughout the experiments.
2.2. Preparation of Hollow Fe3O4 Nanoparticles
Hollow Fe3O4 nanoparticles were prepared by a solvothermal method based on previous reports [33]. In the typical synthesis, 2.35 g of sodium citrate, 1.08 g of FeCl3·6H2O and 0.72 g of urea were dissolved in 80 mL of deionized water with strong stirring. After mixing evenly, 0.6 g of PAM was slowly added to the above mixture and further stirred for 30 min. Afterwards, the mixed solution was transferred into a Teflon-sealed autoclave and heated to 200 °C for 12 h. After cooling to room temperature, the obtained Fe3O4 nanoparticles were washed alternately with deionized water and absolute ethanol until the supernatant liquid was neutral and finally dried at room temperature in air for several hours.
2.3. Preparation of rGO
The rGO can be prepared by the reduction of GO with a reducing agent. Generally, 16 mg PEI was added to an aqueous GO solution (0.5 mg/mL, 20 mL), followed by ultrasonic dispersion for 5 min. Then, 400 µL of hydrazine hydrate was dropped into the mixed solution at 90 °C with stirring for 60 min. Furthermore, the solution was centrifuged and washed alternately with deionized water and absolute ethanol 3 to 5 times. Finally, the obtained sample was freeze-dried for 3 days to obtain rGO.
2.4. Preparation of Magnetic Fe3O4-rGO/GCE
Briefly, the as-prepared 9.7 mg rGO and 9.7 mg hollow Fe3O4 were dissolved in 9.7 mL of deionized water and dispersed by ultrasound for 1 h to form a homogenous mixture of hollow Fe3O4-rGO modification solution. The surface of the GCE electrode was polished with 0.05 µm Al2O3 water paste and then cleaned and dried to obtain a mirror-like surface (bare GCE). All of the above hollow Fe3O4-rGO modification suspension was dropped on the surface of bare GCE. After being dried under the irradiation of an infrared lamp, the modified electrode Fe3O4-rGO/GCE was obtained for all electrochemical experiments.
2.5. Characterization
Transmission electron microscopy (TEM, Hitachi Limited H-7650, Japan) was used to investigate the morphology and size of as-prepared nanomaterials. The crystal structures of the samples were measured using X-ray diffraction spectroscopy (XRD, Rigaku DMAX 2000 diffractometer with Cu Kα radiation, accelerating voltage = 40 kV, Tokyo, Japan). The magnetic measurement of the samples was carried out in a SQUID-VSM magnetic measurement system (Quant-um Design Company, USA).
2.6. Electrochemical Measurements
Cyclic voltammetry (CV) and square wave voltammetry (SWV) were performed on a CHI660E electrochemical workstation (Shanghai Chenhua instrument Co., Ltd. China) controlled with a conventional three-electrode system to test the electrochemical performance. The three-electrode system consisted of an auxiliary Pt wire electrode, a reference saturated calomel electrode and a hollow Fe3O4-rGO nanomaterial-modified GCE as a working electrode. For the CV method, the AC stock solution (100 µL, 0.01 mol/L) was diluted with 9.9 mL of PBS buffer (pH 5.0) to obtain 1 × 10⁻⁴ mol/L of AC test solution. The CVs were recorded in the range of −0.8 V to1.6 V at a scan rate of 100 mV s−1 up to 50 cycles for the stabilization and activation of the modified electrode. After each recording, the Fe3O4-rGO/GCE electrode was cleaned, re-polished to a mirror surface and then modified again. For the SWV method, 1 × 10⁻⁵ mol/L AC solution was prepared with PBS buffer solution in the electrolytic cell. The peak currents of 0.45 V for AC were recorded in the range of −0.2 V to 1.0 V at a pulse amplitude of 45 mV, frequency of 15 Hz, and scanning interval of 4 mV by the SWV method.
3. Results and Discussion
TEM and XRD were employed to characterize the prepared nanomaterials. Figure 1 shows the TEM images of the synthesized hollow Fe3O4 nanoparticles, rGO nanosheet and Fe3O4-rGO composites. As expected, the Fe3O4 nanoparticles, as shown in Figure 1a,b, are spherical, hollow, well-monodispersed and nearly uniform in dimension, with a particle size of about 400 nm. Figure 1c shows that the rGO obtained here exhibits the typical nanosheet-like structure with folded regions and transparent layers, indicating that the obtained rGO has low agglomeration and a low number of layers [34,35]. This structure is favorable for the attachment of hollow Fe3O4 on the surface of the rGO. It is obvious from Figure 1d that the hollow Fe3O4 nanoparticles are dispersed and anchored on the surface as well as on the folds of the rGO nanosheet. Compared with the hollow Fe3O4 and rGO, the hollow Fe3O4-rGO nanocomposite has a larger specific surface area.
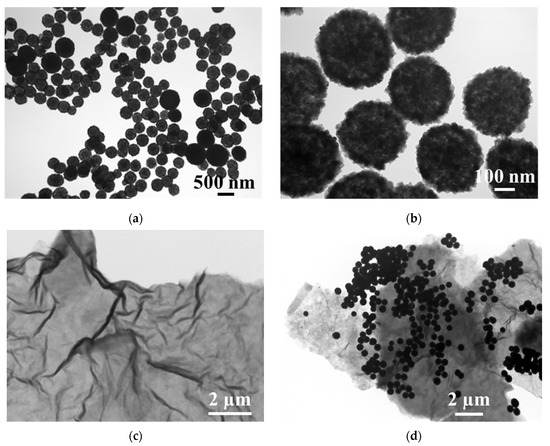
Figure 1.
TEM images of (a,b) Fe3O4, (c) rGO and (d) Fe3O4-rGO nanocomposites.
The XRD patterns of Fe3O4 and Fe3O4-rGO are presented in Figure 2a. It can be seen that both hollow Fe3O4 nanoparticles and Fe3O4-rGO nanocomposites have five characteristic diffraction peaks at 2θ of 30.1°, 35.4°, 42.9°, 57.5° and 62.7°, corresponding to the (220), (311), (400), (422), (511) and (440) diffraction planes of magnetite, respectively [36,37], which indicates that the magnetite crystalline phase remained in hollow Fe3O4 and Fe3O4-rGO nanocomposites. Moreover, the characteristic diffraction peaks are sharp, suggesting that the synthesized samples have a high degree of crystallinity. Among the features of the hollow Fe3O4-rGO nanocomposites, a new weak broad peak at 2θ ≈ 22°–26° can be observed that corresponds to the (002) characteristic peak due to the reduction of functional groups containing oxygen in rGO [38,39,40]. All of the characteristic peaks of Fe3O4 and rGO observed in Fe3O4-rGO confirm the coexistence of both hollow Fe3O4 and rGO in the hollow Fe3O4-rGO nanocomposites.
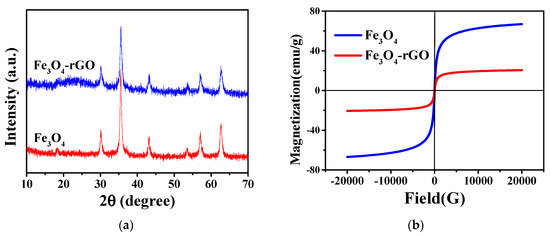
Figure 2.
(a) XRD patterns and (b) magnetic hysteresis loops of Fe3O4 and Fe3O4-rGO.
The magnetic properties of samples were performed using the SQUID-VSM magnetic measurement system, and the magnetic hysteresis loops of Fe3O4 and Fe3O4-rGO are depicted in Figure 2b. As shown in Figure 2b, almost zero coercivity and residual magnetism in samples proved the superparamagnetic properties of hollow Fe3O4 nanoparticles and Fe3O4-rGO [37,41]. The bare Fe3O4 nanoparticles exhibited a high saturation magnetization (Ms) of 66.7 emu/g. Due to the introduction of the nonmagnetic rGO component, the saturation magnetization of Fe3O4-rGO decreased to 20.5 emu/g, which further confirmed the presence of rGO in the Fe3O4-rGO composites. The excellent magnetic properties of Fe3O4-rGO nanocomposites make them exhibit good magnetic separation performance.
Electrochemical impedance spectroscopy (EIS) measurement was carried out in 0.1 mol/L KCl solution containing 5 mM K3[Fe(CN)6] and 5 mM K4[Fe(CN)6] with an amplitude of 10 mV and frequencies ranging from 0.1 Hz to 10 kHz. The EIS can investigate the electrode interface, which can be modeled by an equivalent circuit. This equivalent circuit consists of four parts: the ohmic resistance of the electrolyte (Rs), the electron transfer resistance (Ret), the double-layer capacitance (Cdl), and the Warburg impedance (Zw) [42]. The Nyquist plots of EIS for bare GCE, hollow Fe3O4/GCE, rGO/GCE, and Fe3O4-rGO/GCE are depicted in Figure 3a. The Nyquist plots include a semicircle part at high frequencies reflecting the electron transfer limited process at the electrode surface and a linear part at low frequencies corresponding to the diffusion process. The semicircle diameter of EIS is equivalent to the Ret, which reflects the speed of electron transfer between the electrode surface and the solution of potassium ferricyanide. The smaller the semicircle diameter, the higher the conductivity and the faster the electron transfer [43,44]. As can be seen, the Ret value is 920 Ω on the bare GCE with the largest semicircle diameter. For hollow Fe3O4/GCE and rGO/GCE, the high electrical conductivity significantly decreased their Ret values to 450 Ω and 200 Ω, respectively. As shown in Figure 3a, the obtained Fe3O4-rGO/GCE exhibits electrical resistance as low as 180 Ω, lower than the values of both the single component of Fe3O4 and rGO, which is beneficial to rapid electron transfer for highly-sensitive AC detection [45].
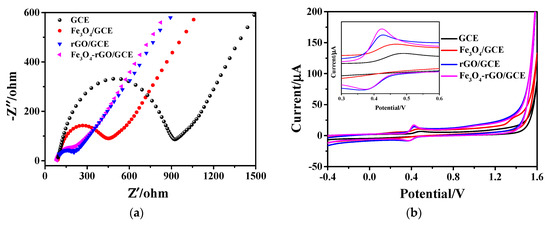
Figure 3.
(a) EIS Nyquist plots of bare GCE, Fe3O4/GCE, rGO/GCE and Fe3O4-rGO/GCE in 0.1 M KCl solution and 5 mM [Fe(CN)6]3−/4− and (b) CV curves of 1 × 10⁻⁴ M AC for different electrodes at a scan rate of 100 mV·s−1 in 0.2 M PBS buffer solution (pH = 5.0); inset: enlarged view of CV curves.
The electrocatalytic behavior of different electrodes, namely of bare GCE, hollow Fe3O4/GCE, rGO/GCE, and Fe3O4-rGO/GCE toward 1.0 × 10⁻⁴ M AC, was studied by CV. As shown in Figure 3b, an oxidation peak appeared at a potential of 0.489 V when electrochemical measurements were performed with bare GCE electrodes. It is notable that the hollow Fe3O4/GCE electrode exhibits a higher oxidation peak than that of bare GCE, and the potential value decreased to 0.468 V. When the electrode was modified by rGO, the current of the oxidation peak was not only significantly higher than that of the hollow Fe3O4/GCE, but also, the potential value corresponding to the highest peak decreased to 0.427 V. In addition, a prominent reduction peak also appeared at 0.361 V. Compared with the rGO/GCE electrode, the peak current of the oxidation peak from the as-prepared Fe3O4-rGO/GCE electrode was further effectively enhanced at 0.424 V, and the peak shape became narrower. It can be seen that all four electrodes have a pair of redox peaks; among them, the redox peak of Fe3O4-rGO/GCE is the most obvious. It is further found that the redox peak current of the Fe3O4-rGO/GCE electrode is 16.99 µA, which is higher than 6.786 µA of bare GCE, showing that the presence of Fe3O4-rGO can greatly improve response sensitivity [45]. This may be due to the fact that when the hollow Fe3O4 nanoparticles are loaded on rGO, the unique hollow structure not only enhances the original specific surface area of rGO, but the synergistic effect of the two also further improves the electrocatalytic ability of the modified material to AC, thus showing an enhanced electrochemical signal [46].
Figure 4 shows the CV curves of 1 × 10⁻⁴ mol/L AC in PBS (pH = 5.6), Britton-Robinson (B-R, pH = 5.0), citric acid (CA)-sodium citrate (pH = 5.0) and HAc-NaAc (pH = 5.5) buffer solutions, respectively, with the hollow Fe3O4/rGO nanocomposite as a modified electrode. As can be seen from the figure, the peak shape of the oxidation peak of AC in PBS buffer is relatively narrower, and the peak current value is relatively higher, so PBS was chosen/selected as the buffer.
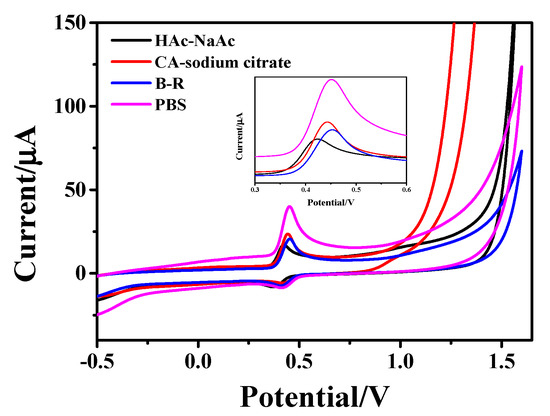
Figure 4.
CV curves of 1 × 10⁻⁴ M AC on Fe3O4-rGO/GCE electrodes at a scan rate of 100 mV·s−1 in different buffer solutions: PBS (pH = 5.6), B-R (pH = 5.0), CA-sodium citrate (pH = 5.0) and Hac-NaAc (pH = 5.5).
In the optimal buffer solution of PBS, the effect of solution pH on the peak current value of AC oxidation was further tested. The CV curves of AC on Fe3O4-rGO/GCE electrodes in PBS buffer solution with different pHs of 4.5, 5.0, 5.5, 6.0, 6.5, 7.0, 7.5, and 8.0 are depicted in Figure 5a. It is obvious from Figure 5a that the oxidation peak increases significantly with the pH of PBS increasing from 4.5 to 5.0. The current peak reaches its maximum at pH 5. When the pH value increases from 5.0 to 8.0, the current peak decreases rapidly. Additionally, the redox peaks shift towards negative potentials with increasing pH, indicating a strong dependence of the redox reaction on buffer pH value. The formal potential (E) is the average value of the oxidation peak and reduction peak and is plotted in Figure 5b as a function of pH. As can be clearly seen, with the increase in buffer pH, the potential corresponding to the highest point of the peak begins to shift negatively, and there is a good linear relationship between the pH value of PBS and the peak potential. The linear equation is: E = −0.0602 pH + 0.7505 (R2 = 0.9995). Since both sodium and disodium phosphate can exchange protons during ionization and hydrolysis, the electrode reaction involves protons. Changes in pH directly affect the degree of ionization or hydrolysis of H2PO4− and HPO42−. In order to obtain high sensitivity and an electrical signal, PBS buffer with pH 5.0 was finally selected as an electrolyte [47,48].
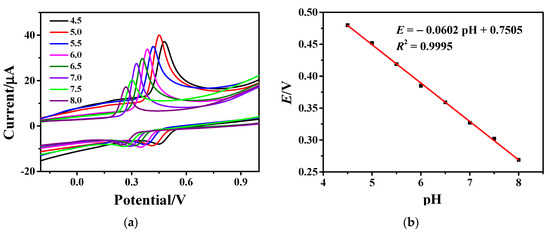
Figure 5.
(a) CV curves of 1×10⁻⁴ M AC on Fe3O4-rGO/GCE electrodes at a scan rate of 100 mV·s−1 in PBS buffer solution with different pH and (b) dependence of formal potential on pH value.
The effect of the modifier dosage and waiting time on the electrochemical signal was investigated by changing the modification amount and waiting time of the hollow Fe3O4-rGO composites on the electrode surface. The relationships between waiting time and modifier dosage with the oxidation peak current value are depicted in Figure 6a and Figure 6b, respectively. The CV method was used in the experiment, and the PBS buffer with pH = 5.0 was used as the supporting electrolyte to explore the relationship between the scanning time and the oxidation peak current value. As shown in Figure 6a, the peak oxidation current value initially increases with waiting time and reaches its maximum value at a waiting time of 60 s. When the waiting time is more than 60 s, the current value decreases rapidly. Therefore, the optimal waiting time was set to 60 s.
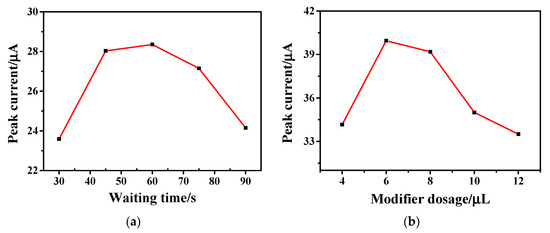
Figure 6.
Relationship between (a) waiting time and (b) modifier dosage and oxidation peak current obtained by 1 × 10⁻⁴ M AC on Fe3O4-rGO/GCE electrodes at a scan rate of 100 mV·s−1 in PBS buffer solution (pH = 5.0).
From Figure 6b, it can be seen that when the amount of modifier was increased from 4 μL to 6 μL, the electrochemical signal was enhanced obviously. When the amount of modification solution was more than 6 μL, the electrochemical signal was gradually weakened. The reason may be that the increase in the modifier thickened the Fe3O4-rGO modifier on the electrode, which hindered the transmission rate of electrons and affected the detection signal. Therefore, the optimal amount of hollow Fe3O4-rGO modification solution was selected as 6 μL.
Figure 7a shows the variation of specific capacitance from CV curves for the Fe3O4-rGO/GCE electrodes to detect AC with different scanning rates. An increase in the oxidation peak current value and the distortion of the shape of the CV curves can be observed with the increase in scanning rate in the scanning range of 60–220 mV∙s−1; meanwhile, the redox peaks shift towards positive potentials. The inset view of the same figure shows the fitting curve between the peak currents of AC and the square root of the scanning rates. It can be seen that the AC current value has a good linear relationship with the square root of the scanning rates. The linear regression equation is: I(µA) = 86.461 4.8931 (R2 = 0.9990), which indicates that the reaction process of AC on the hollow Fe3O4-rGO-modified GCE electrode is diffusion-controlled.
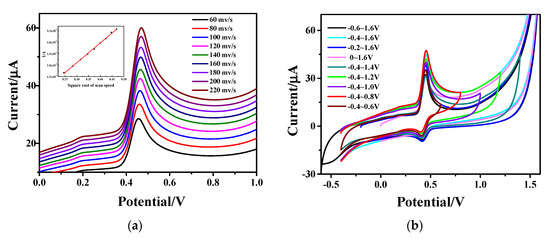
Figure 7.
CV curves of Fe3O4-rGO/GCE electrode (a) at different scanning rates (the inset shows the linear relationship between the anodic peak currents of AC and the square root of the scanning rates ()) and (b) in different scanning ranges.
CV was carried out with a potential scanning range of −0.4−1.6 V, and the CV curves are given in Figure 7b. In order to determine the scanning range in this experiment, a final potential of 1.6 V was first chosen, and then the scanning range was narrowed by increasing the initial potential. As can be seen from the figure, the initial potential corresponding to the maximum current value is −0.4 V with increasing the initial potential from −0.6 V to 0 V. Furthermore, the initial potential was set to −0.4 V, and the scanning range was also narrowed by reducing the final potential. The maximum current value can be observed at the final potential of 0.8 V. This clearly demonstrates that the current peak is the highest, and the oxidation peak and reduction peak are symmetrical and prominent in the scanning range of −0.4−0.8 V. Therefore, the scanning range was determined to be −0.4−0.8 V during the experiment.
The SWV method was used to optimize the test conditions, and then different concentrations of AC were detected under the optimal conditions. The AC standard solution (200 µL, 1 × 10⁻³ mol/L) was diluted with PBS buffer (pH 5.0) to obtain a linear range of AC concentration of 5 × 10⁻⁷−1 × 10⁻⁴ mol/L. Figure 8 represents the SWV curves of AC with different concentrations from 5 × 10⁻⁷ to 1 × 10⁻⁴ mol/L. The peak was found to increase with an increase in AC concentration. The inset shows a good linear relationship between peak current and AC concentration. The linear regression equation is I(µA) = 0.5396 c(mol/L) + 1.1054 × 10⁻⁶ (R2 = 0.9957), and the detection limit is 0.11 µmol/L (signal-to-noise ratio S/N = 3). The analytical performances of Fe3O4-rGO-modified GCE were compared with other modified electrodes in the literature, showing a low detection limit, and the results are shown in Table S1.
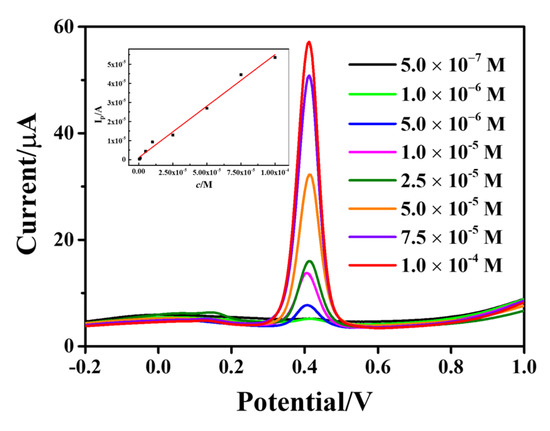
Figure 8.
SWV curves of AC on Fe3O4-rGO/GCE electrodes at different concentrations from 5 × 10⁻⁷ to 1 × 10⁻⁴ M (The inset shows the standard curve of AC concentration with respect to peak current).
In the actual drug testing, some inorganic anions, cations and organic molecules that may be contained in drugs will affect the detection results. Therefore, research on the influence of interfering substances has been carried out, as shown in Figure 9. Under the optimal experimental conditions, 100 times the concentration of Na+, CO32−, Cl−, glucose, uric acid, rutin, catechol, and hydroquinone and 50 times the concentration of Cr3+ were added to a 1 × 10⁻⁴ mol/L AC sample, respectively using the SWV method. Based on the detection results of AC as the standard, it can be seen that the above-added interfering substances have less interference on the detection results, which further indicates that hollow Fe3O4-rGO/GCE can automatically select signals belonging to AC in the presence of interfering substances.
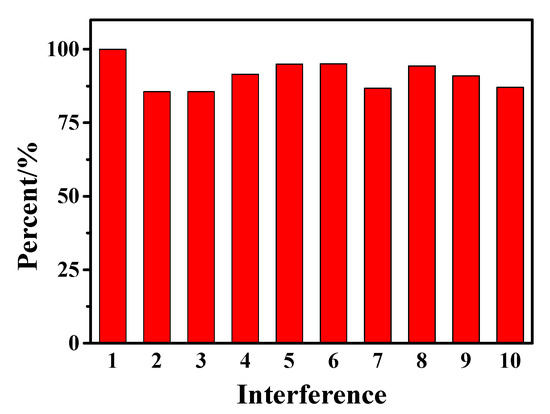
Figure 9.
Influence of different interfering substances (interference 1-10 are AC, Na+, CO32−, Cl−, glucose, uric acid, rutin, catechol, hydroquinone, and Cr3+ in sequence) on 1 × 10⁻⁴ M AC detection with Fe3O4-rGO/GCE electrodes by SWV method.
The repeatability and stability of Fe3O4-rGO/GCE electrodes for AC detection were investigated. Under the optimal experimental conditions, the glassy carbon electrode was modified with 6 µL of hollow Fe3O4-rGO nanocomposite for the detection of AC. The parallel detection of 1 × 10⁻⁴ mol/L AC was repeated 5 times with the same Fe3O4-rGO/GCE electrode after scanning for 50 cycles by the CV method. The relative standard deviation (RSD) obtained was 1.53%. Additionally, the same electrode was re-modified consecutively 5 times with Fe3O4-rGO by the CV method for the determination of 1 × 10⁻⁴ mol/L AC under the same test conditions, and the obtained RSD was 3.03%. The RSDs indicate that the hollow Fe3O4-rGO-modified electrodes possess excellent repeatability and stability for AC detection.
In order to evaluate the practical applicability of the hollow Fe3O4-rGO nanocomposite-modified electrode for AC content in tablets, the acetaminophen tablets (Kangbide Pharmaceutical, specification: 0.5 g, actual mass: 0.609 g) were ground well into a fine powder and dissolved in deionized water to become a 1 × 10⁻³ mol/L AC solution. Then, 200 µL of the above AC solution was diluted in 4.8 mL PBS solution (pH 5.0) and diluted to 1 × 10⁻⁵ mol/L for electrochemical analysis. The acetaminophen concentration was determined from a calibration curve by averaging three repeated measurements. The recovery rate of AC is between 100.52% and 101.43%, and the RSDs are 0.32−1.39%. The results presented in Table 1 indicate that the hollow Fe3O4-rGO nanocomposite is a promising electrochemical platform for the accurate and reproducible detection of acetaminophen in drugs.

Table 1.
Determination and recovery study of AC in actual tablets (n = 3).
4. Conclusions
In conclusion, hollow Fe3O4-rGO nanocomposites were successfully prepared and modified on the electrode surface to research the properties of the composites and explore the detection ability of AC in this work. When the concentration of AC was within the range of 5 × 10⁻⁷–1 × 10⁻⁴ mol/L, the current value showed a good linear relationship with AC concentration, a low detection limit of 0.11 µmol/L, and a satisfactory recovery rate in the range of 100.52% to 101.43%. The experimental results showed that the Fe3O4-rGO/GCE electrodes can detect AC stably with excellent selectivity, accuracy, repeatability, and favorable anti-interference ability. This demonstrates that the Fe3O4-rGO/GCE electrodes can be used as a novel, low-cost and convenient electrochemical channel for the detection of AC content in acetaminophen tablets.
Supplementary Materials
The following supporting information can be downloaded at: https://www.mdpi.com/article/10.3390/nano13040707/s1, Table S1: Comparison of analytical performance of AC detection limit by different modified electrodes.
Author Contributions
Conceptualization, L.S.; methodology, J.D.; software, B.W. and J.L.; validation, L.S. and X.W.; investigation, J.D. and B.W.; data curation, X.W. and J.L.; writing—original draft preparation, L.S.; writing—review and editing, J.D. and B.W.; project administration, L.S. and J.D.; funding acquisition, L.S., X.W. and J.L. All authors have read and agreed to the published version of the manuscript.
Funding
This research was funded by Natural Science Foundation of Shanxi Province (Nos. 20210302123089, 202103021223324 and 202103021223326).
Data Availability Statement
Not applicable.
Conflicts of Interest
The authors declare no conflict of interest.
References
- Murugan, E.; Poongan, A.; Dhamodharan, A. Electrochemical sensing of acetaminophen, phenylephrine hydrochloride and cytosine in drugs and blood serum samples using β-AgVO3/ZrO2@g-C3N4 composite coated GC electrode. J. Mol. Liq. 2022, 348, 118447. [Google Scholar] [CrossRef]
- Wang, P.; Yuan, X.; Cui, Z.; Xu, C.; Sun, Z.; Li, J.; Liu, J.; Tian, Y.; Li, H. A nanometer-sized graphite/boron-doped diamond electrochemical sensor for sensitive detection of acetaminophen. ACS Omega 2021, 6, 6326–6334. [Google Scholar] [CrossRef] [PubMed]
- Sakthivel, M.; Sivakumar, M.; Chen, S.M.; Hou, Y.S.; Veeramani, V.; Madhu, R.; Miyamoto, N. A facile synthesis of Cd(OH)2-rGO nanocomposites for the practical electrochemical detection of acetaminophen. Electroanal 2016, 28, 1–8. [Google Scholar] [CrossRef]
- Khashij, M.; Mehralian, M.; Chegini, Z.G. Degradation of acetaminophen (ACT) by ozone/persulfate oxidation process: Experimental and degradation pathways. Pigment. Resin Technol. 2020, 49, 363–368. [Google Scholar] [CrossRef]
- Haghshenas, E.; Madrakian, T.; Afkhami, A. A novel electrochemical sensor based on magneto Au nanoparticles/carbon paste electrode for voltammetric determination of acetaminophen in real samples. Mater. Sci. Eng. C 2015, 57, 205–214. [Google Scholar] [CrossRef] [PubMed]
- Abdelaleem, E.A.; Abdelwahab, N.S. Validated stability indicating RP-HPLC method for determination of paracetamol, methocarbamol and their related substances. Anal. Methods 2013, 5, 541–545. [Google Scholar] [CrossRef]
- Pietruk, K.; Gbylik-Sikorska, M.; Ebkowska-Wieruszewska, B.; Gajda, A.; Jedziniak, P. Development of a multimatrix UHPLC-MS/MS method for the determination of paracetamol and its metabolites in animal tissues. Molecules 2021, 26, 2046. [Google Scholar] [CrossRef]
- Taylor, R.R.; Hoffman, K.L.; Schniedewind, B.; Clavijo, C.; Galinkin, J.L.; Christians, U. Comparison of the quantification of acetaminophen in plasma, cerebrospinal fluid and dried blood spots using high-performance liquid chromatography-tandem mass spectrometry. J. Pharm. Biomed. Anal. 2013, 83, 1–9. [Google Scholar] [CrossRef]
- Caruso, T.J.; Trivedi, S.; Chadwick, W.; Gaskari, S.; Wang, E.; Marquez, J.; Lagasse, S.; Bailey, M.; Shea, K. A quality improvement project to reduce combination acetaminophen-opioid prescriptions to pediatric orthopedic patients. Pediatr. Qual. Saf. 2020, 5, e291. [Google Scholar] [CrossRef]
- Kang, X.; Wang, J.; Wu, H.; Liu, J.; Aksay, I.A.; Lin, Y. A graphene-based electrochemical sensor for sensitive detection of paracetamol. Talanta 2010, 81, 754–759. [Google Scholar] [CrossRef]
- Bui, M.P.N.; Li, C.A.; Han, K.N.; Pham, X.H.; Seong, G.H. Determination of acetaminophen by electrochemical co-deposition of glutamic acid and gold nanoparticles. Sens. Actuators B Chem. 2012, 174, 318–324. [Google Scholar] [CrossRef]
- Dong, P.; Li, N.; Zhao, H.; Cui, M.; Zhang, C.; Han, H.; Ren, J. POMs as active center for sensitively electrochemical detection of bisphenol A and acetaminophen. Chem. Res. Chin. Univ. 2019, 35, 592–597. [Google Scholar] [CrossRef]
- Song, Y.; Li, J.; Zhang, Y.; Zhao, J.; Li, Y. Preparation of mesoporous carbon nanospheres and its application in electrochemical detection of acetaminophen. J. Minnan Nor. U. Nat. Sci. 2019, 32, 44–54. [Google Scholar]
- Yi, W.; Han, C.; Li, Z.; Guo, Y.; Dong, C. A strategy of electrochemical simultaneous detection of acetaminophen and levofloxacin in water based on g-C3N4 nanosheet-doped graphene oxide. Environ. Sci. Nano 2021, 8, 258–268. [Google Scholar] [CrossRef]
- Marzouqi, F.A.; Selvaraj, R.; Kim, Y. Rapid photocatalytic degradation of acetaminophen and levofloxacin using g-C3N4 nanosheets under solar light irradiation. Mater. Res. Express 2019, 6, 125538. [Google Scholar] [CrossRef]
- Liang, J.; Lou, Q.; Wu, W.; Wang, K.; Xuan, C. NO2 gas sensing performance of a VO2(B) ultrathin vertical nanosheet array: Experimental and DFT investigation. ACS Appl. Mater. Interfaces 2021, 13, 31968–31977. [Google Scholar] [CrossRef]
- Maleh, H.K.; Ahanjan, K.; Taghavi, M.; Ghaemy, M. A novel voltammetric sensor employing zinc oxide nanoparticles and a new ferrocene-derivative modified carbon paste electrode for determination of captopril in drug samples. Anal. Methods 2016, 8, 1780–1788. [Google Scholar] [CrossRef]
- Yi, W.W.; Li, Z.P.; Dong, C.; Li, H.W.; Li, J.F. Electrochemical detection of chloramphenicol using palladium nanoparticles decorated reduced graphene oxide. Microchem. J. 2019, 148, 774–783. [Google Scholar] [CrossRef]
- Jin, G.; Wang, S.M.; Chen, W.L.; Qin, C.; Su, Z.M.; Wang, E.B. A photovoltaic system composed of a keplerate-type polyoxometalate and a water-soluble poly (p-phenylenevinylene) derivative. J. Mater. Chem. A 2013, 1, 6727–6730. [Google Scholar] [CrossRef]
- Karthik, R.; Kumar, J.V.; Chen, S.M.; Karuppiah, C.; Cheng, Y.H.; Muthuraj, V. A study of electrocatalytic and photocatalytic activity of cerium molybdate nanocubes decorated graphene oxide for the sensing. ACS Appl. Mater. Interfaces 2017, 9, 6547–6559. [Google Scholar] [CrossRef]
- Liang, J.; Yu, L.; Wang, Y.; Xue, T.; Lei, D.; Wang, Z.; Li, X. Periodic arrays of 3D AuNP-Capped VO2 shells and their temperature-tunable SERS performance. Adv. Opt. Mater. 2022, 10, 2101615. [Google Scholar] [CrossRef]
- Wang, Y.; Sheng, W.; Wu, J.; Xu, J.; Song, K. Non-enzymatic electrochemical detection of dopamine in blood serum based on porous nitrogen-doped graphene/Fe3O4 nanocomposites. Micro Nano Lett. 2022, 15, 774–778. [Google Scholar] [CrossRef]
- Fayazi, M.; Taher, M.A.; Afzali, D.; Mostafavi, A. Fe3O4 and MnO2 assembled on halloysite nanotubes: A highly efficient solid-phase extractant for electrochemical detection of mercury (II) ions. Sens. Actuators B Chem. 2016, 228, 1–9. [Google Scholar] [CrossRef]
- Li, H.; Kou, B.; Yuan, Y.; Chai, Y.; Yuan, R. Porous Fe3O4@COF-Immobilized gold nanoparticles with excellent catalytic performance for sensitive electrochemical detection of ATP. Biosens. Bioelectron. 2022, 197, 113758. [Google Scholar] [CrossRef]
- Xu, G.; Zhang, M.; Yu, X. Electrochemical detection of nitrite in food based on poly (3,4-ethylenedioxythiophene) doped with Fe3O4 nanoparticles loaded carboxylated nanocrystalline cellulose. Acta Chim. Slov. 2018, 65, 502–511. [Google Scholar] [CrossRef]
- Yang, Z.; Yang, J.P.; Wang, J.; Yao, S.W.; Liu, G. Preparation of hollow Fe3O4 nanospheres & spongy carbon composite and its characterization of electrochemical performance. J. Mater. Eng. 2018, 46, 43–50. [Google Scholar]
- Wang, Y. Hollow Fe3O4 spheres as efficient sulfur host for advanced electrochemical energy storage. Int. J. Electrochem. Sci. 2019, 14, 1416–1422. [Google Scholar] [CrossRef]
- Zhang, L.; Zhang, H.; Chen, Q.; Zhai, C. Plasmon enhanced photo-assisted electrochemical detection of bisphenol A based on Au decorated La2Ti2O7/RGO nanosheets. Surf. Interfaces 2021, 26, 101331. [Google Scholar] [CrossRef]
- Shen, C.; Wang, L.; Zhou, A.; Bo, W.; Wang, X.; Lian, W.; Hu, Q.; Qin, G.; Liu, X. Synthesis and electrochemical properties of two-dimensional RGO/Ti3C2Tx nanocomposites. Nanomaterials 2018, 8, 80. [Google Scholar] [CrossRef] [PubMed]
- Gogoi, D.; Das, M.R.; Ghosh, N.N. CoFe2O4 hollow spheres-decorated three-dimensional rGO sponge for highly efficient electrochemical charge storage devices. ACS Omega 2022, 7, 11305–11319. [Google Scholar] [CrossRef]
- Sun, P.; Xu, K.; Guang, S.; Xu, H. Controlling assembly-induced single layer RGO to achieve highly sensitive electrochemical detection of Pb(II) via synergistic enhancement. Microchem. J. 2021, 162, 105883. [Google Scholar] [CrossRef]
- Hu, H.; Lu, W.; Liu, X.; Meng, F.; Zhu, J. A high-response electrochemical As(III) sensor using Fe3O4-rGO nanocomposite materials. Chemosensors 2021, 9, 150. [Google Scholar] [CrossRef]
- Shi, L.; He, Y.; Hu, Y.; Wang, X.; Jiang, B.; Huang, Y. Synthesis of size-controlled hollow Fe3O4 nanospheres and their growth mechanism. Particuology 2020, 49, 16–23. [Google Scholar] [CrossRef]
- Saha, S.; Jana, M.; Samanta, P.; Murmu, N.C.; Lee, J.H. Hydrothermal synthesis of Fe3O4/RGO composites and investigation of electrochemical performances for energy storage applications. RSC Adv. 2014, 4, 44777–44785. [Google Scholar] [CrossRef]
- Wang, Y.; Li, Y.; Tang, L.; Lu, J.; Li, J. Application of graphene-modified electrode for selective detection of dopamine. Electrochem. Commun. 2009, 11, 889–892. [Google Scholar] [CrossRef]
- Shen, L.; Li, B.; Qiao, Y.; Song, J. Monodisperse Fe3O4/SiO2 and Fe3O4/SiO2/PPy core-Shell composite nanospheres for IBU loading and release. Materials 2019, 12, 828. [Google Scholar] [CrossRef]
- Li, B.; Qiao, Y.; An, J.; Shen, L.; Ma, Q.; Guo, Y. Synthesis, characterisation, and evaluation of core-shell Fe3O4/SiO2/polypyrrole composite nanoparticles. Micro Nano Lett. 2018, 13, 902–906. [Google Scholar] [CrossRef]
- Gunasekarana, S.; Thanrasub, K.; Manikandanc, A.; Durka, M.; Dinesh, A.; Anand, S.; Shankar, S.; Slimani, Y.; Almessiere, M.A.; Baykal, A. Structural, fabrication and enhanced electromagnetic wave absorption properties of reduced graphene oxide (rGO)/zirconium substituted cobalt ferrite (Co0.5Zr0.5Fe2O4) nanocomposites. Phys. B 2021, 605, 412784. [Google Scholar] [CrossRef]
- Alshammari, A.S.; Halim, M.M.; Yam, F.K.; Kaus, N.H.M. Synthesis of Titanium Dioxide (TiO2)/Reduced Graphene Oxide (rGO) thin film composite by spray pyrolysis technique and its physical properties. Mater. Sci. Semicond. Process. 2020, 116, 105140. [Google Scholar] [CrossRef]
- Saha, S.; Jana, M.; Khanra, P.; Samanta, P.; Koo, H.; Murmu, N.C.; Kuila, T. Band gap engineering of boron nitride by graphene and its application as positive electrode material in asymmetric supercapacitor device. ACS Appl. Mater. Interfaces 2015, 7, 14211–14222. [Google Scholar] [CrossRef]
- Abbas, M.; Abdel-Hamed, M.O.; Chen, J. Efficient one-pot sonochemical synthesis of thickness-controlled silica-coated superparamagnetic iron oxide (Fe3O4/SiO2) nanospheres. Appl. Phys. A 2017, 123, 775. [Google Scholar] [CrossRef]
- Li, S.J.; Du, J.M.; Chen, J.; Mao, N.N.; Zhang, M.J.; Pang, H. Electrodeposition of cobalt oxide nanoparticles on reduced graphene oxide: A two-dimensional hybrid for enzyme-free glucose sensing. J. Solid State Electrochem. 2014, 18, 1049–1056. [Google Scholar] [CrossRef]
- Feng, X.; Cheng, H.; Pan, Y.; Zheng, H. Development of glucose Biosensors based on nanostructured graphene-conducting polyaniline composite. Biosens. Bioelectron. 2015, 70, 411–417. [Google Scholar] [CrossRef] [PubMed]
- Wu, S.; Su, F.; Dong, X.; Ma, C.; Pang, L.; Peng, D.; Wang, M.; He, L.; Zhang, Z. Development of glucose biosensors based on plasma polymerization-assisted nanocomposites of polyaniline, tin oxide, and three-dimensional reduced graphene oxide. Appl. Surf. Sci. 2017, 401, 262–270. [Google Scholar] [CrossRef]
- Hao, Y.; Fang, M.; Xu, C.; Ying, Z.; Wang, H.; Zhang, R.; Cheng, H.M.; Zeng, Y. A graphene-laminated electrode with high glucose oxidase loading for highly-sensitive glucose detection. J. Mater. Sci. Technol. 2021, 66, 57–63. [Google Scholar] [CrossRef]
- Li, Z.; Li, Q.; Jiang, R.; Qin, Y.; Luo, Y.; Li, J.; Kong, W.; Yang, Z.; Huang, C.; Qu, X.; et al. An electrochemical sensor based on a MOF/ZnO composite for the highly sensitive detection of Cu(II) in river water samples. RSC Adv. 2022, 12, 5062–5071. [Google Scholar] [CrossRef]
- Zhu, K.; Cai, X.; Luo, Y.; Liu, B.; Zhang, Q.; Hu, T.; Liu, Z.; Wu, H.; Zhang, D. Facile synthesis of flower-like CePO4 with a hierarchical structure for the simultaneous electrochemical detection of dopamine, uric acid and acetaminophen. New J. Chem. 2022, 46, 4611–4619. [Google Scholar] [CrossRef]
- Wang, W.; Zhao, J.; Sun, Y.; Zhang, H. Facile synthesis of g-C3N4 with various morphologies for application in electrochemical detection. RSC Adv. 2019, 9, 7737–7746. [Google Scholar] [CrossRef]


Disclaimer/Publisher’s Note: The statements, opinions and data contained in all publications are solely those of the individual author(s) and contributor(s) and not of MDPI and/or the editor(s). MDPI and/or the editor(s) disclaim responsibility for any injury to people or property resulting from any ideas, methods, instructions or products referred to in the content. |
© 2023 by the authors. Licensee MDPI, Basel, Switzerland. This article is an open access article distributed under the terms and conditions of the Creative Commons Attribution (CC BY) license (https://creativecommons.org/licenses/by/4.0/).