


Fabrication of Self-Assembled BiFeO3/CeO2 Nanocatalytic Materials for Efficient Catalytic Dye Degradation


Abstract
:
1. Introduction
2. Experimental Section
2.1. Materials
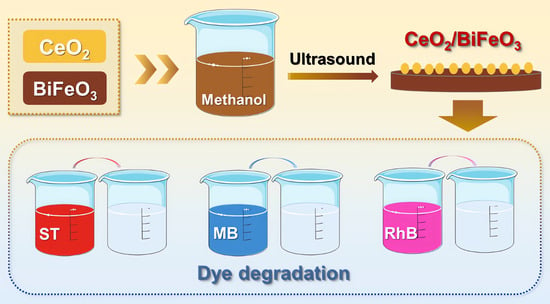
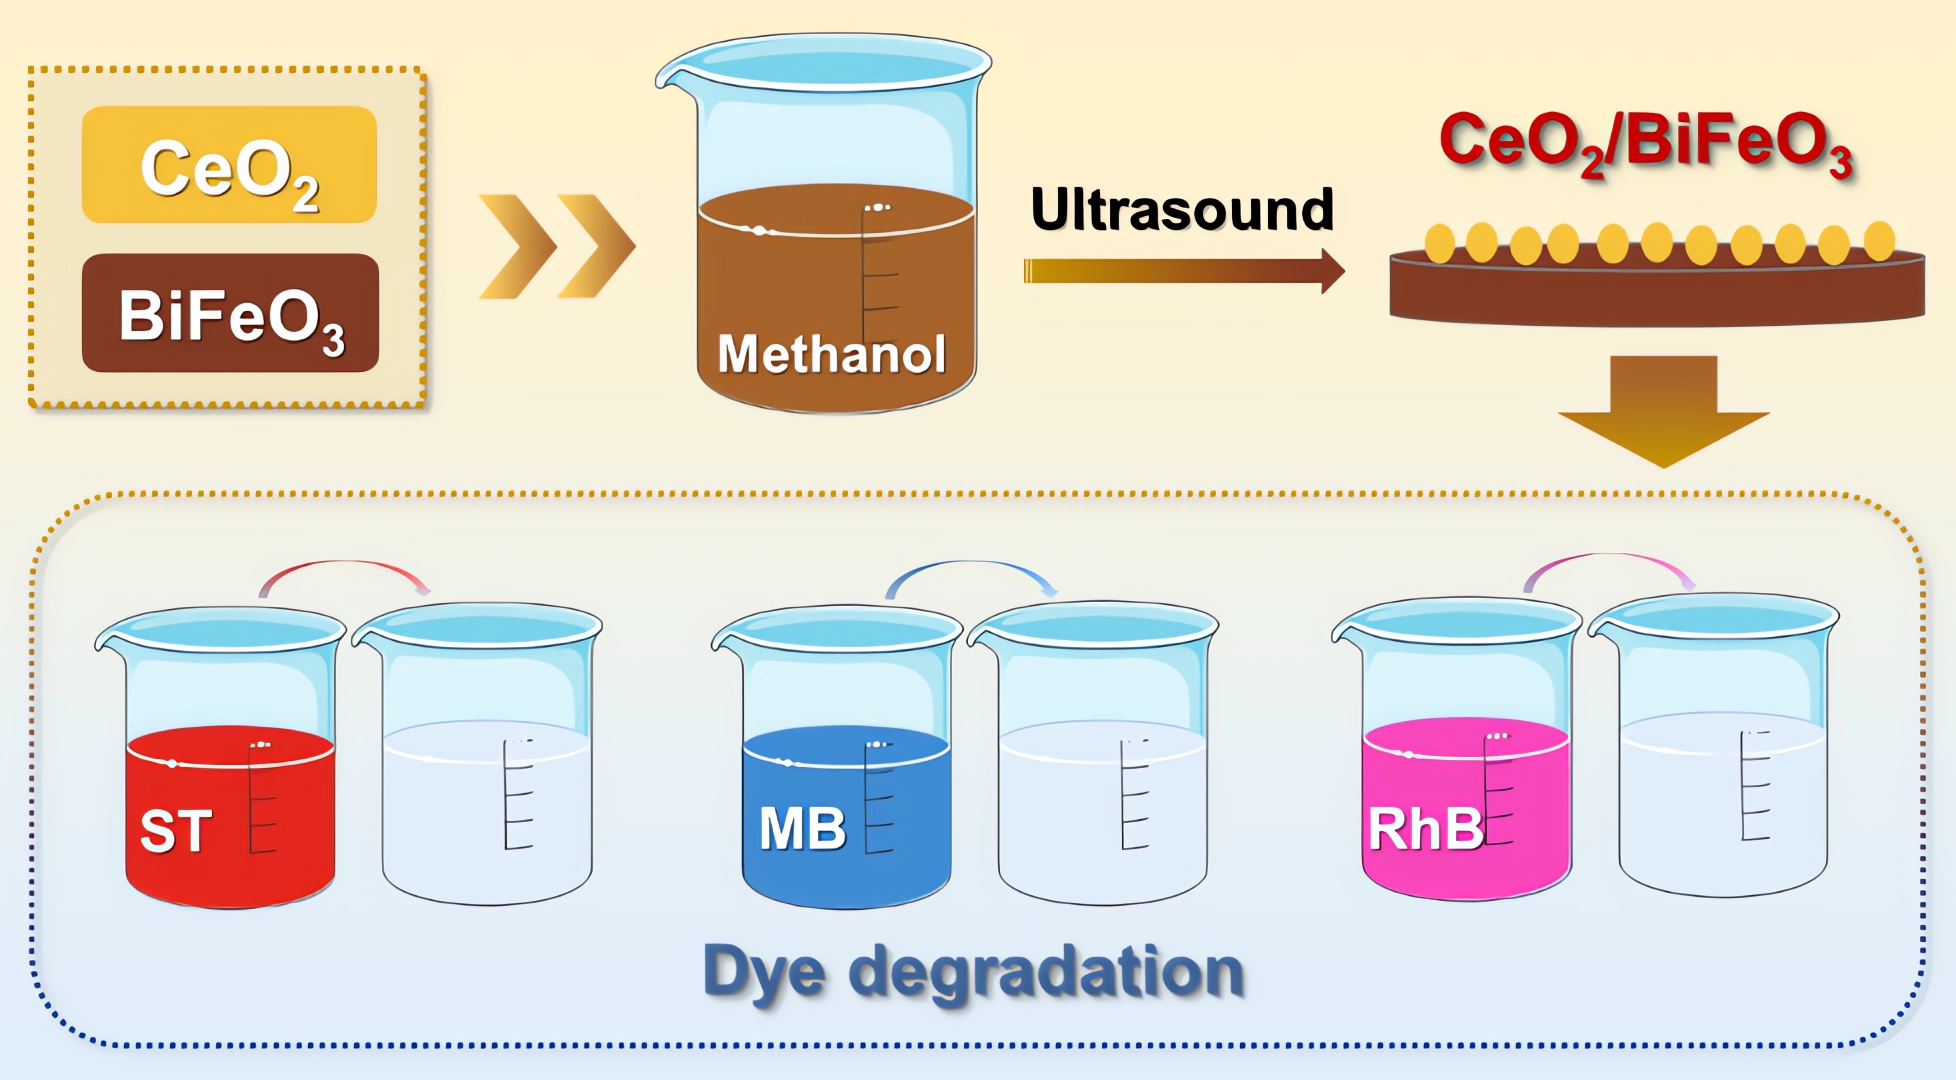
2.2. Preparation of BiFeO3/CeO2 Nanocatalytic Materials
2.2.1. Synthesis of CeO2 Nanoparticles
2.2.2. Synthesis of BiFeO3
2.2.3. Synthesis of BiFeO3/CeO2 Nanocatalytic Materials
2.3. Characterization
2.4. Catalytic Tests for Dye Degradation
3. Results and Discussion
4. Conclusions
Author Contributions
Funding
Institutional Review Board Statement
Informed Consent Statement
Data Availability Statement
Conflicts of Interest
References
- Bilinska, L.; Gmurek, M. Novel trends in AOPs for textile wastewater treatment. Enhanced dye by-products removal by catalytic and synergistic actions. Water Resour. Ind. 2021, 26, 100160. [Google Scholar] [CrossRef]
- Lu, F.; Astruc, D. Nanocatalysts and other nanomaterials for water remediation from organic pollutants. Coord. Chem. Rev. 2020, 408, 213180. [Google Scholar] [CrossRef]
- Mota, H.P.; Quadrado, R.F.N.; Burgo, T.A.L.; Iglesias, B.A.; Fajardo, A.R. Polysaccharide/Fe(III)-porphyrin hybrid film as catalyst for oxidative decolorization of toxic azo dyes: An approach for wastewater treatment. Arab. J. Chem. 2020, 13, 5923–5938. [Google Scholar] [CrossRef]
- Singh, A.; Pal, D.B.; Mohammad, A.; Alhazmi, A.; Haque, S.; Yoon, T.; Srivastava, N.; Gupta, V.K. Biological remediation technologies for dyes and heavy metals in wastewater treatment: New insight. Bioresour. Technol. 2022, 343, 126154. [Google Scholar] [CrossRef]
- An, S.; Zhang, G.; Wang, T.; Zhang, W.; Li, K.; Song, C.; Miller, J.T.; Miao, S.; Wang, J.; Guo, X. High-Density Ultra-small Clusters and Single-Atom Fe Sites Embedded in Graphitic Carbon Nitride (g-C3N4) for Highly Efficient Catalytic Advanced Oxidation Processes. ACS Nano 2018, 12, 9441–9450. [Google Scholar] [CrossRef]
- Luo, H.W.; Zeng, Y.F.; He, D.Q.; Pan, X.L. Application of iron-based materials in heterogeneous advanced oxidation processes for wastewater treatment: A review. Chem. Eng. J. 2021, 407, 127191. [Google Scholar] [CrossRef]
- Xiang, Y.; Liu, H.; Zhu, E.; Yang, K.; Yuan, D.; Jiao, T.; Zhang, Q.; Tang, S. Application of inorganic materials as heterogeneous cocatalyst in Fenton/Fenton-like processes for wastewater treatment. Sep. Purif. Technol. 2022, 295, 121293. [Google Scholar] [CrossRef]
- Yan, Q.Y.; Zhang, J.L.; Xing, M.Y. Cocatalytic Fenton Reaction for Pollutant Control. Cell Rep. Phys. Sci. 2020, 1, 100149. [Google Scholar] [CrossRef]
- Saravanakumar, K.; Park, C.M. Rational design of a novel LaFeO3/g-C3N4/BiFeO3 double Z-scheme structure: Photocatalytic performance for antibiotic degradation and mechanistic insight. Chem. Eng. J. 2021, 423, 130076. [Google Scholar] [CrossRef]
- Zhu, Y.; Zhu, R.; Xi, Y.; Zhu, J.; Zhu, G.; He, H. Strategies for enhancing the heterogeneous Fenton catalytic reactivity: A review. Appl. Catal. B 2019, 255, 117739. [Google Scholar] [CrossRef]
- Yu, Q.; Dai, Y.; Zhang, Z.; Feng, B. Photo-Fenton enhanced degradation of antibiotic by Fe single-atom material: Mechanism, performance and adaptability. Sep. Purif. Technol. 2023, 310, 123149. [Google Scholar] [CrossRef]
- Toor, U.A.; Duong, T.T.; Ko, S.Y.; Hussain, F.; Oh, S.E. Optimization of Fenton process for removing TOC and color from swine wastewater using response surface method (RSM). J. Environ. Manag. 2021, 279, 111625. [Google Scholar] [CrossRef] [PubMed]
- Nie, X.; Li, G.; Li, S.; Luo, Y.; Luo, W.; Wan, Q.; An, T. Highly efficient adsorption and catalytic degradation of ciprofloxacin by a novel heterogeneous Fenton catalyst of hexapod-like pyrite nanosheets mineral clusters. Appl. Catal. B 2022, 300, 120734. [Google Scholar] [CrossRef]
- Dong, H.; Zou, Y.; Zhang, K.; Sun, Y.; Hui, B.; Yang, D.; Cai, L.; Li, J. Biomimetic design of wood carbon-based heterogeneous catalysts for enhanced organic pollutants degradation. Chem. Eng. J. 2023, 451, 138568. [Google Scholar] [CrossRef]
- Wang, F.; Dong, W.; Zhao, Z.; Wang, H.; Li, W.; Zhang, L.; Ouyang, H.; Huang, X.; Li, J. Mechanistic insights into Fe(II)-citric acid complex catalyzed CaO(2) Fenton-like process for enhanced benzo[a]pyrene removal from black-odor sediment at circumneutral pH. Water Res. 2022, 226, 119233. [Google Scholar] [CrossRef]
- Xu, L.; Wang, J. Magnetic nanoscaled Fe3O4/CeO2 composite as an efficient Fenton-like heterogeneous catalyst for degradation of 4-chlorophenol. Environ. Sci. Technol. 2012, 46, 10145–10153. [Google Scholar] [CrossRef]
- He, K.; Chen, G.; Zeng, G.; Chen, A.; Huang, Z.; Shi, J.; Huang, T.; Peng, M.; Hu, L. Three-dimensional graphene supported catalysts for organic dyes degradation. Appl. Catal. B 2018, 228, 19–28. [Google Scholar] [CrossRef]
- Divya, T.; Renuka, N.K. Modulated heterogeneous Fenton-like activity of ‘M’ doped nanoceria systems (M = Cu, Fe, Zr, Dy, La): Influence of reduction potential of doped cations. J. Mol. Catal. A Chem. 2015, 408, 41–47. [Google Scholar] [CrossRef]
- Chong, S.; Zhang, G.; Zhang, N.; Liu, Y.; Zhu, J.; Huang, T.; Fang, S. Preparation of FeCeOx by ultrasonic impregnation method for heterogeneous Fenton degradation of diclofenac. Ultrason. Sonochem 2016, 32, 231–240. [Google Scholar] [CrossRef]
- Saravanakumar, K.; Ramjan, M.M.; Suresh, P.; Muthuraj, V. Fabrication of highly efficient visible light driven Ag/CeO2 photocatalyst for degradation of organic pollutants. J. Alloys Compd. 2016, 664, 149–160. [Google Scholar] [CrossRef]
- Ge, L.; Zang, C.; Chen, F. The enhanced Fenton-like catalytic performance of PdO/CeO2 for the degradation of acid orange 7 and salicylic acid. Chin. J. Catal. 2015, 36, 314–321. [Google Scholar] [CrossRef]
- Zhu, J.; Zhang, G.; Xian, G.; Zhang, N.; Li, J. A High-Efficiency CuO/CeO(2) Catalyst for Diclofenac Degradation in Fenton-Like System. Front. Chem. 2019, 7, 796. [Google Scholar] [CrossRef] [PubMed]
- Li, C.; Li, Z.; Xiaofei, C.; Qinqin, Z.; Haojie, Q.; Xin, Y.; Qian, X.; Zhanwei, T.; Chenyang, Z.; Weitao, M. Novel 3DOM CeO2 Supported LaFeO3 as an Effective Heterogeneous Fenton Catalyst for Degradation of Methylene Blue. J. Environ. Eng. 2022, 148, 04022057. [Google Scholar] [CrossRef]
- Xiao, R.; Zhang, Y.; Wang, S.; Zhu, H.; Song, H.; Chen, G.; Lin, H.; Zhang, J.; Xiong, J. Prussian blue modified CeO(2) as a heterogeneous photo-Fenton-like catalyst for degradation of norfloxacin in water. Environ. Sci. Pollut. Res. Int. 2021, 28, 69301–69313. [Google Scholar] [CrossRef]
- Sutton, J.E.; Danielson, T.; Beste, A.; Savara, A. Below-Room-Temperature C-H Bond Breaking on an Inexpensive Metal Oxide: Methanol to Formaldehyde on CeO2(111). J. Phys. Chem. Lett. 2017, 8, 5810–5814. [Google Scholar] [CrossRef]
- Di, L.; Yang, H.; Xian, T.; Liu, X.; Chen, X. Photocatalytic and Photo-Fenton Catalytic Degradation Activities of Z-Scheme Ag(2)S/BiFeO(3) Heterojunction Composites under Visible-Light Irradiation. Nanomaterials 2019, 9, 399. [Google Scholar] [CrossRef]
- Guo, Y.S.; Pu, Y.P.; Cui, Y.F.; Hui, C.Y.; Wan, J.; Cui, C.W. A simple method using citric acid as the template agent to improve photocatalytic performance of BiFeO3 nanoparticles. Mater. Lett. 2017, 196, 57–60. [Google Scholar] [CrossRef]
- Huang, T.; Zhu, J.D.; Ge, S.Z.; Guo, T.Y.; Jiang, C.W.; Xie, L. Synthesis of novel CdSe QDs/BiFeO3 composite catalysts and its application for the photo-Fenton catalytic degradation of phenol. J. Environ. Chem. Eng. 2020, 8, 104384. [Google Scholar] [CrossRef]
- Volnistem, E.A.; Bini, R.D.; Silva, D.M.; Rosso, J.M.; Dias, G.S.; Cótica, L.F.; Santos, I.A. Intensifying the photocatalytic degradation of methylene blue by the formation of BiFeO3/Fe3O4 nanointerfaces. Ceram. Int. 2020, 46, 18768–18777. [Google Scholar] [CrossRef]
- Jiang, F.; Wang, S.S.; Liu, B.; Liu, J.; Wang, L.; Xiao, Y.; Xu, Y.B.; Liu, X.H. Insights into the Influence of CeO2 Crystal Facet on CO2 Hydrogenation to Methanol over Pd/CeO2 Catalysts. ACS Catal. 2020, 10, 11493–11509. [Google Scholar] [CrossRef]
- Yamashita, T.; Hayes, P. Analysis of XPS spectra of Fe2+ and Fe3+ ions in oxide materials. Appl. Surf. Sci. 2008, 254, 2441–2449. [Google Scholar] [CrossRef]
- Heckert, E.G.; Seal, S.; Self, W.T. Fenton-like reaction catalyzed by the rare earth inner transition metal cerium. Environ. Sci. Technol. 2008, 42, 5014–5019. [Google Scholar] [CrossRef] [PubMed]


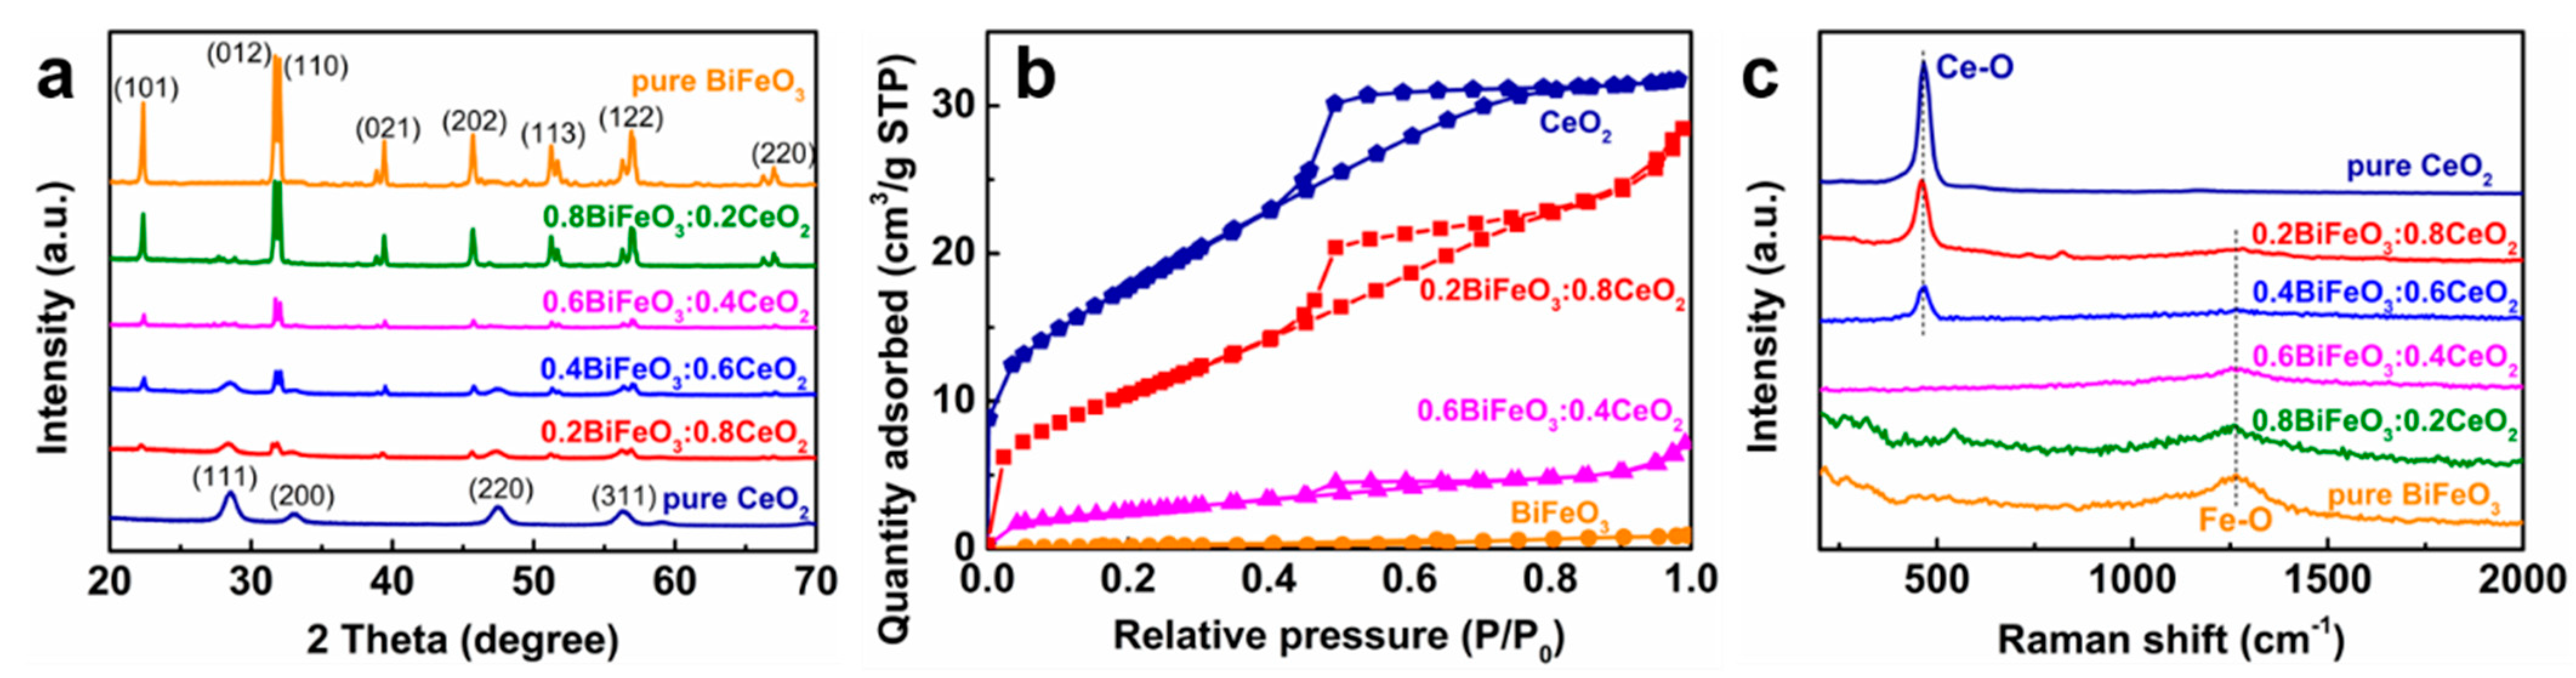
| Sample | BET Surface Area (m2 g−1) | Total Pore Volume (cm3 g−1) | Average Pore Size (nm) |
|---|---|---|---|
| CeO2 | 65 | 0.049 | 3.03 |
| 0.2BiFeO3:0.8CeO2 | 40 | 0.044 | 4.44 |
| 0.6BiFeO3:0.4CeO2 | 9 | 0.011 | 4.68 |
| BiFeO3 | 1 | 0.001 | 6.59 |
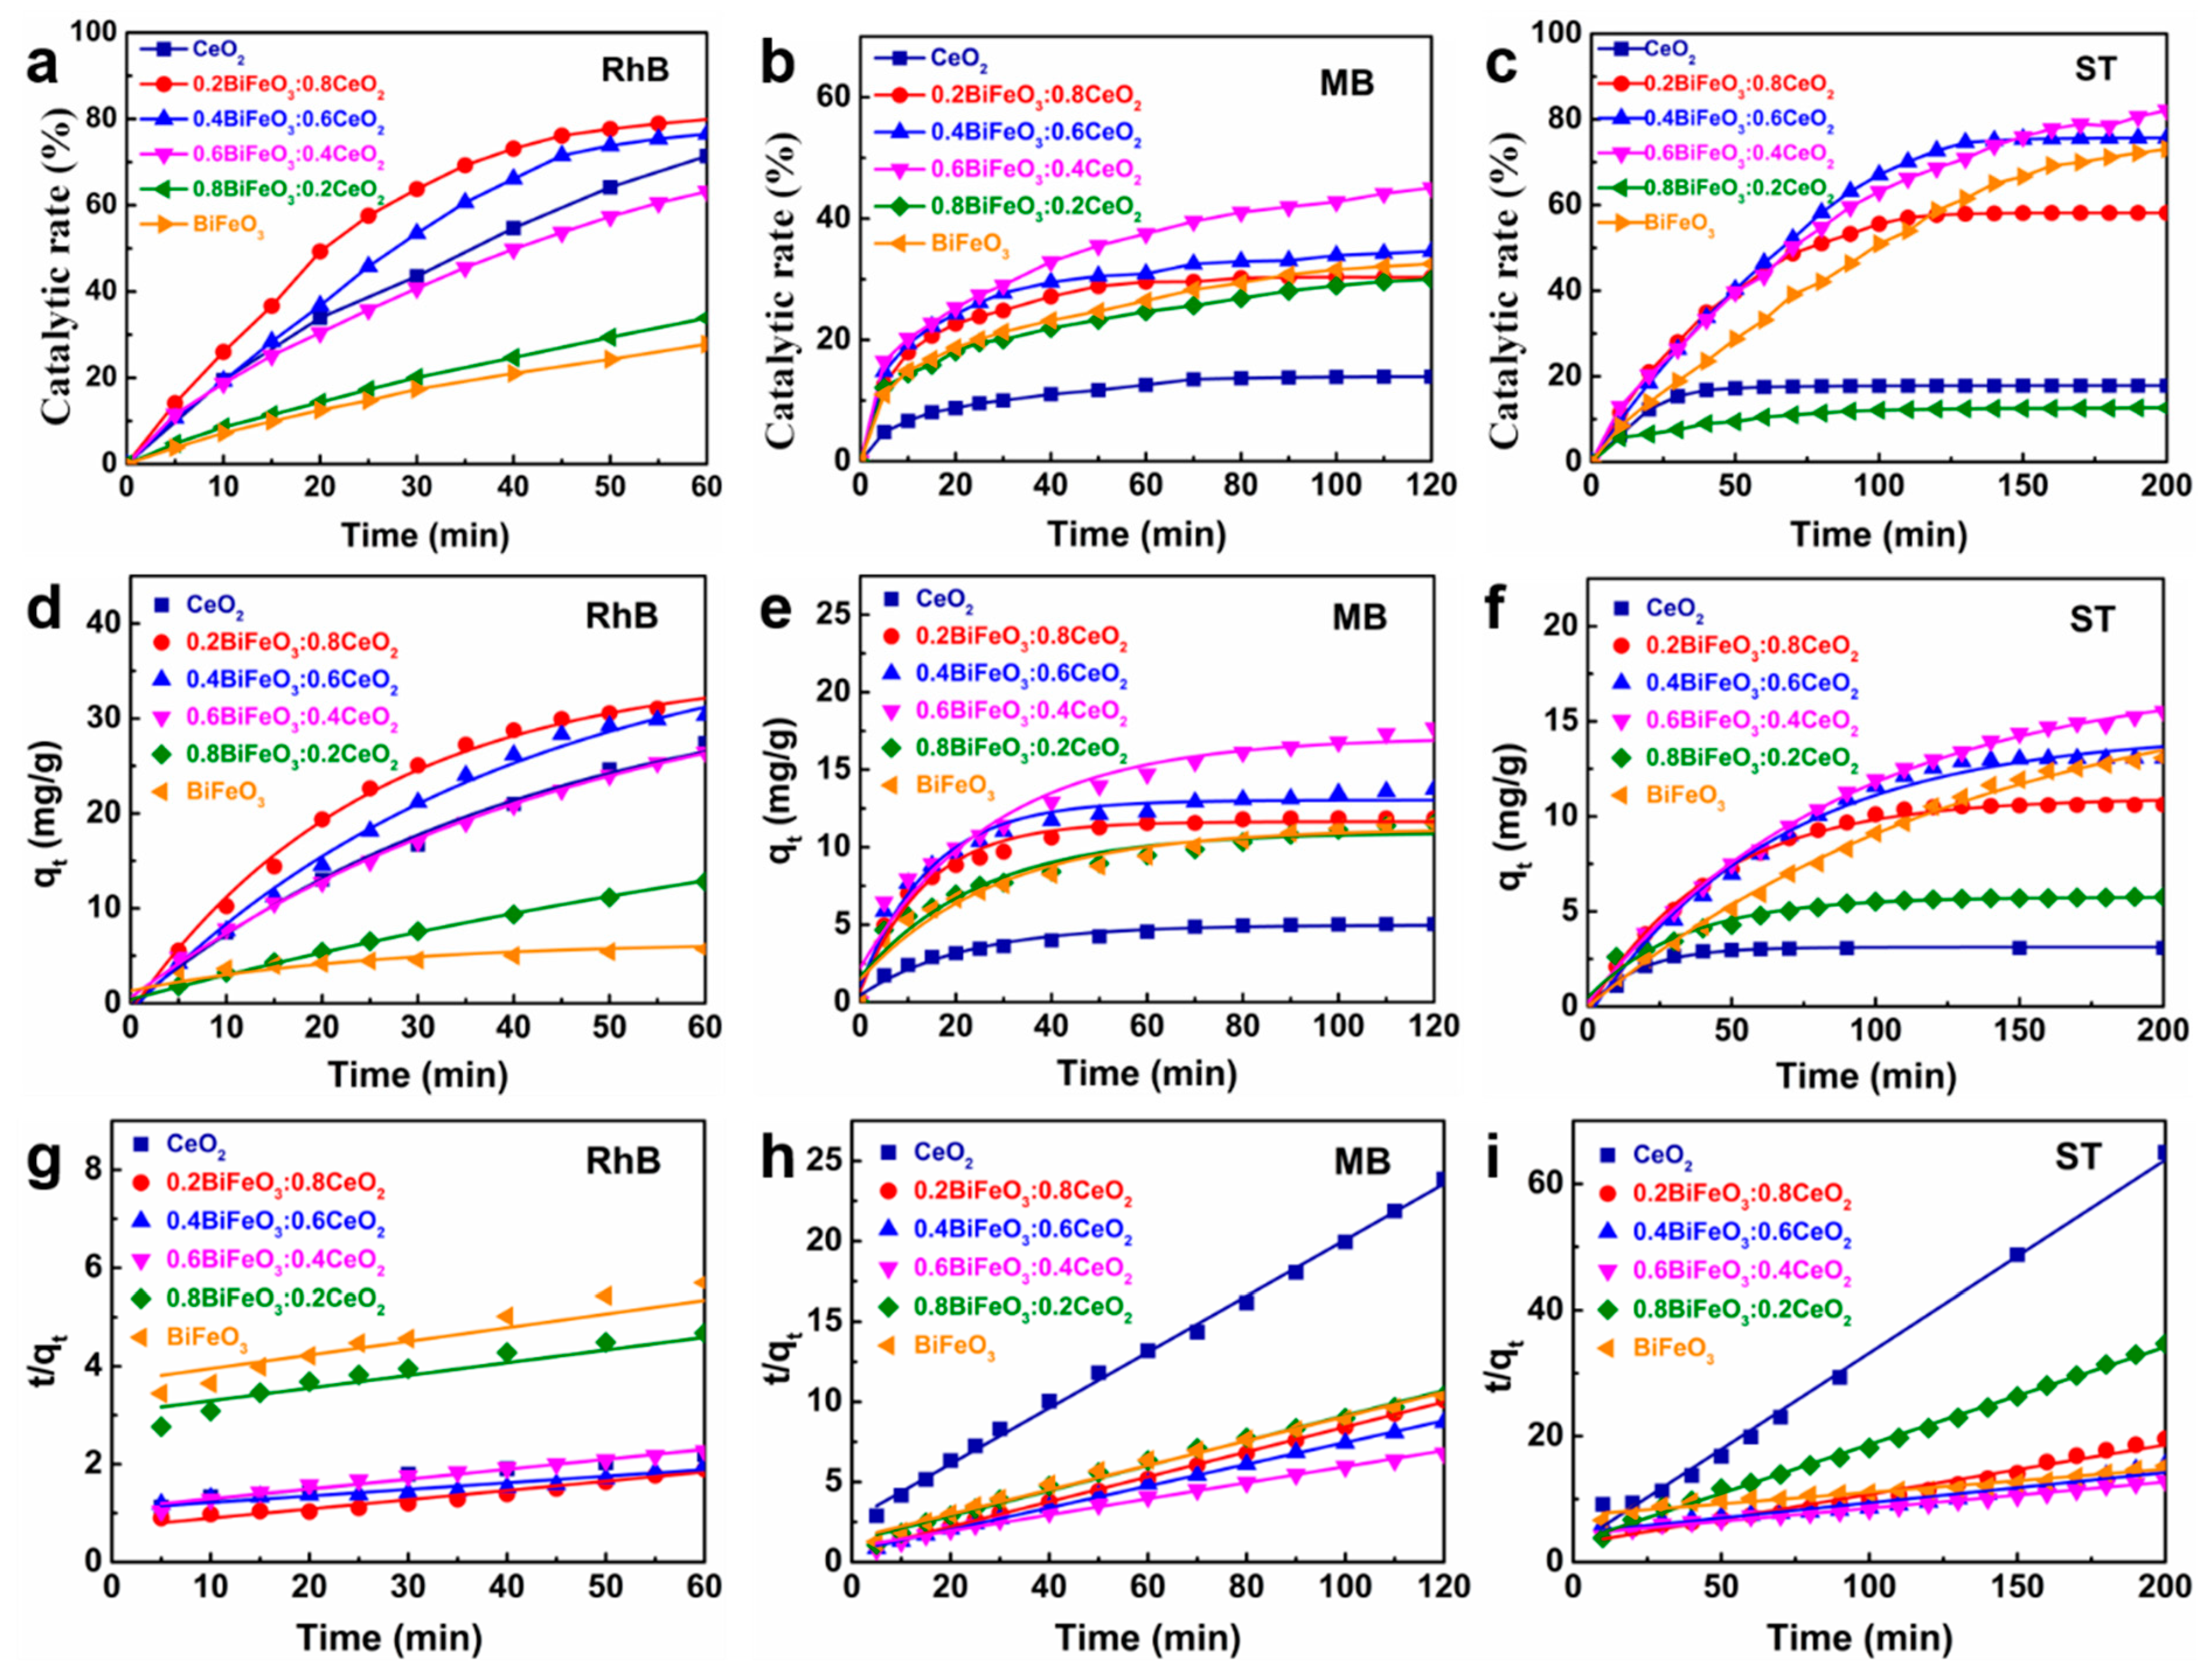
| Dye | Catalyst | Pseudo-First-Order Kinetics | Pseudo-Second-Order Kinetics | ||||
|---|---|---|---|---|---|---|---|
| qe (mg g−1) | R2 | K1 (10−2 min−1) | qe (mg g−1) | R2 | K2 (10−4 g mg−1 min−1) | ||
| RhB | CeO2 | 27.31 | 0.996 | 2.380 | 49.02 | 0.984 | 3.857 |
| 0.2BiFeO3:0.8CeO2 | 32.13 | 0.995 | 4.048 | 52.94 | 0.958 | 5.050 | |
| 0.4BiFeO3:0.6CeO2 | 31.04 | 0.994 | 2.539 | 74.29 | 0.915 | 1.677 | |
| 0.6BiFeO3:0.4CeO2 | 26.29 | 0.999 | 2.087 | 49.95 | 0.988 | 3.661 | |
| 0.8BiFeO3:0.2CeO2 | 13.03 | 0.999 | 0.884 | 38.61 | 0.950 | 2.209 | |
| BiFeO3 | 5.83 | 0.874 | 3.967 | 35.98 | 0.966 | 2.102 | |
| MB | CeO2 | 4.97 | 0.973 | 4.562 | 5.73 | 0.997 | 115.498 |
| 0.2BiFeO3:0.8CeO2 | 11.65 | 0.978 | 7.274 | 12.85 | 0.999 | 92.706 | |
| 0.4BiFeO3:0.6CeO2 | 13.03 | 0.966 | 6.867 | 14.73 | 0.999 | 68.080 | |
| 0.6BiFeO3:0.4CeO2 | 17.09 | 0.958 | 3.557 | 19.93 | 0.992 | 26.842 | |
| 0.8BiFeO3:0.2CeO2 | 10.95 | 0.934 | 3.937 | 12.77 | 0.990 | 46.602 | |
| BiFeO3 | 11.20 | 0.953 | 3.504 | 13.13 | 0.990 | 39.497 | |
| ST | CeO2 | 3.12 | 0.990 | 5.717 | 3.27 | 0.993 | 357.392 |
| 0.2BiFeO3:0.8CeO2 | 10.96 | 0.997 | 2.288 | 12.71 | 0.976 | 21.482 | |
| 0.4BiFeO3:0.6CeO2 | 14.38 | 0.990 | 1.515 | 20.81 | 0.947 | 5.012 | |
| 0.6BiFeO3:0.4CeO2 | 17.44 | 0.998 | 1.114 | 23.98 | 0.988 | 3.969 | |
| 0.8BiFeO3:0.2CeO2 | 5.75 | 0.975 | 3.010 | 6.44 | 0.997 | 76.517 | |
| BiFeO3 | 13.35 | 0.997 | 0.726 | 27.19 | 0.959 | 1.829 | |
Disclaimer/Publisher’s Note: The statements, opinions and data contained in all publications are solely those of the individual author(s) and contributor(s) and not of MDPI and/or the editor(s). MDPI and/or the editor(s) disclaim responsibility for any injury to people or property resulting from any ideas, methods, instructions or products referred to in the content. |
© 2023 by the authors. Licensee MDPI, Basel, Switzerland. This article is an open access article distributed under the terms and conditions of the Creative Commons Attribution (CC BY) license (https://creativecommons.org/licenses/by/4.0/).
Share and Cite
Li, L.; Li, Q.; Wang, D.; Zhang, Y.; Li, F.; Zhang, Y.; Jiao, T. Fabrication of Self-Assembled BiFeO3/CeO2 Nanocatalytic Materials for Efficient Catalytic Dye Degradation. Nanomaterials 2023, 13, 2545. https://doi.org/10.3390/nano13182545
Li L, Li Q, Wang D, Zhang Y, Li F, Zhang Y, Jiao T. Fabrication of Self-Assembled BiFeO3/CeO2 Nanocatalytic Materials for Efficient Catalytic Dye Degradation. Nanomaterials. 2023; 13(18):2545. https://doi.org/10.3390/nano13182545
Chicago/Turabian StyleLi, Lin, Qi Li, Dongqing Wang, Yubo Zhang, Fei Li, Yaru Zhang, and Tifeng Jiao. 2023. "Fabrication of Self-Assembled BiFeO3/CeO2 Nanocatalytic Materials for Efficient Catalytic Dye Degradation" Nanomaterials 13, no. 18: 2545. https://doi.org/10.3390/nano13182545
APA StyleLi, L., Li, Q., Wang, D., Zhang, Y., Li, F., Zhang, Y., & Jiao, T. (2023). Fabrication of Self-Assembled BiFeO3/CeO2 Nanocatalytic Materials for Efficient Catalytic Dye Degradation. Nanomaterials, 13(18), 2545. https://doi.org/10.3390/nano13182545