Article

Photoluminescence of Two-Dimensional MoS2 Nanosheets Produced by Liquid Exfoliation

by
Mikhail Y. Lukianov
1,
Anna A. Rubekina
2,
Julia V. Bondareva
1,
Andrey V. Sybachin
3,
George D. Diudbin
4,
Konstantin I. Maslakov
3,
Dmitry G. Kvashnin
5,
Olga G. Klimova-Korsmik
6,
Evgeny A. Shirshin
2 and
Stanislav A. Evlashin
1,*
1
Skolkovo Institute of Science and Technology, 121205 Moscow, Russia
2
Department of Physics, Lomonosov Moscow State University, 119991 Moscow, Russia
3
Department of Chemistry, Lomonosov Moscow State University, 119991 Moscow, Russia
4
Institute of Nanotechnology of Microelectronics of the Russian Academy of Sciences, 119991 Moscow, Russia
5
Emanuel Institute of Biochemical Physics of the Russian Academy of Sciences, 119334 Moscow, Russia
6
World-Class Research Center “Advanced Digital Technologies”, State Marine Technical University, 190121 Saint Petersburg, Russia
*
Author to whom correspondence should be addressed.
Nanomaterials 2023, 13(13), 1982; https://doi.org/10.3390/nano13131982
Submission received: 31 May 2023 / Revised: 23 June 2023 / Accepted: 27 June 2023 / Published: 30 June 2023
(This article belongs to the Special Issue 2D Structured Materials: Synthesis, Properties and Applications)

Abstract

:
Extraordinary properties of two-dimensional materials make them attractive for applications in different fields. One of the prospective niches is optical applications, where such types of materials demonstrate extremely sensitive performance and can be used for labeling. However, the optical properties of liquid-exfoliated 2D materials need to be analyzed. The purpose of this work is to study the absorption and luminescent properties of MoS2 exfoliated in the presence of sodium cholate, which is the most often used surfactant. Ultrasound bath and mixer-assisted exfoliation in water and dimethyl sulfoxide were used. The best quality of MoS2 nanosheets was achieved using shear-assisted liquid-phase exfoliation as a production method and sodium cholate (SC) as a surfactant. The photoluminescent properties of MoS2 nanosheets varied slightly when changing the surfactant concentrations in the range C(SC) = 0.5–2.5 mg/mL. This work is of high practical importance for further enhancement of MoS2 photoluminescent properties via chemical functionalization.

1. Introduction

Two-dimensional materials are considered an extremely promising solution for the future generation of electronics [1]. In particular, transition metal dichalcogenides (TMDs) have attracted considerable attention in the research community due to their unique mechanical [2,3], optical [4,5,6,7,8,9,10] and electrical properties [11,12]. The natural abundance of TMDs, as well as their tunable band gap in the visible and near-infrared ranges [13,14], make them ideal candidates for future optoelectronic devices. The MoS2 band gap changes from an indirect band gap of 1.1 eV in the bulk form to a direct band gap of 1.9 eV as the thickness decreases to a monolayer [15], which gives a great advantage over graphene [16]. Due to such bandgap transition, molybdenum disulfide is used as the main material for optical sensors, field-effect transistors [17,18], single-photon emitters [19,20,21], wearable electronic devices based on the piezophototronic effect [22] and ultrasensitive photodetectors [12], as well as for many other potential applications [23].
For the mass production of two-dimensional materials, mechanical and liquid exfoliation is mainly used [24,25]. Compared to mechanical exfoliation, liquid phase exfoliation (LPE) has several outstanding advantages, such as simple and scalable production, separation of nanosheets of different sizes and thicknesses, further chemical functionalization with other materials, ease of transfer to substrates and creation of thin films. [26,27]. Dispersibility of exfoliated nanosheets TMDs exhibits a relatively low variance among different compounds [28]. As a result, a lot of data obtained for representative TMD materials such as MoS2 and WS2 can be generalized to the entire TMD class. Liquid phase exfoliation of MoS2 can be accomplished by sonication or by shear force. However, a recent study has shown that the sonication method is not suitable for scalable industrial production [29]. In contrast, it has recently been demonstrated that shear separation using simple kitchen blenders [30] and high-shear rotor stator mixers [29] has the potential for large-scale production [31]. The main advantage of this approach is much higher volumes and production rates (reaching values of ~1 mg/min for MoS2 [26]) compared to sonication. Moreover, the same method applied to WS2 has been reported to achieve throughput rates of up to 0.95 g/h [29].
In addition to physical treatment, LPE requires the choice of solvents and surfactants, which largely determine the separation efficiency and quality of the nanosheets [32,33,34]. The most popular approach is the use of highly polar solvents, including N-methylpyrrolidone (NMP), N,N-dimethylformamide (DMF), and several others [35]. In general, amine-based solvents are the most effective for obtaining exfoliated MoS2 nanosheets and their further chemical modification, but their high boiling points as well as high toxicity make solvent removal difficult and carry health risks [36]. Successful exfoliation and stable MoS2 dispersions in the less toxic dimethylsulfoxide (DMSO) have also been reported with concentrations similar to those of NMP [37,38]. Other environmentally friendly alternatives are aqueous media with various surfactants, such as sodium cholate [39] and sodium deoxycholate [40] or polymers [41]. The covers nanosheets, which prevents their aggregation, stabilizes the resulting solution, and allows high production rates to be achieved. Moreover, such additives can interact with 2D materials and change their electronic structures and optoelectronic properties [42].
It is also worth mentioning that the inherent photoluminescence (PL) quantum yield (QY) of TMDs is extremely low: MoS2 is reported to have a maximum QY of 0.6% [43]. That, in turn, significantly hinders the practical utilization of monolayer and few-layer MoS2 in photonic, photocatalytic, and photovoltaic applications. Therefore, the chemical functionalization and surface modification of exfoliated MoS2 with various metals, salts, and organic and polymer molecules to enhance its catalytic and photoluminescent properties is an urgent task [44,45,46] and has important practical significance. For example, it was previously demonstrated that using chemical treatment on CVD-grown MoS2 samples it is possible to achieve QY as high as 30% [47]. In multilayer graphene introduction of surface functionalization in conjunction with varied stacking configurations presents a compelling avenue for inducing desirable electronic properties. This holds promise for diverse applications, including field-emission displays [48]. Hybridization, in particular, plays a crucial role in chemical functionalization. The attachment of functional groups or chemical species to a material’s surface can lead to their interaction with the underlying atoms or molecules through bonding interactions. These bonding interactions often involve the hybridization of atomic orbitals. Comprehension of the hybridization processes involved is essential for predicting and controlling the properties and reactivity of functionalized materials. Tantardini et al. showed that pressure-induced hybridization changes in silicene enable its use as a field-effect transistor-based pressure sensor [49]. However, until now, studies have not been focused on investigating the dependence of the photoluminescent properties of MoS2 solutions on the surfactant concentration, which is of practical importance for the creation of TMD-based organic electronics and the production of thin films by depositing exfoliated flakes on a substrate [50,51,52]. The purpose of this work is to determine the effect of sodium cholate as the most common surfactant on the optical (electronic) properties of exfoliated MoS2 in water and DMSO.

2. Materials and Methods

2.1. Materials

Bulk MoS2 powder (<2 μm, 99%, Aldrich, Darmstadt, Germany), dimethyl sulfoxide (DMSO, RusChim, Moscow, Russia), sodium cholate (99%, Sigma-Aldrich, Darmstadt, Germany) and bidistilled water were used as received.

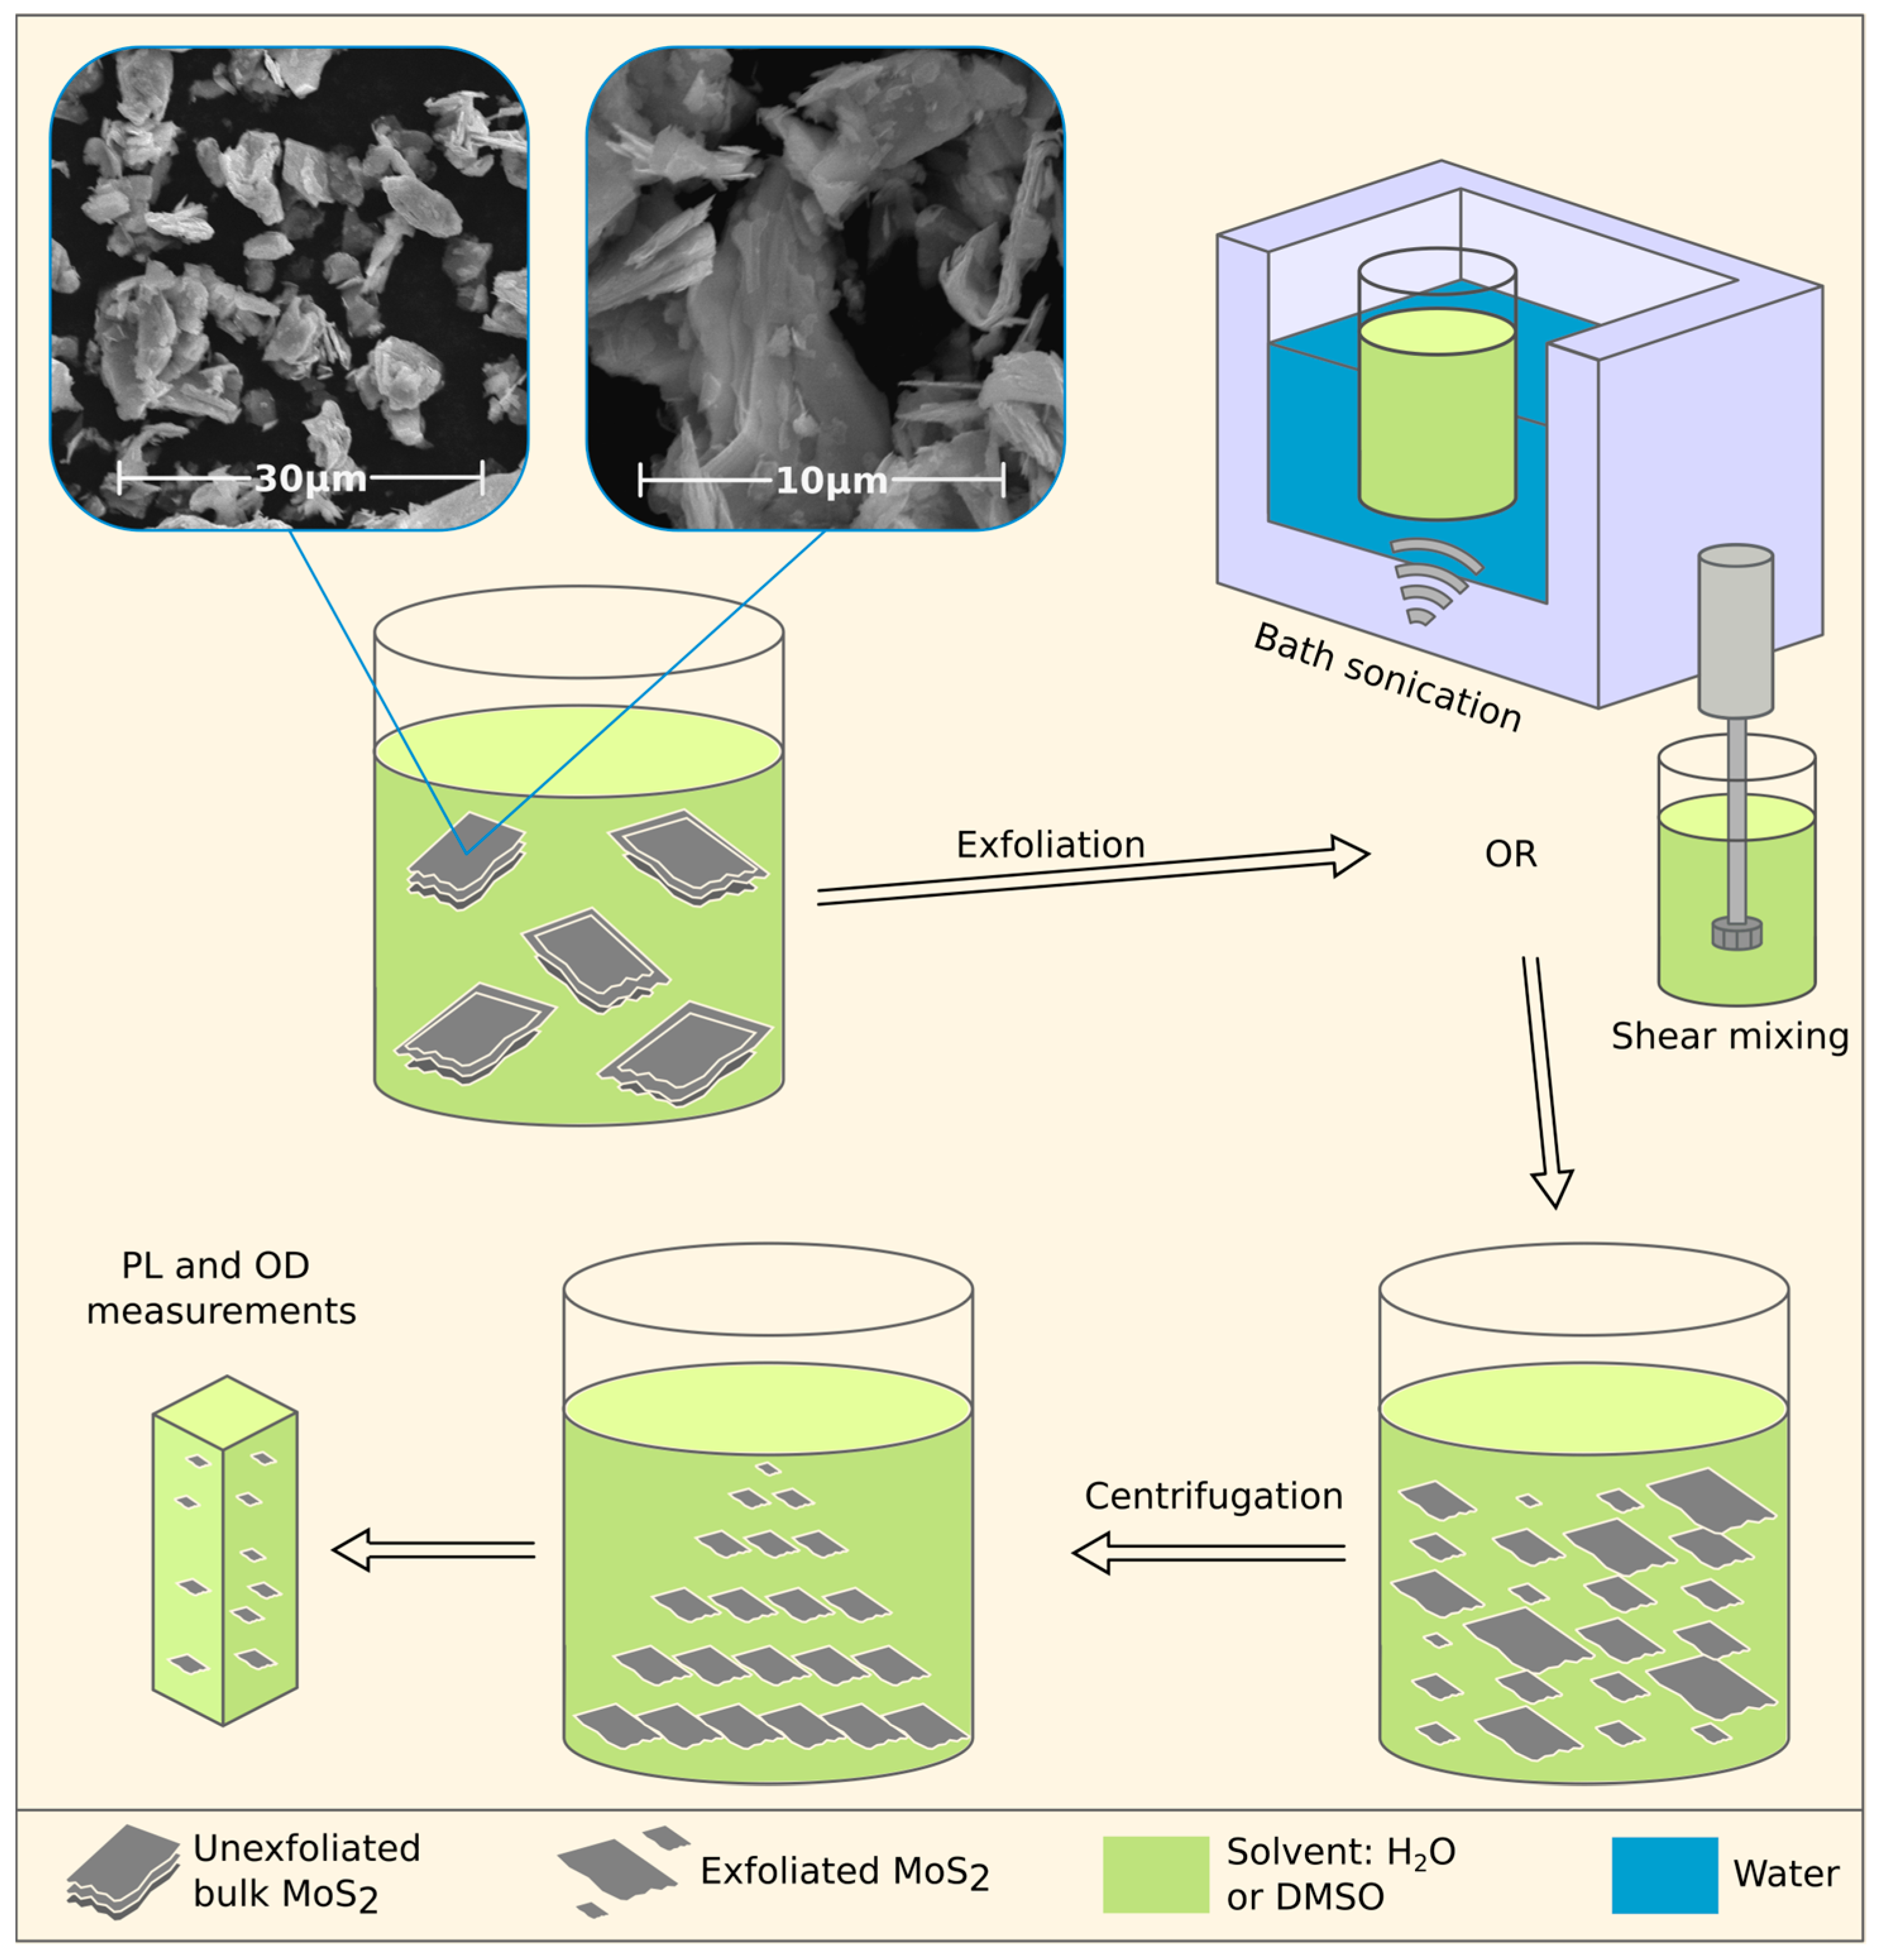
2.2. MoS2 Liquid Exfoliation

Direct exfoliation of MoS2 into colloidal nanosheets was carried out in an organic solvent (DMSO) and pure water. To improve the dispersing ability of molybdenum disulfide, a surfactant (sodium cholate) was added to the reaction medium, the interaction of which with nanosheets via noncovalent mechanisms plays an important role in the stabilization of dispersions. The dispersions with MoS2 concentration of 2.5 mg/mL and with various surfactant (sodium cholate) concentrations in the range from 0.25 to 2.5 mg/mL in pure water and DMSO were prepared using shear force-promoted and sonication-promoted exfoliation. The mixtures were sonicated for 1 h in an ultrasonic (US) bath sonicator (Psb-Gals, Moscow, Russia, 40 kHz, 300 W) or mixed for 2 h with an immersion disperser (Polytron PT 10-35 GT, Kinematica AG, Malters, Switzerland) with a PT-DA 36/2EC-F250 rotating blade at half maximum rotor speed. After exfoliation, the prepared solutions were centrifuged at 1500 rpm for 45 min using a centrifuge (OPN-16, Labtex, Taipei, Taiwan) to remove the unexfoliated MoS2 or thick flakes. The upper fraction of each solution was taken for further characterization and analysis. Detailed information about sample preparation is presented in Figure 1 and Table 1.

2.3. Characterization

Optical properties of the prepared dispersions were characterized in 10 mm path length cuvettes. Ultraviolet–visible (UV-vis) absorption spectra were recorded with a Cary 5000 UV-Vis-NIR spectrophotometer, and PL spectra were recorded using a Horiba FluroMax 4 spectrofluorometer (HORIBA Jobin Yvon, Kyoto, Japan, Japan–France). Optical density (OD) was detected in the 300–800 nm optical range. Fluorescence spectra were recorded at z-x excitation wavelengths. The emission of fluorescence was detected at 300–360 nm. To diminish agglomeration, all samples were subjected to additional centrifugation before measurements. To minimize possible re-absorption and scattering effect effects [28], all samples from Table 2 were centrifuged using an Eppendorf MiniSpin Centrifuge and diluted to achieve an optical density of less than 0.2 in the wavelength range of 300–360 nm, which corresponds to the excitation wavelengths used for PL measurements. Initial (Ci) and final (Cf) concentrations of MoS2 and sodium cholate can be found in Table 2.
XPS spectra were acquired on an Axis Ultra DLD spectrometer (Kratos Analytical, Manchester, UK) with a monochromatic AlKα radiation source (hν = 1486.69 eV, 150 W). The pass energies of the analyzer were 160 eV for survey spectra and 40 eV for high-resolution scans.

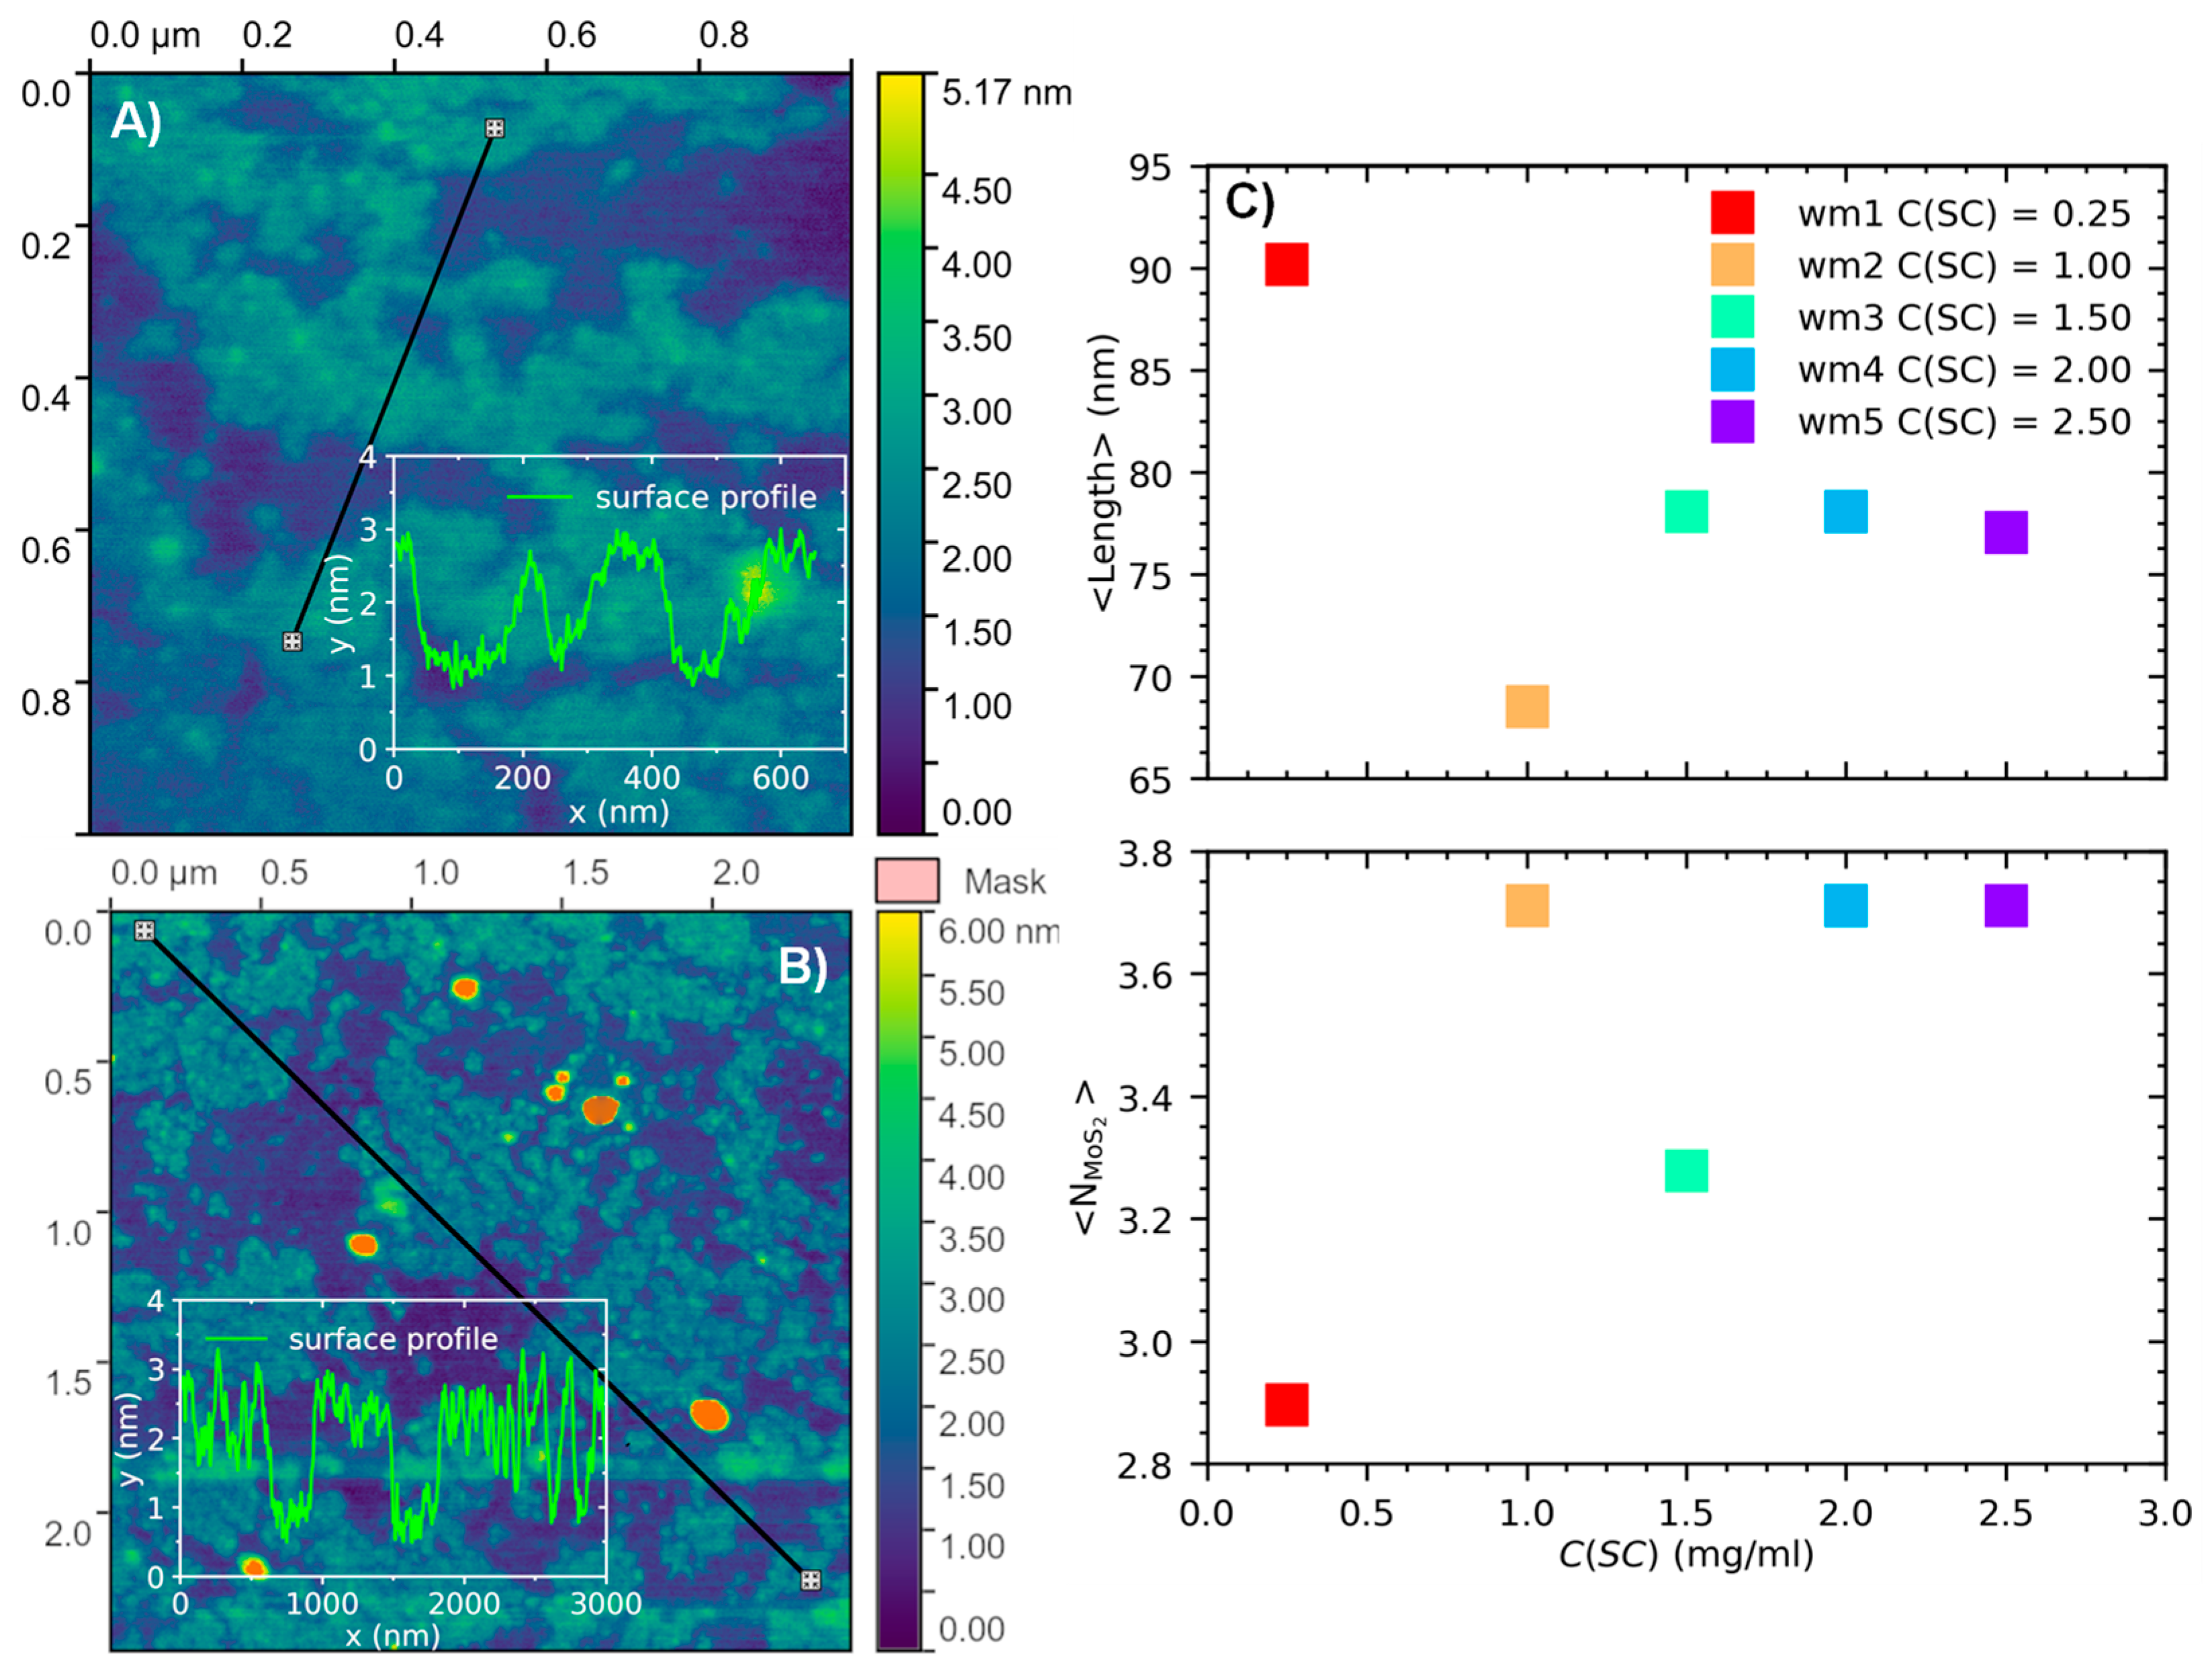
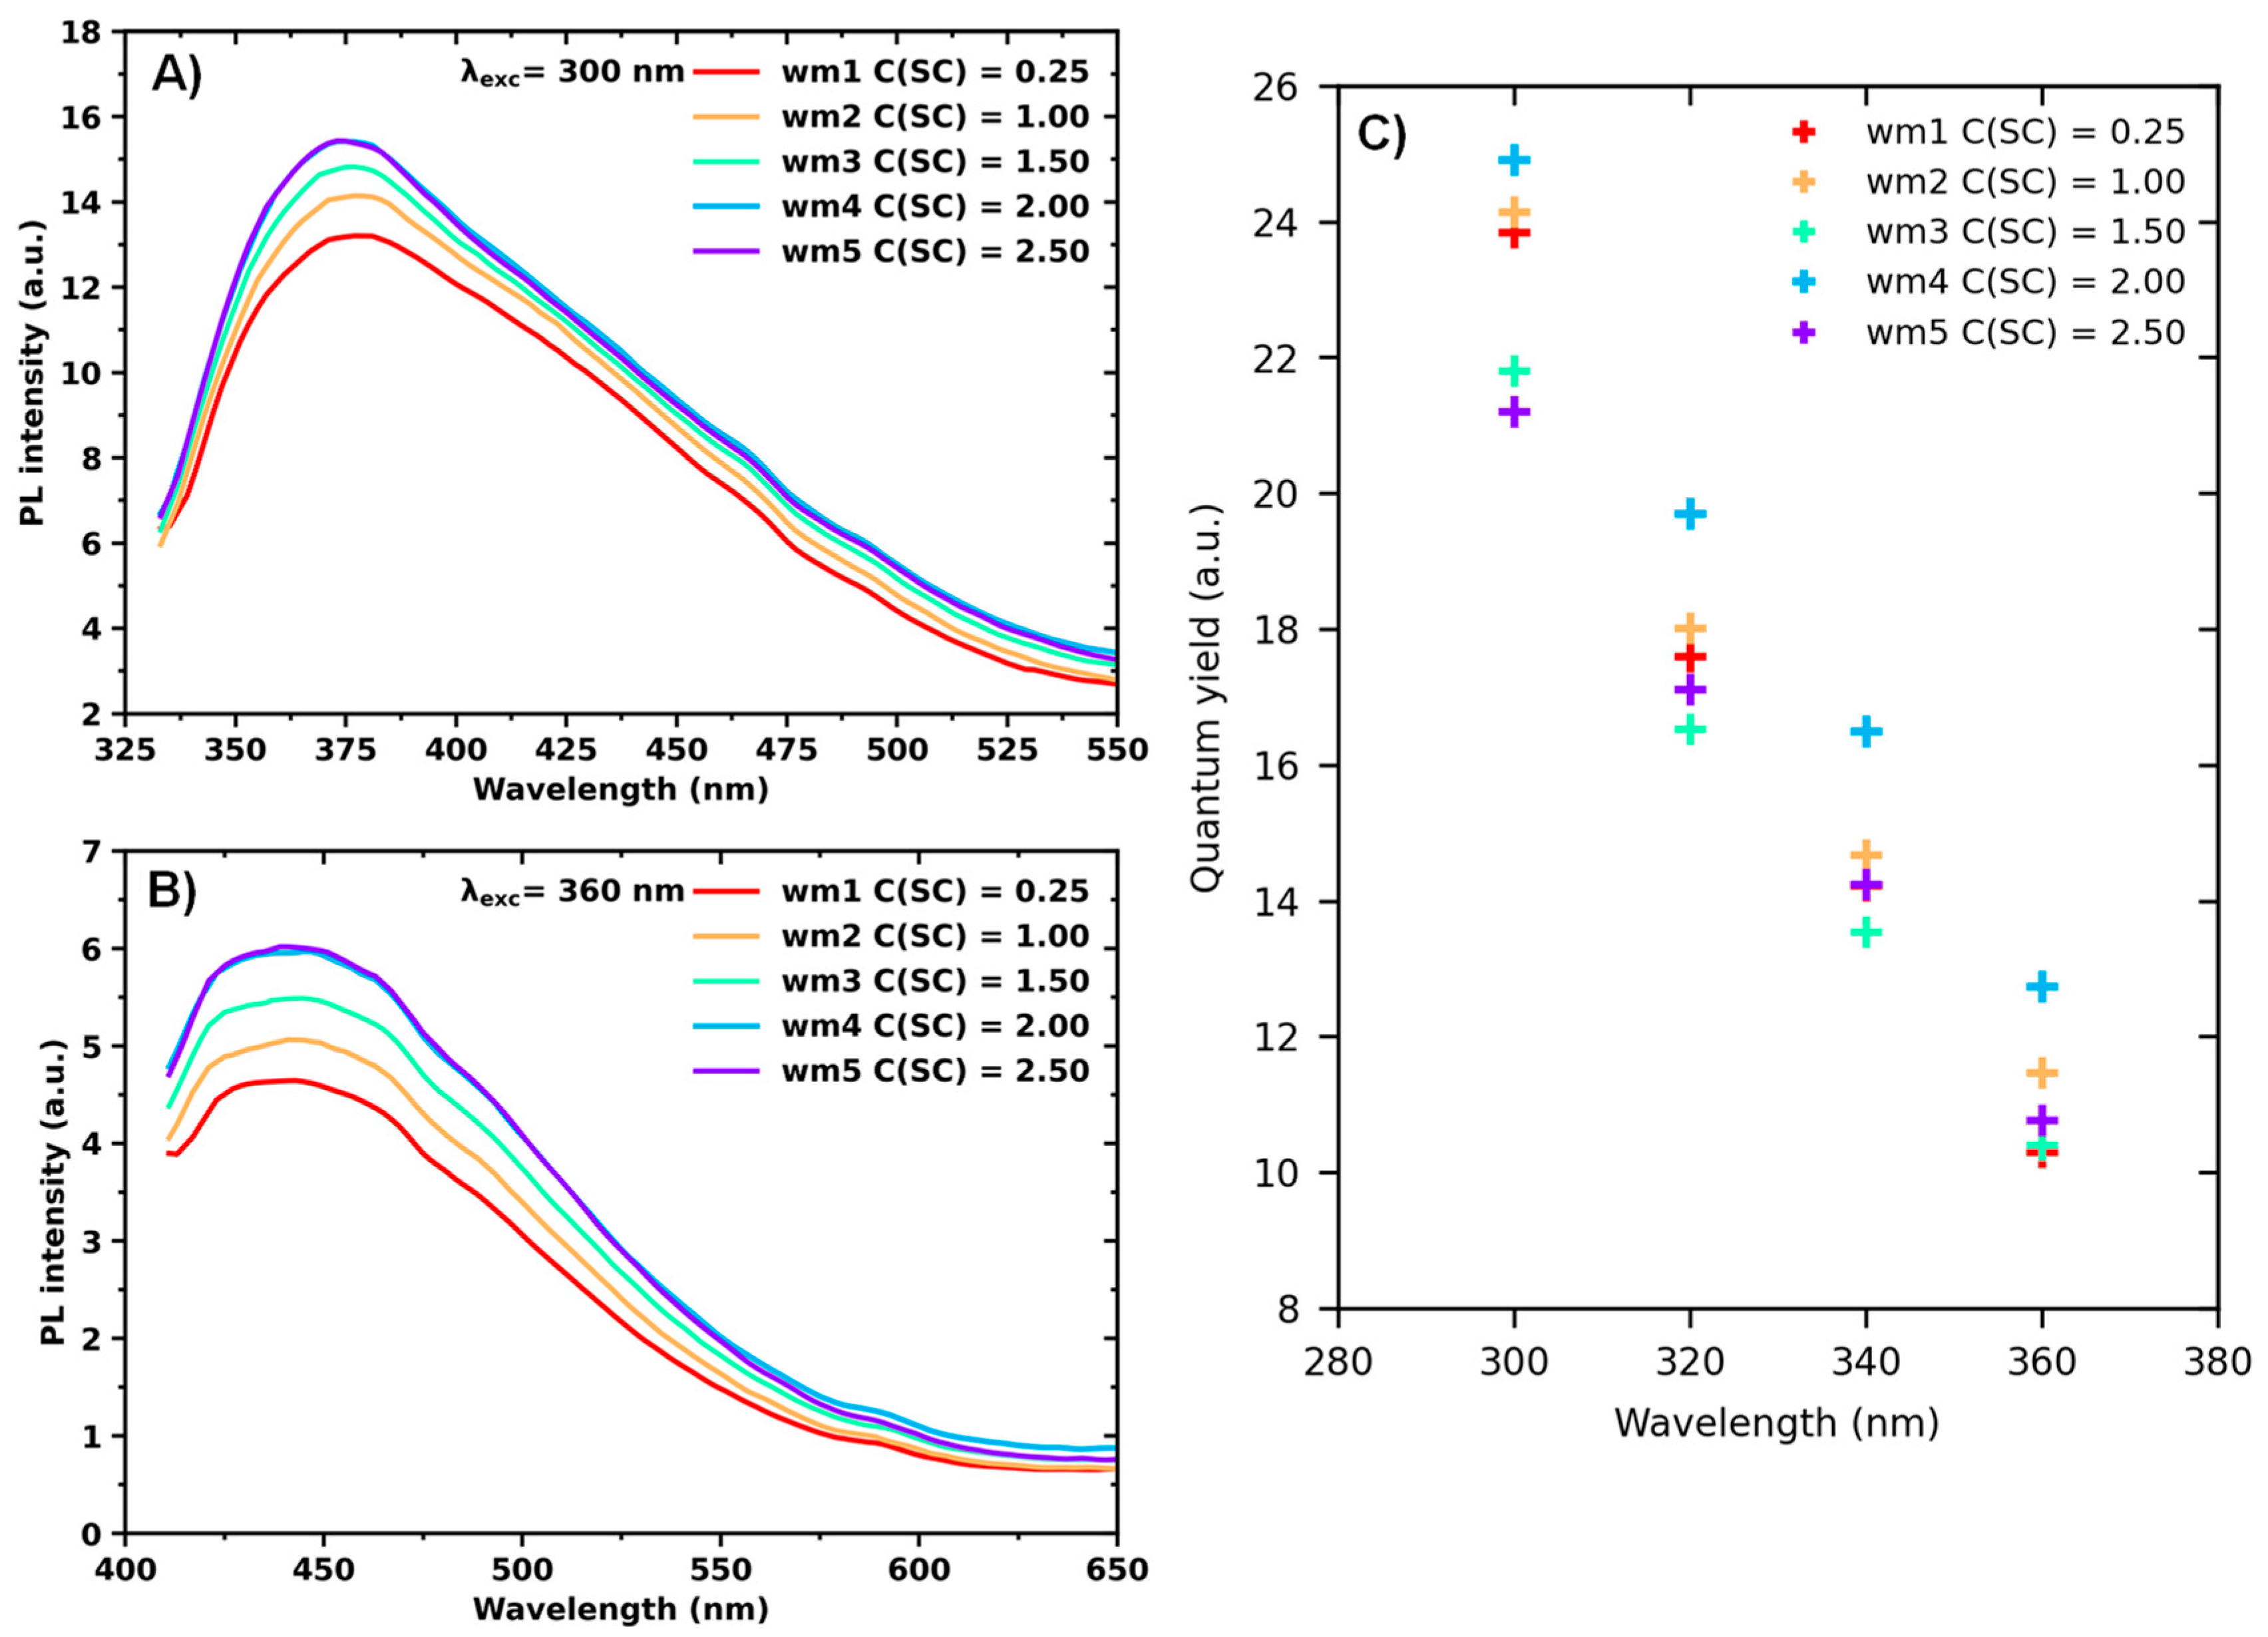
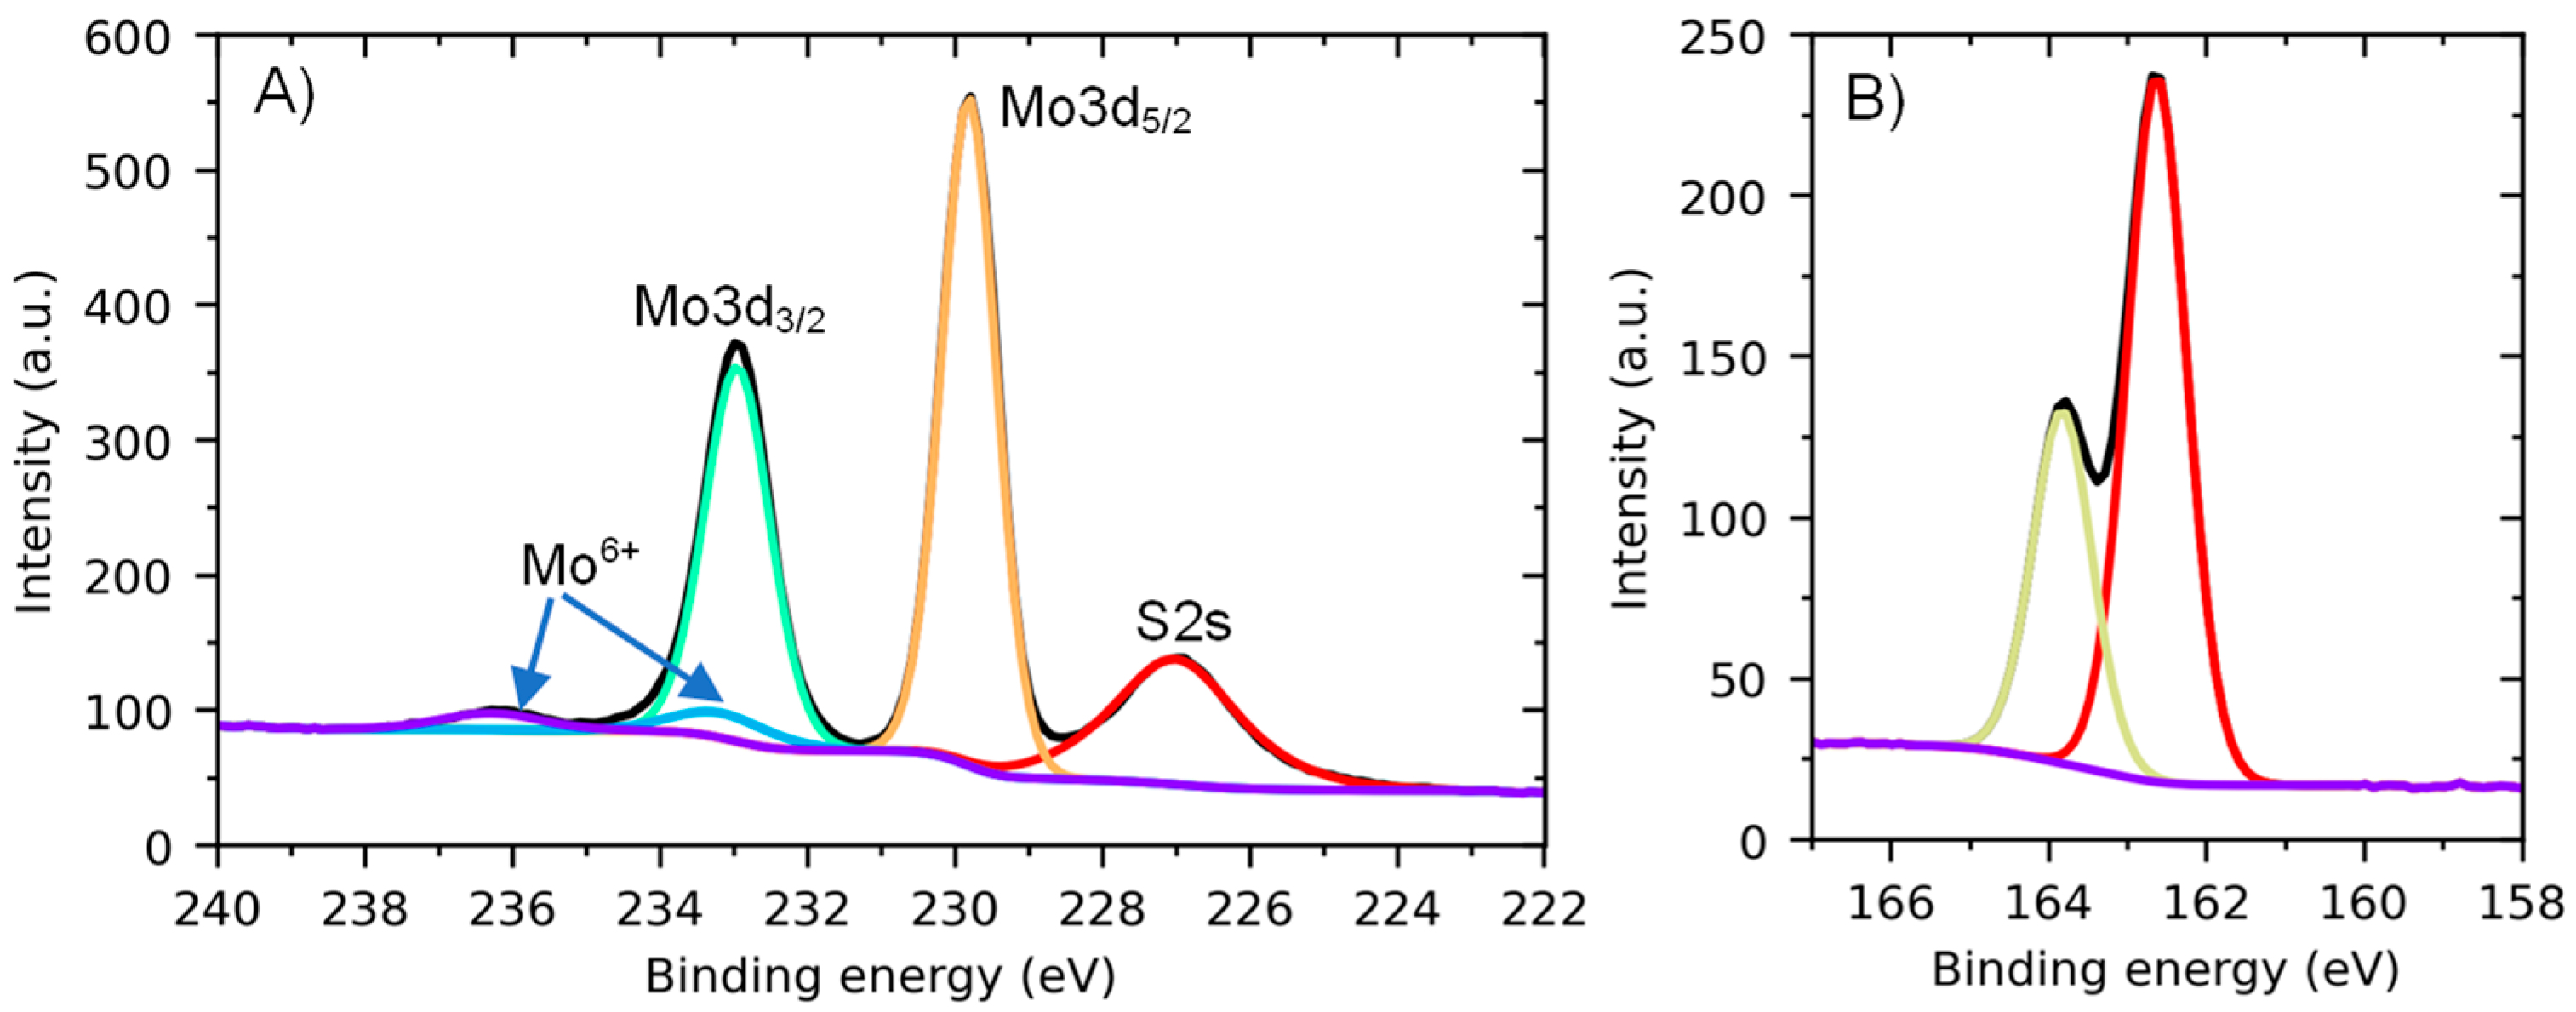
3. Results and Discussion
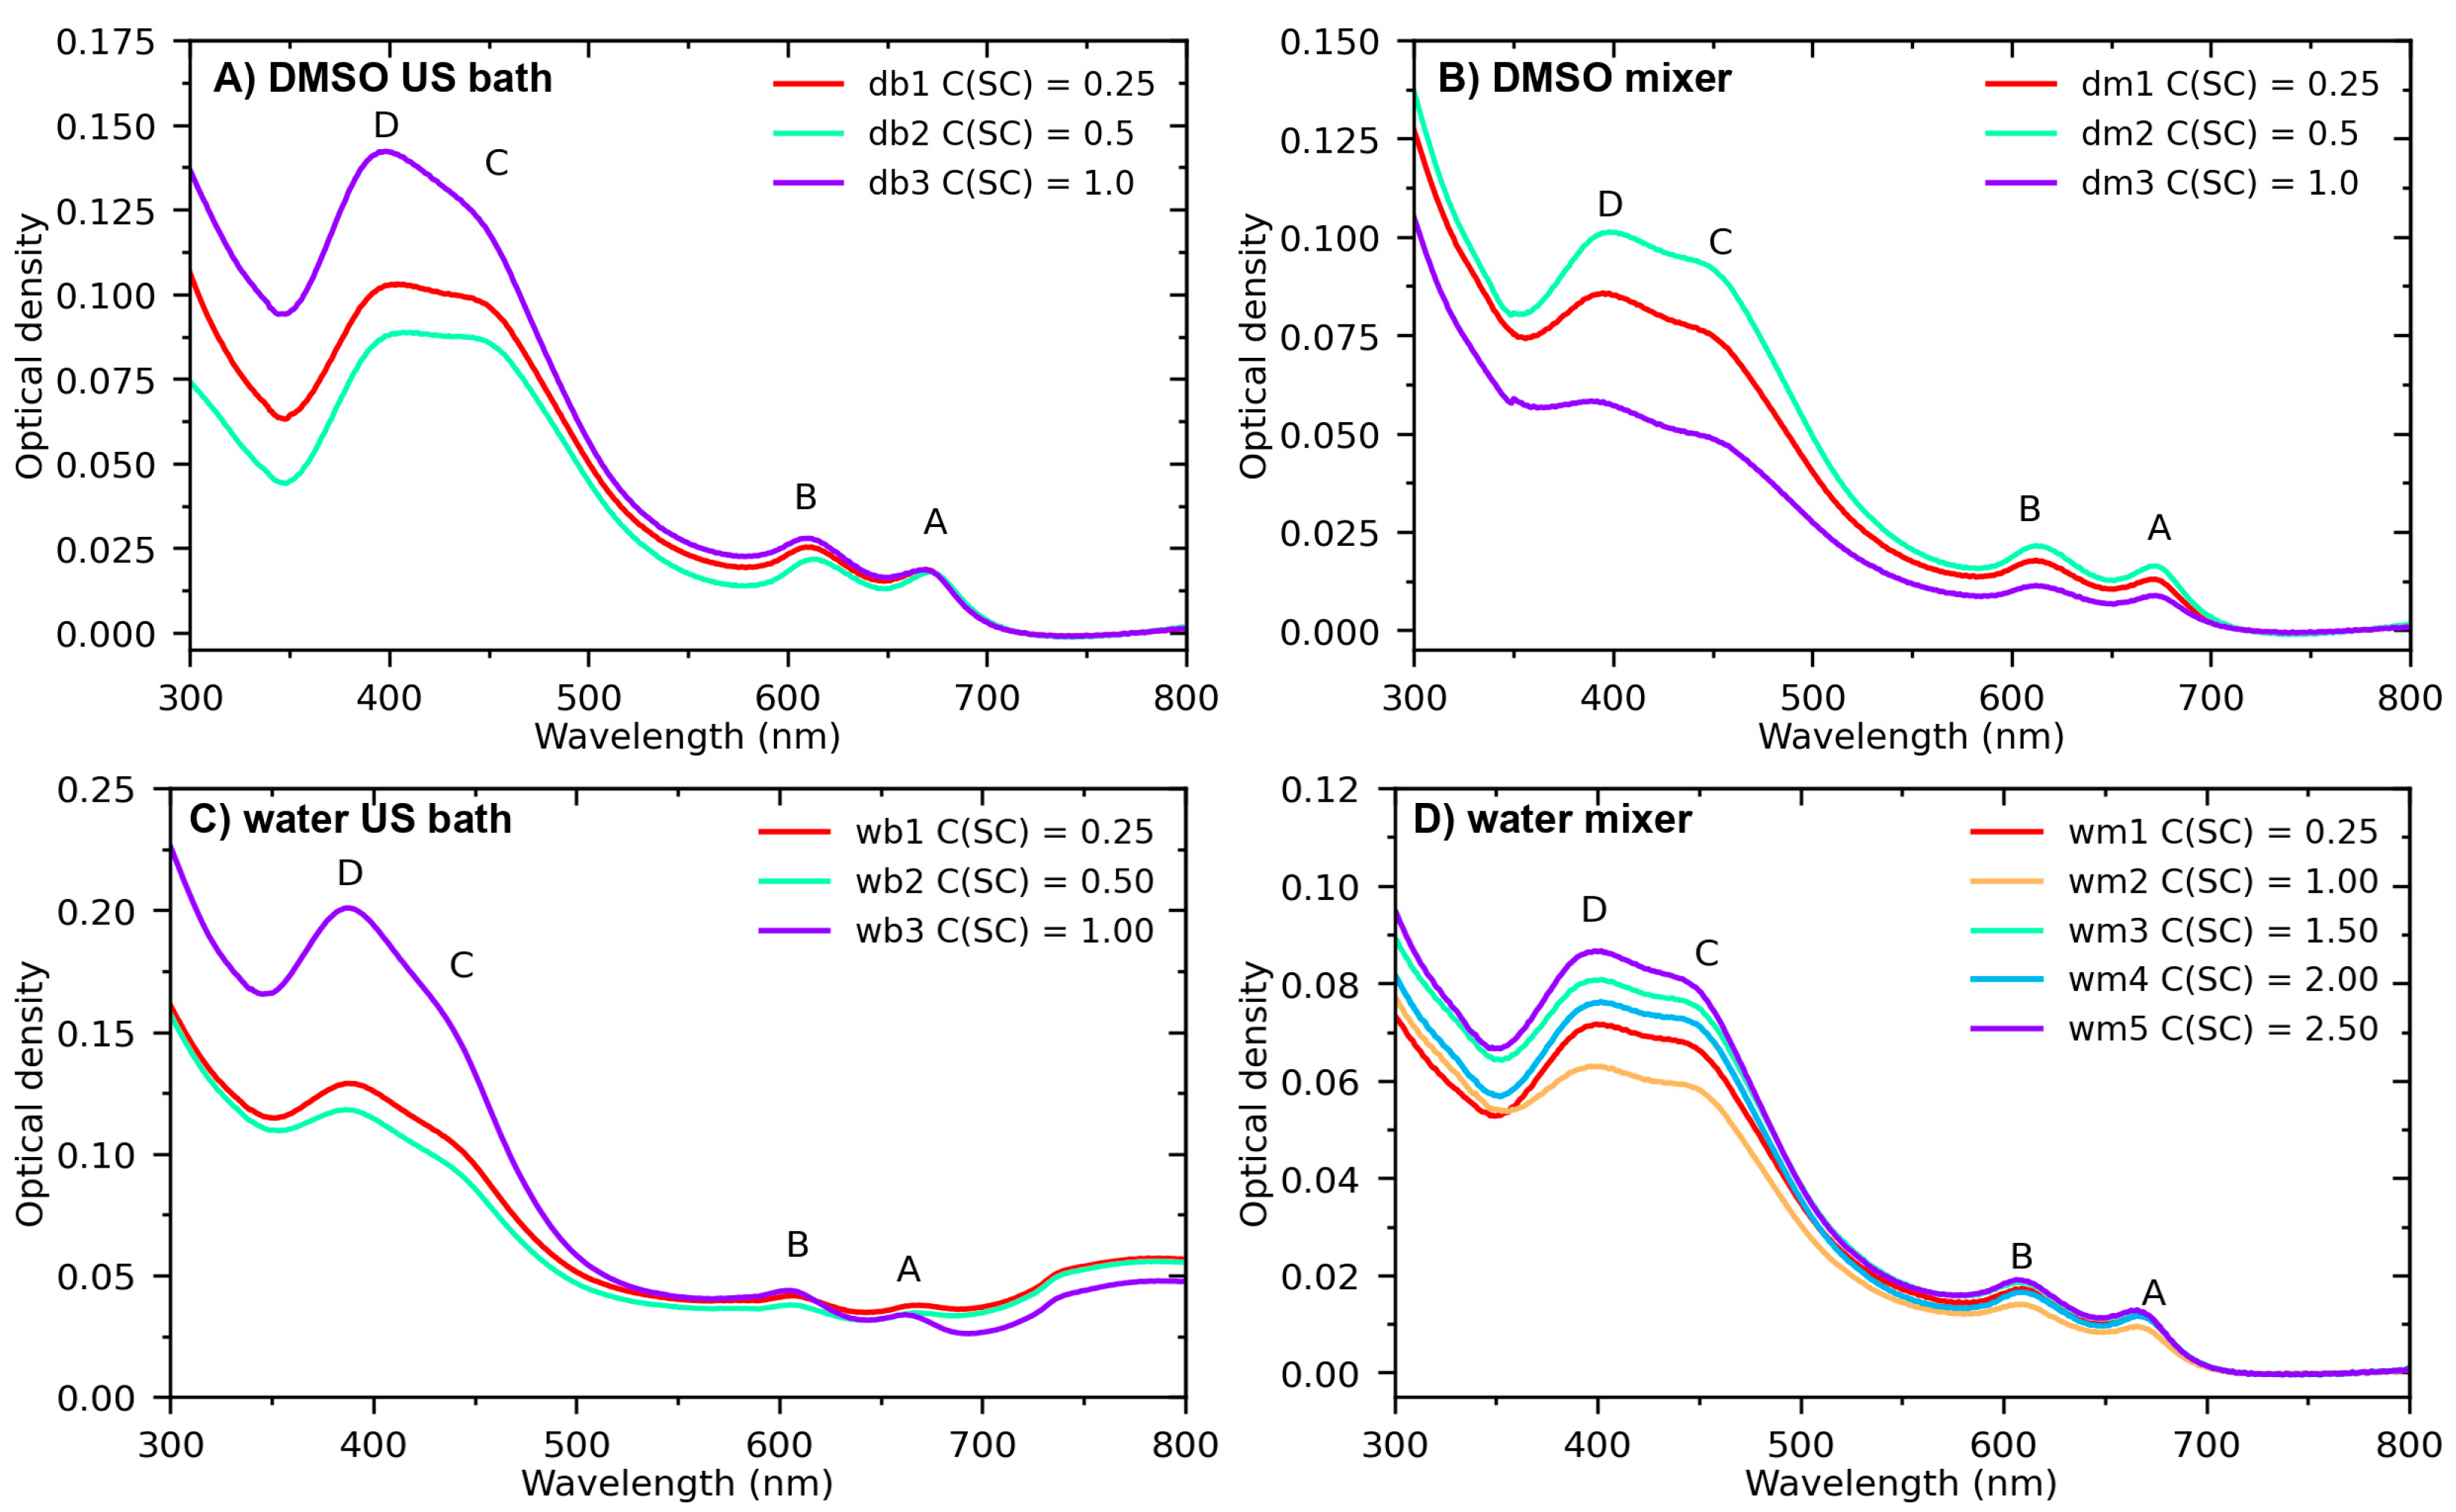
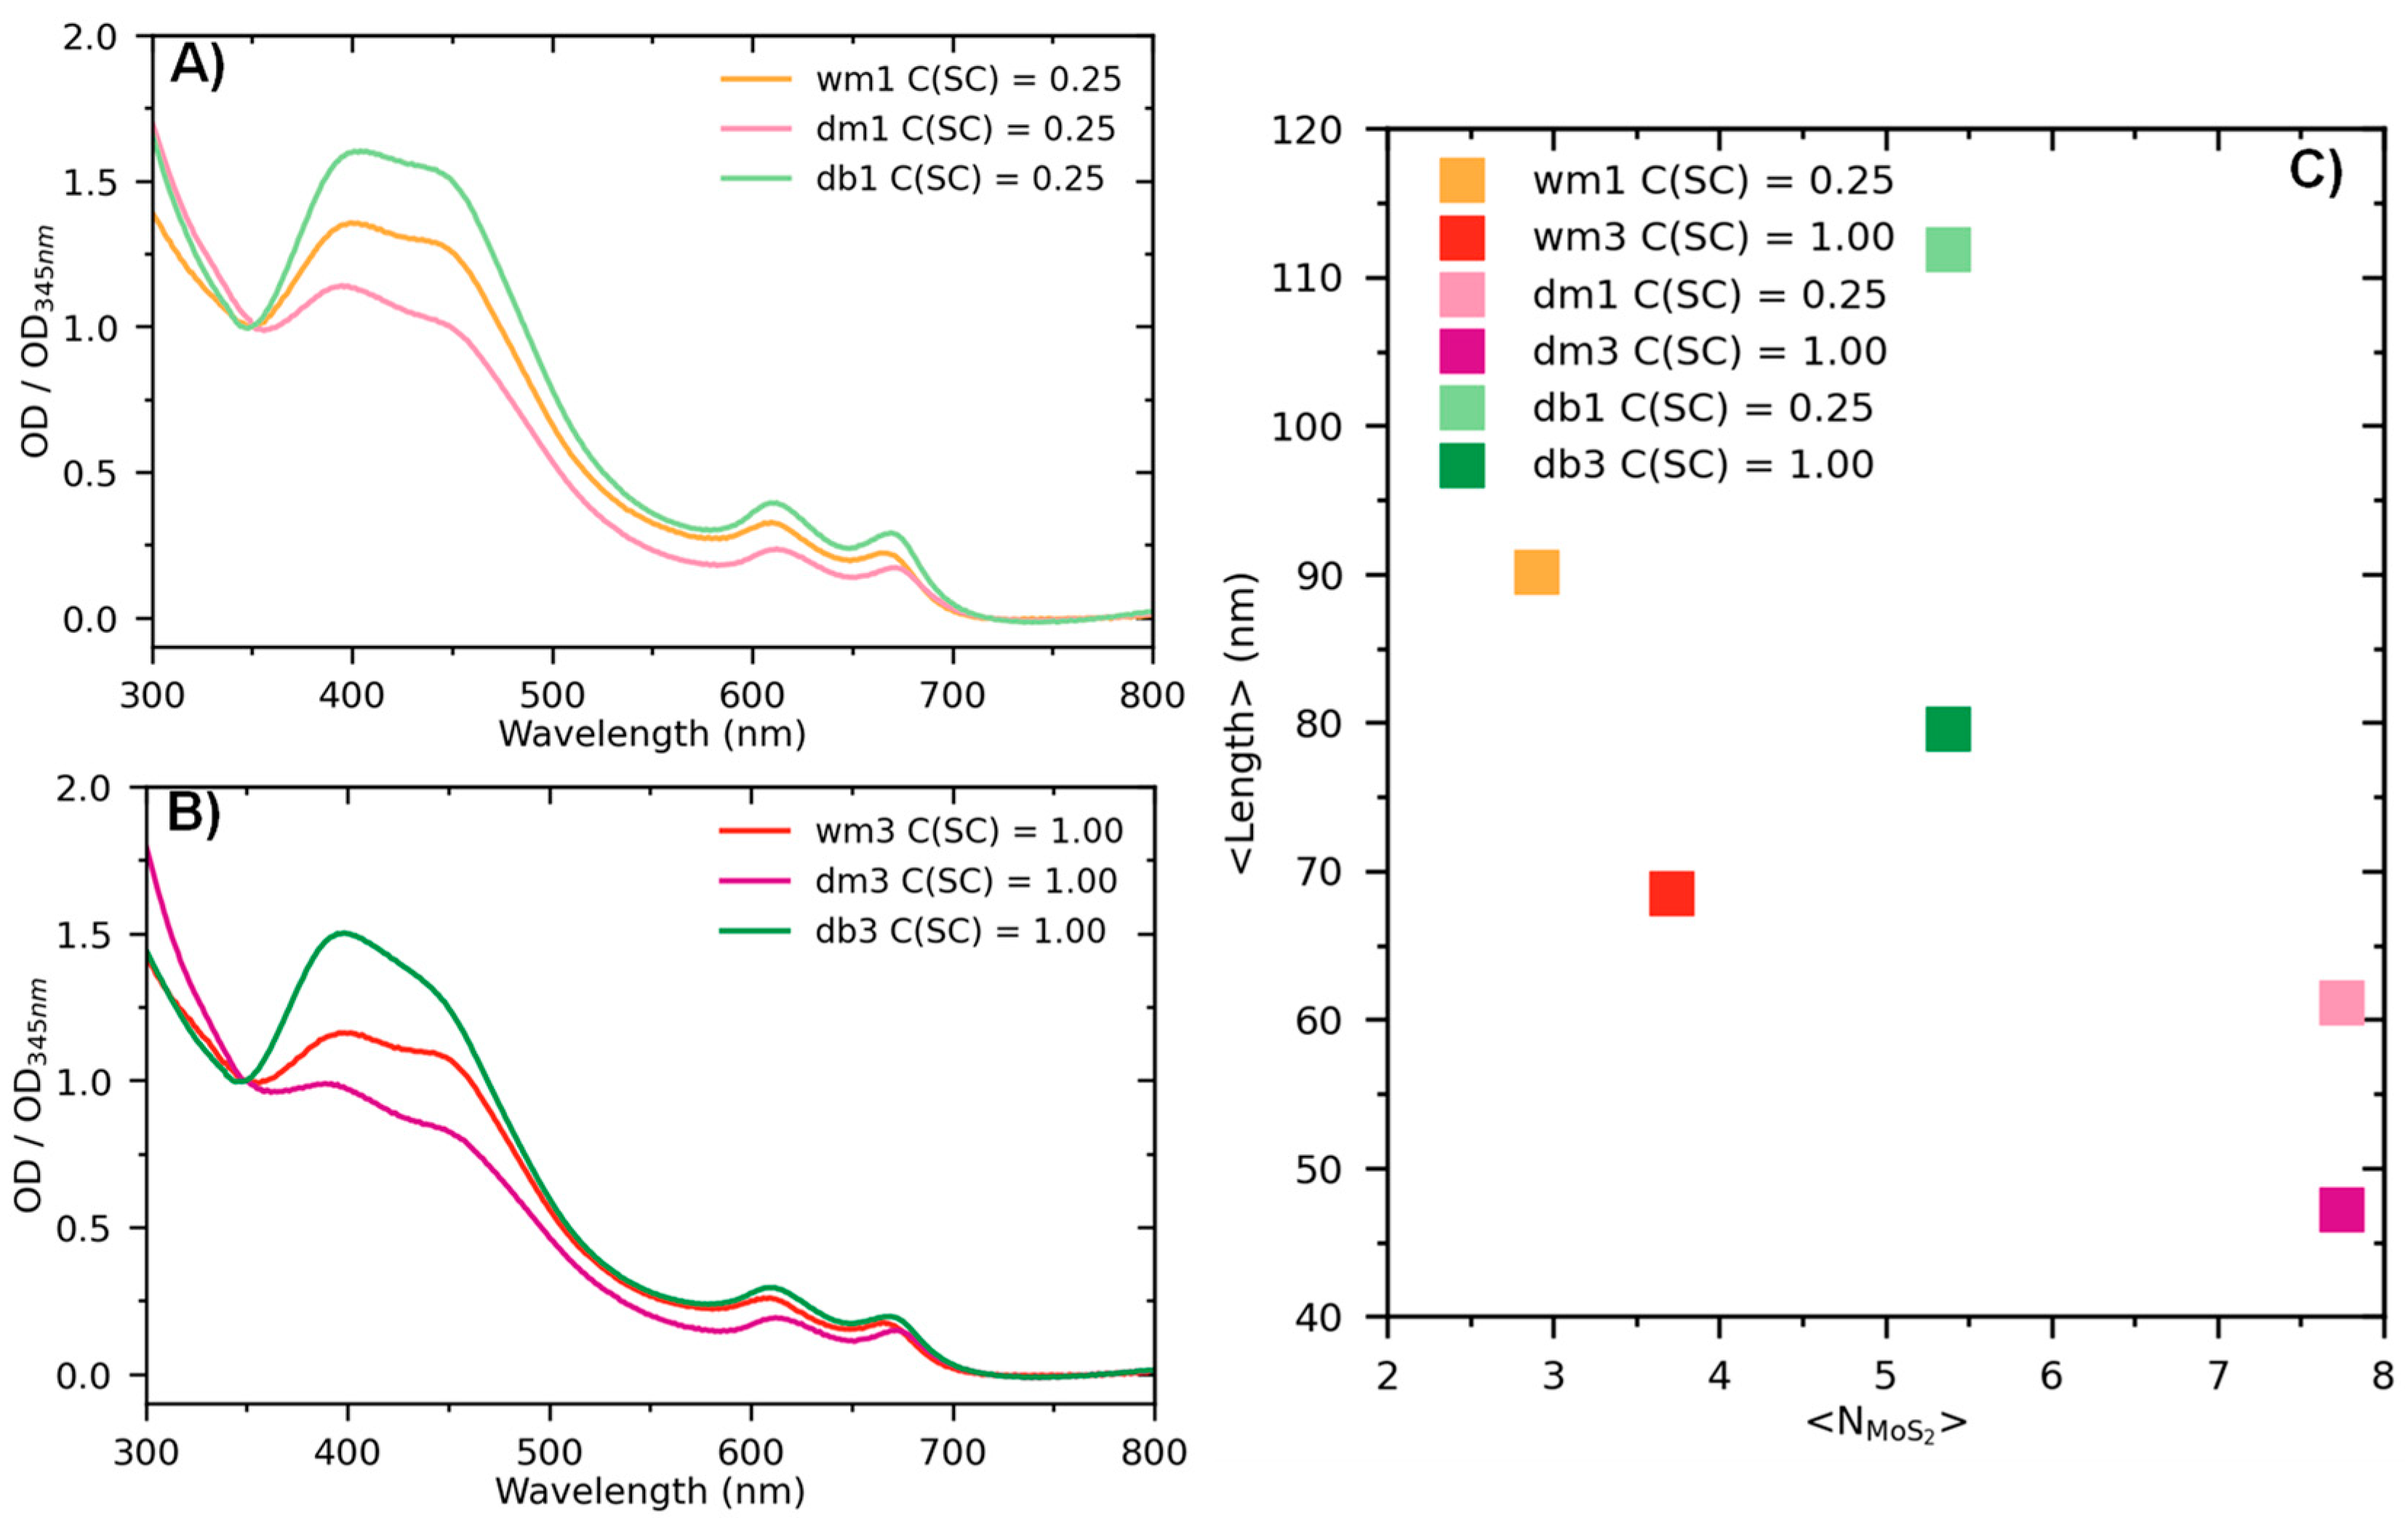
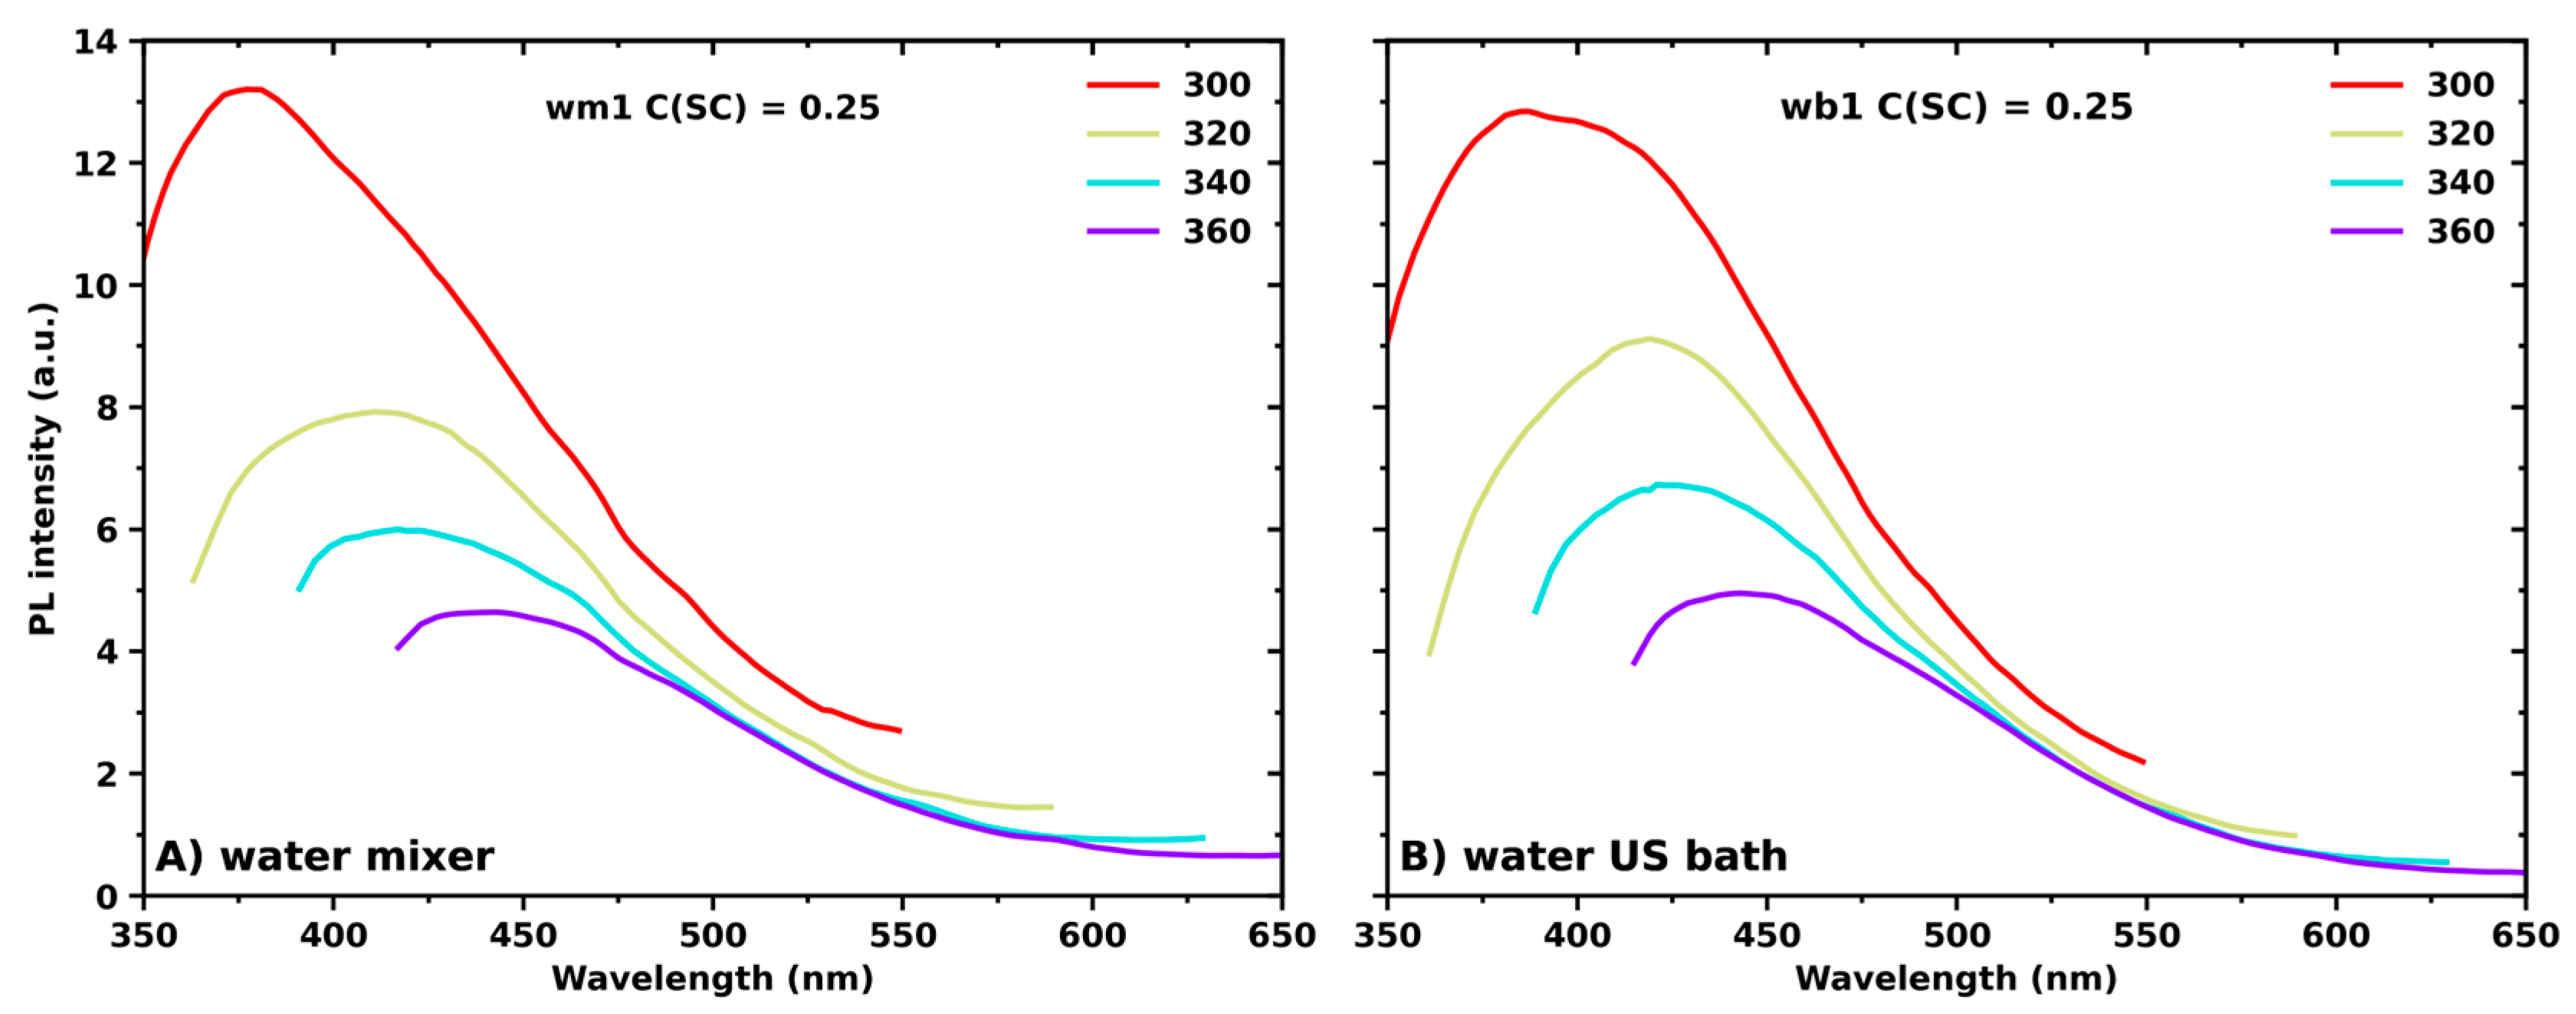
Optical Properties

Four series of samples, with different initial concentrations of sodium cholate C(SC), were synthesized using the LPE method: MoS2 nanosheets in aqueous and DMSO solutions were produced using ultrasound bath sonication and shear mixing (see details in the Sample Synthesis section). The optical density spectra and photoluminescence spectra are shown in Figure 2 and Figure 3, respectively.
For all four series, the main set of MoS2 characteristics was recognized: (i) two excitonic transitions A (~610 nm) and B (~665 nm) characteristic for the 2H polytype of MoS2; (ii) broadband topped by peaks C (~455 nm) and D (~400 nm), which are associated with a direct transition from deep in the valence band to the conduction band; and (iii) a pronounced local minimum at ~348 nm, also attributed to transitions from deep in the valence band [53,54,55,56]. Figure 2 clearly shows the influence of the solution type and sodium cholate concentration on the structure of MoS2 flakes. Smaller dimensions of MoS2 nanosheets were obtained using a mixer (Figure 3). The other two series of samples obtained in DMSO with the mixer (Figure 2B) and in water solution with the US bath (Figure 2C) both at low and high concentrations showed a strong distortion of the optical density spectrum, which indicates an imperfect mechanism of cleavage of individual layers. Broadening of the peaks in Figure 2B points to the absence of few-layer particles and the excess of large micrometer nanoparticles consisting of randomly arranged. The spectrum in Figure 2C demonstrates a strong scattering background, which complicates the further characterization of this series. The thicknesses and lateral sizes of MoS2 particles calculated for different dispersions using Equations (1) and (2) (Figure 3C) confirm these suggestions.
It was shown earlier that the parameters of both A- and B-excitons depend on C(SC) [57]. Specifically, the position of A-exciton ( λ A ) red-shifts as the number of layers per nanosheet (N) increases, while the intensity of the B-exciton ( O D B / O D 348 ) is higher for longer nanosheets [26]. This implies that both the length and the thickness of the nanosheets depend on C(SC) as was shown by J. N. Coleman in [26]. Such behavior has been demonstrated for a number of TMDs and it is attributed to edge confinement effects [19,58,59]. As a result, the optical density spectra provide quantitative information not only about lateral size:
L μ m = 3.5   OD B O D 348 0.14 11.5 OD B O D 348 ,
but also, about the nanosheet thickness:
N M o S 2 = 2.3 × 10 36 e 54888 λ A ,
where O D B and O D 348 are the optical densities of peak B and a local minimum at 348 nm. According to C. Backes et al., any arbitrary ratio of peak intensities can be used as a metric for lateral dimensions of nanosheets [57]. For instance, S. Ott et al. have used the ratio between optical density intensities of peaks at 348 and 270 nm [32].
Taking into account the accuracy of the optical density spectra measurements, it was not feasible to find an unambiguous correlation between the preparation method and the average thickness of nanosheets (Figure 3A,B). Mixer-assisted exfoliation of MoS2 powder in water solution (wm1) resulted in smaller nanosheet dimensions compared to other synthesis methods with a mean thickness of 3 layers and a mean lateral size of ~80 nm, while bath sonication of the DMSO dispersions led to the formation of rather thick particles (7.5 layers) of shorter lengths of ~55 nm. The dispersions produced in DMSO consistently contained thicker nanosheets than those prepared in water (Figure 3C). However, the reproducibility of the average dimensions was the most successful for MoS2 nanosheets in aqueous solutions produced with the shear mixing method. The resulting mean thickness range of 3 to 4 monolayers per nanosheet corresponds to the bandgap values of 1.0–1.2 eV [60]. At the same time, it is crucial to acknowledge that the properties of MoS2 become close to bulk as the number of monolayers approaches 10 [61]. Figure 3A,B present the normalized optical density spectra of three series of the dispersions of exfoliated samples with C(SC) concentrations of 0.25 and 1.00 mg/mL. Based on these data, it can be stated that the exfoliation of few-layered MoS2 nanosheets in water dispersions is more effective via shear mixing (wm1, orange/red curve in Figure 3B).
Figure 4 demonstrates the PL spectra of the samples prepared with the same initial concentration of SC and MoS2 powder but with variations in the solvent and LPE method. The analysis of the luminescence properties of MoS2 dispersions in DMSO is not possible due to the strong background signal of the solvent [62]. At the same time, for MoS2 dispersions in water, the increase in excitation wavelength red-shifted the luminescence spectra (Figure 4A,B). The excitation-dependent luminescence implies the poly-dispersive nature of MoS2 aqueous dispersions, which is characteristic of the LPE synthesis method [63]. The observed PL emission is ascribed to the release of energy due to the recombination at the electron (hole) trap [64]. These traps originated from uncompensated positive (negative) charges at the dangling bond of MoS2 nanosheets [64]. Dangling bonds are frequently classified as defects, which typically arise from impurities or crystal growth. Taking into consideration the surface-to-volume ratio, it becomes evident that defects exert a more pronounced impact on the properties of monolayers in comparison to bulk materials [65]. For instance, Saigal et al. reported that the nature of at least two discrete emission features in the vicinity of peak A in the PL spectrum of monolayer MoS2 on SiO2/Si substrates is associated to the recombination of defect-bound excitons [65]. No correlation was found between the synthesis method and luminescence intensity over excitation wavelengths ranging from 300 to 360 nm.
The optical properties were further analyzed for the series of samples prepared using water as a solvent and shear mixing as an LPE synthesis technique.
Dynamic light scattering (DLS) and atomic force microscopy (AFM) measurements (Figure 5A,B) confirmed the MoS2 nanosheet dimensions calculated from the optical density spectra using Equations (1) and (2). The nanosheet volume was calculated (Vd) from the diffusion coefficient using the following equation [66] and found to be 40.5 × 10³ nm3:
D = 13.3 × 10 9 η s 1.14 V d 0.589
where D–diffusion coefficient (cm2/s), ν –viscosity of the solvent (mPa/s) and Vd–LeBas molar volume (cm3/mol). Assuming that the largest and the smallest nanosheet mean sizes obtained from the optical density spectra are about 125 nm and 3.5 nm, respectively, the third size derived from Equation (3) the DLS measurements is about 93 nm and, thus, it is indeed intermediate.
For AFM measurements, a surfactant-free dispersion of MoS2 nanosheets in water was prepared using standard mixing parameters and then deposited on a silicon wafer. A representative AFM image of the deposited film is shown in Figure 5B. According to the surface profile measurements (see inset Figure 5B), the average thickness of the film did not exceed 5 nm, which is in agreement with the dimension calculated from the optical density (spectra Figure 2D). The films prepared from the SC-contained dispersions demonstrated large organic agglomerates on the substrate surface, which complicates the analysis of the size of MoS2 nanosheets.
The PL emission spectra of the dispersions of exfoliated MoS2 nanosheets (prepared with various initial concentrations of SC) under different excitation wavelengths (300–360 nm) are shown in Figure 6. The photoluminescence intensity tends to increase for solutions with higher concentrations of SC. This effect can be attributed to the fact that the final concentration of MoS2 nanosheets should be higher for dispersions with higher SC concentrations since the addition of surfactant prevents particle reaggregation.
PL and optical density spectra allowed calculation of the QY of the dispersions as integrated fluorescence intensity (the area of the fluorescence spectrum) divided by the optical density at the excitation wavelength. The calculated QY shows no direct correlation with the surfactant concentration. This behavior can be explained by the fact that, with the increasing SC concentration, the increase in optical density has a more pronounced impact on the quantum yield than the increase in integrated PL.
Absolute fluorescent quantum yield was calculated using two different approaches. The first approach uses a spontaneous Raman scattering line of H2O (solvent) as an internal standard. Absolute fluorescent QY (Qs) can be determined using
Q u = Q r I u I r O D r O D u
where Iu and Ir represent integrated fluorescence intensities for the unknown sample and the reference sample, respectively. ODu and ODr denote the optical density values of the unknown and the reference, respectively. The fluorescence of coumarin, which was measured at the same parameters, was used as a reference for the calculation.
The second approach is based on the work and can be calculated as [67]
Q u = n s n u 4 π σ R S σ a I u I R S
σRS-total differectial Raman scattering cross section of the 3440 cm−1 line of water used in calculations σRS(337 nm) = 4.5 × 10⁻²⁹ cm2 sr−1. Line with the Stokes shift equal to 3444 cm−1 and excited at 337 nm will be located at 381 nm, where it was in fact observed during the experiment. ns-concentration number of solvent. In our case, it was distilled water ns(H2O) = 9.4 × 1018 cm−3. σa-absorption cross section (cm2). Iu and IRS represent integrated fluorescence intensities for the unknown sample and the 3440 cm−1 line of water. The absolute values of fluorescent quantum yield of MoS2 nanosheet dispersions in aqueous solutions with various initial concentrations of sodium cholate. The calculated data is presented in Figure 7.
The high-resolution Mo3d–S2s XPS spectrum of a typical MoS2 nanosheet sample (Figure 8A) shows a strong doublet of Mo3d peaks at a binding energy of 229.8 eV attributed to MoS2 and a low-intense doublet at a higher binding energy of about 233 eV that can be assigned to oxidized Mo6+ species. At the same time, the S2p spectrum (Figure 8B) shows only a strong doublet at a binding energy of 162.6 eV typical for metal sulfides.
Raman spectroscopy serves as a valuable tool for the characterization of two-dimensional materials, and this applies to MoS2 as well. According to the findings presented in [61], nanosheets containing up to four monolayers can be unequivocally identified. Figure 9 displays the Raman spectra of nanosheets obtained through shear mixing and excited with a 488 nm laser line on a silicon substrate. Unfortunately, the limited resolution of the peaks hindered the determination of the average thickness of the nanosheets using the metrics proposed by [61]. Nevertheless, Figure 9 clearly exhibits two distinct peaks associated with molybdenum disulfide, corresponding to the first-order Raman active modes with E’ and A’ symmetries.

4. Conclusions

In this article, we study the optical properties of MoS2 modified with one of the most commonly used surfactants, sodium cholate. Our findings illustrate that the shear-exfoliated materials exhibit superior structural and quantum yield properties compared to those produced through sonication. The surfactant concentration was chosen from 0.5 to 2.5 g L−1. The average thickness of the produced nanosheets is 3.5 nm, which was confirmed by optical, DLS, and AFM measurements. The concentration of the surfactant does not influence the quantum yield. Sodium cholate does not form chemical bonds with MoS2 and does not change the band gap. In conclusion, chemical functionalization in conjunction with shear mixer-assisted LPE has a strong potential as a cheap and easy method for large-scale preparation of exfoliated luminescent MoS2 nanosheets. Sodium cholate can be utilized along with other modifiers to stabilize the suspension without altering its optical properties.

Author Contributions

Conceptualization, S.A.E.; methodology, S.A.E., M.Y.L., J.V.B. and A.A.R.; software, M.Y.L.; validation, M.Y.L.; formal analysis, M.Y.L. and K.I.M.; investigation, J.V.B. and M.Y.L.; resources, A.V.S., G.D.D. and O.G.K.-K.; data curation, M.Y.L. and A.A.R.; writing—original draft, M.Y.L.; writing—review and editing, A.A.R., J.V.B., K.I.M., D.G.K. and E.A.S.; visualization, D.G.K. and M.Y.L.; supervision, S.A.E.; funding acquisition, S.A.E., G.D.D. and O.G.K.-K. All authors have read and agreed to the published version of the manuscript.

Funding

D.G.K., J.V.B., and S.A.E. thank the Russian Science Foundation No. 21-73-10238, https://rscf.ru/en/project/21-73-10238/ (accessed on 26 June 2023). The work of A.A.R. was supported by the Fund of Theoretical Physics and Mathematics Development “BASIS” No. 20-2-10-6-1. The work of O.G.K. was supported by the world-class research center program: Advanced Digital Technologies (Contract no. 075-15-2022-312 dated 20 April 2022).

Institutional Review Board Statement

Not applicable.

Data Availability Statement

Not applicable.

Conflicts of Interest

The authors declare no conflict of interest.

References

  1. Li, X.; Tao, L.; Chen, Z.; Fang, H.; Li, X.; Wang, X.; Xu, J.-B.; Zhu, H. Graphene and Related Two-Dimensional Materials: Structure-Property Relationships for Electronics and Optoelectronics. Appl. Phys. Rev. 2017, 4, 021306. [Google Scholar] [CrossRef] [Green Version]
  2. Castellanos-Gomez, A.; Poot, M.; Steele, G.A.; van der Zant, H.S.J.; Agraït, N.; Rubio-Bollinger, G. Elastic Properties of Freely Suspended MoS2 Nanosheets. Adv. Mater. 2012, 24, 772–775. [Google Scholar] [CrossRef] [Green Version]
  3. Bertolazzi, S.; Brivio, J.; Kis, A. Stretching and Breaking of Ultrathin MoS2. ACS Nano 2011, 5, 9703–9709. [Google Scholar] [CrossRef] [PubMed]
  4. Zeng, H.; Dai, J.; Yao, W.; Xiao, D.; Cui, X. Valley Polarization in MoS2 Monolayers by Optical Pumping. Nat. Nanotechnol. 2012, 7, 490–493. [Google Scholar] [CrossRef]
  5. Zhang, W.; Chuu, C.-P.; Huang, J.-K.; Chen, C.-H.; Tsai, M.-L.; Chang, Y.-H.; Liang, C.-T.; Chen, Y.-Z.; Chueh, Y.-L.; He, J.-H.; et al. Ultrahigh-Gain Photodetectors Based on Atomically Thin Graphene-MoS2 Heterostructures. Sci. Rep. 2014, 4, 3826. [Google Scholar] [CrossRef] [PubMed] [Green Version]
  6. Cong, C.; Shang, J.; Wu, X.; Cao, B.; Peimyoo, N.; Qiu, C.; Sun, L.; Yu, T. Synthesis and Optical Properties of Large-Area Single-Crystalline 2D Semiconductor WS2 Monolayer from Chemical Vapor Deposition. Adv. Opt. Mater. 2014, 2, 131–136. [Google Scholar] [CrossRef]
  7. Splendiani, A.; Sun, L.; Zhang, Y.; Li, T.; Kim, J.; Chim, C.-Y.; Galli, G.; Wang, F. Emerging Photoluminescence in Monolayer MoS2. Nano Lett. 2010, 10, 1271–1275. [Google Scholar] [CrossRef]
  8. Mak, K.F.; Lee, C.; Hone, J.; Shan, J.; Heinz, T.F. Atomically Thin MoS2: A New Direct-Gap Semiconductor. Phys. Rev. Lett. 2010, 105, 136805. [Google Scholar] [CrossRef] [Green Version]
  9. Li, T.; Galli, G. Electronic Properties of MoS2 Nanoparticles. J. Phys. Chem. C 2007, 111, 16192–16196. [Google Scholar] [CrossRef]
  10. Li, H.; Lu, G.; Yin, Z.; He, Q.; Li, H.; Zhang, Q.; Zhang, H. Optical Identification of Single- and Few-Layer MoS2 Sheets. Small 2012, 8, 682–686. [Google Scholar] [CrossRef]
  11. Radisavljevic, B.; Radenovic, A.; Brivio, J.; Giacometti, V.; Kis, A. Single-Layer MoS2 Transistors. Nat. Nanotechnol. 2011, 6, 147–150. [Google Scholar] [CrossRef] [PubMed]
  12. Lopez-Sanchez, O.; Lembke, D.; Kayci, M.; Radenovic, A.; Kis, A. Ultrasensitive Photodetectors Based on Monolayer MoS2. Nat. Nanotechnol. 2013, 8, 497–501. [Google Scholar] [CrossRef] [PubMed]
  13. Chhowalla, M.; Shin, H.S.; Eda, G.; Li, L.-J.; Loh, K.P.; Zhang, H. The Chemistry of Two-Dimensional Layered Transition Metal Dichalcogenide Nanosheets. Nat. Chem. 2013, 5, 263–275. [Google Scholar] [CrossRef] [PubMed]
  14. Monga, D.; Sharma, S.; Shetti, N.P.; Basu, S.; Reddy, K.R.; Aminabhavi, T.M. Advances in Transition Metal Dichalcogenide-Based Two-Dimensional Nanomaterials. Mater. Today Chem. 2021, 19, 100399. [Google Scholar] [CrossRef]
  15. Tongay, S.; Zhou, J.; Ataca, C.; Lo, K.; Matthews, T.S.; Li, J.; Grossman, J.C.; Wu, J. Thermally Driven Crossover from Indirect toward Direct Bandgap in 2D Semiconductors: MoSe2 versus MoS2. Nano Lett. 2012, 12, 5576–5580. [Google Scholar] [CrossRef]
  16. Novoselov, K.S.; Geim, A.K.; Morozov, S.V.; Jiang, D.; Zhang, Y.; Dubonos, S.V.; Grigorieva, I.V.; Firsov, A.A. Electric Field Effect in Atomically Thin Carbon Films. Science 2004, 306, 666–669. [Google Scholar] [CrossRef] [Green Version]
  17. Sup Choi, M.; Lee, G.-H.; Yu, Y.-J.; Lee, D.-Y.; Hwan Lee, S.; Kim, P.; Hone, J.; Jong Yoo, W. Controlled Charge Trapping by Molybdenum Disulphide and Graphene in Ultrathin Heterostructured Memory Devices. Nat. Commun. 2013, 4, 1624. [Google Scholar] [CrossRef] [Green Version]
  18. Zhang, E.; Wang, W.; Zhang, C.; Jin, Y.; Zhu, G.; Sun, Q.; Zhang, D.W.; Zhou, P.; Xiu, F. Tunable Charge-Trap Memory Based on Few-Layer MoS2. ACS Nano 2015, 9, 612–619. [Google Scholar] [CrossRef] [Green Version]
  19. Klein, J.; Sigl, L.; Gyger, S.; Barthelmi, K.; Florian, M.; Rey, S.; Taniguchi, T.; Watanabe, K.; Jahnke, F.; Kastl, C.; et al. Scalable Single-Photon Sources in Atomically Thin MoS2. arXiv 2020, arXiv:2002.08819. [Google Scholar]
  20. Klein, J.; Lorke, M.; Florian, M.; Sigger, F.; Sigl, L.; Rey, S.; Wierzbowski, J.; Cerne, J.; Müller, K.; Mitterreiter, E.; et al. Site-Selectively Generated Photon Emitters in Monolayer MoS2 via Local Helium Ion Irradiation. Nat. Commun. 2019, 10, 2755. [Google Scholar] [CrossRef] [Green Version]
  21. Klein, J.; Sigl, L.; Gyger, S.; Barthelmi, K.; Florian, M.; Rey, S.; Taniguchi, T.; Watanabe, K.; Jahnke, F.; Kastl, C.; et al. Engineering the Luminescence and Generation of Individual Defect Emitters in Atomically Thin MoS2. ACS Photonics 2021, 8, 669–677. [Google Scholar] [CrossRef]
  22. Wu, W.; Wang, L.; Yu, R.; Liu, Y.; Wei, S.-H.; Hone, J.; Wang, Z.L. Piezophototronic Effect in Single-Atomic-Layer MoS2 for Strain-Gated Flexible Optoelectronics. Adv. Mater. 2016, 28, 8463–8468. [Google Scholar] [CrossRef]
  23. Yang, X.; Li, B. Monolayer MoS2 for Nanoscale Photonics. Nanophotonics 2020, 9, 1557–1577. [Google Scholar] [CrossRef] [Green Version]
  24. Huang, Y.; Pan, Y.-H.; Yang, R.; Bao, L.-H.; Meng, L.; Luo, H.-L.; Cai, Y.-Q.; Liu, G.-D.; Zhao, W.-J.; Zhou, Z.; et al. Universal Mechanical Exfoliation of Large-Area 2D Crystals. Nat. Commun. 2020, 11, 2453. [Google Scholar] [CrossRef] [PubMed]
  25. Huo, C.; Yan, Z.; Song, X.F.; Zeng, H. 2D Materials via Liquid Exfoliation: A Review on Fabrication and Applications. Sci. Bull. 2015, 60, 1994–2008. [Google Scholar] [CrossRef]
  26. Varrla, E.; Backes, C.; Paton, K.R.; Harvey, A.; Gholamvand, Z.; McCauley, J.; Coleman, J.N. Large-Scale Production of Size-Controlled MoS2 Nanosheets by Shear Exfoliation. Chem. Mater. 2015, 27, 1129–1139. [Google Scholar] [CrossRef]
  27. Zhang, X.; Lai, Z.; Tan, C.; Zhang, H. Solution-Processed Two-Dimensional MoS2 Nanosheets: Preparation, Hybridization, and Applications. Angew. Chem. Int. Ed. 2016, 55, 8816–8838. [Google Scholar] [CrossRef]
  28. Cunningham, G.; Lotya, M.; Cucinotta, C.S.; Sanvito, S.; Bergin, S.D.; Menzel, R.; Shaffer, M.S.; Coleman, J.N. Solvent Exfoliation of Transition Metal Dichalcogenides: Dispersibility of Exfoliated Nanosheets Varies Only Weakly between Compounds. ACS Nano 2012, 6, 3468–3480. [Google Scholar] [CrossRef] [PubMed]
  29. Biccai, S.; Barwich, S.; Boland, D.; Harvey, A.; Hanlon, D.; McEvoy, N.; Coleman, J.N. Exfoliation of 2D Materials by High Shear Mixing. 2D Mater. 2018, 6, 015008. [Google Scholar] [CrossRef]
  30. Varrla, E.; Paton, K.R.; Backes, C.; Harvey, A.; Smith, R.J.; McCauley, J.; Coleman, J.N. Turbulence-Assisted Shear Exfoliation of Graphene Using Household Detergent and a Kitchen Blender. Nanoscale 2014, 6, 11810–11819. [Google Scholar] [CrossRef] [Green Version]
  31. Nicolosi, V.; Chhowalla, M.; Kanatzidis, M.G.; Strano, M.S.; Coleman, J.N. Liquid Exfoliation of Layered Materials. Science 2013, 340, 1226419. [Google Scholar] [CrossRef] [Green Version]
  32. Griffin, A.; Nisi, K.; Pepper, J.; Harvey, A.; Szyd\lowska, B.M.; Coleman, J.N.; Backes, C. Effect of Surfactant Choice and Concentration on the Dimensions and Yield of Liquid-Phase-Exfoliated Nanosheets. Chem. Mater. 2020, 32, 2852–2862. [Google Scholar] [CrossRef]
  33. Zhou, K.-G.; Mao, N.-N.; Wang, H.-X.; Peng, Y.; Zhang, H.-L. A Mixed-Solvent Strategy for Efficient Exfoliation of Inorganic Graphene Analogues. Angew. Chem. Int. Ed. 2011, 50, 10839–10842. [Google Scholar] [CrossRef] [PubMed]
  34. Amiri, A.; Naraghi, M.; Ahmadi, G.; Soleymaniha, M.; Shanbedi, M. A Review on Liquid-Phase Exfoliation for Scalable Production of Pure Graphene, Wrinkled, Crumpled and Functionalized Graphene and Challenges. FlatChem 2018, 8, 40–71. [Google Scholar] [CrossRef]
  35. Güler, Ö.; Tekeli, M.; Taşkın, M.; Güler, S.H.; Yahia, I.S. The Production of Graphene by Direct Liquid Phase Exfoliation of Graphite at Moderate Sonication Power by Using Low Boiling Liquid Media: The Effect of Liquid Media on Yield and Optimization. Ceram. Int. 2021, 47, 521–533. [Google Scholar] [CrossRef]
  36. Fernandes, J.; Nemala, S.S.; De Bellis, G.; Capasso, A. Green Solvents for the Liquid Phase Exfoliation Production of Graphene: The Promising Case of Cyrene. Front. Chem. 2022, 10, 878799. [Google Scholar] [CrossRef] [PubMed]
  37. Coleman, J.N. Liquid Exfoliation of Defect-Free Graphene. Acc. Chem. Res. 2013, 46, 14–22. [Google Scholar] [CrossRef]
  38. Trusova, E.A.; Klimenko, I.V.; Afzal, A.M.; Shchegolikhin, A.N.; Jurina, L.V. Comparison of Oxygen-Free Graphene Sheets Obtained in DMF and DMF-Aqua Media. New J. Chem. 2021, 45, 10448–10458. [Google Scholar] [CrossRef]
  39. Green, A.A.; Hersam, M.C. Solution Phase Production of Graphene with Controlled Thickness via Density Differentiation. Nano Lett. 2009, 9, 4031–4036. [Google Scholar] [CrossRef]
  40. Hasan, T.; Torrisi, F.; Sun, Z.; Popa, D.; Nicolosi, V.; Privitera, G.; Bonaccorso, F.; Ferrari, A.C. Solution-Phase Exfoliation of Graphite for Ultrafast Photonics. Phys. Status Solidi B 2010, 247, 2953–2957. [Google Scholar] [CrossRef]
  41. Seo, J.-W.T.; Green, A.A.; Antaris, A.L.; Hersam, M.C. High-Concentration Aqueous Dispersions of Graphene Using Nonionic, Biocompatible Block Copolymers. J. Phys. Chem. Lett. 2011, 2, 1004–1008. [Google Scholar] [CrossRef]
  42. Gobbi, M.; Orgiu, E.; Samorì, P. When 2D Materials Meet Molecules: Opportunities and Challenges of Hybrid Organic/Inorganic van Der Waals Heterostructures. Adv. Mater. 2018, 30, 1706103. [Google Scholar] [CrossRef] [PubMed] [Green Version]
  43. Amani, M.; Lien, D.-H.; Kiriya, D.; Xiao, J.; Azcatl, A.; Noh, J.; Madhvapathy, S.R.; Addou, R.; Kc, S.; Dubey, M.; et al. Near-Unity Photoluminescence Quantum Yield in MoS2. Science 2015, 350, 1065–1068. [Google Scholar] [CrossRef] [PubMed] [Green Version]
  44. Wu, X.; Gong, K.; Zhao, G.; Lou, W.; Wang, X.; Liu, W. Surface Modification of MoS2 Nanosheets as Effective Lubricant Additives for Reducing Friction and Wear in Poly-α-Olefin. Ind. Eng. Chem. Res. 2018, 57, 8105–8114. [Google Scholar] [CrossRef]
  45. Gao, J.; Zhang, M.; Wang, J.; Liu, G.; Liu, H.; Jiang, Y. Bioinspired Modification of Layer-Stacked Molybdenum Disulfide (MoS2) Membranes for Enhanced Nanofiltration Performance. ACS Omega 2019, 4, 4012–4022. [Google Scholar] [CrossRef] [Green Version]
  46. Jiang, P.; Zhang, B.; Liu, Z.; Chen, Y. MoS2 Quantum Dots Chemically Modified with Porphyrin for Solid-State Broadband Optical Limiters. Nanoscale 2019, 11, 20449–20455. [Google Scholar] [CrossRef]
  47. Amani, M.; Burke, R.A.; Ji, X.; Zhao, P.; Lien, D.-H.; Taheri, P.; Ahn, G.H.; Kirya, D.; Ager III, J.W.; Yablonovitch, E.; et al. High Luminescence Efficiency in MoS2 Grown by Chemical Vapor Deposition. ACS Nano 2016, 10, 6535–6541. [Google Scholar] [CrossRef]
  48. Tantardini, C.; Kvashnin, A.G.; Azizi, M.; Gonze, X.; Gatti, C.; Altalhi, T.; Yakobson, B.I. Electronic Properties of Functionalized Diamanes for Field-Emission Displays. ACS Appl. Mater. Interfaces 2023, 15, 16317–16326. [Google Scholar] [CrossRef]
  49. Tantardini, C.; Kvashnin, A.G.; Gatti, C.; Yakobson, B.I.; Gonze, X. Computational Modeling of 2D Materials under High Pressure and Their Chemical Bonding: Silicene as Possible Field-Effect Transistor. ACS Nano 2021, 15, 6861–6871. [Google Scholar] [CrossRef]
  50. Coleman, J.N.; Lotya, M.; O’Neill, A.; Bergin, S.D.; King, P.J.; Khan, U.; Young, K.; Gaucher, A.; De, S.; Smith, R.J.; et al. Two-Dimensional Nanosheets Produced by Liquid Exfoliation of Layered Materials. Science 2011, 331, 568–571. [Google Scholar] [CrossRef] [Green Version]
  51. Smith, R.J.; King, P.J.; Lotya, M.; Wirtz, C.; Khan, U.; De, S.; O’Neill, A.; Duesberg, G.S.; Grunlan, J.C.; Moriarty, G.; et al. Large-Scale Exfoliation of Inorganic Layered Compounds in Aqueous Surfactant Solutions. Adv. Mater. 2011, 23, 3944–3948. [Google Scholar] [CrossRef]
  52. Krishnan, U.; Kaur, M.; Singh, K.; Kumar, M.; Kumar, A. A Synoptic Review of MoS2: Synthesis to Applications. Superlattices Microstruct. 2019, 128, 274–297. [Google Scholar] [CrossRef]
  53. Wilson, J.A.; Yoffe, A. The Transition Metal Dichalcogenides Discussion and Interpretation of the Observed Optical, Electrical and Structural Properties. Adv. Phys. 1969, 18, 193–335. [Google Scholar] [CrossRef]
  54. Kappera, R.; Voiry, D.; Yalcin, S.E.; Branch, B.; Gupta, G.; Mohite, A.D.; Chhowalla, M. Phase-Engineered Low-Resistance Contacts for Ultrathin MoS2 Transistors. Nat. Mater. 2014, 13, 1128–1134. [Google Scholar] [CrossRef]
  55. Wilcoxon, J.; Newcomer, P.; Samara, G. Synthesis and Optical Properties of MoS2 Nanoclusters. MRS Online Proc. Libr. OPL 1996, 452, 371. [Google Scholar] [CrossRef]
  56. Wilcoxon, J.; Samara, G. Strong Quantum-Size Effects in a Layered Semiconductor: MoS2 Nanoclusters. Phys. Rev. B 1995, 51, 7299. [Google Scholar] [CrossRef]
  57. Backes, C.; Smith, R.J.; McEvoy, N.; Berner, N.C.; McCloskey, D.; Nerl, H.C.; O’Neill, A.; King, P.J.; Higgins, T.; Hanlon, D.; et al. Edge and Confinement Effects Allow in Situ Measurement of Size and Thickness of Liquid-Exfoliated Nanosheets. Nat. Commun. 2014, 5, 4576. [Google Scholar] [CrossRef] [Green Version]
  58. Eda, G.; Yamaguchi, H.; Voiry, D.; Fujita, T.; Chen, M.; Chhowalla, M. Photoluminescence from Chemically Exfoliated MoS2. Nano Lett. 2011, 11, 5111–5116. [Google Scholar] [CrossRef] [PubMed]
  59. Zhao, W.; Ghorannevis, Z.; Chu, L.; Toh, M.; Kloc, C.; Tan, P.-H.; Eda, G. Evolution of Electronic Structure in Atomically Thin Sheets of WS2 and WSe2. ACS Nano 2013, 7, 791–797. [Google Scholar] [CrossRef] [Green Version]
  60. Li, H.; Ji, A.; Zhu, C.; Cui, L.; Mao, L.-F. Layer-Dependent Bandgap and Electrical Engineering of Molybdenum Disulfide. J. Phys. Chem. Solids 2020, 139, 109331. [Google Scholar] [CrossRef]
  61. Lee, C.; Yan, H.; Brus, L.E.; Heinz, T.F.; Hone, J.; Ryu, S. Anomalous Lattice Vibrations of Single-and Few-Layer MoS2. ACS Nano 2010, 4, 2695–2700. [Google Scholar] [CrossRef] [PubMed] [Green Version]
  62. Wallace, V.M.; Dhumal, N.R.; Zehentbauer, F.M.; Kim, H.J.; Kiefer, J. Revisiting the Aqueous Solutions of Dimethyl Sulfoxide by Spectroscopy in the Mid-and near-Infrared: Experiments and Car–Parrinello Simulations. J. Phys. Chem. B 2015, 119, 14780–14789. [Google Scholar] [CrossRef] [PubMed]
  63. Štengl, V.; Henych, J. Strongly Luminescent Monolayered MoS2 Prepared by Effective Ultrasound Exfoliation. Nanoscale 2013, 5, 3387–3394. [Google Scholar] [CrossRef] [PubMed]
  64. Sahoo, D.; Kumar, B.; Sinha, J.; Ghosh, S.; Roy, S.S.; Kaviraj, B. Cost Effective Liquid Phase Exfoliation of MoS2 Nanosheets and Photocatalytic Activity for Wastewater Treatment Enforced by Visible Light. Sci. Rep. 2020, 10, 10759. [Google Scholar] [CrossRef] [PubMed]
  65. Saigal, N.; Ghosh, S. Evidence for Two Distinct Defect Related Luminescence Features in Monolayer MoS2. Appl. Phys. Lett. 2016, 109, 122105. [Google Scholar] [CrossRef]
  66. Fisk, P.R.; Ford, M.G.; Watson, P. The Kinetics of the Partitioning of Compounds between Octanol and Water, and Its Relationship to the Movement of Molecules in Biological Systems. Compr. Chem. Kinet. 1999, 37, 161–194. [Google Scholar]
  67. Cheknlyuk, A.; Fadeev, V.; Georgiev, G.; Kalkanjiev, T.; Nickolov, Z. Determination of Fluorescence Quantum Yields Using a Spontaneous Raman Scattering Line of the Solvent as Internal Standard. Spectrosc. Lett. 1982, 15, 355–365. [Google Scholar] [CrossRef]
Figure 1. Schematic representation of the synthesis and characterization procedure for MoS2 nanosheet dispersions. SEM images represent the pristine powder before the exfoliation.
Nanomaterials 13 01982 g001
Figure 2. Optical density spectra of dispersions of exfoliated MoS2 nanosheets produced via bath sonication in DMSO (A) via shear mixing in DMSO (B) via bath sonication in water (C) via shear mixing in water (D) with various initial concentrations of sodium cholate C(SC) as indicated in the legend. Mixing conditions: T = 22 ℃, t = 120 min, C(MoS2) = 2.5 mg/mL, and V = 400 mL. Labels in the graphs correspond to two excitonic transitions A (~610 nm), B (~665 nm), and direct transition from deep in the valence band C (~455 nm) and D (~400 nm).
Nanomaterials 13 01982 g002
Figure 3. (A,B) Normalized optical density spectra of dispersions of exfoliated in DMSO/water MoS2 nanosheets, prepared via bath sonication/shear mixing with different initial concentrations of sodium cholate C(SC) indicated in the legend. (C) MoS2 nanosheet dimensions, calculated from the optical density spectra using Equations (1) and (2).
Nanomaterials 13 01982 g003
Figure 4. Photoluminescence spectra of MoS2 nanosheet dispersions produced via shear mixing (A) via bath sonication (B) in water with the same initial concentration of SC (C(SC) = 0.25 mg/mL) and MoS2 powder (C(MoS2) = 2.5 mg/mL).
Nanomaterials 13 01982 g004
Figure 5. (A,B) AFM images of typical nanosheets produced using standard mixing parameters with C(SC) = 0 mg/mL and deposited on silicon substrate (C) MoS2 nanosheet dimensions, calculated from the optical density spectra using Equations (1) and (2).
Nanomaterials 13 01982 g005
Figure 6. (A,B) Photoluminescence spectra of MoS2 nanosheet dispersions in aqueous solutions with various initial concentrations of sodium cholate C(SC) indicated in legend prepared by shear mixing. (C) Quantum yield of MoS2 nanosheet dispersions in aqueous solutions with various initial concentrations of sodium cholate C(SC) indicated in legend prepared by shear mixing.
Nanomaterials 13 01982 g006
Figure 7. Absolute fluorescent quantum yield of MoS2 nanosheet dispersions in aqueous solutions with various initial concentrations of sodium cholate C(SC) indicated in legend prepared by shear mixing. (A) Calculated using Equation (4); (B) calculated using Equation (5).
Nanomaterials 13 01982 g007
Figure 8. Mo3d–S2s (A) and S2p (B) XPS spectra of the MoS2 nanosheets produced using standard mixing parameters with C(SC) = 0 mg/mL and deposited on a silicon substrate.
Nanomaterials 13 01982 g008
Figure 9. Raman characterization using a 488 nm laser line of typical nanosheets produced using standard mixing parameters and deposited won a silicon substrate.
Nanomaterials 13 01982 g009
Table 1. Exfoliated sample preparation.
Solvent TypeExfoliation ApproachSample NameC(SC), mg/mLC (MoS2), mg/mLProduction Time, hCentrifugation #1
WaterShear force promotedwm10.252.521500 rpm × 45 min
wm21.0
wm31.5
wm42.0
wm52.5
Sonication promotedwb10.251
wb20.5
wb31
DMSOShear force promoteddm10.252
dm20.5
dm31
Sonication promoteddb10.251
db20.5
db31
Table 2. Final MoS2 and sodium cholate concentrations.
Sample NameCi(SC), mg/mLCf(MoS2) mg/mLCentrifugation #2
wm10.252.510 krpm × 6 min
wm21.0
wm31.5
wm42.0
wm52.5
wb10.251.2512 krpm × 30 min
wb20.52.5
wb30.52.5
dm10.171.6710 krpm × 5 min
dm20.33
dm30.67
db10.0150.15310 krpm × 5 min
db20.031
db30.061
Disclaimer/Publisher’s Note: The statements, opinions and data contained in all publications are solely those of the individual author(s) and contributor(s) and not of MDPI and/or the editor(s). MDPI and/or the editor(s) disclaim responsibility for any injury to people or property resulting from any ideas, methods, instructions or products referred to in the content.

