
Environmentally Benign pSOFC for Emissions-Free Energy: Assessment of Nickel Network Resistance in Anodic Ni/BCY15 Nanocatalyst
 , , , ,
Abstract
1. Introduction
2. Materials and Methods
2.1. Materials
2.2. Synthesis
2.3. Sample Characterization Methods
2.3.1. Powder X-ray Diffraction (PXRD)
2.3.2. X-ray Fluorescence Spectrometry (XRF)
2.3.3. UV-Vis Diffuse Reflectance Spectroscopy (DRS)
2.3.4. X-ray Photoelectron Spectroscopy (XPS)
2.3.5. Transmission Electron Microscopy (TEM)
2.3.6. Temperature-Programmed Reduction (TPR)
2.4. Electrochemical Measurements
3. Results and Discussions
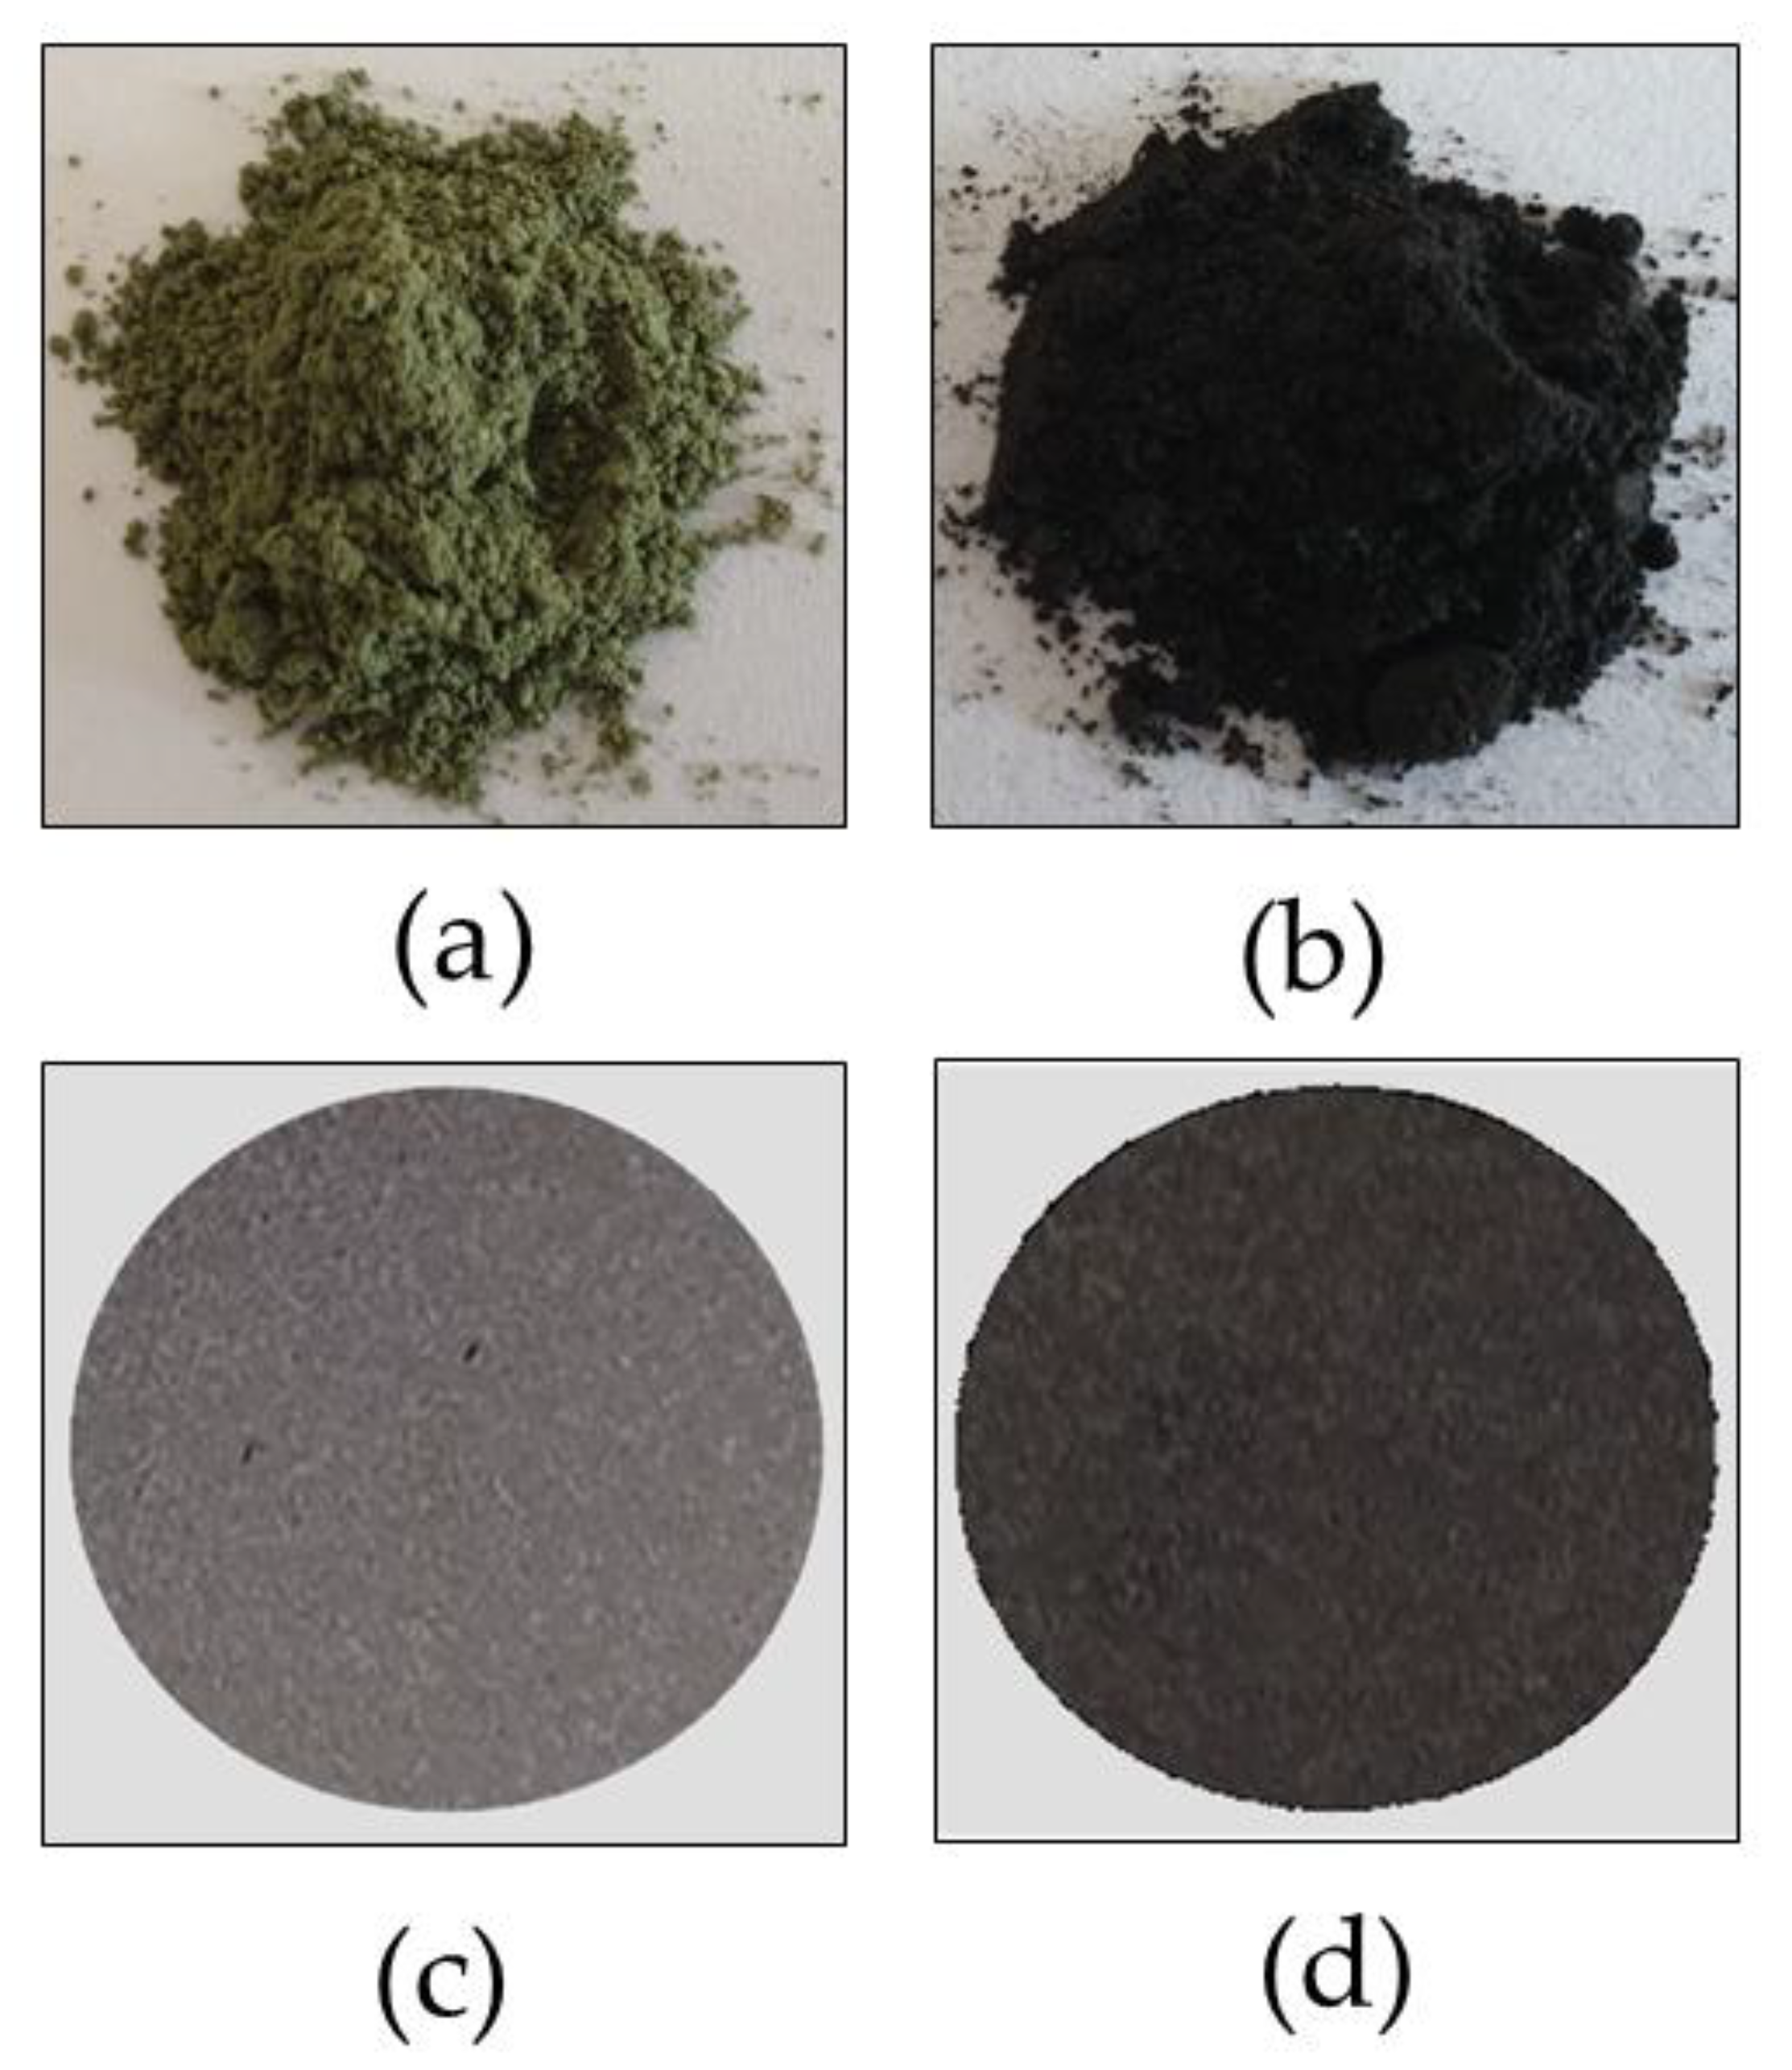
3.1. Coloration of the Forced Reoxidized Catalysts
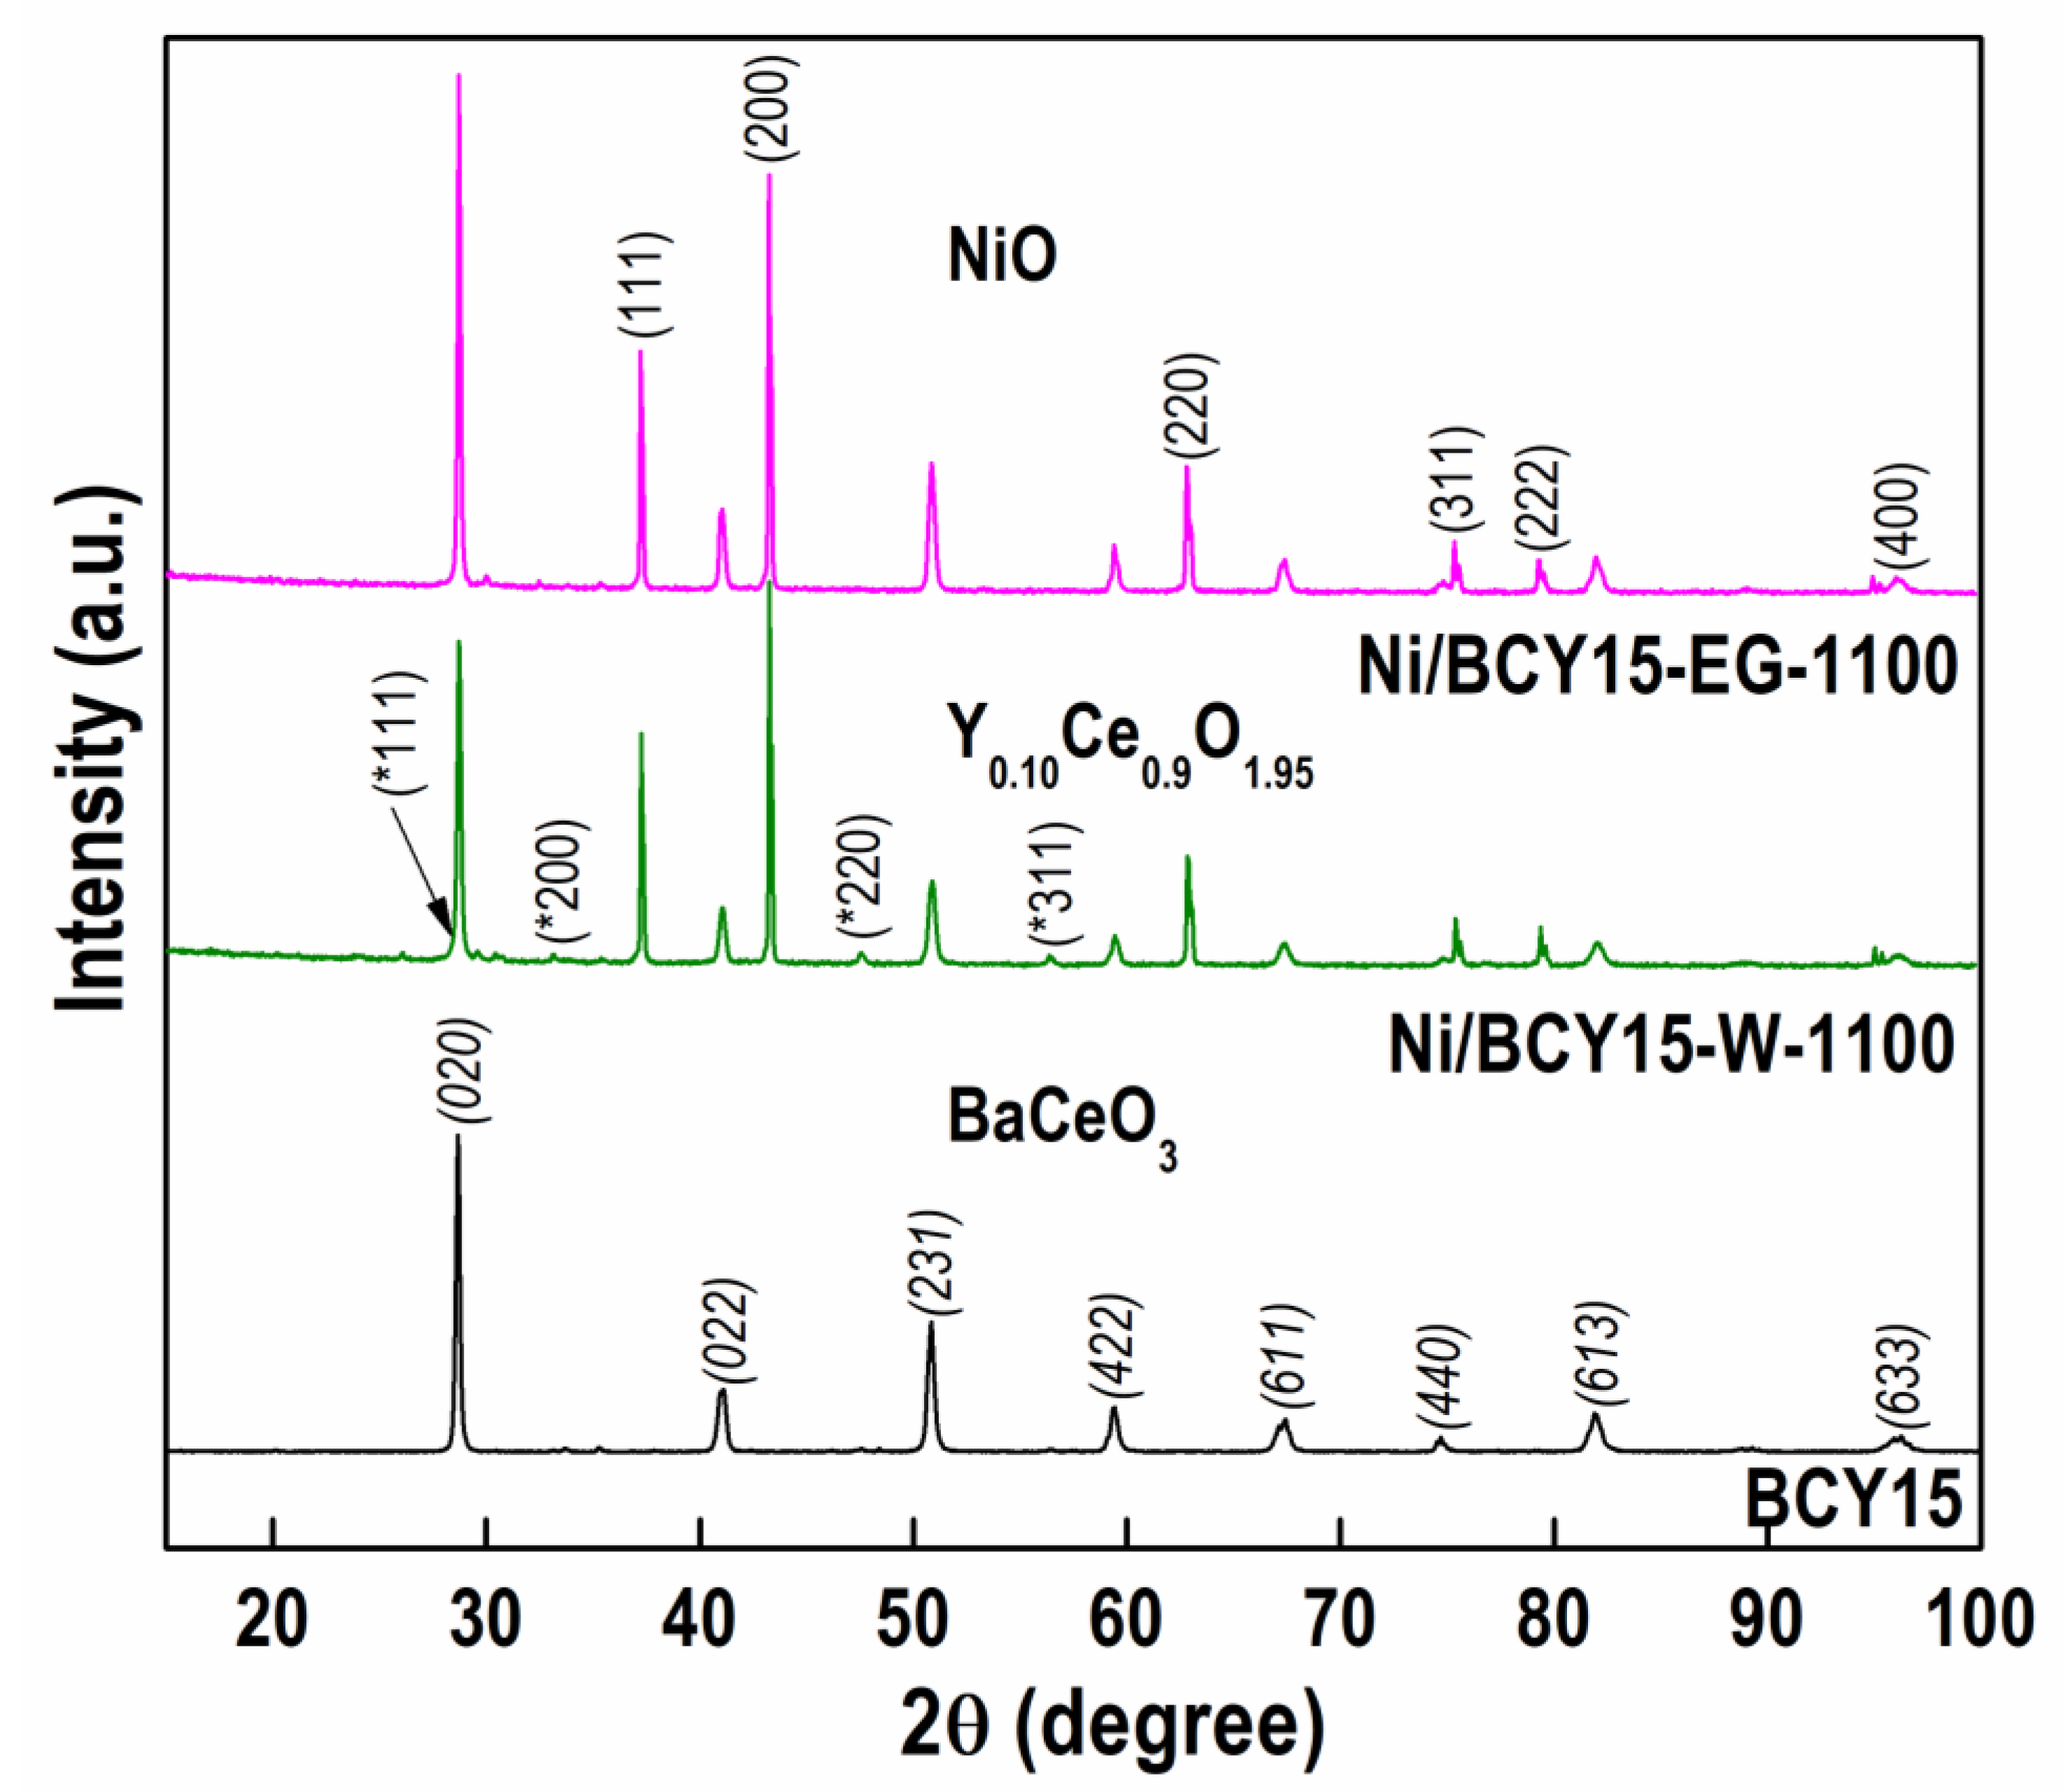
3.2. Powder X-ray Diffraction (PXRD)
3.3. X-ray Fluorescence (XRF) Spectrometry
3.4. Surface Electronic State Analysis
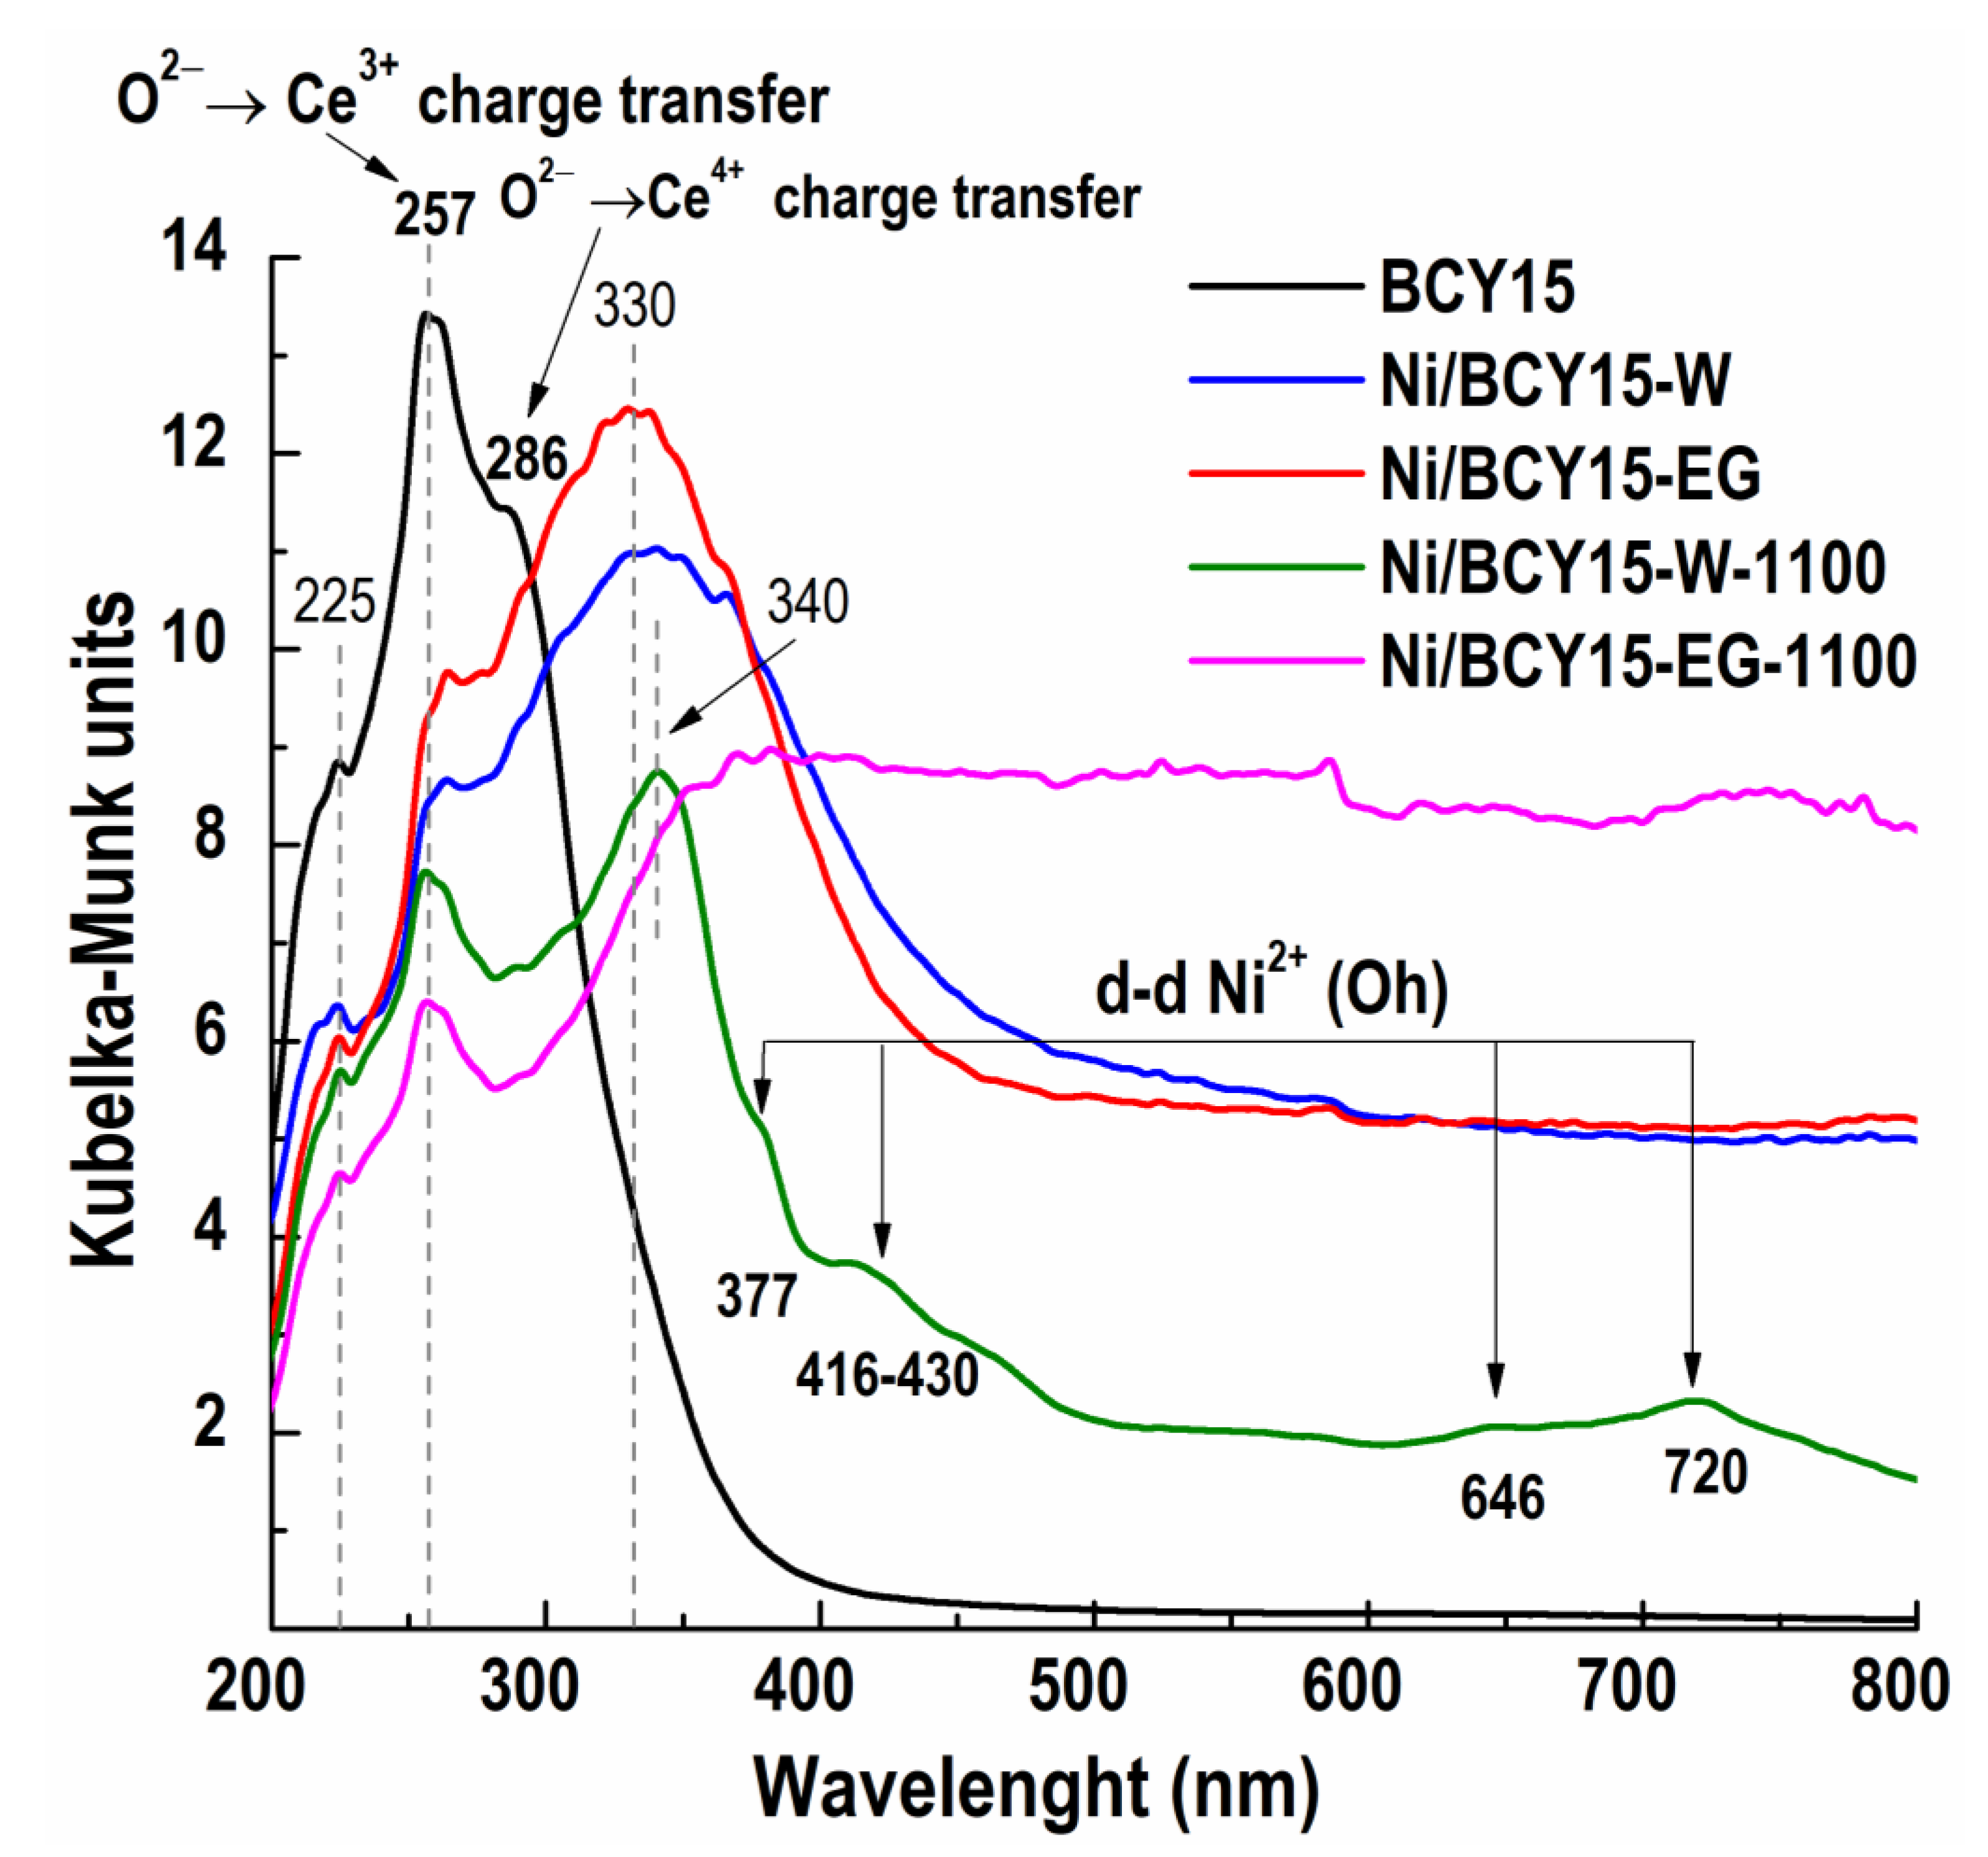
3.4.1. Diffuse Reflectance Spectroscopy (DRS)
- -
- O2− → Y3+, a charge transfer at 225 nm;
- -
- O2− → Ce3+, a charge transfer at 257 nm;
- -
- O2− → Ce4+, a charge transfer at 286 nm.
- -
- O2− → Ni2+, a charge transfer at 340 nm;
- -
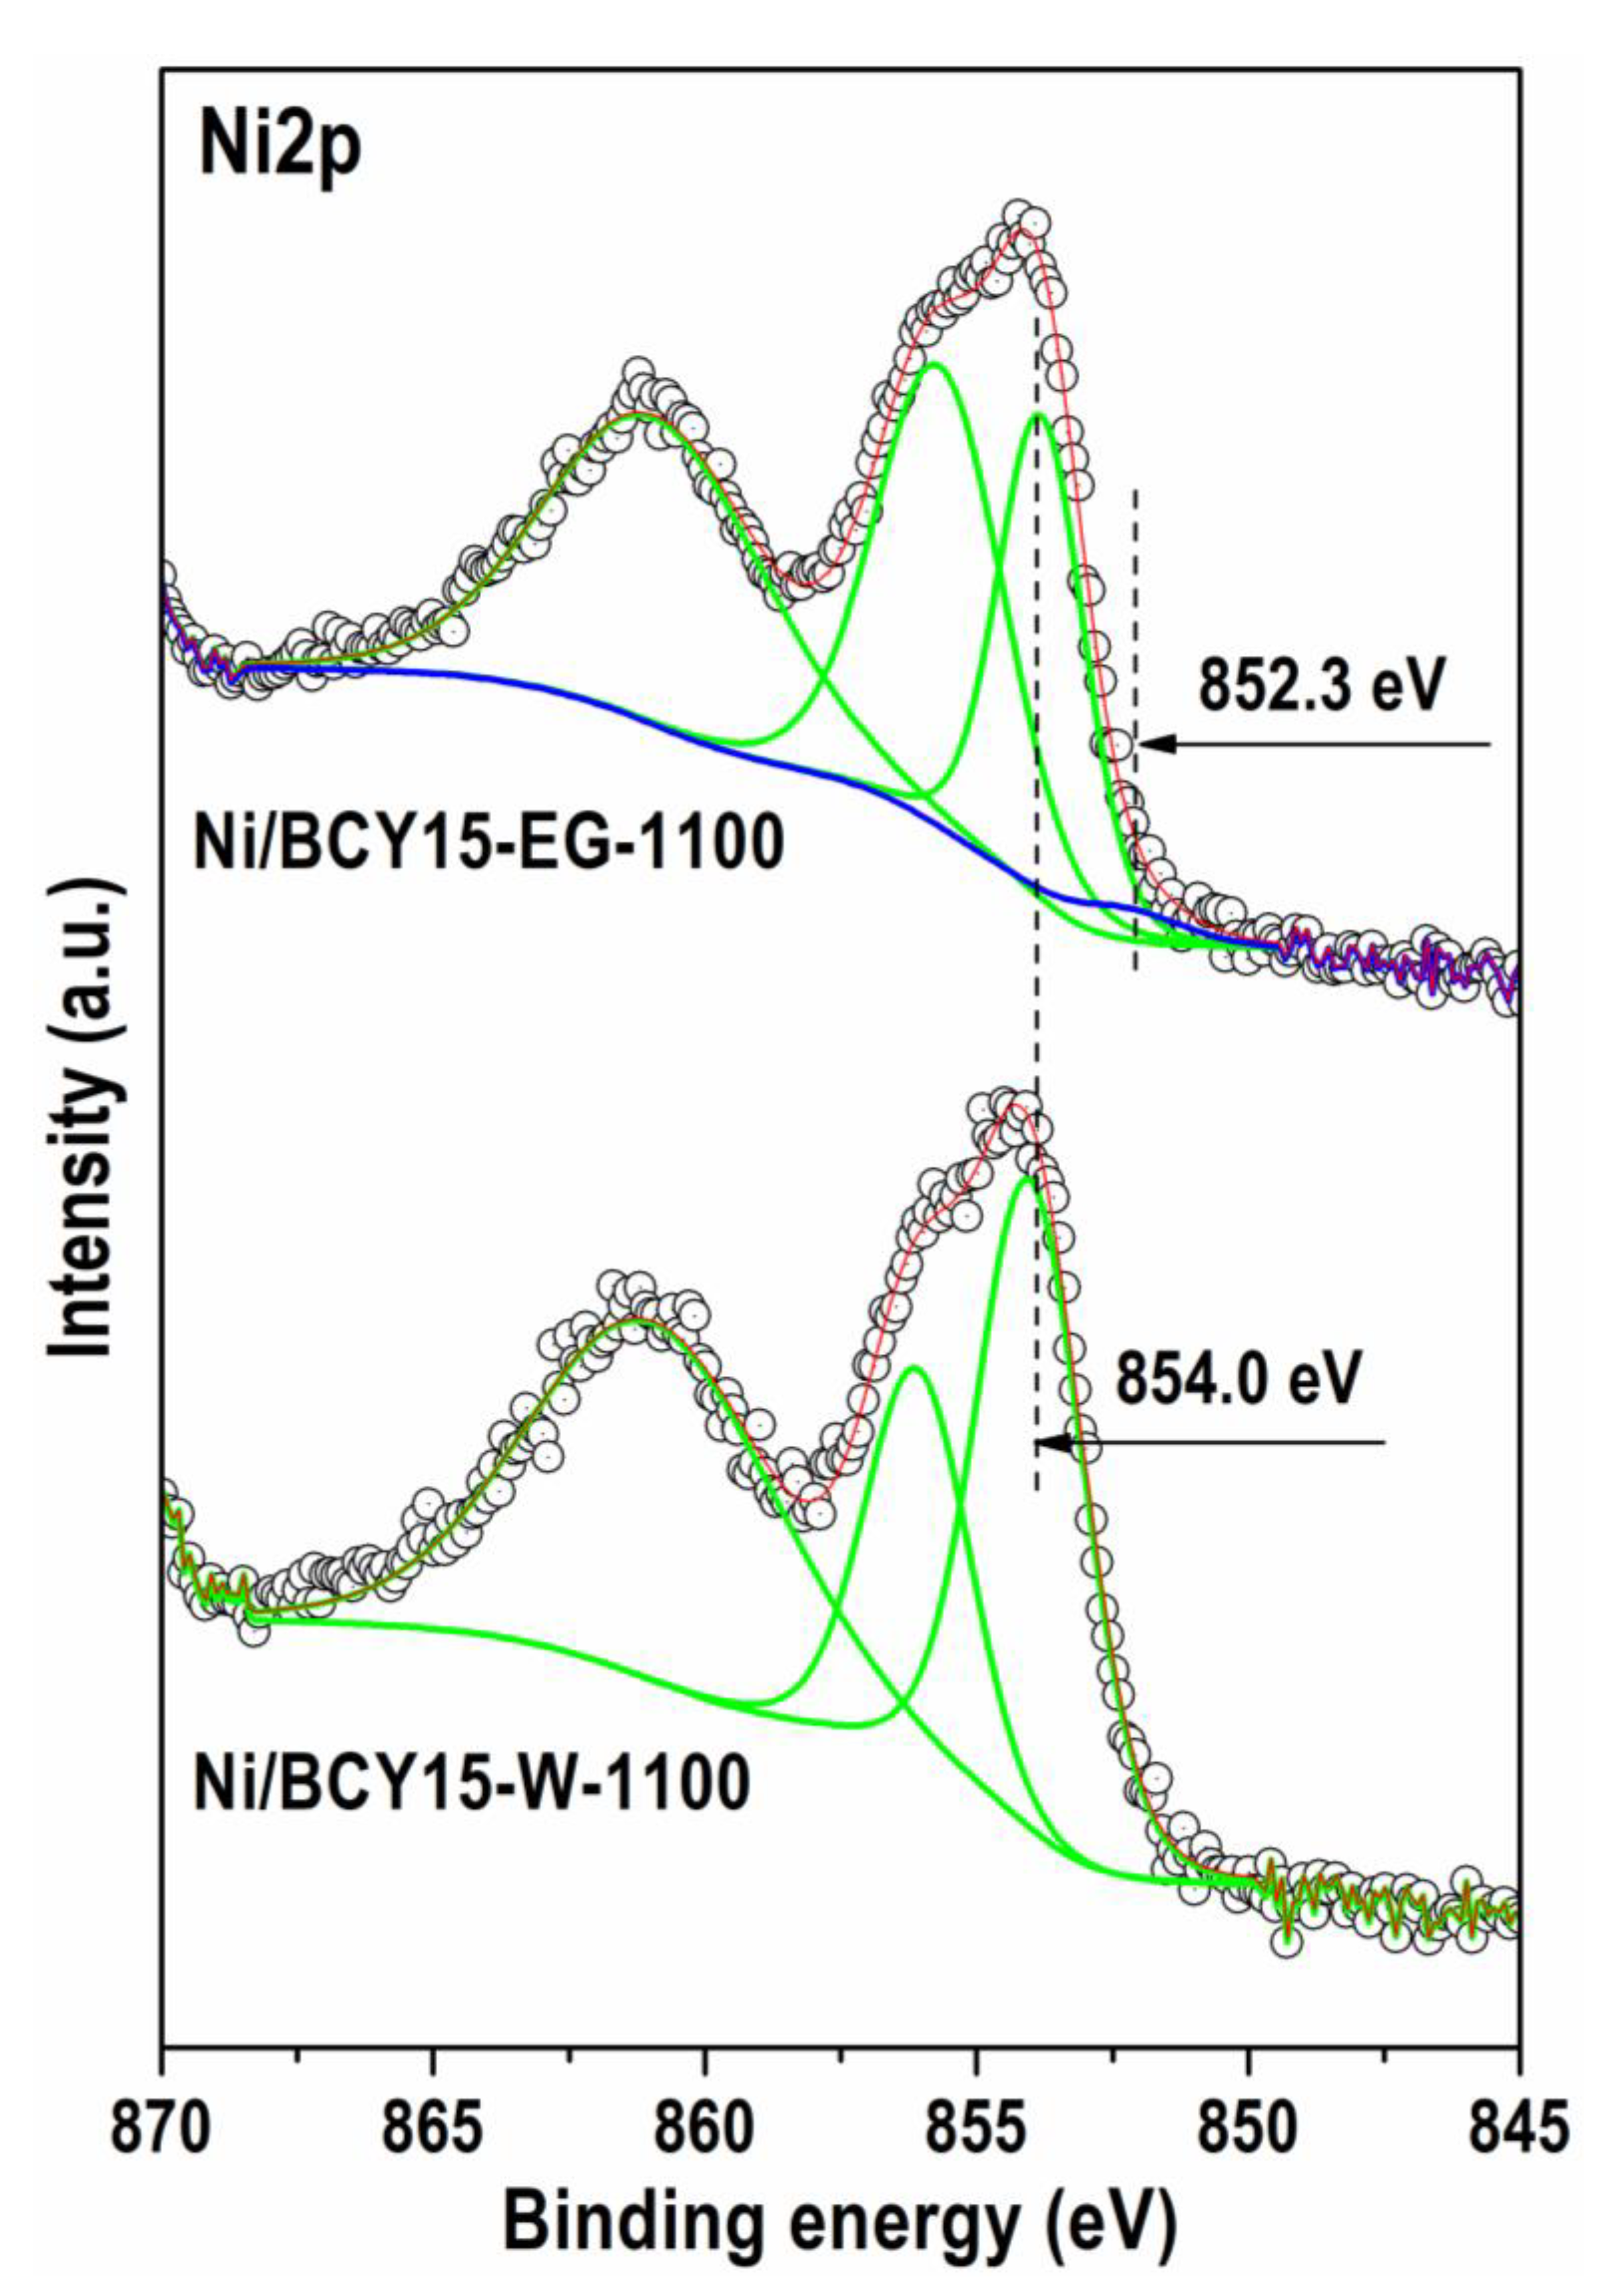
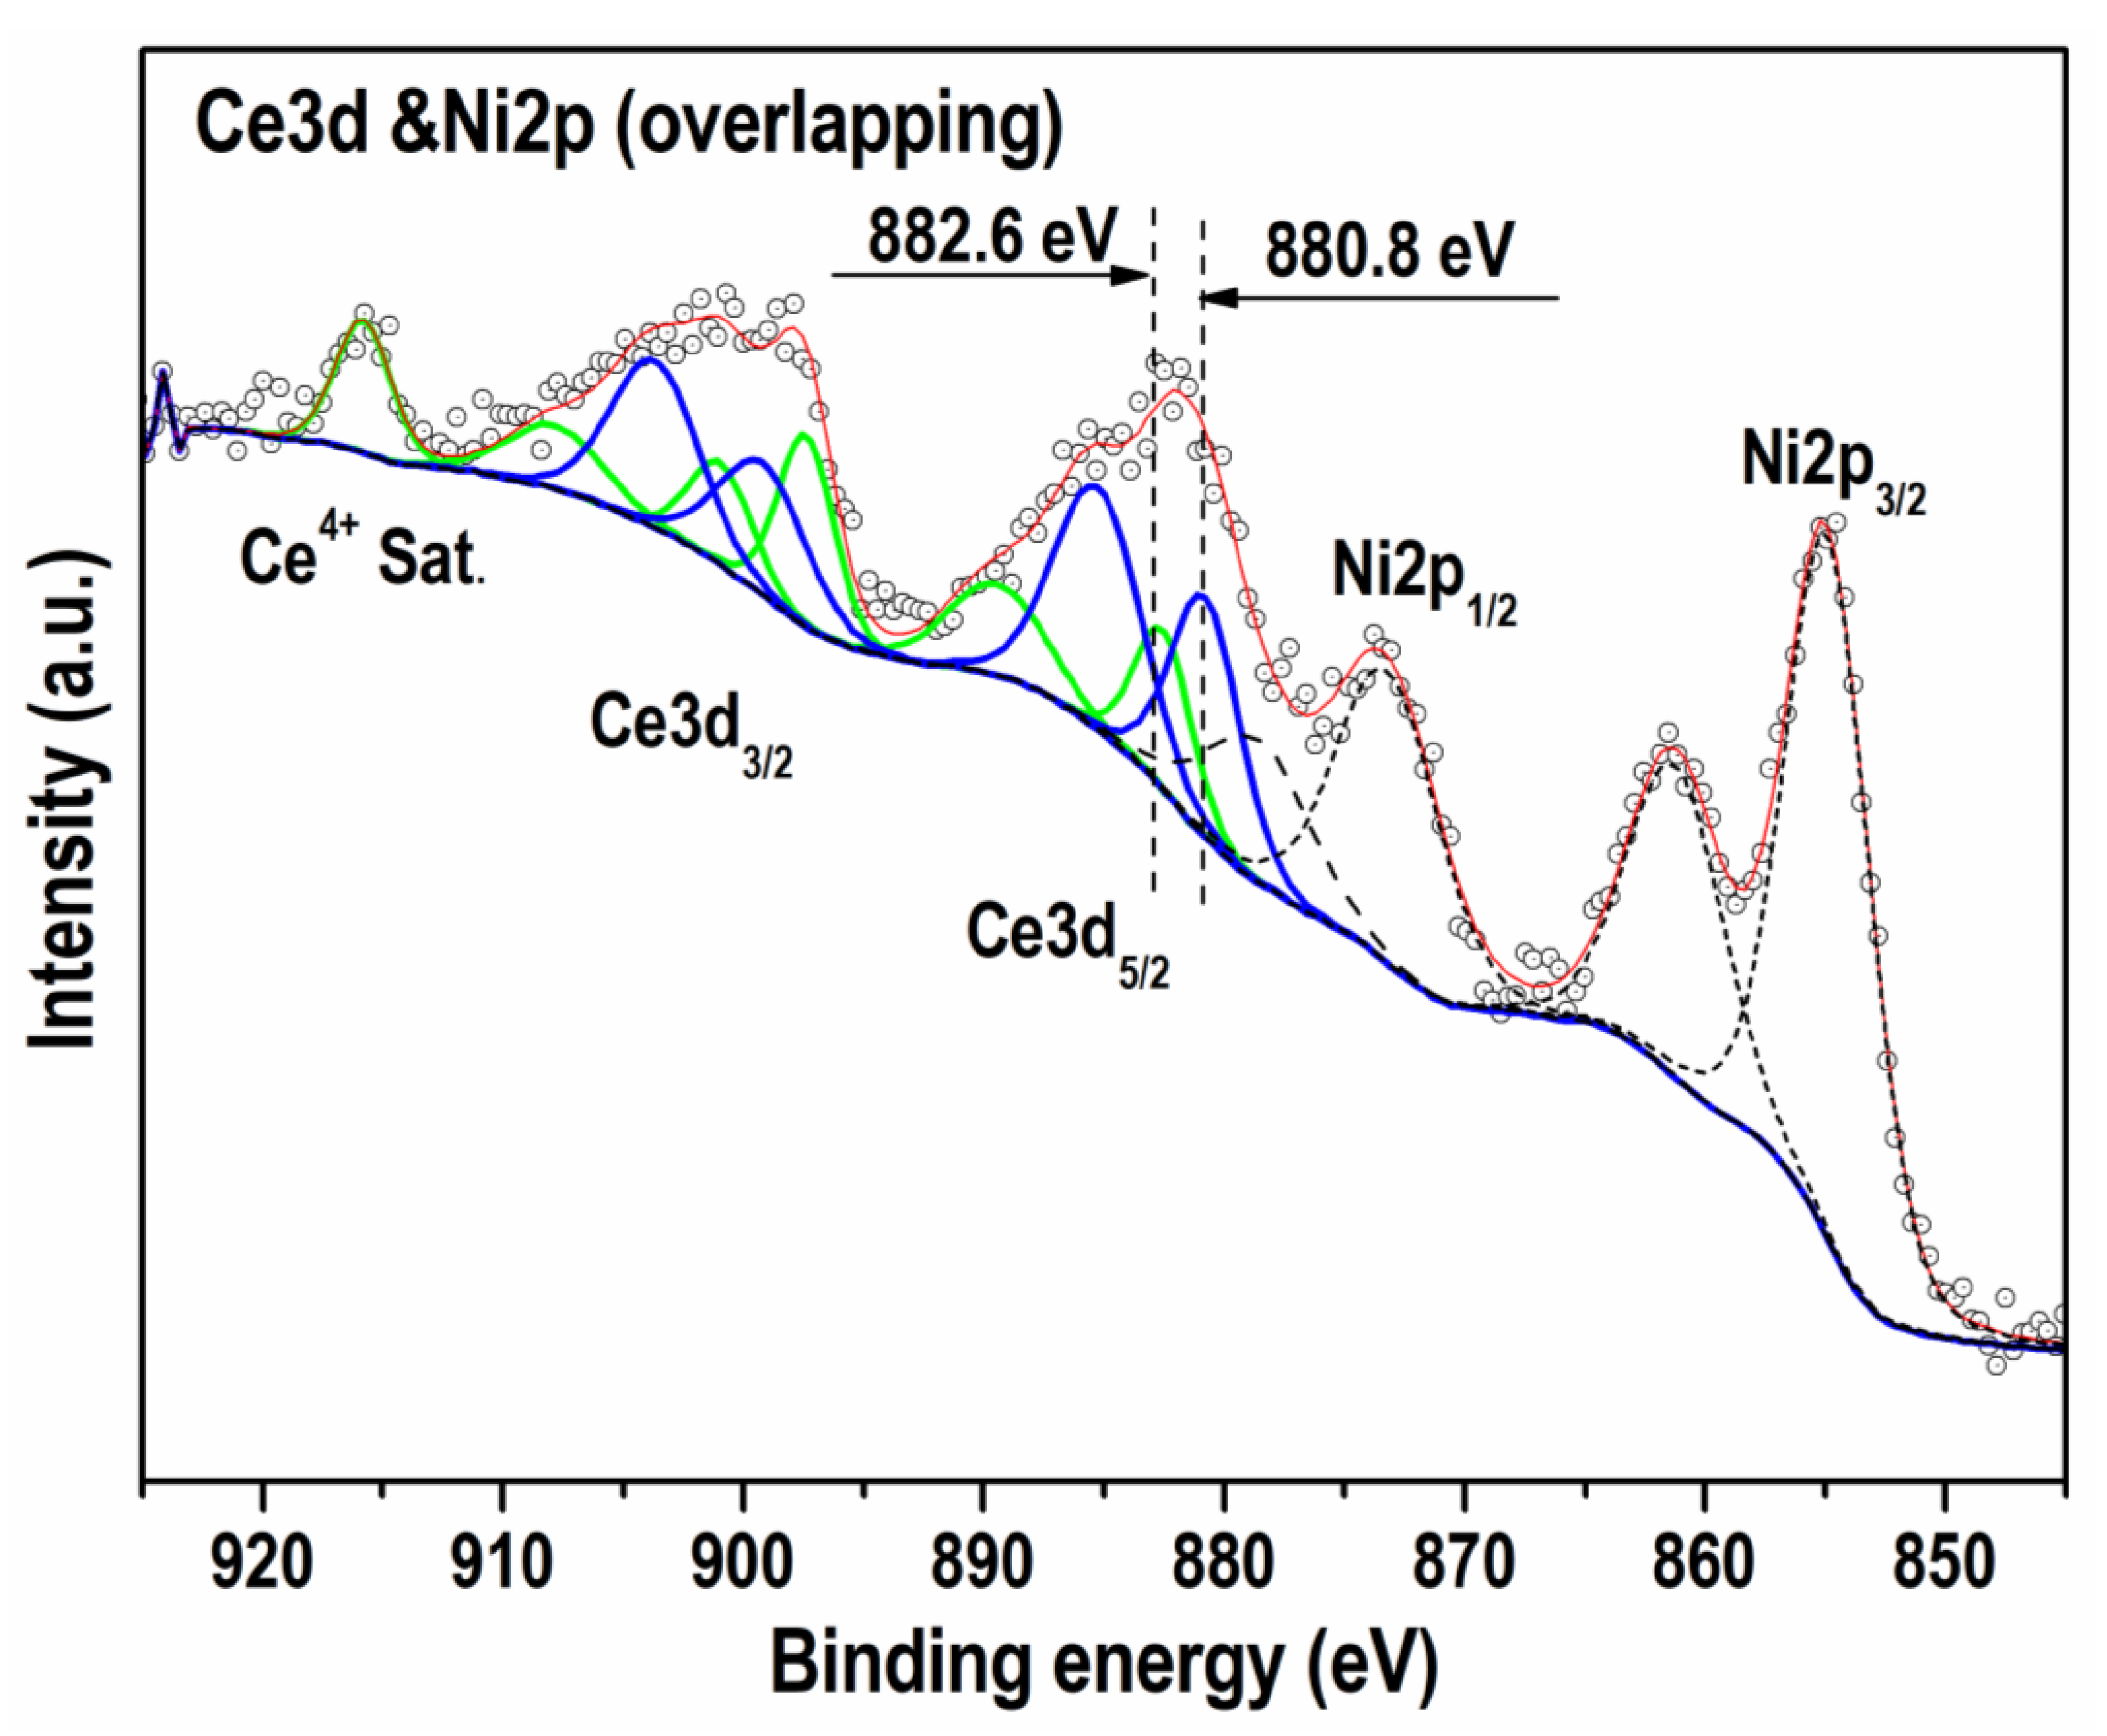
3.4.2. X-ray Photoelectron Spectroscopy (XPS)
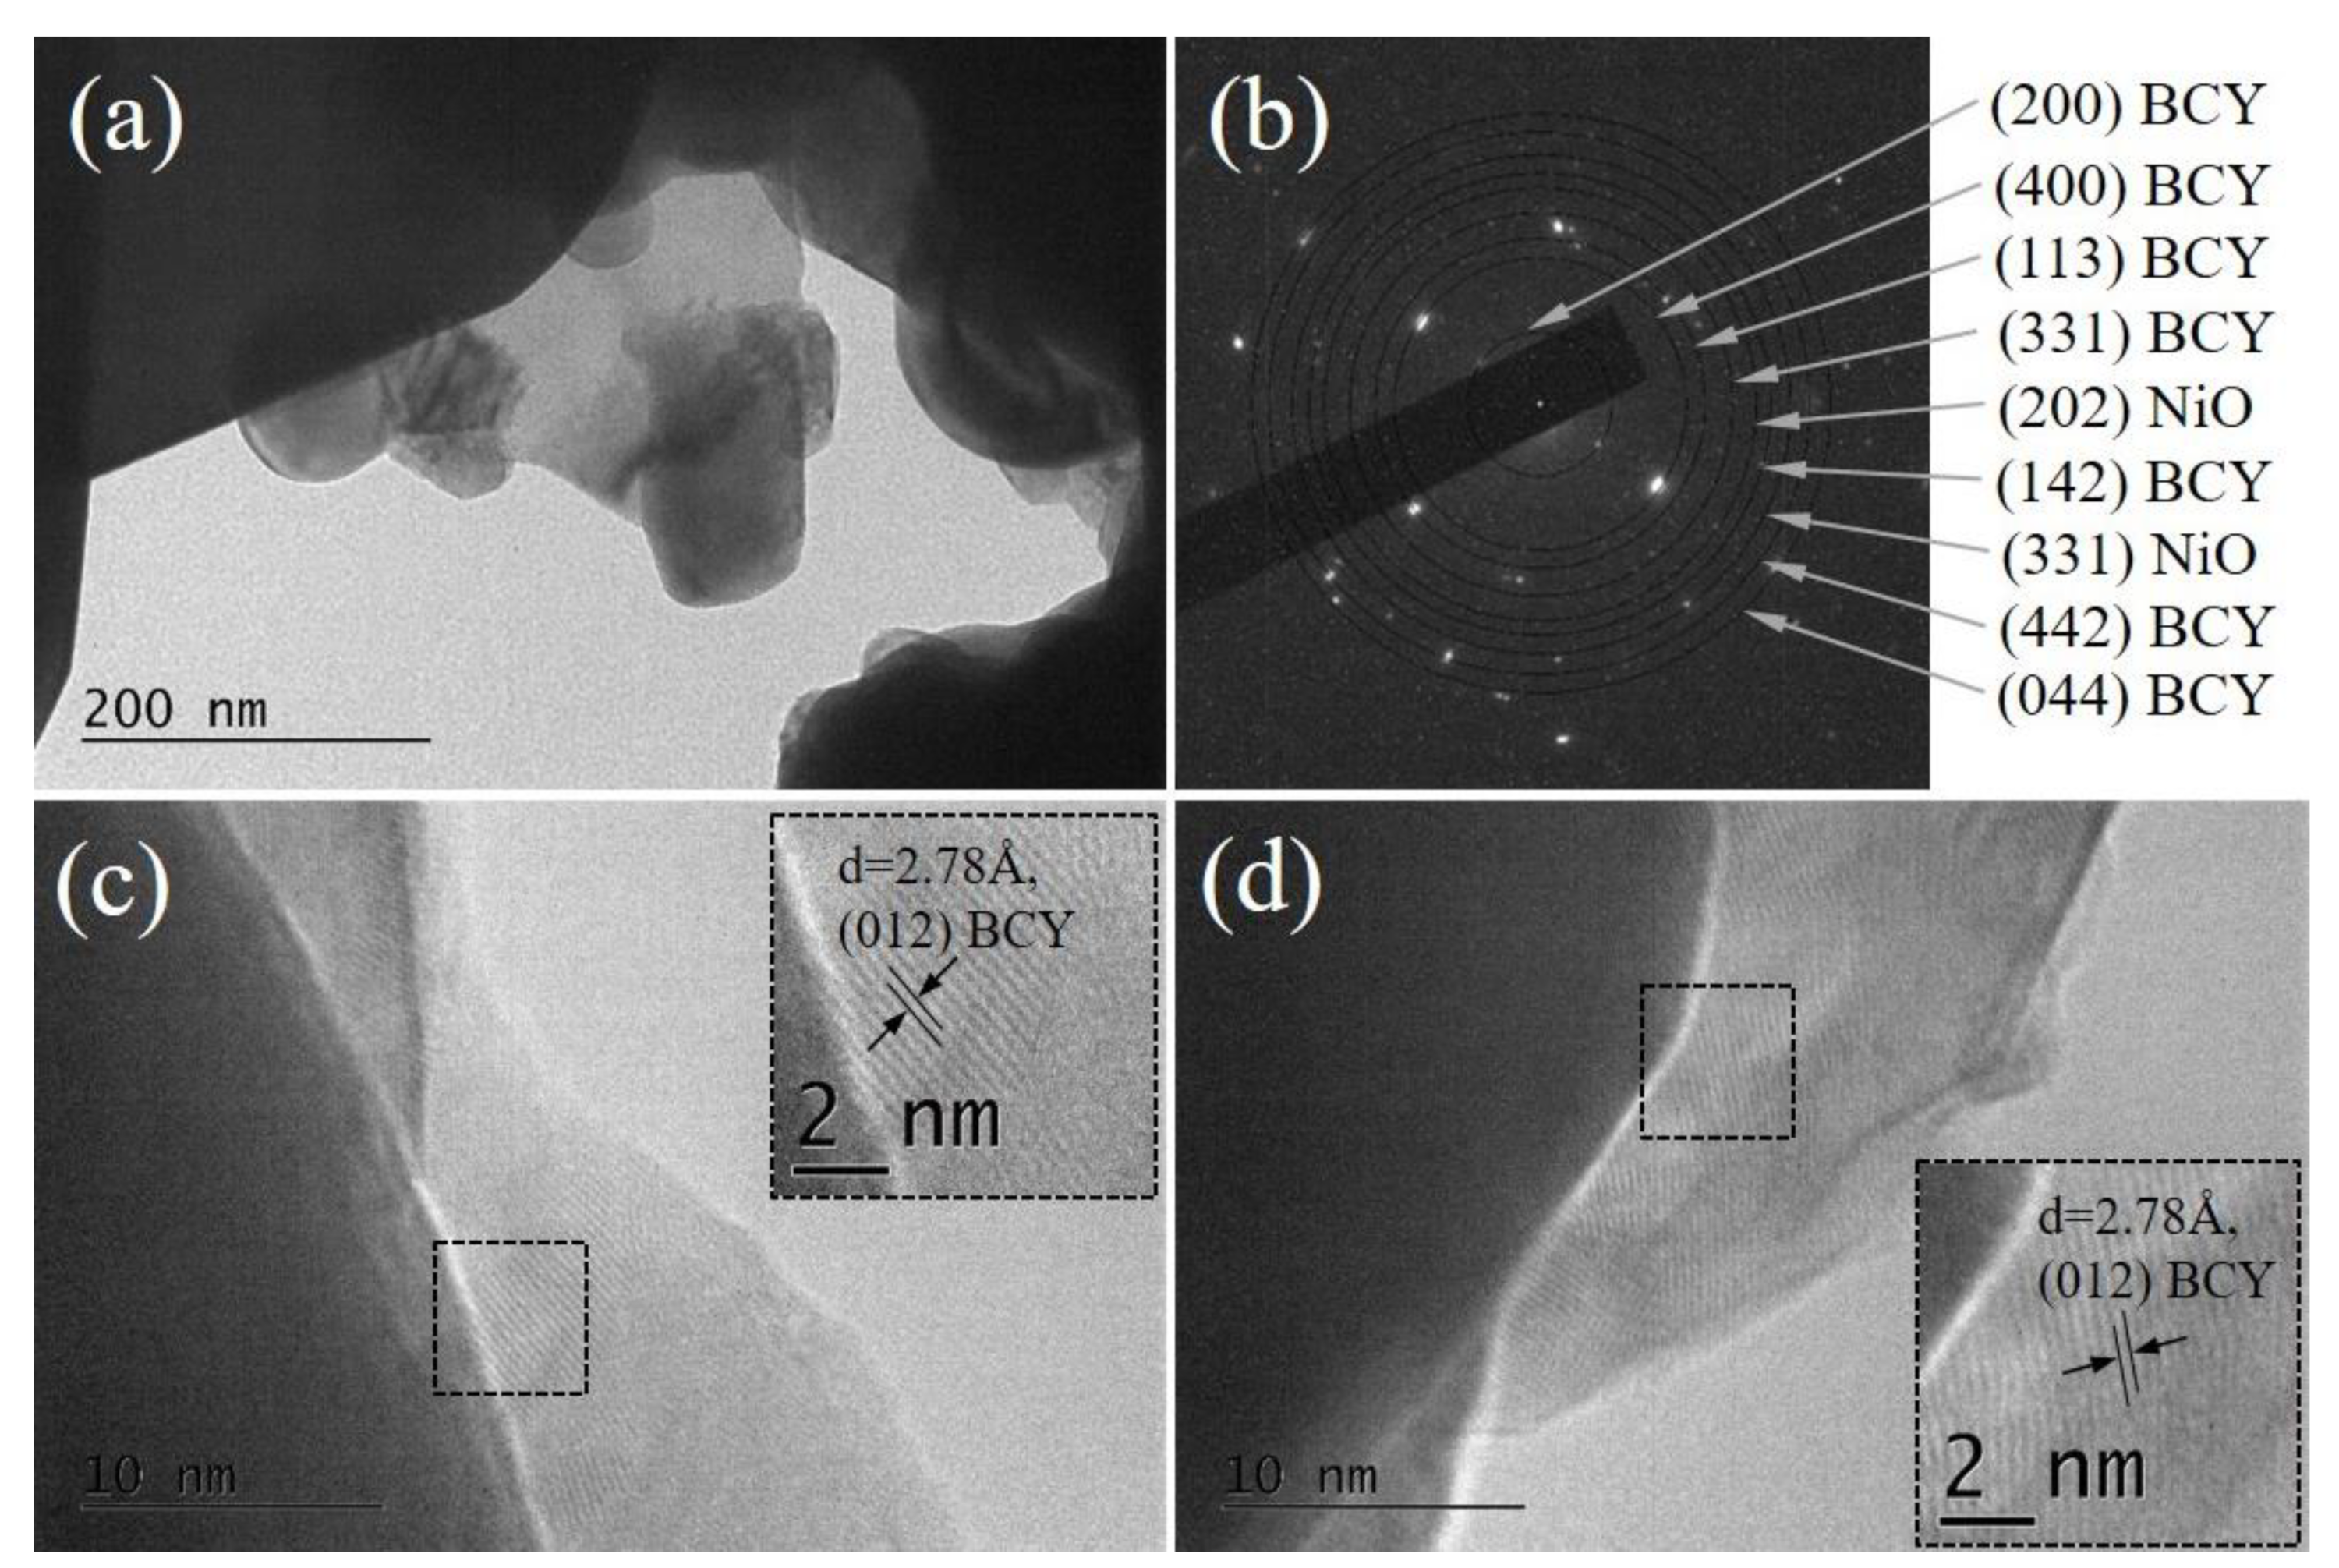
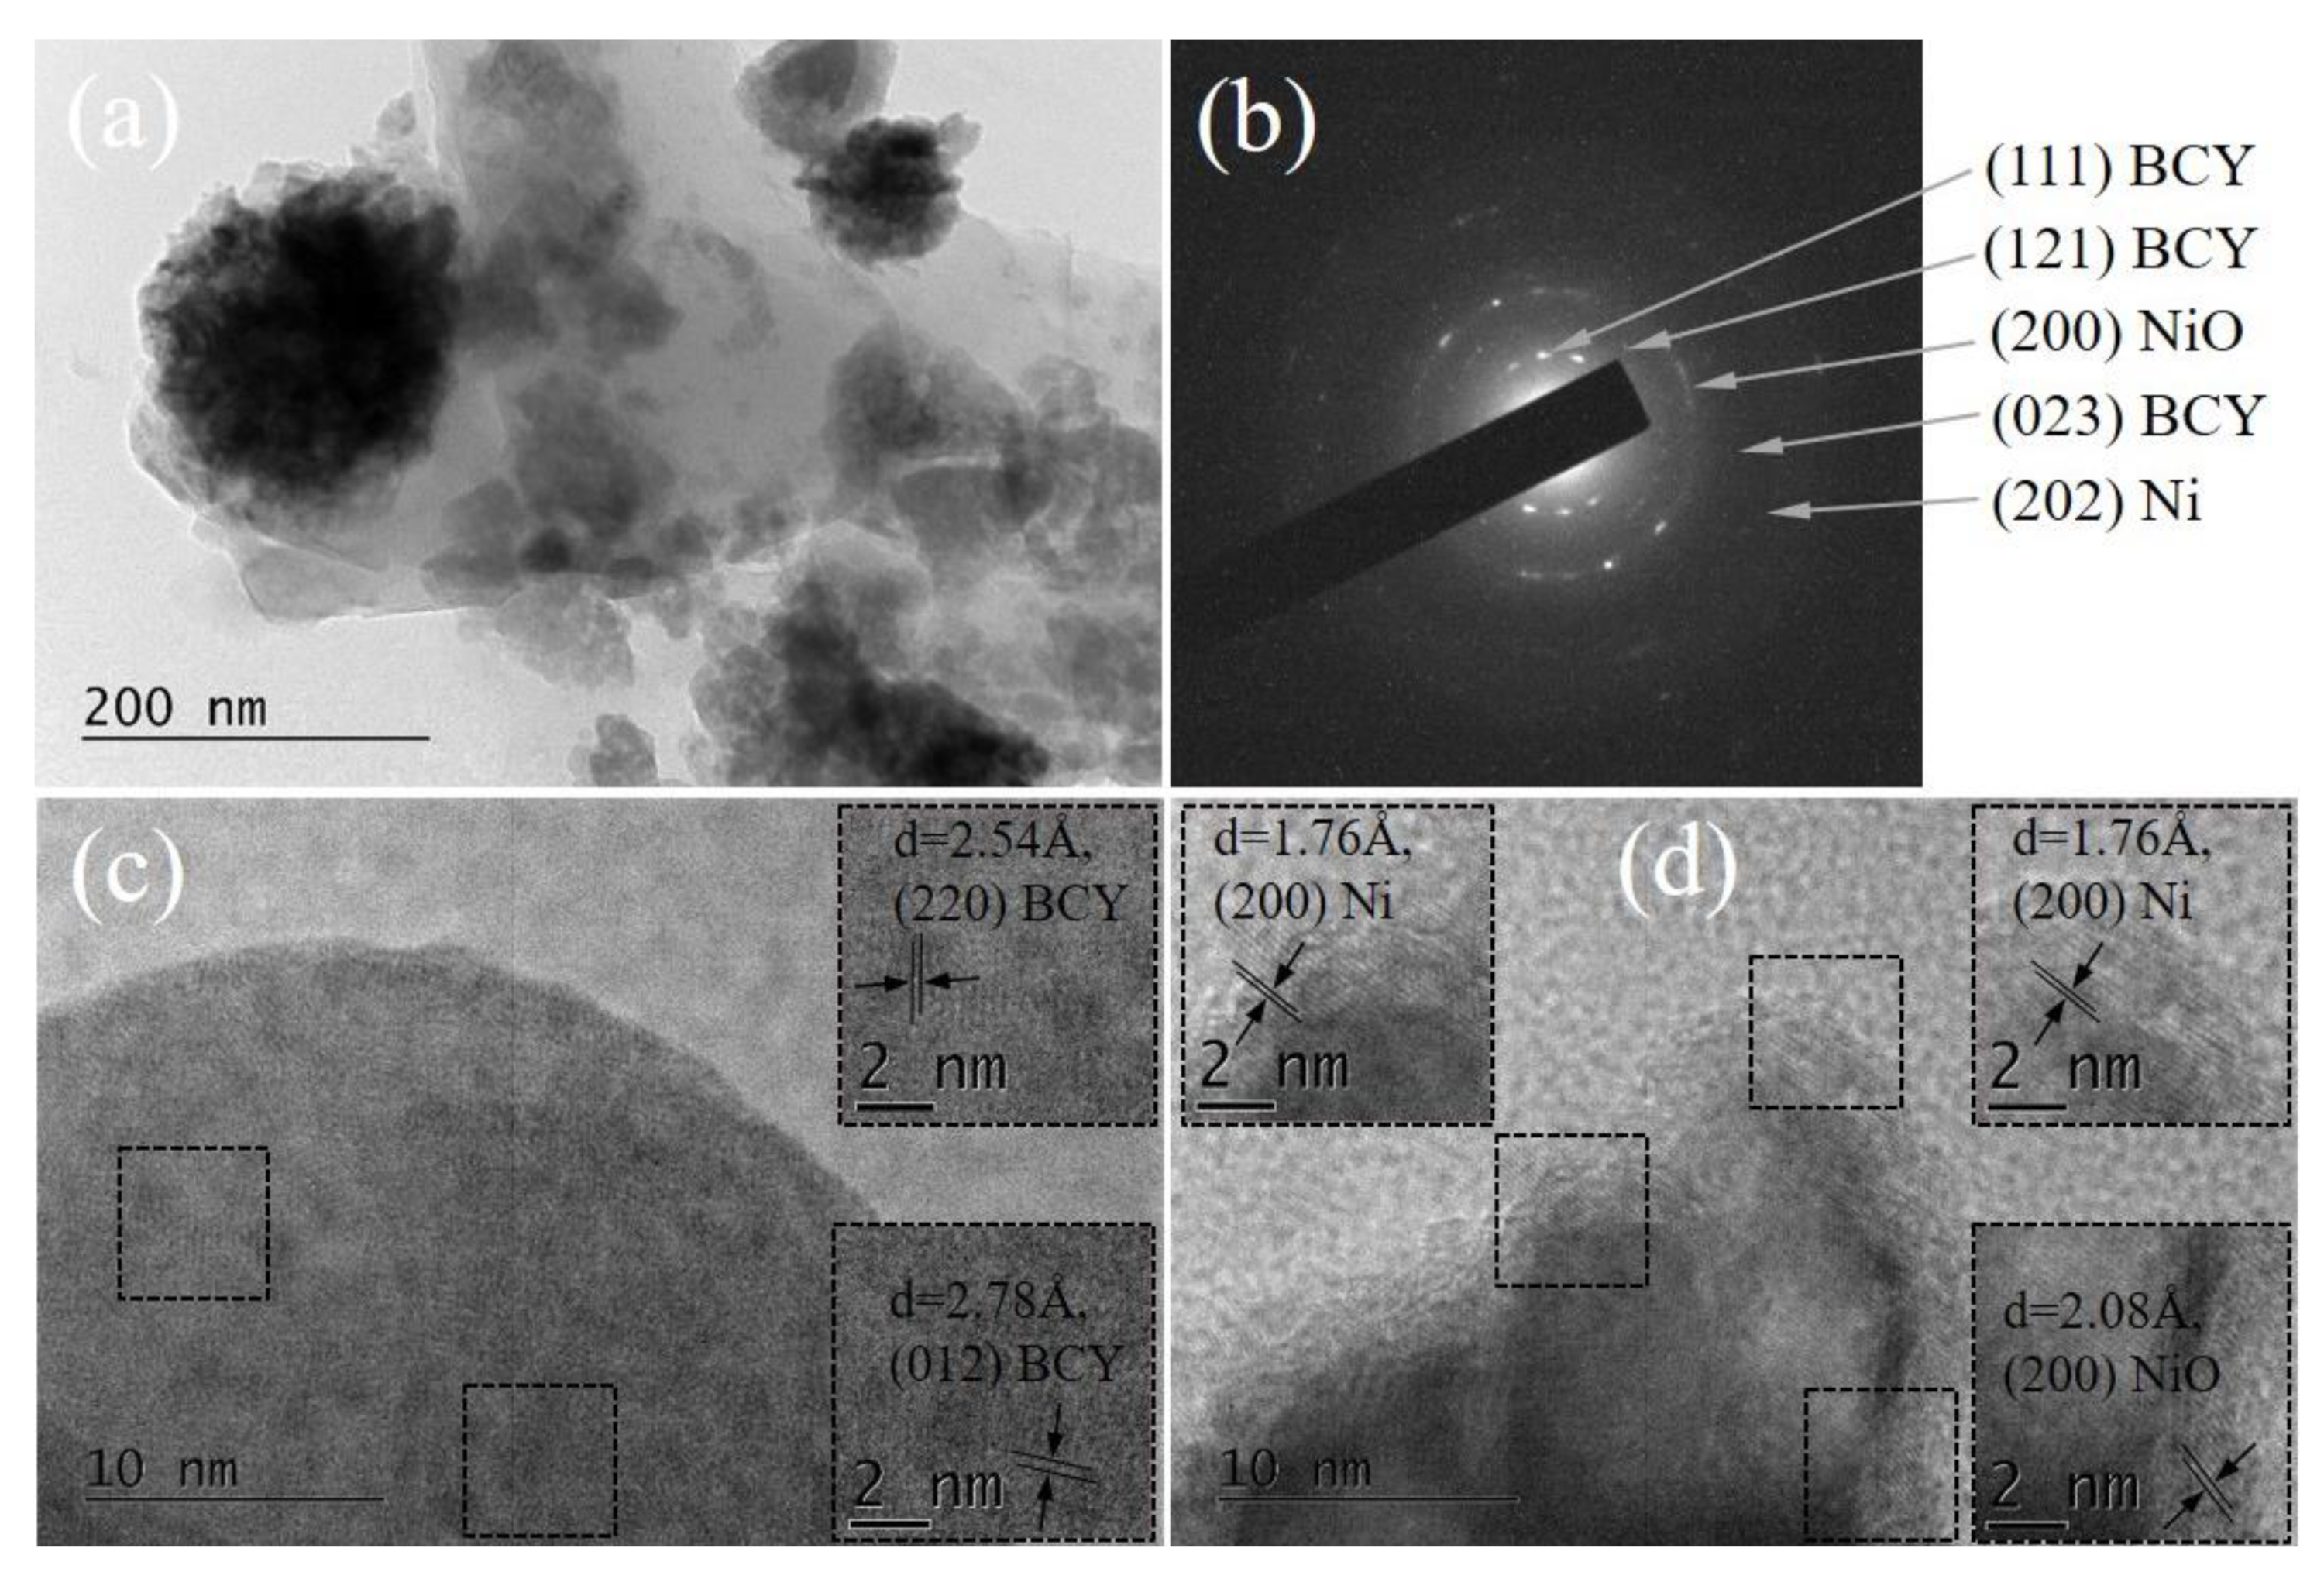
3.5. Transmission Electron Microscopy (TEM)
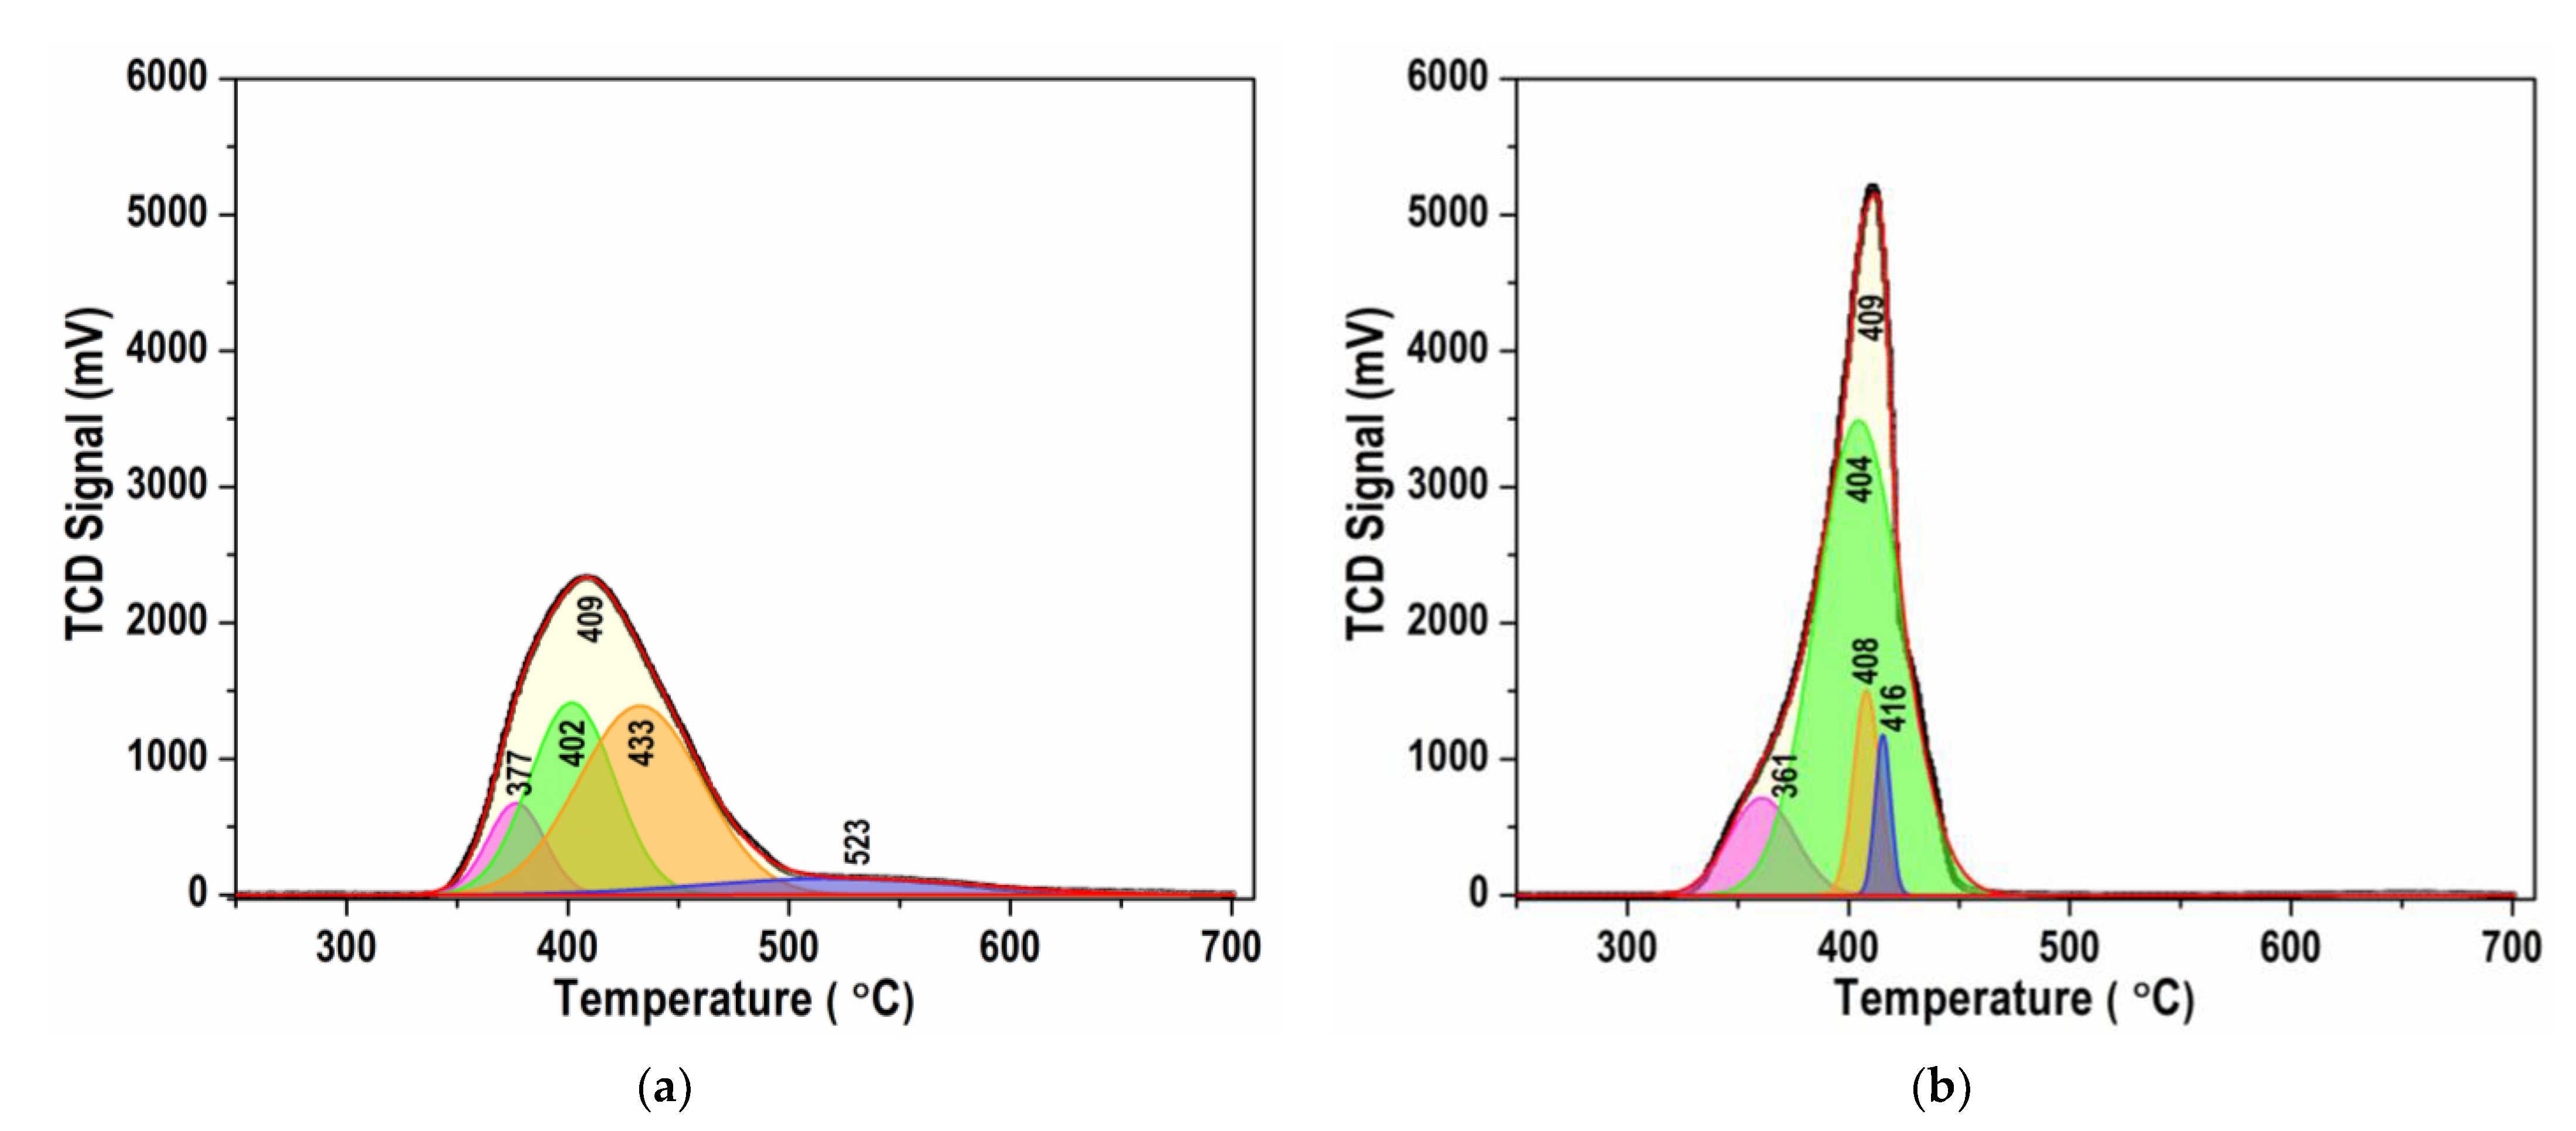
3.6. Temperature-Programmed Reduction (TPR)
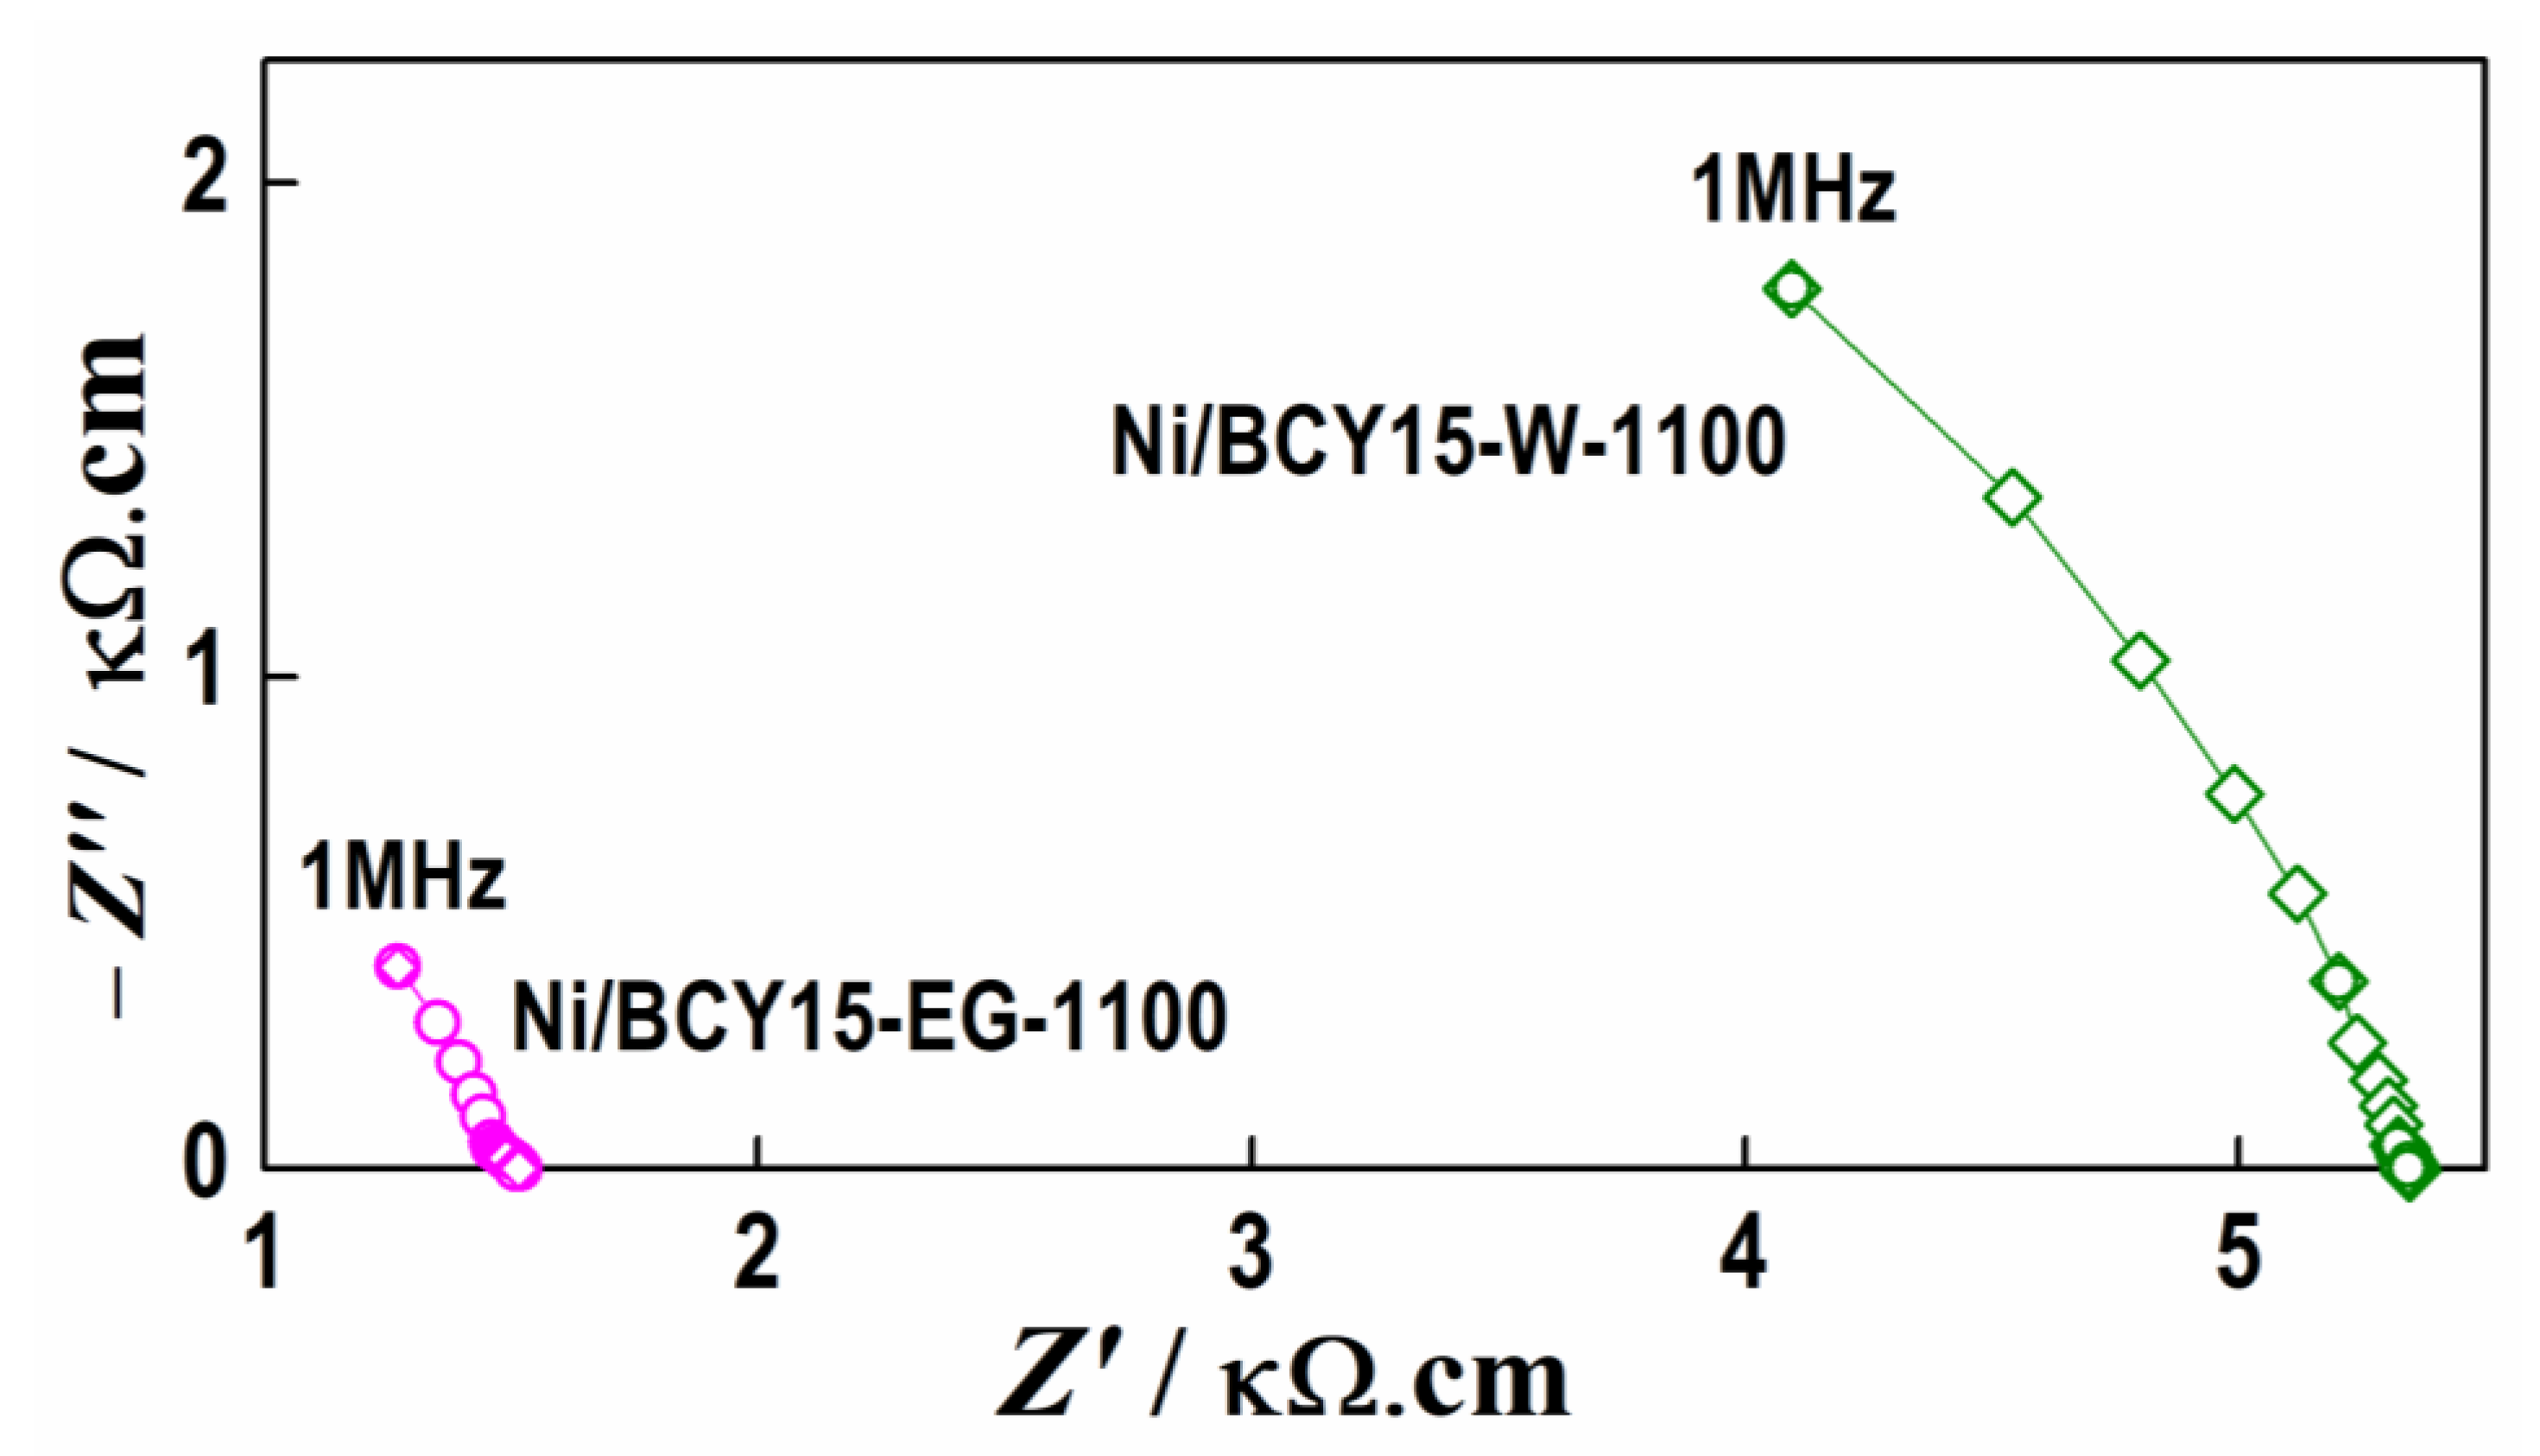
3.7. Electrochemical Performance
4. Discussion Summary
Supplementary Materials
Author Contributions
Funding
Data Availability Statement
Acknowledgments
Conflicts of Interest
References
- Ng, K.H.; Rahman, H.A.; Somalu, M.R. Review: Enhancement of composite anode materials for low-temperature solid oxide fuels. Int. J. Hydrogen Energy 2019, 44, 30692–30704. [Google Scholar] [CrossRef]
- Hussain, S.; Yangping, L. Review of solid oxide fuel cell materials: Cathode, anode, and electrolyte. Energy Trans. 2020, 4, 113–126. [Google Scholar] [CrossRef]
- He, S.; Zou, Y.; Chen, K.; Jiang, S.P. A critical review of key materials and issues in solid oxide cells. Interdiscip. Mater. 2023, 2, 111–136. [Google Scholar] [CrossRef]
- Communication from the Commission to the European Parliament, The Council, The European Economic and Social Committee and the Committee of the Regions. ‘Fit for 55’: Delivering the EU’s 2030 Climate Target on the Way to Climate Neutrality, Brussels, 14.7.2021 COM (2021) 550 Final. Available online: https://www.eea.europa.eu/policy-documents/communication-from-the-commission-to-1 (accessed on 10 March 2023).
- Hossain, S.; Abdalla, A.M.; Noorazean, S.; Jamain, B.; Zaini, J.Z.; Azad, A.K. A review on proton conducting electrolytes for clean energy and intermediate temperature-solid oxide fuel cells. Renew. Sustain. Energy Rev. 2017, 79, 750–764. [Google Scholar] [CrossRef]
- Vafaeenezhad, S.; Hanifi, A.R.; Laguna-Bercero, M.A.; Etsell, T.H.; Sarkar, P. Microstructure and long-term stability of Ni–YSZ anode supported fuel cells: A review. Mater. Futures 2022, 1, 042101. [Google Scholar] [CrossRef]
- Stambouli, A.; Traversa, E. Solid oxide fuel cells (SOFCs): A review of an environmentally clean and efficient source of energy. Renew. Sustain. Energy Rev. 2002, 6, 433–455. [Google Scholar] [CrossRef]
- Xiao, G.; Chen, F. Redox stable anodes for solid oxide fuel cells. Front. Energy Res. 2014, 2, 18. [Google Scholar] [CrossRef]
- Dwivedi, S. Solid oxide fuel cell: Materials for anode, cathode and electrolyte. Int. J. Hydrog. Energy 2020, 45, 23988–24013. [Google Scholar] [CrossRef]
- Shen, C.-T.; Lee, Y.-H.; Xie, K.; Yen, C.-P.; Jhuang, J.-W.; Lee, K.-R.; Lee, S.-W.; Tseng, C.-J. Correlation between microstructure and catalytic and mechanical properties during redox cycling for Ni-BCY and Ni-BCZY composites. Ceram. Int. 2017, 43, S671–S674. [Google Scholar] [CrossRef]
- Fan, L.; Zhu, B.; Su, P.-C.; He, C. Nanomaterials and technologies for low temperature solid oxide fuel cells: Recent advances, challenges and opportunities. Nano Energy 2018, 45, 148–176. [Google Scholar] [CrossRef]
- Song, J.; Birdja, Y.Y.; Zhiyuan, D.P.; Vaes, C.J. Recent progress in the structure optimization and development of proton-conducting electrolyte materials for low-temperature solid oxide cells. Int. J. Miner. Metall. 2022, 29, 848–869. [Google Scholar] [CrossRef]
- Fabbri, E.; Pergolesi, D.; Traversa, E. Materials challenges toward proton-conducting oxide fuel cells: A critical review. Chem. Soc. Rev. 2010, 39, 4355–4369. [Google Scholar] [CrossRef]
- Lapina, A.; Chatzichristodoulou, C.; Holtappels, P.; Mogensen, M. Composite Fe-BaCe0.2Zr0.6Y0.2O2.9 Anodes for Proton Conductor Fuel Cells. J. Electrochem. Soc. 2014, 161, F833–F837. [Google Scholar] [CrossRef]
- Shu, L.; Sunarso, J.; Hashim, S.S.; Mao, J.; Wei Zhou, W.; Liang, F. Advanced perovskite anodes for solid oxide fuel cells: A review. Int. J. Hydrogen Energy 2019, 44, 31275–31304. [Google Scholar] [CrossRef]
- Iwahara, H. Technological challenges in the application of proton conducting ceramics. Solid State Ion. 1995, 77, 289–298. [Google Scholar] [CrossRef]
- Frontera, P.; Modafferi, V.; Frusteri, F.; Bonura, G.; Bottari, M.; Siracusano, S.; Antonucci, P. Catalytic features of Ni/Ba–Ce0.9–Y0.1 catalyst to produce hydrogen for PCFCs by methane reforming. Int. J. Hydrogen Energy 2010, 35, 11661–11668. [Google Scholar] [CrossRef]
- Fabbri, E.; Pergolesi, D.; Traversa, E. Electrode materials: A challenge for the exploitation of protonic solid oxide fuel cells. Sci. Technol. Adv. Mater. 2010, 11, 044301. [Google Scholar] [CrossRef]
- Fua, Q.; Tietz, F.; Sebold, D.; Tao, S.; Irvine, J.T.S. An efficient ceramic-based anode for solid oxide fuel cells. J. Power Sources 2007, 171, 663–669. [Google Scholar] [CrossRef]
- Hadi, N.H.; Somalu, M.R.; Samat, A.A.; Muchtar, A.; Baharuddin, N.A.; Anwar, M. A review on the preparation of anode materials and anode films for solid oxide fuel cell applications. Int. J. Energy Res. 2021, 45, 14357–14388. [Google Scholar] [CrossRef]
- Liu, Y.; Shao, Z.; Mori, T.; Jiang, S.P. Development of nickel based cermet anode materials in solid oxide fuel cells–Now and future. MRE 2021, 1, 100003. [Google Scholar] [CrossRef]
- Yu, Y.; Lee, S.J.; Theerthagiri, J.; Lee, Y.; Choi, M.Y. Architecting the AuPt alloys for hydra-zine oxidation as an anolyte in fuel cell: Comparative analysis of hydrazine splitting and water splitting for energy-saving H2 generation. Appl. Catal. B Environ. 2022, 316, 121603. [Google Scholar] [CrossRef]
- Theerthagiri, J.; Karuppasamy, K.; Lee, S.J.; Shwetharani, R.; Kim, H.-S.; Pasha, S.K.K.; Ashokkumar, M.; Choi, M.Y. Fundamentals and comprehensive insights on pulsed laser synthesis of advanced materials for diverse photo- and electrocatalytic applications. Light Sci. Appl. 2022, 11, 250. [Google Scholar] [CrossRef] [PubMed]
- Chevallier, L.; Zunic, M.; Esposito, V.; Di Bartolomeo, E.; Traversa, E. A wet-chemical route for the preparation of Ni–BaCe0.9Y0.1O3−δ cermet anodes for IT-SOFCs. Solid State Ion. 2009, 180, 715–720. [Google Scholar] [CrossRef]
- Tan, C.; Zhang, H. Wet-chemical synthesis and applications of non-layer structured two-dimensional nanomaterials. Nat. Commun. 2015, 6, 7873. [Google Scholar]
- Wu, S.-H.; Chen, D.-H. Synthesis and characterization of nickel nanoparticles by hydrazine reduction in ethylene glycol. J. Colloid Interface Sci. 2003, 259, 282–286. [Google Scholar]
- Park, J.; Chae, E.; Kim, S.; Lee, J.; Kim, J.; Yoon, S.; Choi, J.-Y. Preparation of fine Ni powders from nickel hydrazine complex. Mater. Chem. Phys. 2006, 97, 371–378. [Google Scholar]
- Wang, D.P.; Sun, D.-B.; Yu, H.-Y.; Meng, H.-M. Morphology controllable synthesis of nickel nanopowders by chemical reduction process. J. Cryst. Growth 2008, 310, 1195–1201. [Google Scholar] [CrossRef]
- Huang, G.-Y.; Xu, S.-M.; Xu, G.; Li, L.-Y.; Zhang, L.-F. Preparation of fine nickel powders via reduction of nickel hydrazine complex precursors. Trans. Nonferr. Met. Soc. China 2009, 19, 389–393. [Google Scholar] [CrossRef]
- Gabrovska, M.; Nikolova, D.; Mladenova, E.; Vladikova, D.; Rakovsky, S.; Stoynov, Z. Ni incorporation in pSOFC anode ceramic matrix: Part II. Wet chemical reduction in an anhydrous medium. Bulg. Chem. Commun. 2018, 50, 119–126. [Google Scholar]
- Nikolova, D.; Gabrovska, M.; Raikova, G.; Mladenova, E.; Vladikova, D.; Kostov, K.L.; Karakirova, Y. New Insights on the Nickel State Deposited by Hydrazine Wet-Chemical Synthesis Route in the Ni/BCY15 Proton-Conducting SOFC Anode. Nanomaterials 2021, 11, 3224. [Google Scholar] [CrossRef]
- Shirley, D.A. High-Resolution X-Ray Photoemission Spectrum of the Valence Bands of Gold. Phys. Rev. B 1972, 5, 4709–4714. [Google Scholar]
- Scofield, J.H. Hartree-Slater subshell photoionization cross-sections at 1254 and 1487 eV. J. Electron. Spectrosc. Relat. Phenom. 1976, 8, 129–137. [Google Scholar] [CrossRef]
- Monti, D.A.M.; Baiker, A. Temperature-programmed reduction. Parametric sensitivity and estimation of kinetic parameters. J. Catal. 1983, 83, 323–335. [Google Scholar]
- Renaud, A.; Chavillon, B.; Cario, L.; Le Pleux, L.; Szuwarski, N.; Pellegrin, Y.; Blart, E.; Gautron, E.; Odobel, F.; Jobic, S. Origin of the Black Color of NiO Used as Photocathode in p-Type Dye-Sensitized Solar Cells. J. Phys. Chem. C 2013, 117, 22478–22483. [Google Scholar] [CrossRef]
- Li, L.; Zhou, S.; Zhang, S. Investigation on charge transfer bands of Ce4+ in Sr2CeO4 blue phosphor. Chem. Phys. Lett. 2008, 453, 283–289. [Google Scholar]
- Bensalem, A.; Muller, J.C.; Bozon-Verdura, F. From bulk CeO2 to supported cerium-oxygen clusters: A diffuse reflectance approach. J. Chem. Soc. Faraday Trans. 1992, 88, 153–154. [Google Scholar] [CrossRef]
- Mahammadunnisa, S.; Reddy, P.M.K.; Lingaiah, N.; Subrahmanyam, C. NiO/Ce1-xNixO2-δ as an alternative to noble metal catalysts for CO oxidation NiO. Catal. Sci. Technol. 2013, 3, 730–736. [Google Scholar] [CrossRef]
- Damyanova, S.; Pawelec, B.; Palcheva, R.; Karakirova, Y.; Capel Sanchez, M.C.; Tyuliev, G.; Gaigneaux, E.; Fierro, J.L.G. Structure and surface properties of ceria-modified Ni-based catalysts for hydrogen production. Appl. Catal. B Environ. 2018, 225, 340–353. [Google Scholar]
- Guo, X.; Liu, J.; Guo, G. Photocatalytic Removal of Dye and Reaction Mechanism Analysis over Y2O3 Composite Nanomaterials. In Proceedings of the Chapter 2, Nano-Materials and Composite Materials, MATEC Web of Conferences, Chengdu, China, 4–6 November 2017; Volume 88, p. 02003. [Google Scholar]
- Italiano, C.; Llorca, J.; Pino, L.; Ferraro, M.; Antonucci, V.; Vita, A. CO and CO2 methanation over Ni catalysts supported on CeO2, Al2O3 and Y2O3 oxides. Appl. Catal. B Environ. 2020, 264, 118494. [Google Scholar]
- Hall, D.S.; Lockwood, D.J.; Bock, C.; MacDougall, B.R. Nickel hydroxides and related materials: A review of their structures, synthesis and properties. Proc. R. Soc. A 2015, 471, 20140792. [Google Scholar] [CrossRef]
- Martínez-Sánchez, C.; Regmi, C.; Lee, S.W.; Rodríguez-González, V. Effects of Ce Doping on the Photocatalytic and Electrochemical Performance of Nickel Hydroxide Nanostructures. Top. Catal. 2021, 64, 73–83. [Google Scholar] [CrossRef]
- Jiménez-González, C.; Boukha, Z.; de Rivas, B.; Delgado, J.J.; Cauqui, M.Á.; González-Velasco, J.R.; Gutiérrez-Ortiz, J.I.; López-Fonseca, R. Structural characterization of Ni/alumina reforming catalysts activated at high temperatures. Appl. Catal. A Gen. 2013, 466, 9–20. [Google Scholar] [CrossRef]
- Ezhilarasi, A.A.; Vijaya, J.J.; Kaviyarasu, K.; Kennedy, L.J.; Jothiramalingam, R.; Al-Lohedan, H.A. Green synthesis of NiO nanoparticles using Aegle marmelos leaf extract for the evaluation of in-vitro cytotoxicity, antibacterial and photocatalytic properties. J. Photochem. Photobiol. B Biol. 2018, 180, 39–50. [Google Scholar] [CrossRef] [PubMed]
- Kumar, M.S.S.; Soundarya, T.L.; Udayabhanu, N.G.; Raghu, G.K.; Rekha, N.D.; Alharthi, F.A.; Nirmala, B. Multifunctional applications of Nickel oxide (NiO) nanoparticles synthesized by facile green combustion method using Limonia acidissima natural fruit juice. Inorg. Chim. Acta 2021, 515, 120059. [Google Scholar] [CrossRef]
- Mewafy, B.; Paloukis, F.; Papazisi, K.; Balomenou, S.P.; Luo, W.; Teschner, D.; Joubert, O.; Le Gal La Salle, A.; Niakolas, D.K.; Zafeiratos, S. Influence of surface state on the electrochemical performance of nickel-based cermet electrodes during steam electrolysis. ACS Appl. Energy Mater. 2019, 2, 7045–7055. [Google Scholar] [CrossRef]
- Bagus, P.S.; Nelin, C.J.; Brundle, C.R.; Crist, B.V.; Ilton, E.S.; Nabajit, L.; Rosso, K.M. The Main and Satellite Features in the Ni2p XPS of NiO. Inorg. Chem. 2022, 61, 18077–18094. [Google Scholar]
- Parola, V.L.; Liotta, L.F.; Pantaleo, G.; Testa, M.L.; Venezia, A.M. CO2 reforming of CH4 over Ni supported on SiO2 modified by TiO2 and ZrO2: Effect of the support synthesis procedure. Appl. Catal. A Gen. 2022, 642, 118704. [Google Scholar]
- Lynch, B.; Wiame, F.; Maurice, V.; Marcus, P. XPS study of oxide nucleation and growth mechanisms on a model FeCrNiMo stainless steel surface. Appl. Surf. Sci. 2022, 575, 151681. [Google Scholar] [CrossRef]
- Saini, S.; Shah, J.; Kotnala, R.K.; Yadav, K.L. Nickel substituted oxygen deficient nanoporous lithium ferrite based green energy device hydroelectric cell. J. Alloys Compd. 2020, 827, 154334. [Google Scholar] [CrossRef]
- Choi, M.; Ibrahim, I.A.M.; Kim, K.; Koo, J.Y.; Kim, S.J.; Son, J.-W.; Han, J.W.; Lee, W. Engineering of Charged Defects at Perovskite Oxide Surfaces for Exceptionally Stable Solid Oxide Fuel Cell Electrodes. ACS Appl. Mater. Interfaces 2020, 12, 21494–21504. [Google Scholar] [CrossRef]
- Lökçü, E.; Toparli, Ç.; Anik, M. Electrochemical Performance of (MgCoNiZn)1−xLixO High-Entropy Oxides in Lithium-Ion Batteries. ACS Appl. Mater. Interfaces 2020, 12, 23860–23866. [Google Scholar] [CrossRef] [PubMed]
- Porodko, O.; Fabián, M.; Kolev, H.; Lisnichuk, M.; Zukalová, M.; Vinarčíková, M.; Girman, V.; Da Silva, K.L.; Šepelák, V. A novel high entropy spinel-type aluminate MAl2O4 (M = Zn, Mg, Cu, Co) and its lithiated oxyfluoride and oxychloride derivatives prepared by one-step mechanosynthesis. Z. Phys. Chem. 2022, 236, 713–726. [Google Scholar] [CrossRef]
- Moulder, F.; Sticke, W.F.; Sobol, P.E.; Bombel, K.D. Handbook of X-ray Photoelectron Spectroscopy. A Reference Book of Standard Spectra for Identification and Interpretation of XPS Data; Castain, J., King, R.C., Eds.; Physical Electronics Inc.: Chanhassen, MN, USA, 1992. [Google Scholar]
- Guo, Y.; Ran, R.; Shao, Z. A novel way to improve performance of proton-conducting solid-oxide fuel cells through enhanced chemical interaction of anode components. Int. J. Hydrogen Energy 2011, 36, 1683–1691. [Google Scholar] [CrossRef]
- Wang, S.; Zhang, J.; Gharbi, O.; Vivier, V.; Gao, M.; Orazem, M.E. Electrochemical impedance spectroscopy. Nat. Rev. Methods Primers 2021, 1, 41. [Google Scholar] [CrossRef]
- Vladikova, D.; Burdin, B.; Sheikh, A.; Piccardo, P.; Krapchanska, M.; Montinaro, D.; Spotorno, R. Accelerated Stress Tests for Solid Oxide Cells via Artificial Aging of the Fuel Electrode. Energies 2022, 15, 3287. [Google Scholar] [CrossRef]


| Sample | Unit Cell Parameter | Crystal Size L (nm) | ICDD PDF File | |||
|---|---|---|---|---|---|---|
| a (Å) | b (Å) | c (Å) | Vcell (Å3) | |||
| Anode matrix | ||||||
| BCY15 | 8.7735 (6) | 6.2164 (7) | 6.2152 (4) | 338.2 (3) | 247.3 | |
| Ni/BCY15-W-1100 | 8.7705 (7) | 6.2351 (6) | 6.2187 (6) | 340.2 (4) | 389.1 | |
| Ni/BCY15-EG-1100 | 8.7728 (4) | 6.2343 (3) | 6.2183 (3) | 340.1 (7) | 507.0 | |
| BaCeO3 | 8.7790 | 6.2360 | 6.2140 | 340.19 | - | 00-022-0074 |
| BaCe0.9Y0.1O2.95 | 8.7705 | 6.2393 | 6.2233 | 340.55 | - | 01-081-1386 |
| NiO | ||||||
| Ni/BCY15-W-1100 | 4.1792(20) | - | - | 72.99(11) | 300.0 | |
| Ni/BCY15-EG-1100 | 4.1791(41) | - | - | 72.99(21) | 350.0 | |
| NiO | 4.1771 | - | - | 72.88 | - | 01-070-1429 |
| Phase | Sample | |
|---|---|---|
| Ni/BCY15-W-1100 | Ni/BCY15-EG-1100 | |
| NiO (wt. %) | 70.49 | 70.79 |
| BaCeO3 (wt. %) | 27.72 | 29.21 |
| Y0.1Ce0.9O1.95 (wt. %) | 1.79 | - |
| Sample/Spot | Element Concentration (wt %) | ||||
|---|---|---|---|---|---|
| Ni | Ba | Y | Ce | NiO | |
| Ni/BCY15-W-1100 | |||||
| spot 1 | 60.16 | 17.88 | 4.13 | 17.83 | 76.56 |
| spot 2 | 54.29 | 20.48 | 4.06 | 21.17 | 69.09 |
| spot 3 | 54.55 | 20.70 | 4.09 | 20.66 | 69.42 |
| average | 56.33 | 19.69 | 4.09 | 19.88 | 71.68 |
| Ni/BCY15-EG-1100 | |||||
| spot 1 | 50.79 | 22.04 | 4.42 | 22.75 | 64.64 |
| spot 2 | 48.28 | 23.07 | 4.73 | 23.92 | 61.44 |
| spot 3 | 51.78 | 22.0 | 4.34 | 21.88 | 65.89 |
| average | 50.28 | 22.37 | 4.49 | 22.85 | 63.99 |
| Sample\Element | Ni2p3/2 | Ce3d | O1s | Ba3d | Y3d | ||||
|---|---|---|---|---|---|---|---|---|---|
| Ni0 | Ni2+, NiO | Ce3+ | Ce4+ | MeOx | Oxygen Vacancies | Ba-O/Ba-CO3 | Y-O | Y-CO3 | |
| Ni/BCY15-W-1100 | |||||||||
| Total concentration (at. %) (MgKα_Ce3d) | 19.60 | 4.61 | 64.79 | 6.38 | 1.80 | ||||
| Detailed concentration (at. %) | − | 19.60 | 2.81 | 1.9 | 33.04 | 31.75 | 6.38 | 0.85 | 0.95 |
| BE, eV | − | 854.0 | 880.8 | 882.6 | 529.3 | 531.6 | 780.0 | 157.0 | 158.2 |
| Ni/BCY15-EG-1100 | |||||||||
| Total concentration (at. %) (MgKα_Ce3d) | 20.24 | 4.66 | 63.20 | 5.28 | 2.38 | ||||
| Detailed concentration (at. %) | 0.41 | 19.83 | 2.8 | 1.86 | 29.70 | 33.5 | 5.28 | 0.31 | 2.37 |
| BE (eV) | 852.3 | 853.8 | 880.9 | 883.5 | 529.2 | 531.5 | 779.8 | 156.5 | 158.0 |
| Ni/BCY15-W-1100 | Ni/BCY15-EG-1100 | ||
|---|---|---|---|
| Tmax (°C) | Part (%) | Tmax (°C) | Part (%) |
| 377 | 10.5 | 361 | 11.7 |
| 402 | 33.1 | 404 | 74.2 |
| 433 | 47.2 | 408 | 9.6 |
| 523 | 9.2 | 416 | 4.5 |
Disclaimer/Publisher’s Note: The statements, opinions and data contained in all publications are solely those of the individual author(s) and contributor(s) and not of MDPI and/or the editor(s). MDPI and/or the editor(s) disclaim responsibility for any injury to people or property resulting from any ideas, methods, instructions or products referred to in the content. |
© 2023 by the authors. Licensee MDPI, Basel, Switzerland. This article is an open access article distributed under the terms and conditions of the Creative Commons Attribution (CC BY) license (https://creativecommons.org/licenses/by/4.0/).
Share and Cite
Gabrovska, M.; Nikolova, D.; Kolev, H.; Karashanova, D.; Tzvetkov, P.; Burdin, B.; Mladenova, E.; Vladikova, D.; Tabakova, T. Environmentally Benign pSOFC for Emissions-Free Energy: Assessment of Nickel Network Resistance in Anodic Ni/BCY15 Nanocatalyst. Nanomaterials 2023, 13, 1781. https://doi.org/10.3390/nano13111781
Gabrovska M, Nikolova D, Kolev H, Karashanova D, Tzvetkov P, Burdin B, Mladenova E, Vladikova D, Tabakova T. Environmentally Benign pSOFC for Emissions-Free Energy: Assessment of Nickel Network Resistance in Anodic Ni/BCY15 Nanocatalyst. Nanomaterials. 2023; 13(11):1781. https://doi.org/10.3390/nano13111781
Chicago/Turabian StyleGabrovska, Margarita, Dimitrinka Nikolova, Hristo Kolev, Daniela Karashanova, Peter Tzvetkov, Blagoy Burdin, Emiliya Mladenova, Daria Vladikova, and Tatyana Tabakova. 2023. "Environmentally Benign pSOFC for Emissions-Free Energy: Assessment of Nickel Network Resistance in Anodic Ni/BCY15 Nanocatalyst" Nanomaterials 13, no. 11: 1781. https://doi.org/10.3390/nano13111781
APA StyleGabrovska, M., Nikolova, D., Kolev, H., Karashanova, D., Tzvetkov, P., Burdin, B., Mladenova, E., Vladikova, D., & Tabakova, T. (2023). Environmentally Benign pSOFC for Emissions-Free Energy: Assessment of Nickel Network Resistance in Anodic Ni/BCY15 Nanocatalyst. Nanomaterials, 13(11), 1781. https://doi.org/10.3390/nano13111781