
Optimization of Magnetic Cobalt Ferrite Nanoparticles for Magnetic Heating Applications in Biomedical Technology

 ,
,  ,
,
Abstract
1. Introduction
2. Materials and Methods
2.1. Synthesis of Cobalt Ferrite Nanoparticles
2.2. Characterization of Cobalt Ferrite Nanoparticles
2.2.1. Transmission Electron Microscopy (TEM)
2.2.2. Magnetometry
2.2.3. Mössbauer Spectroscopy
2.2.4. X-Ray Diffraction (XRD)
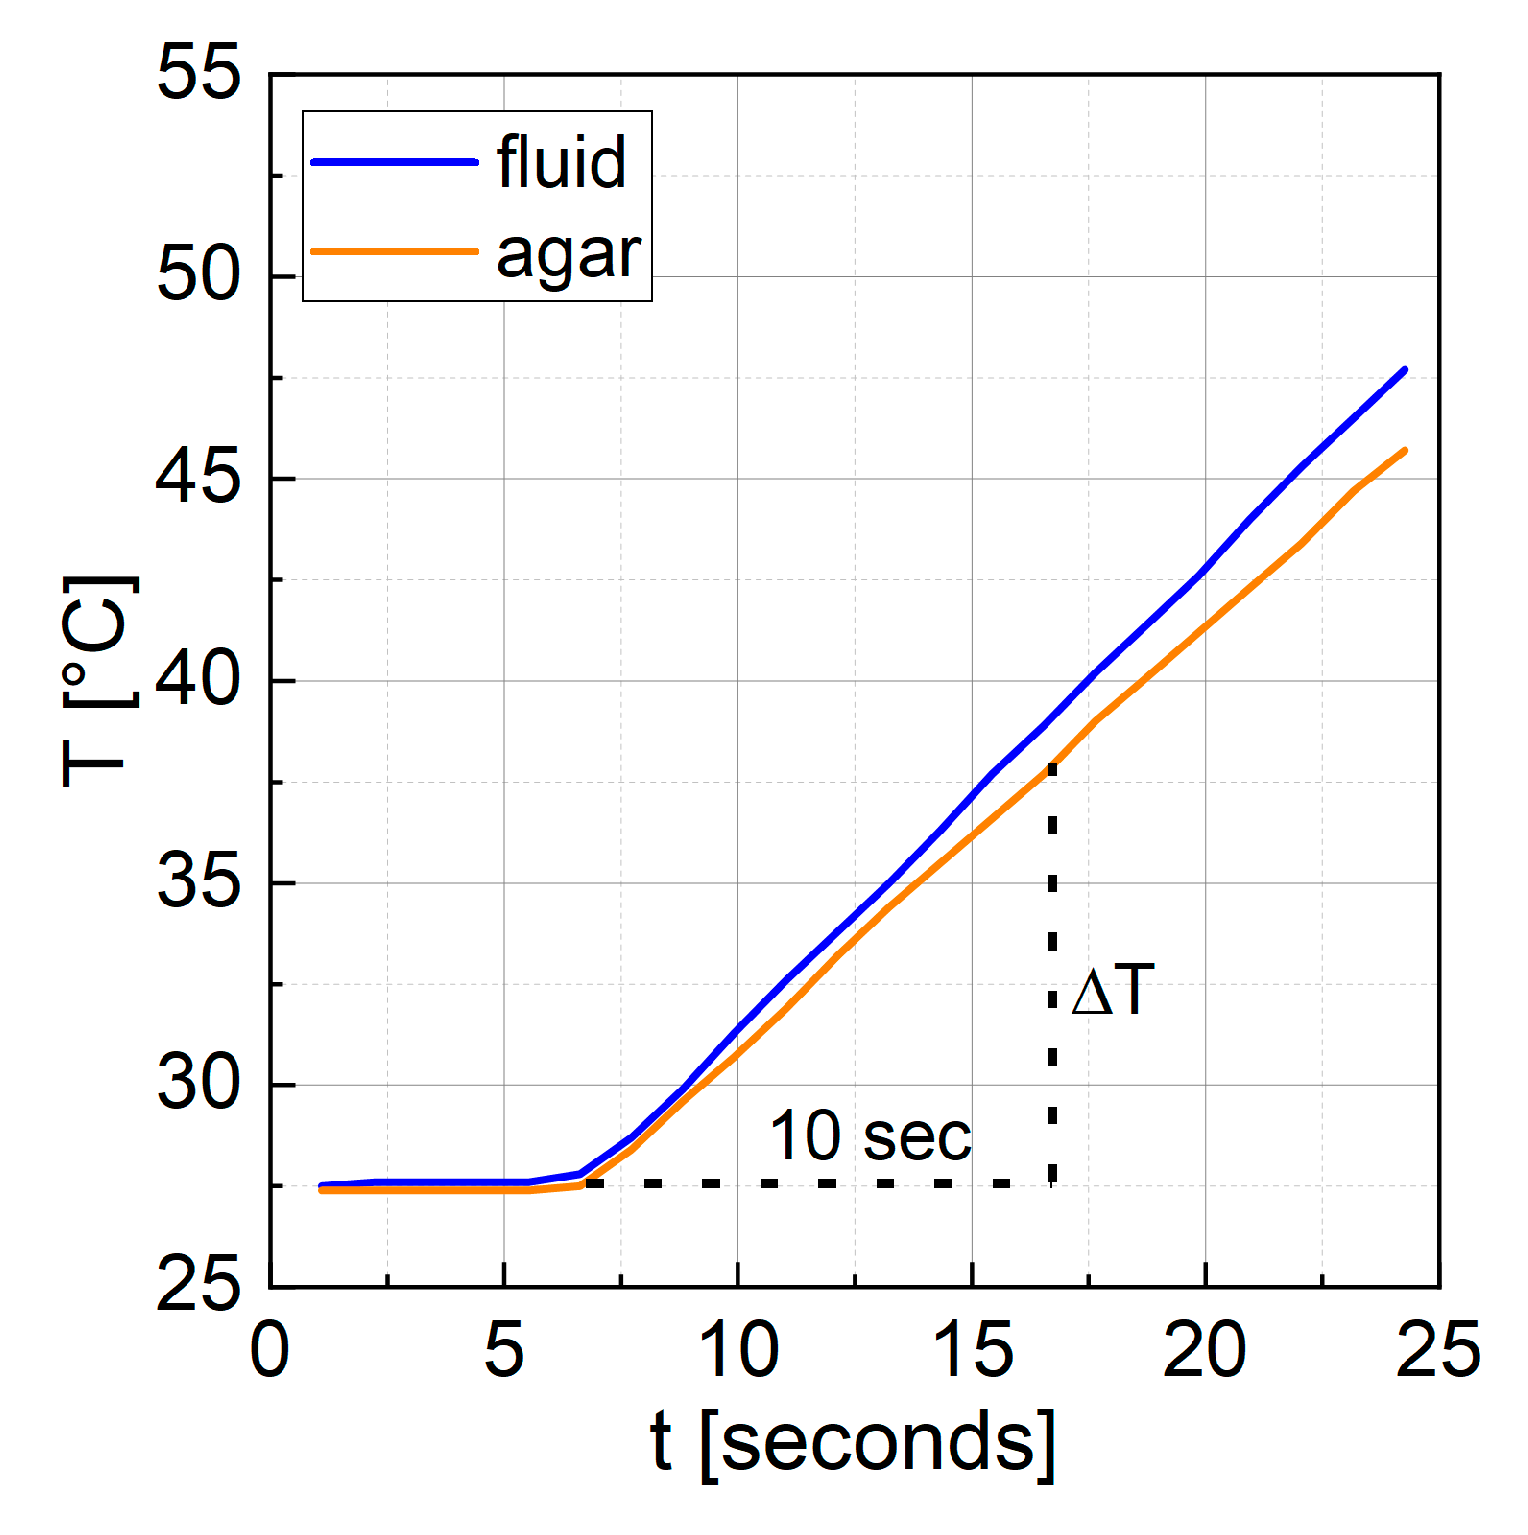
2.2.5. Calorimetric Measurements
3. Results and Discussion
3.1. Series 1—Variation of Synthesis Parameters
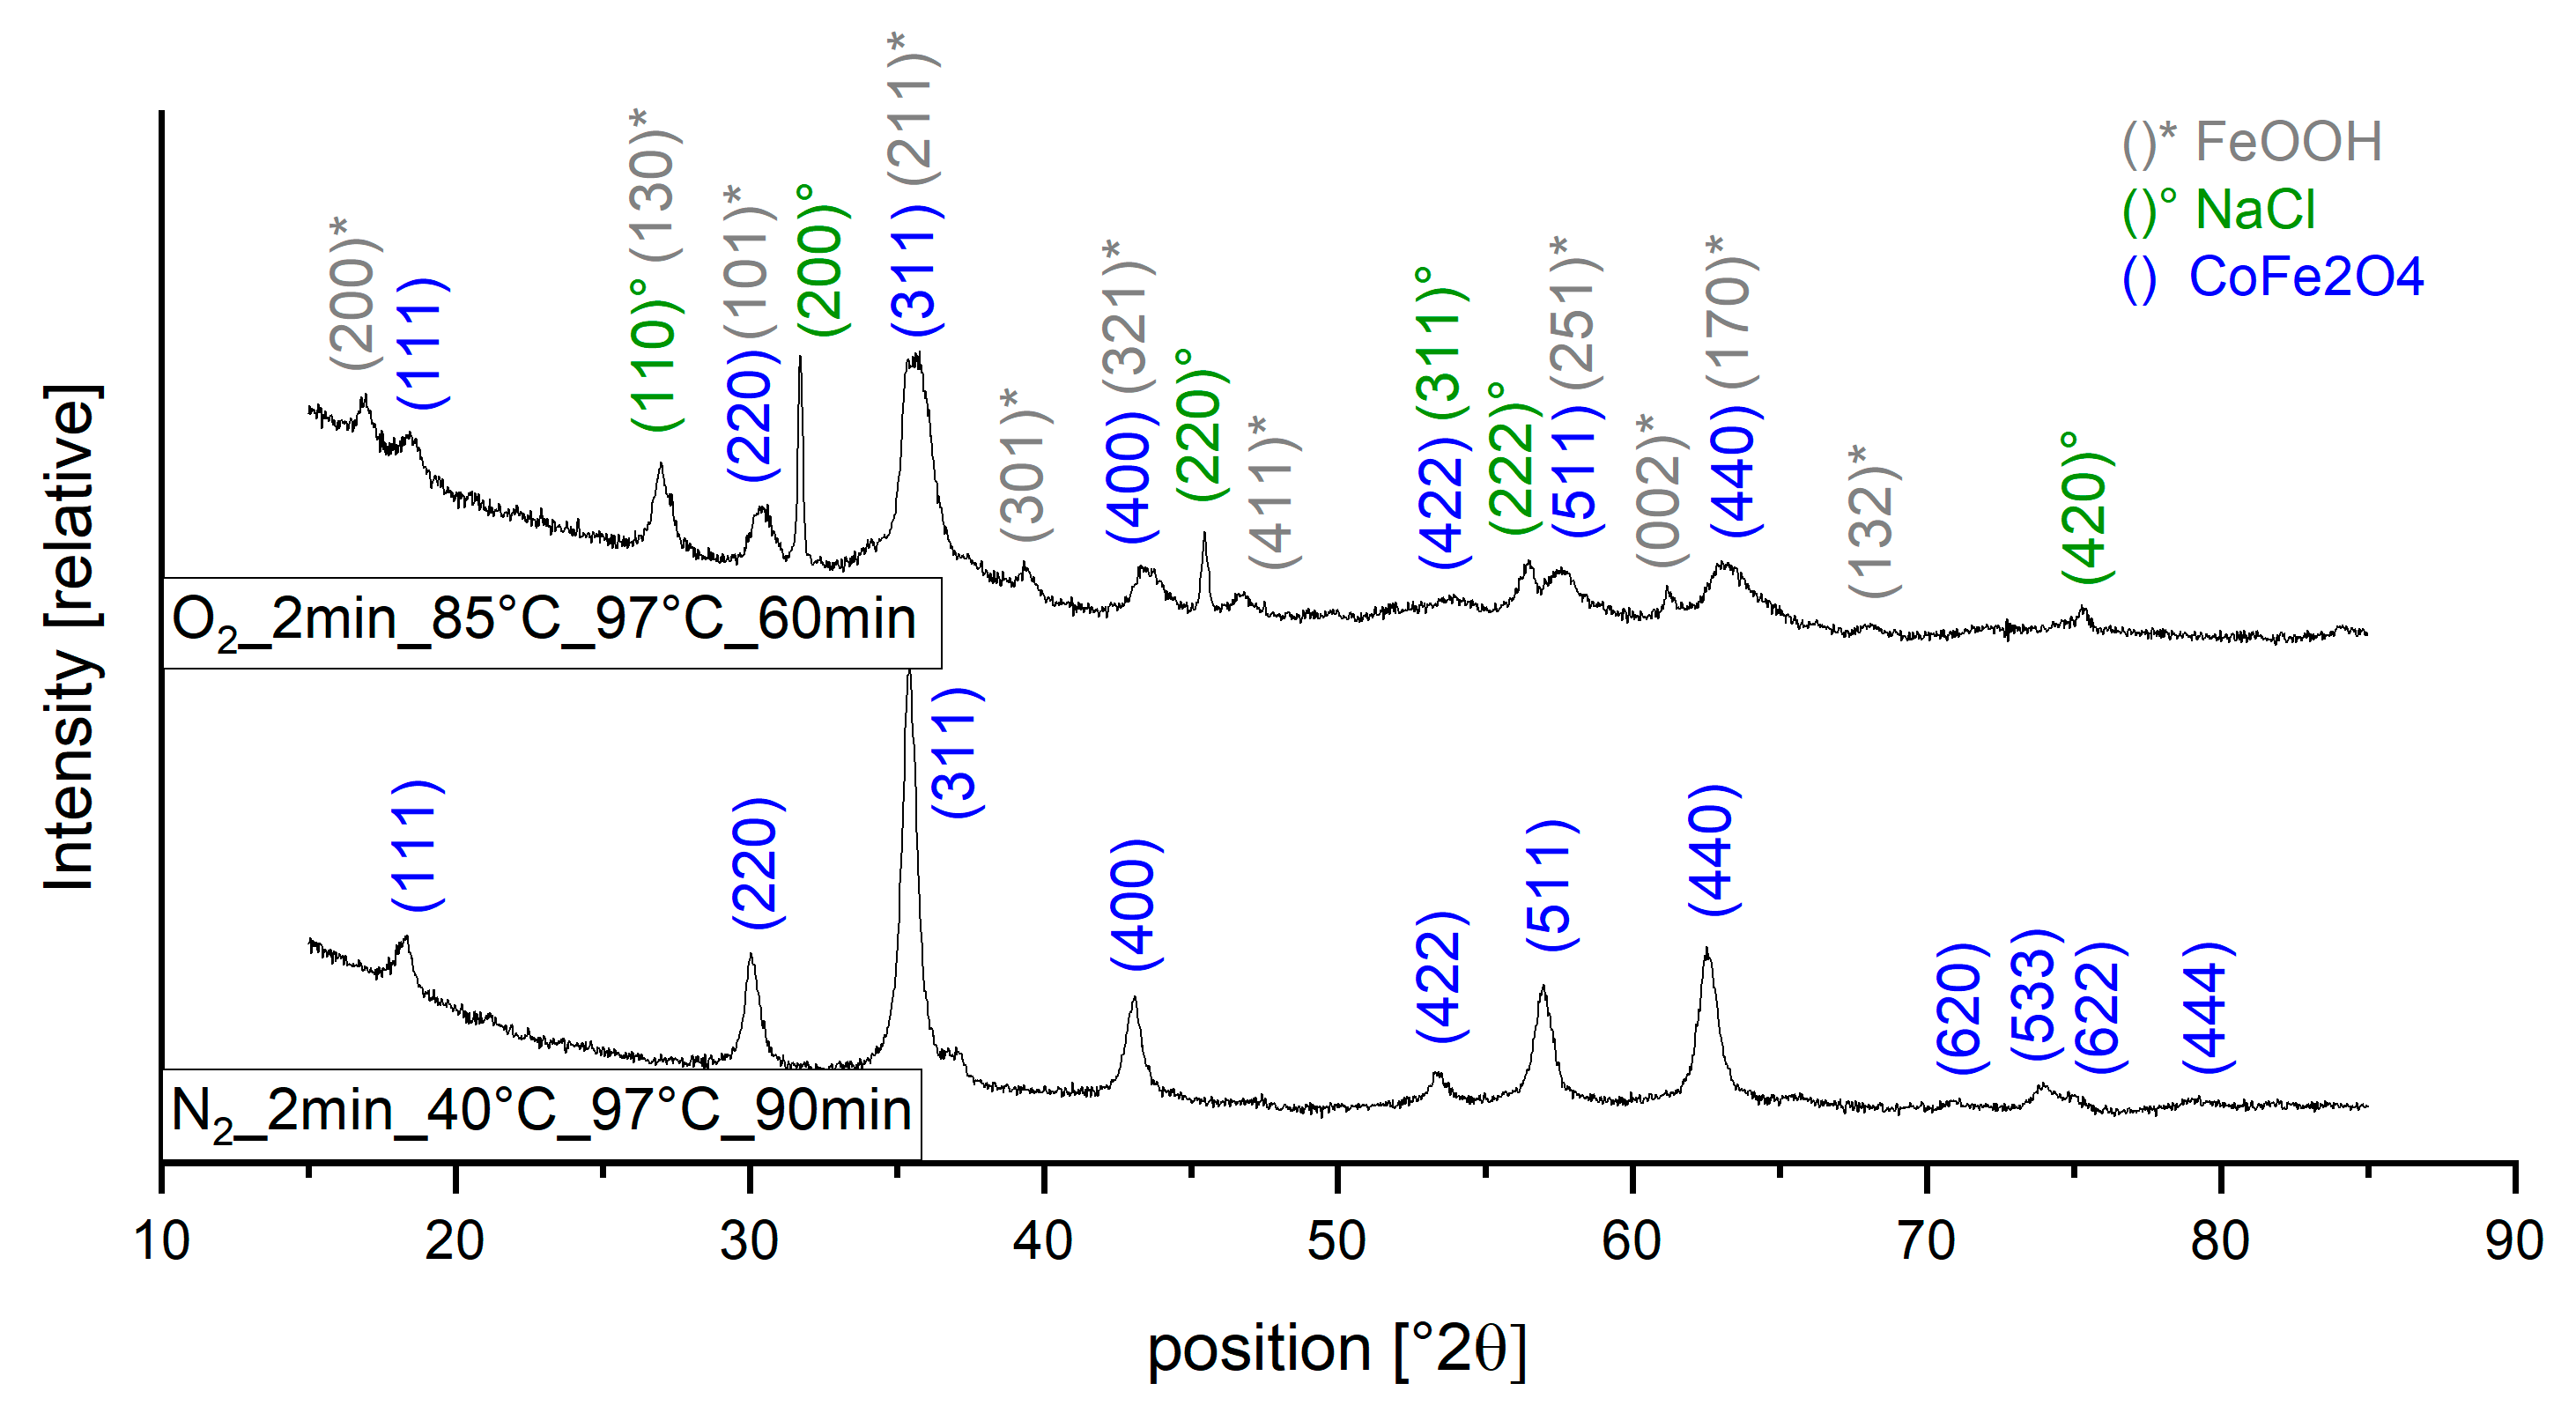
3.1.1. XRD
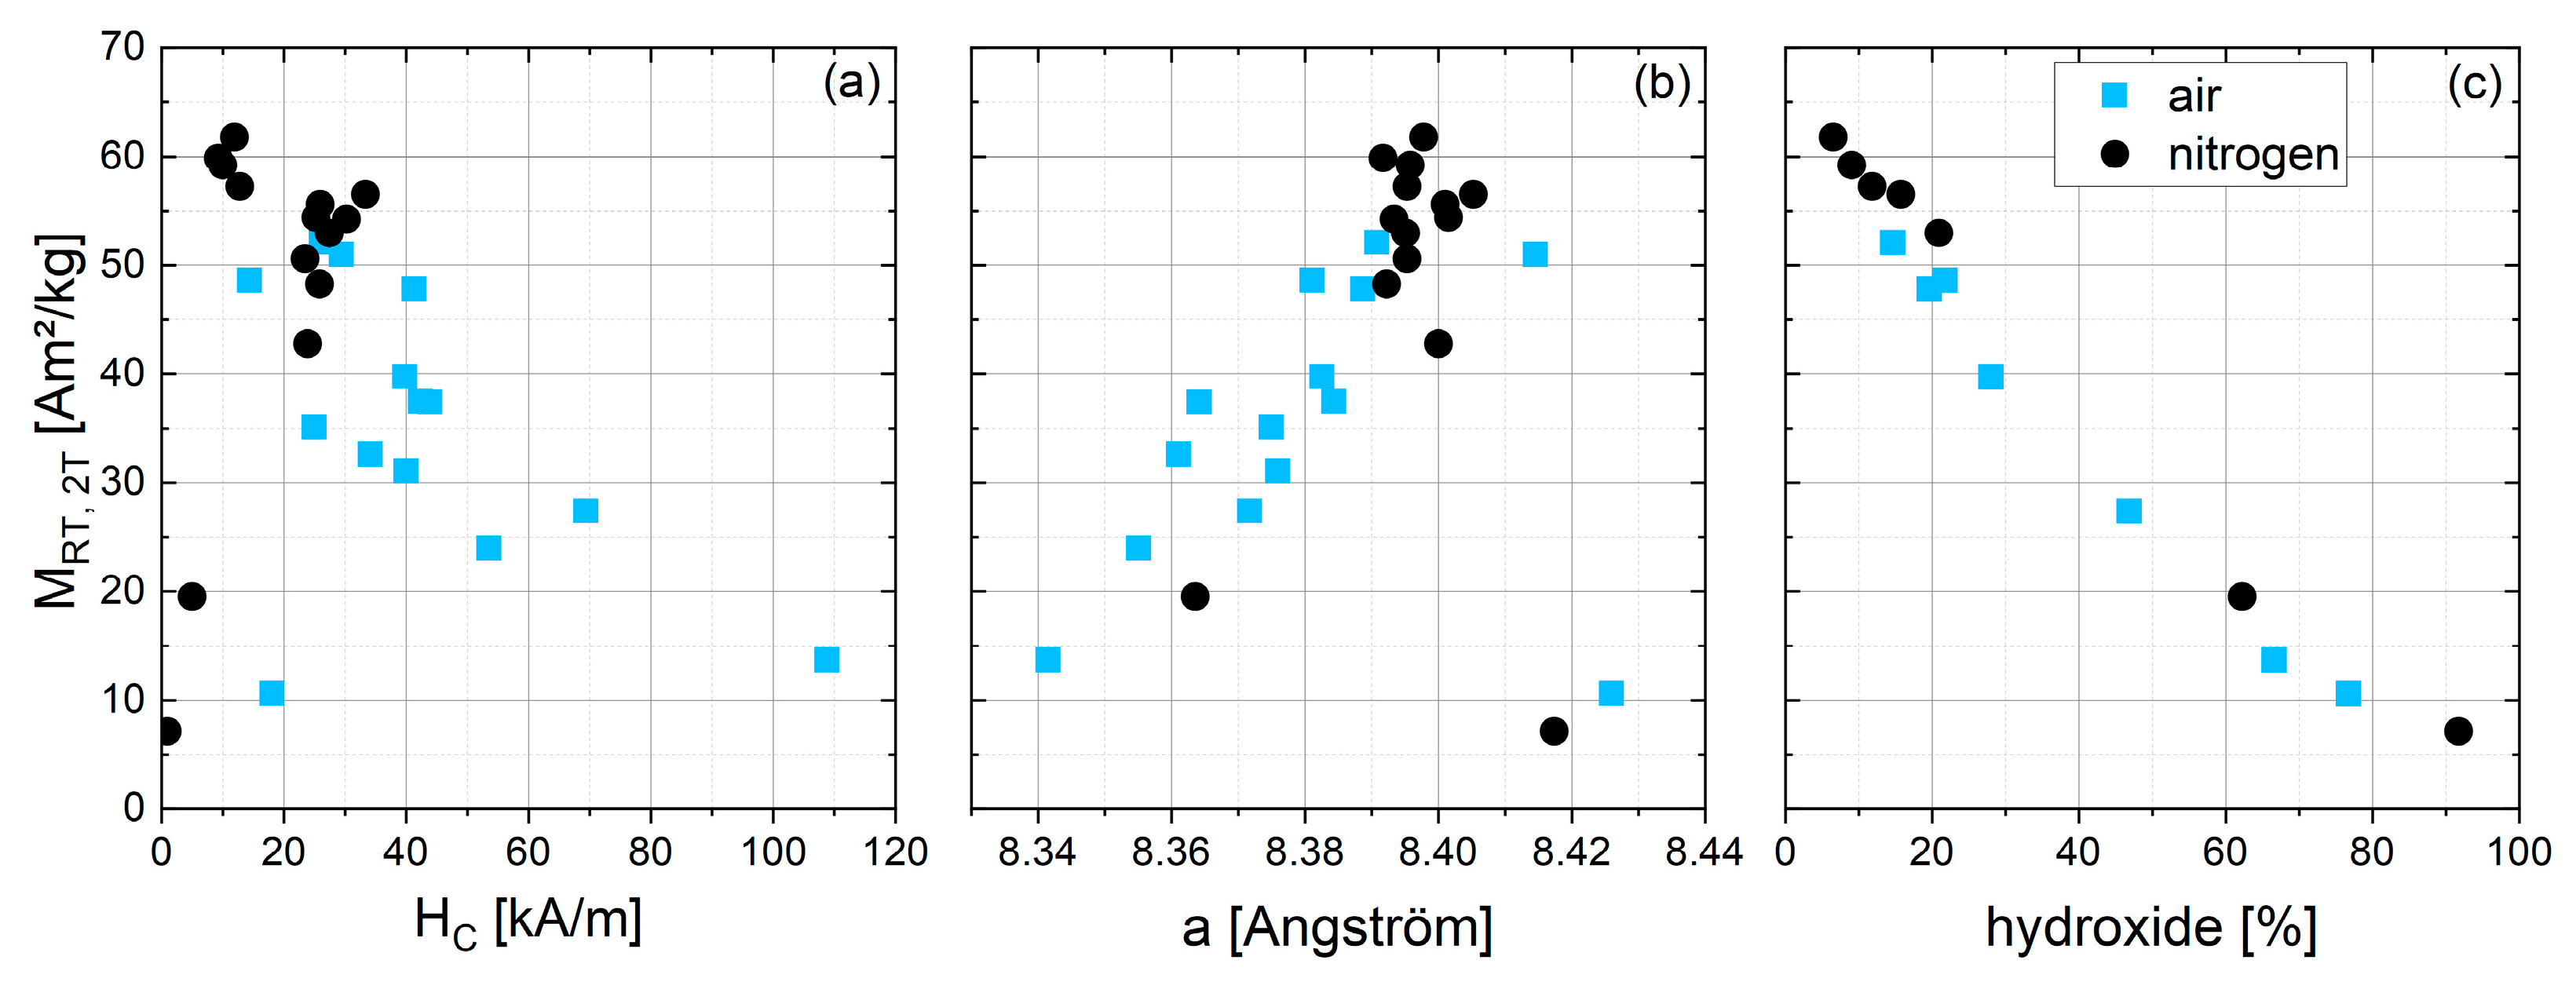
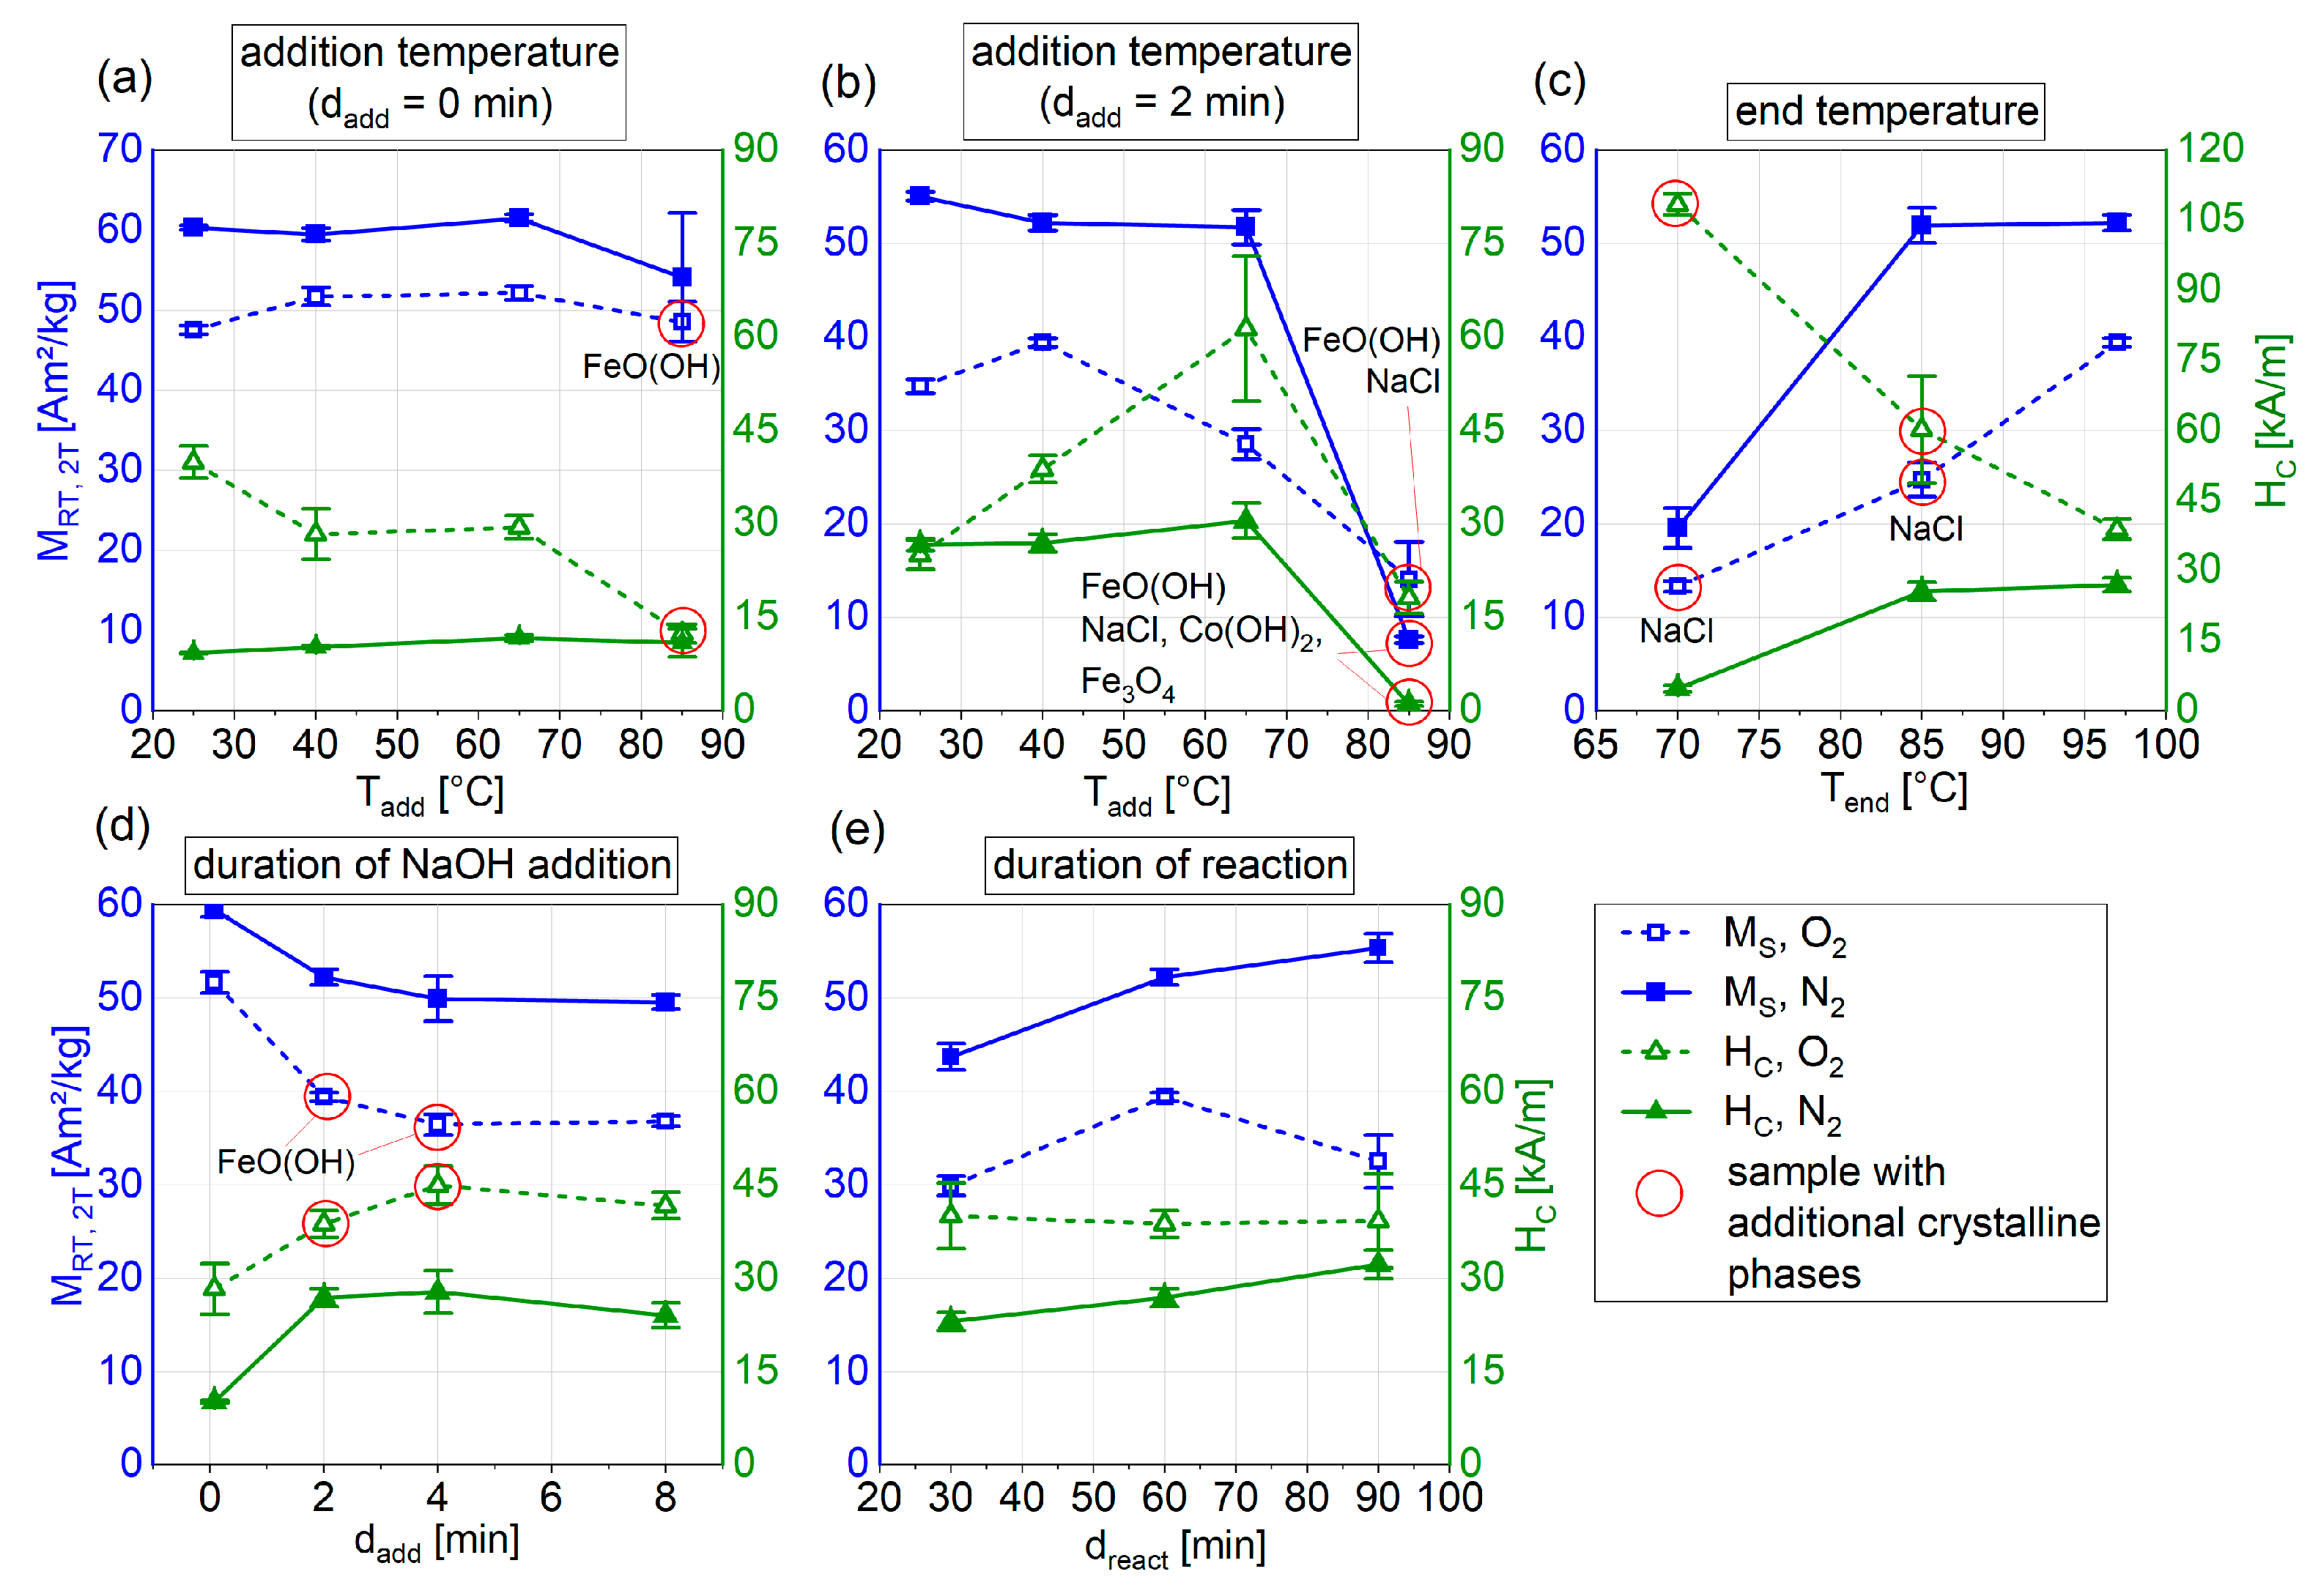
3.1.2. Magnetic Properties
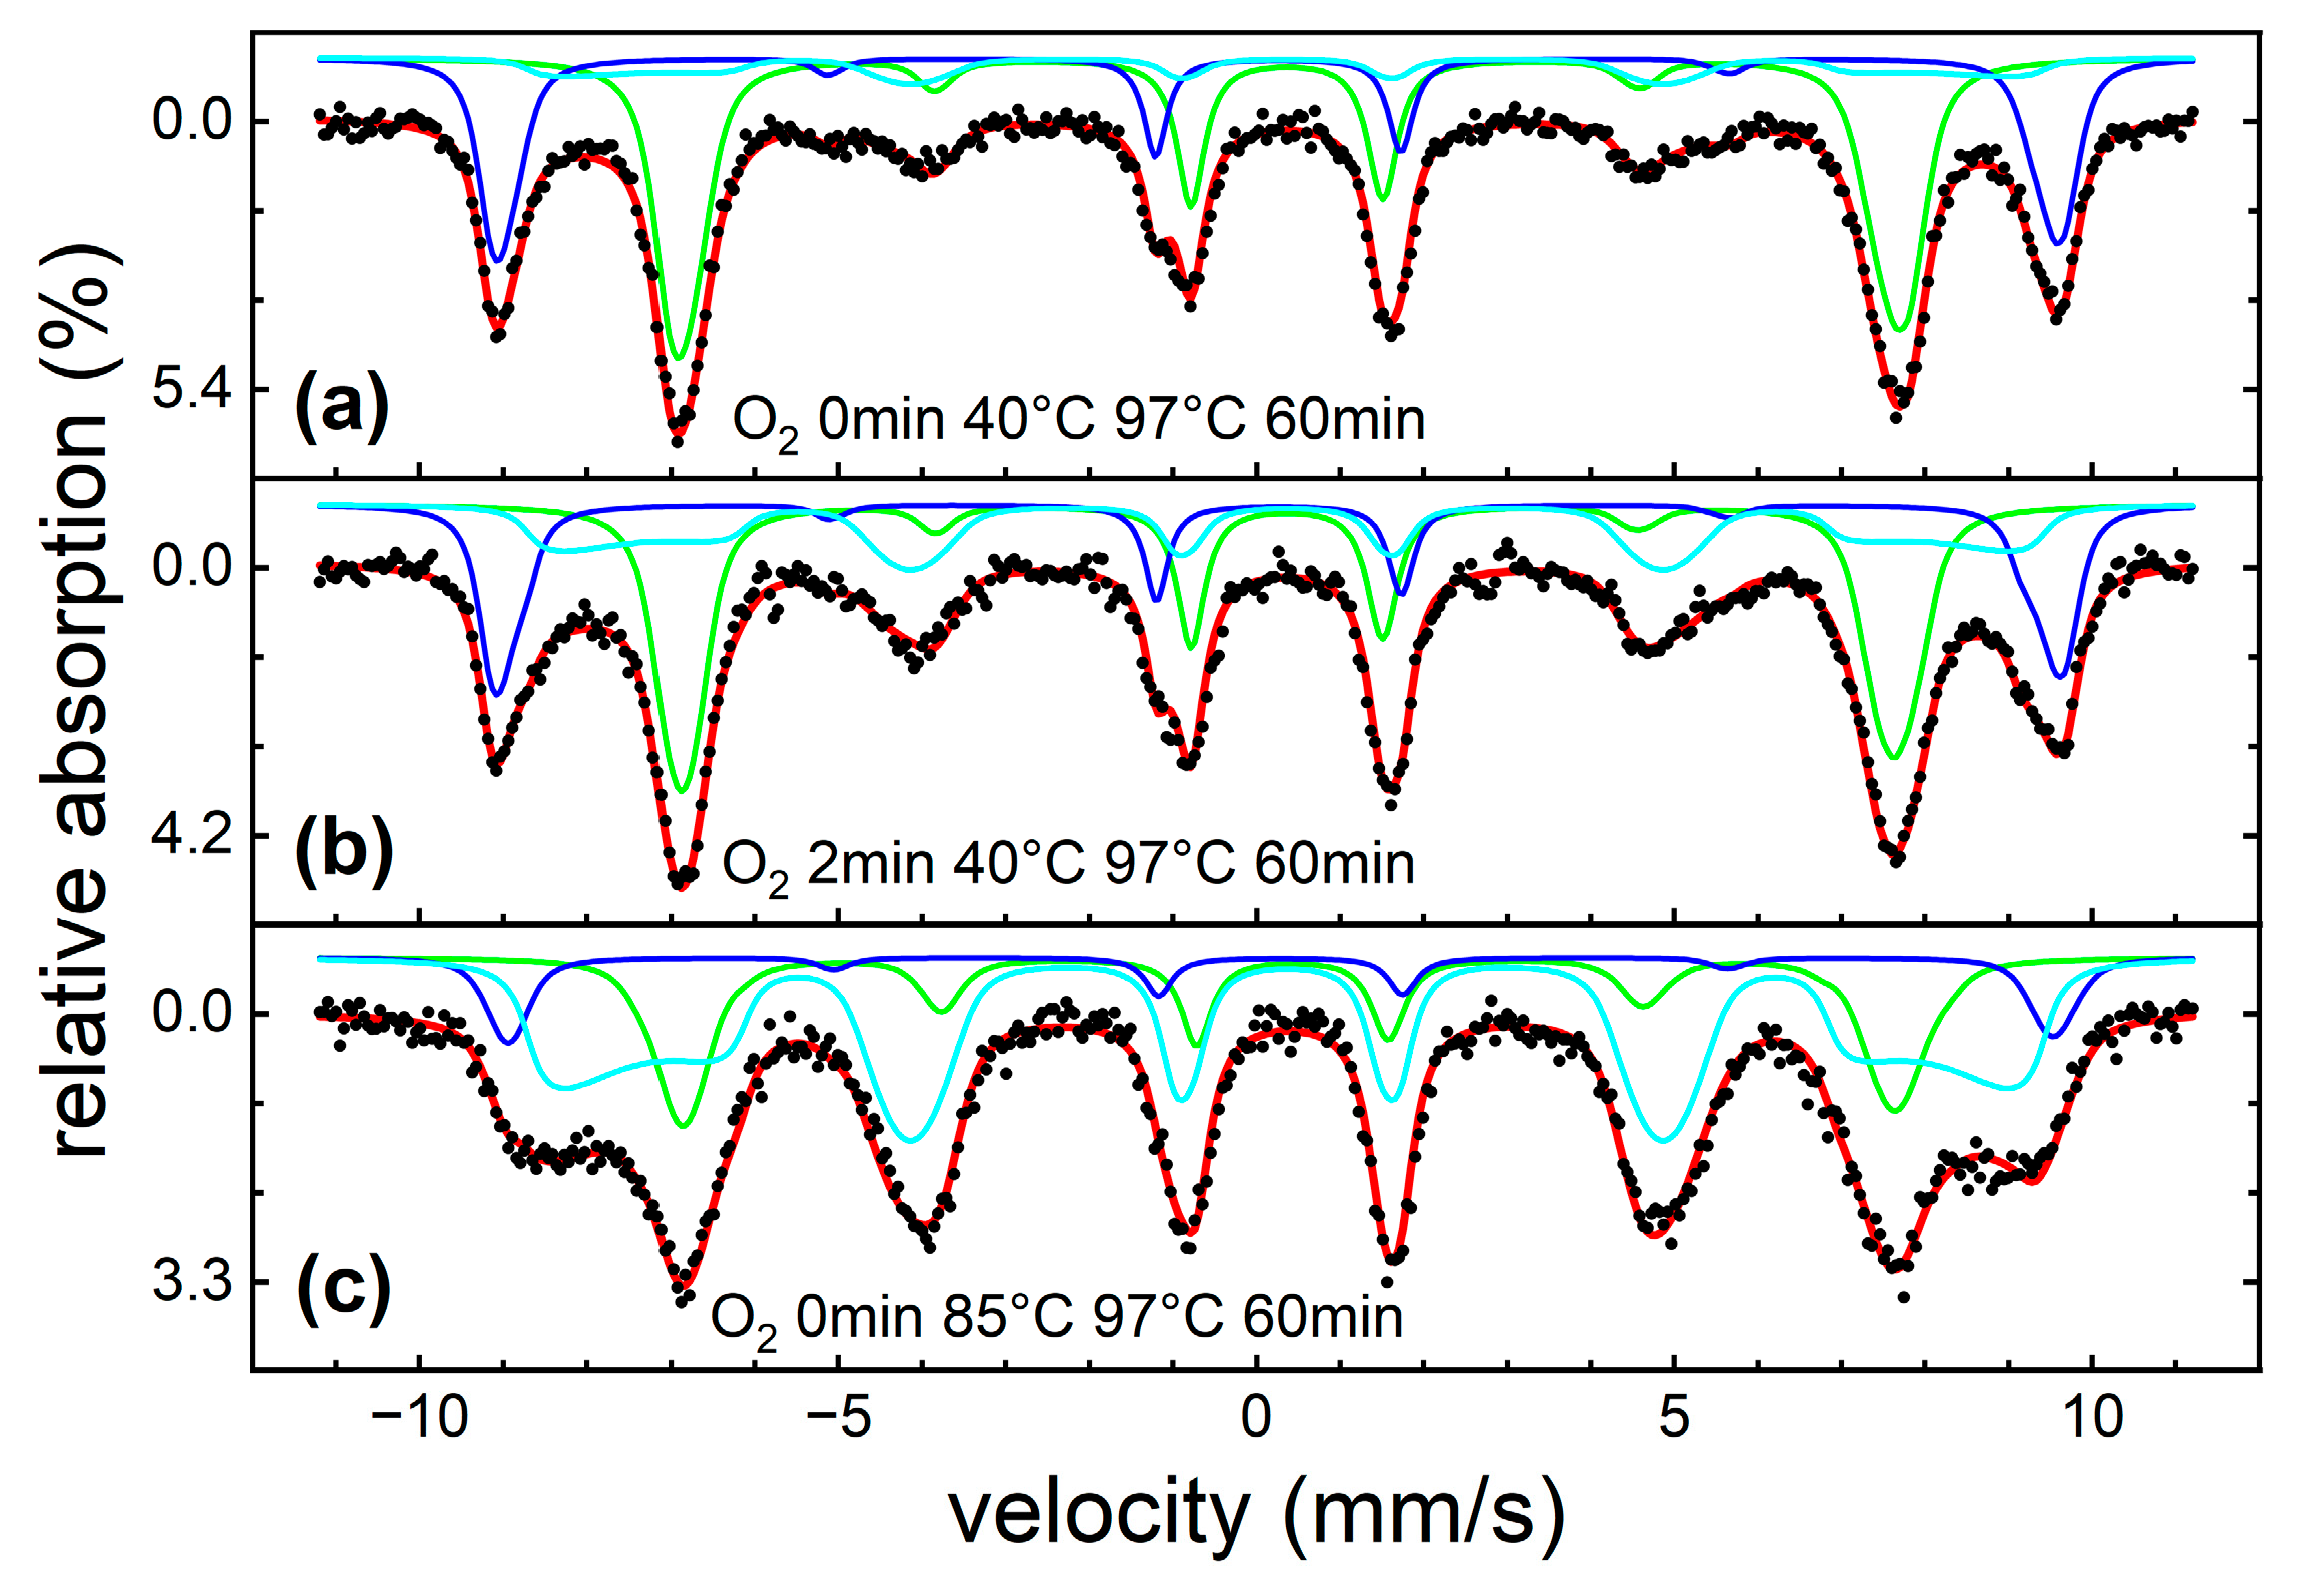
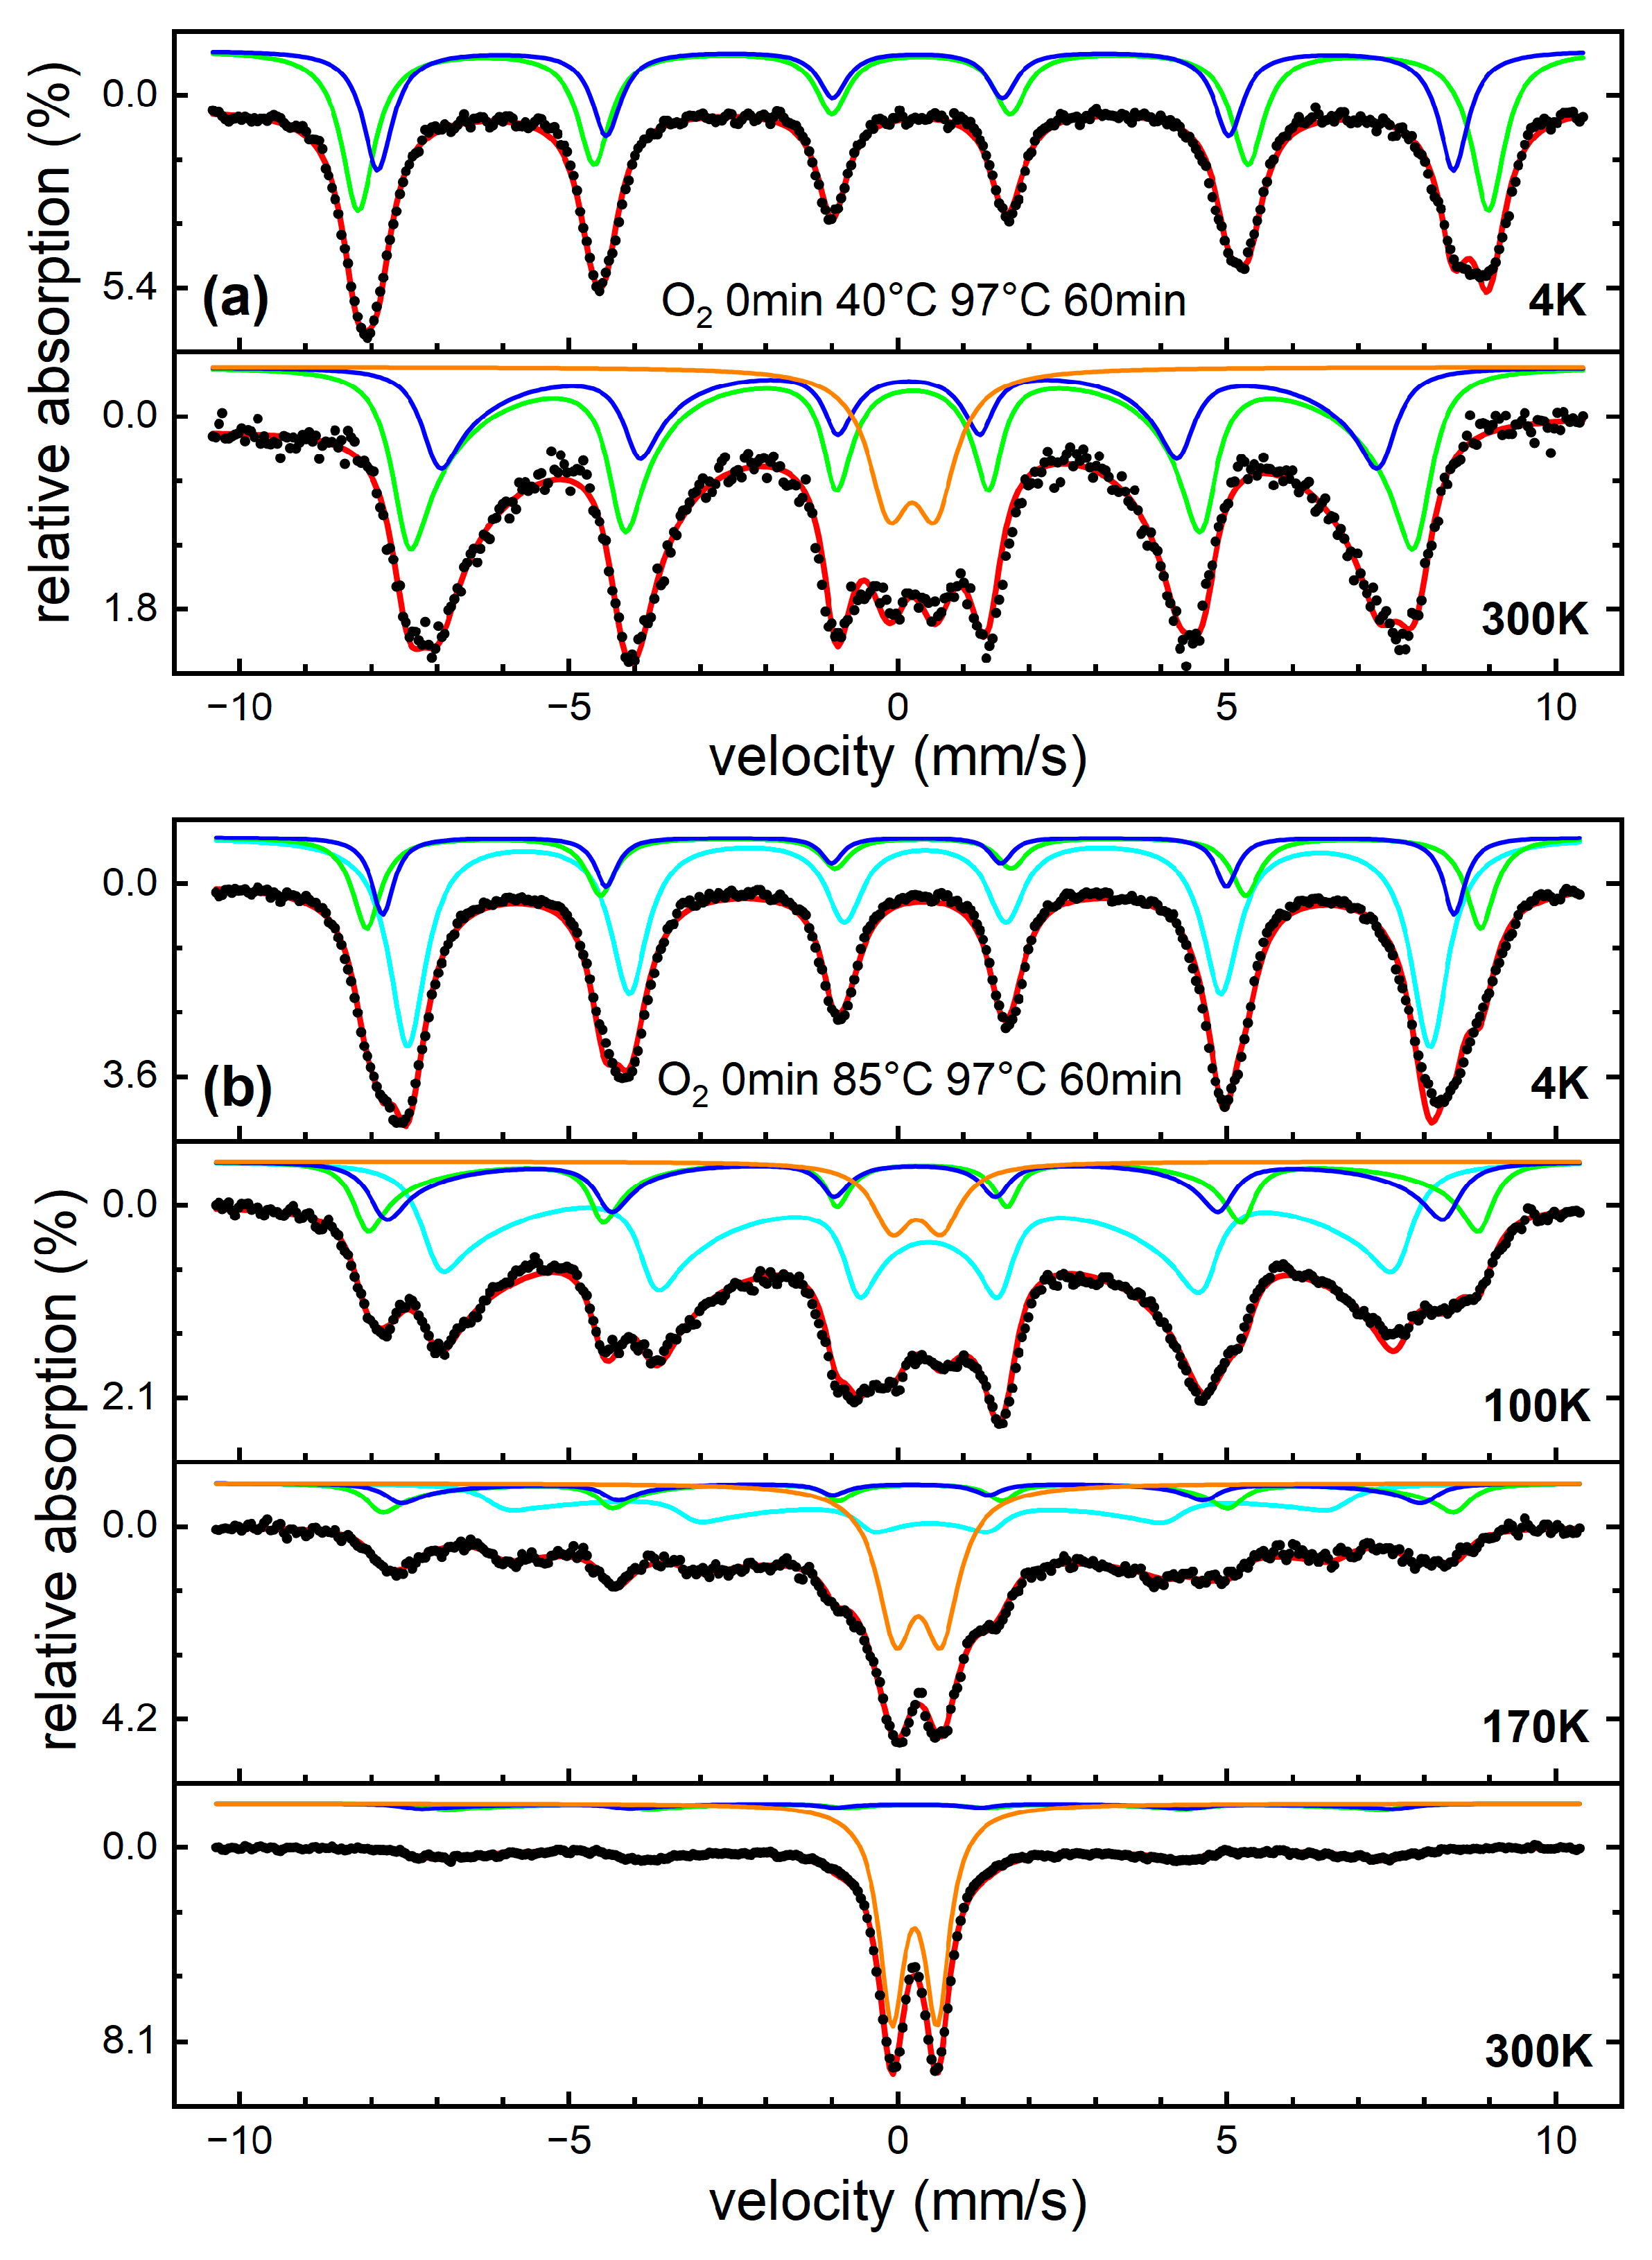
3.1.3. Mössbauer Spectroscopy
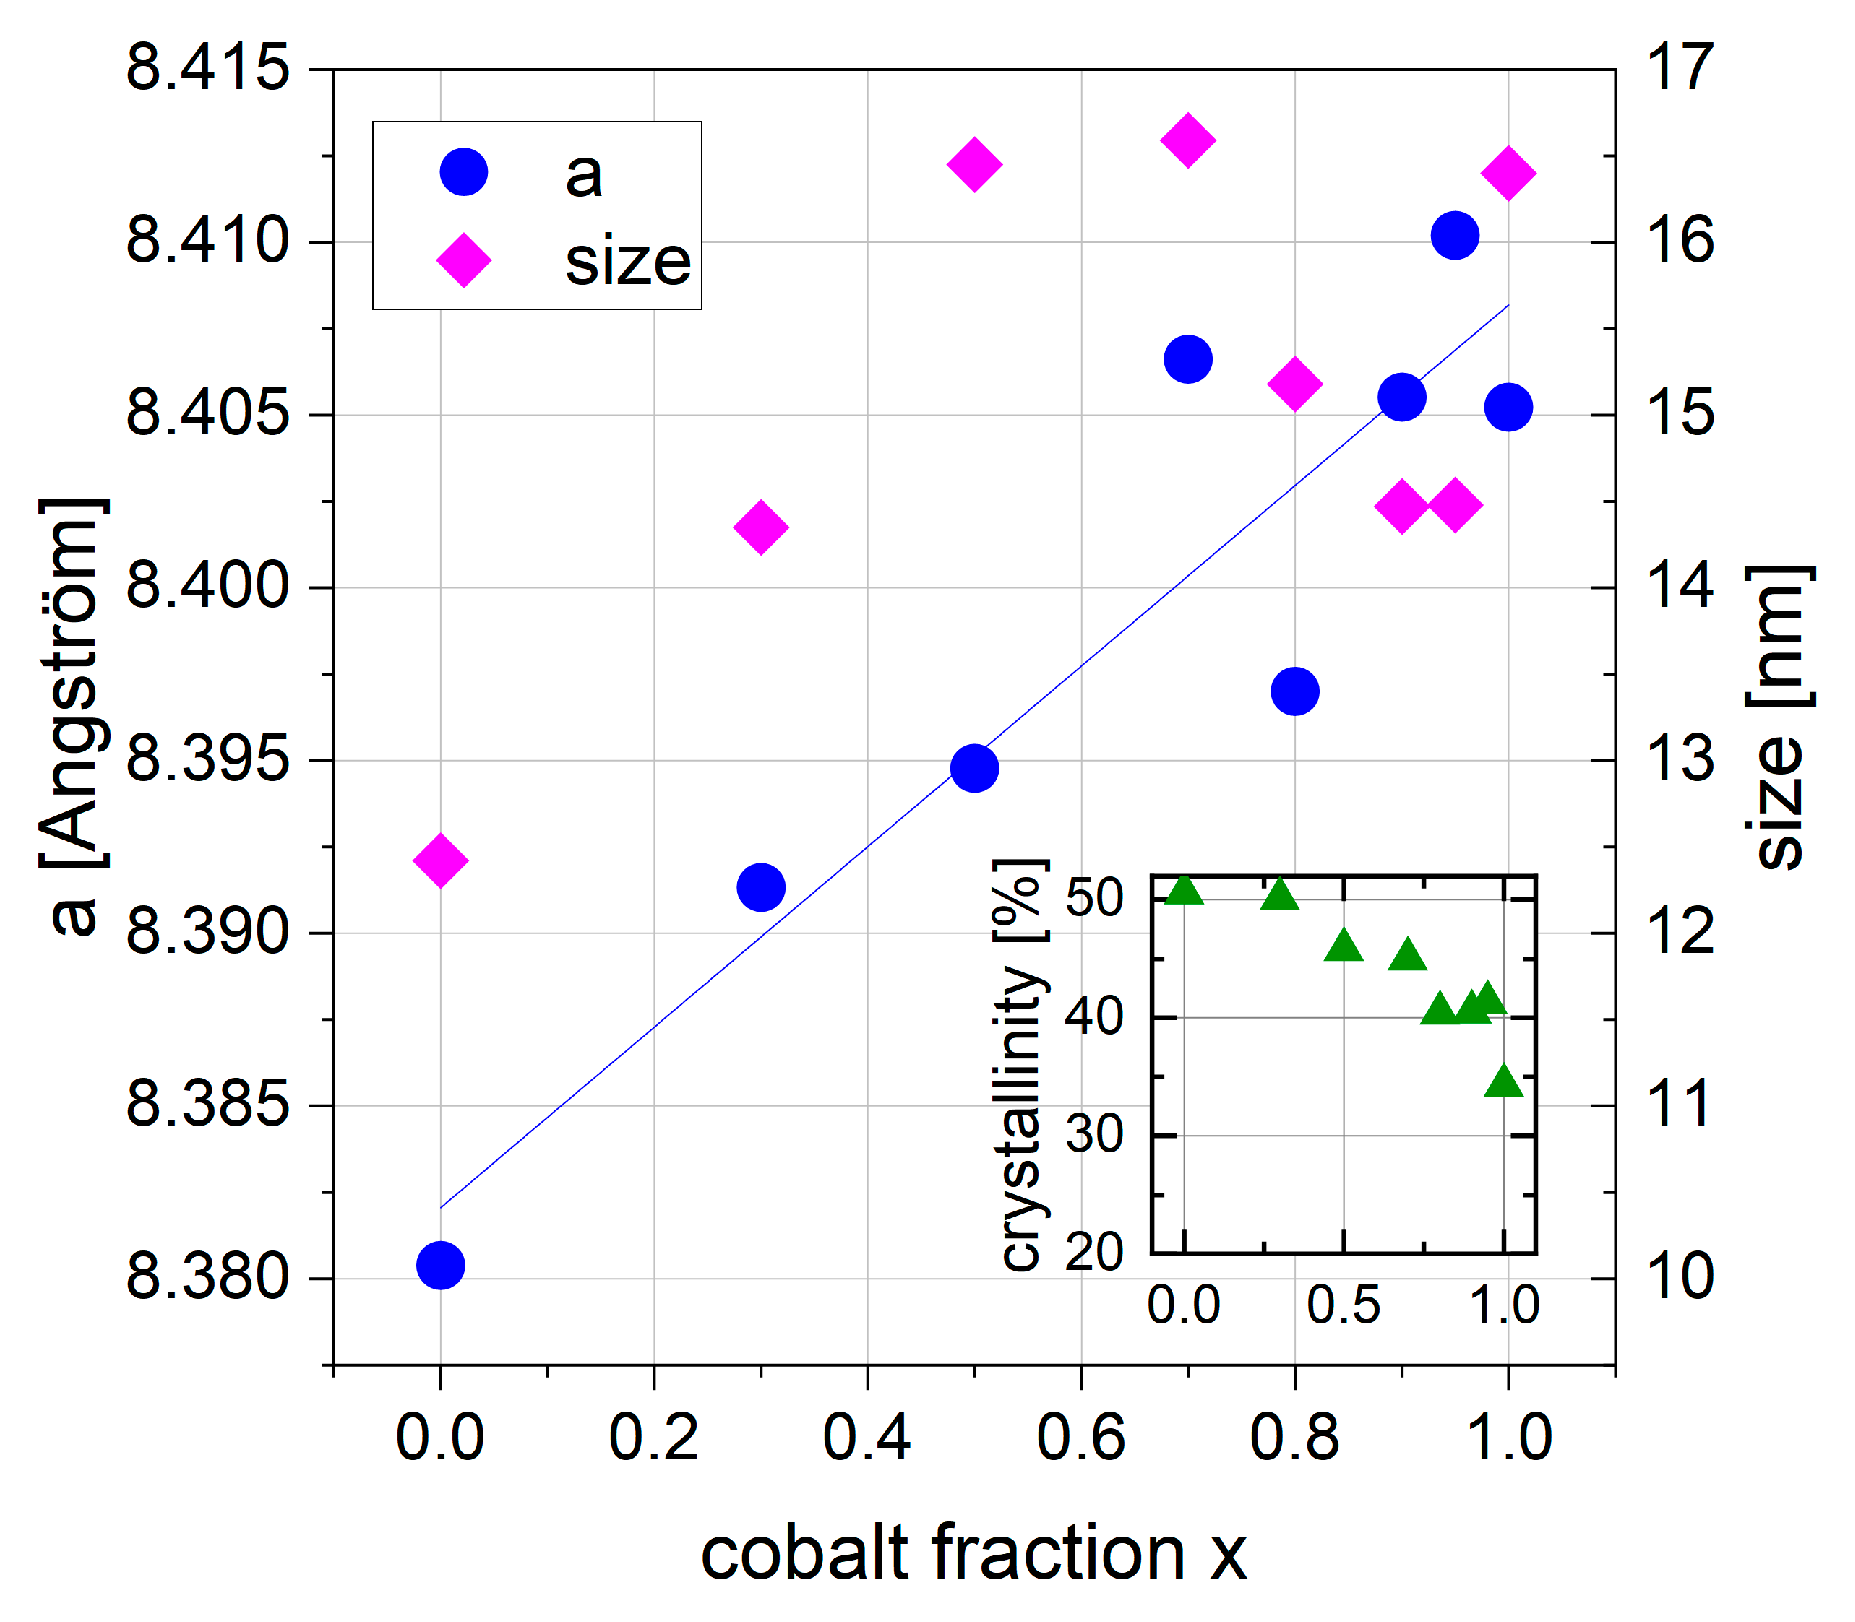
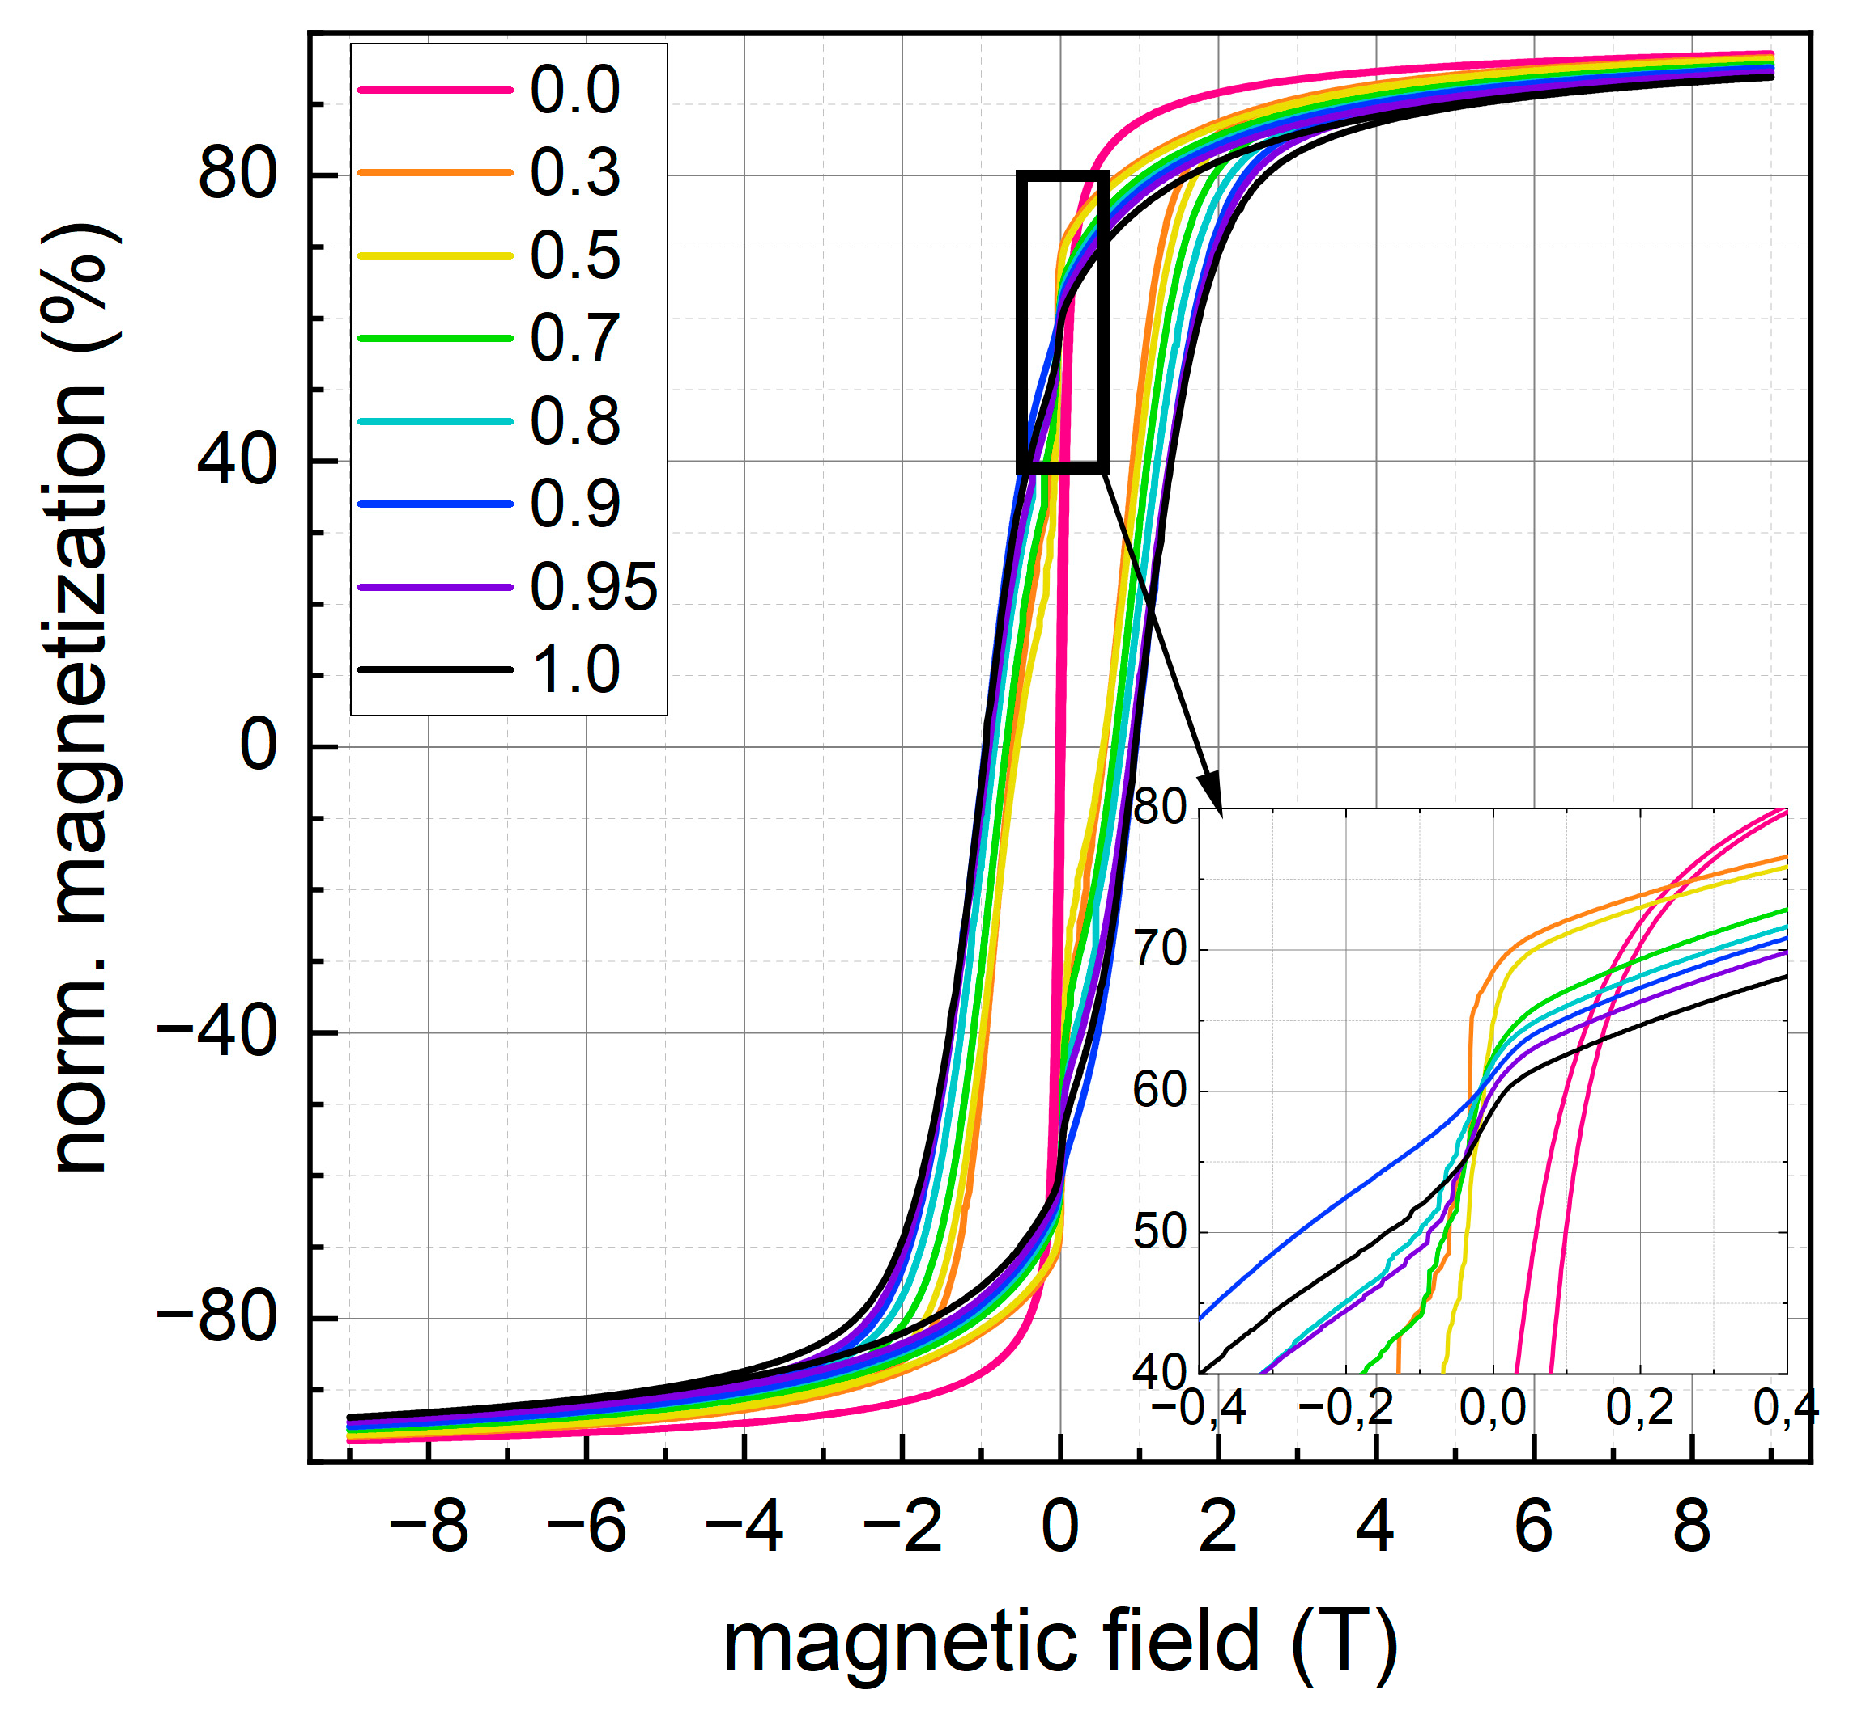
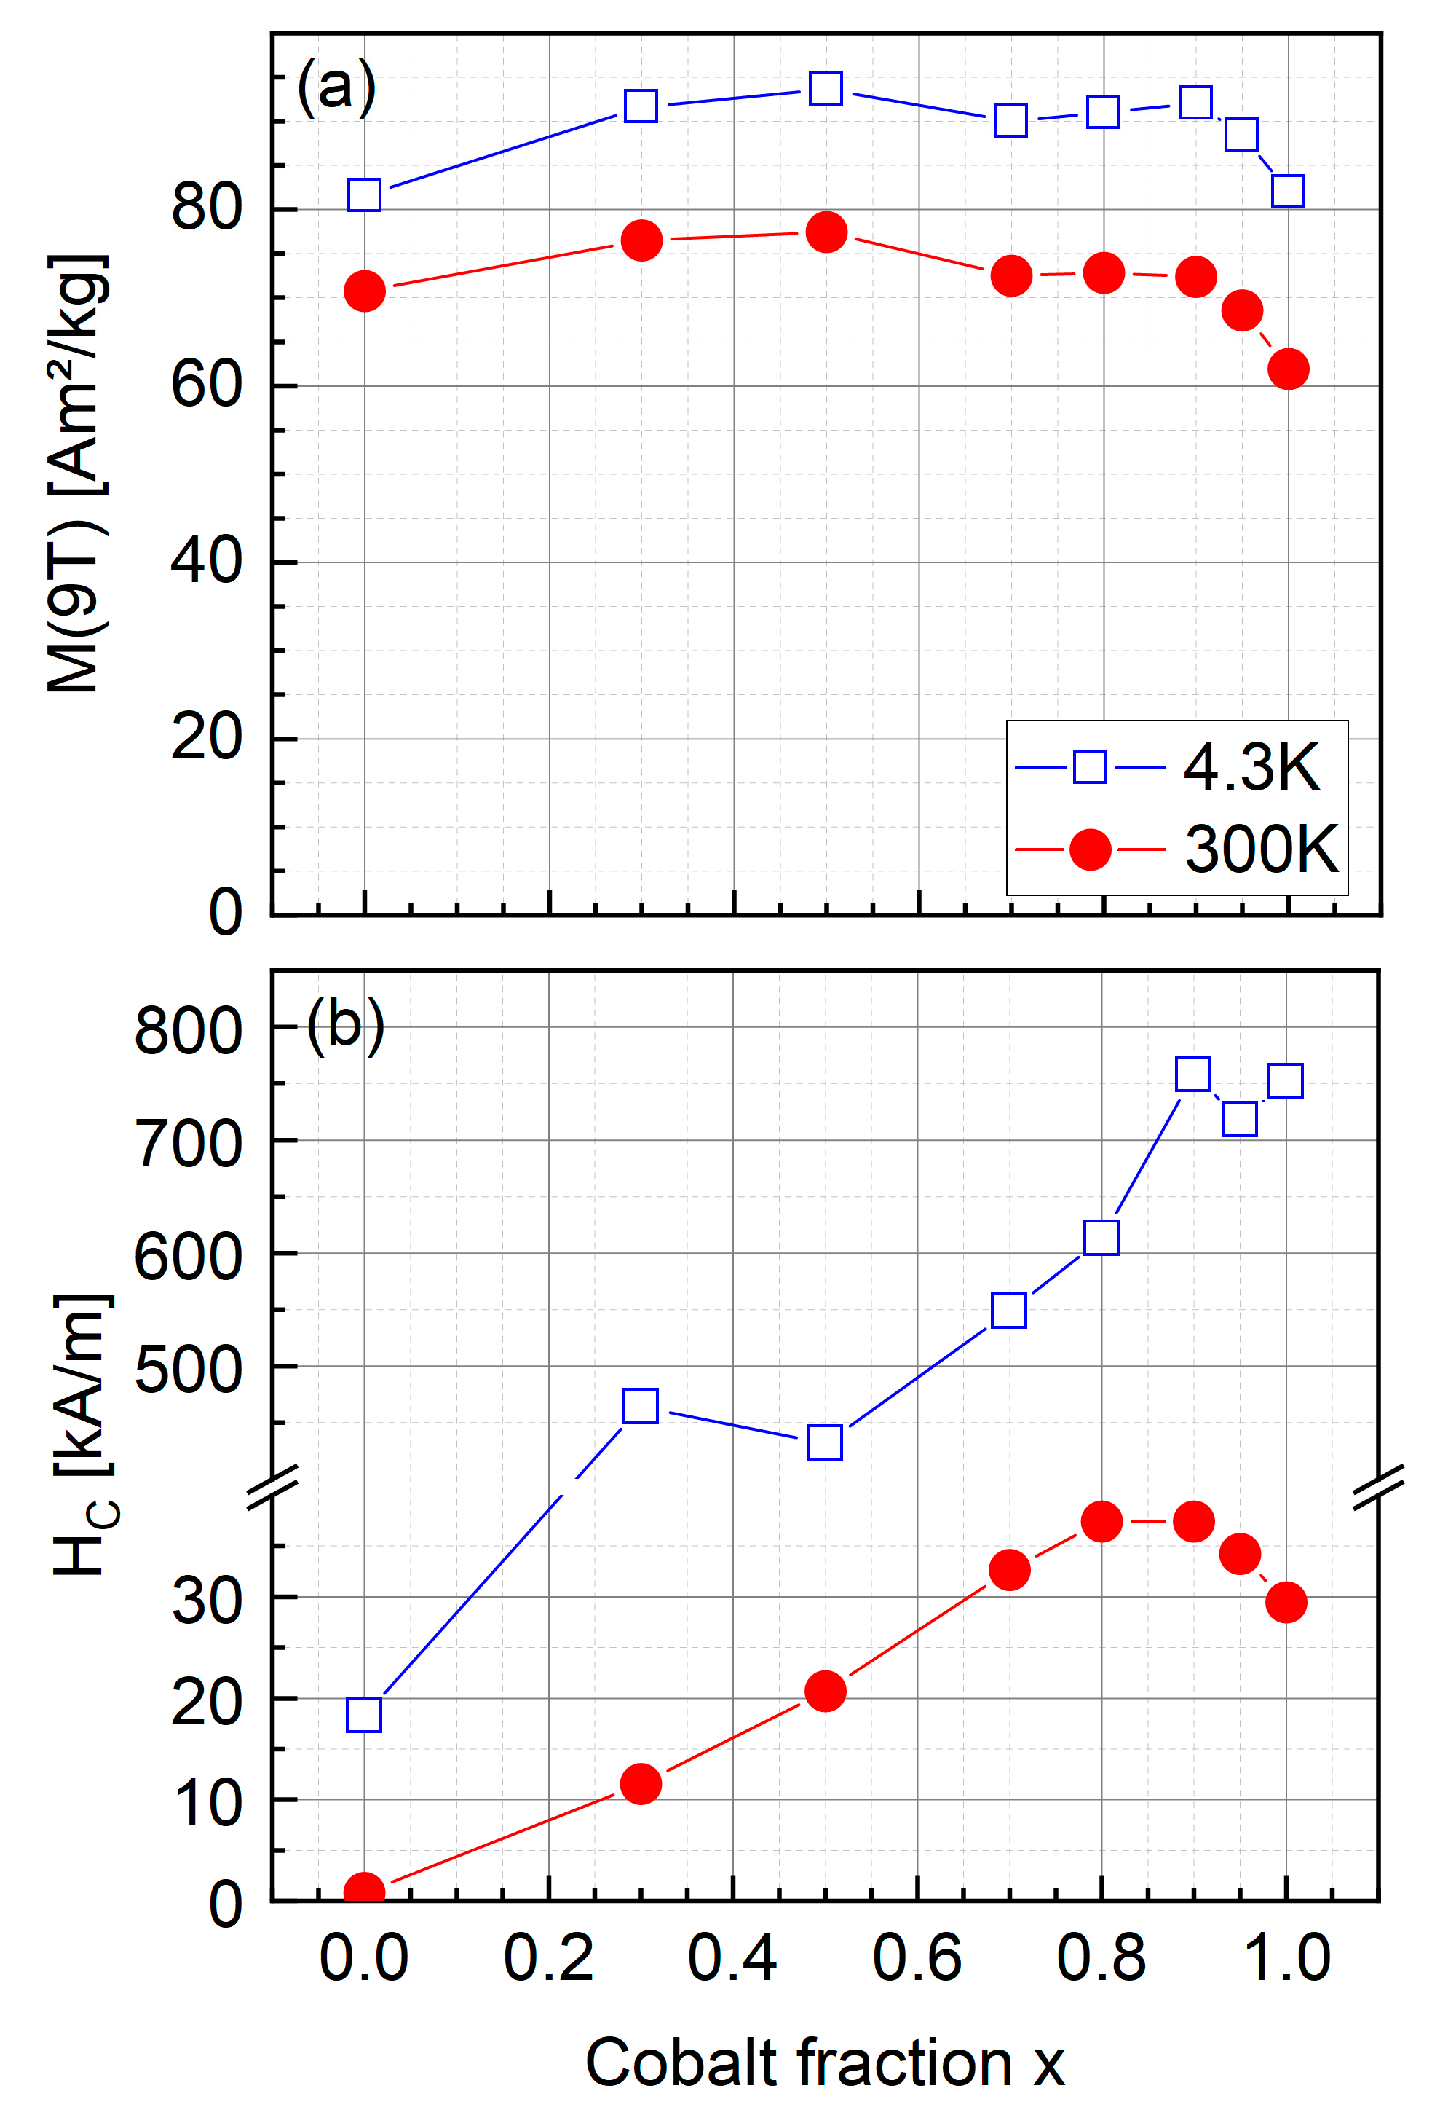
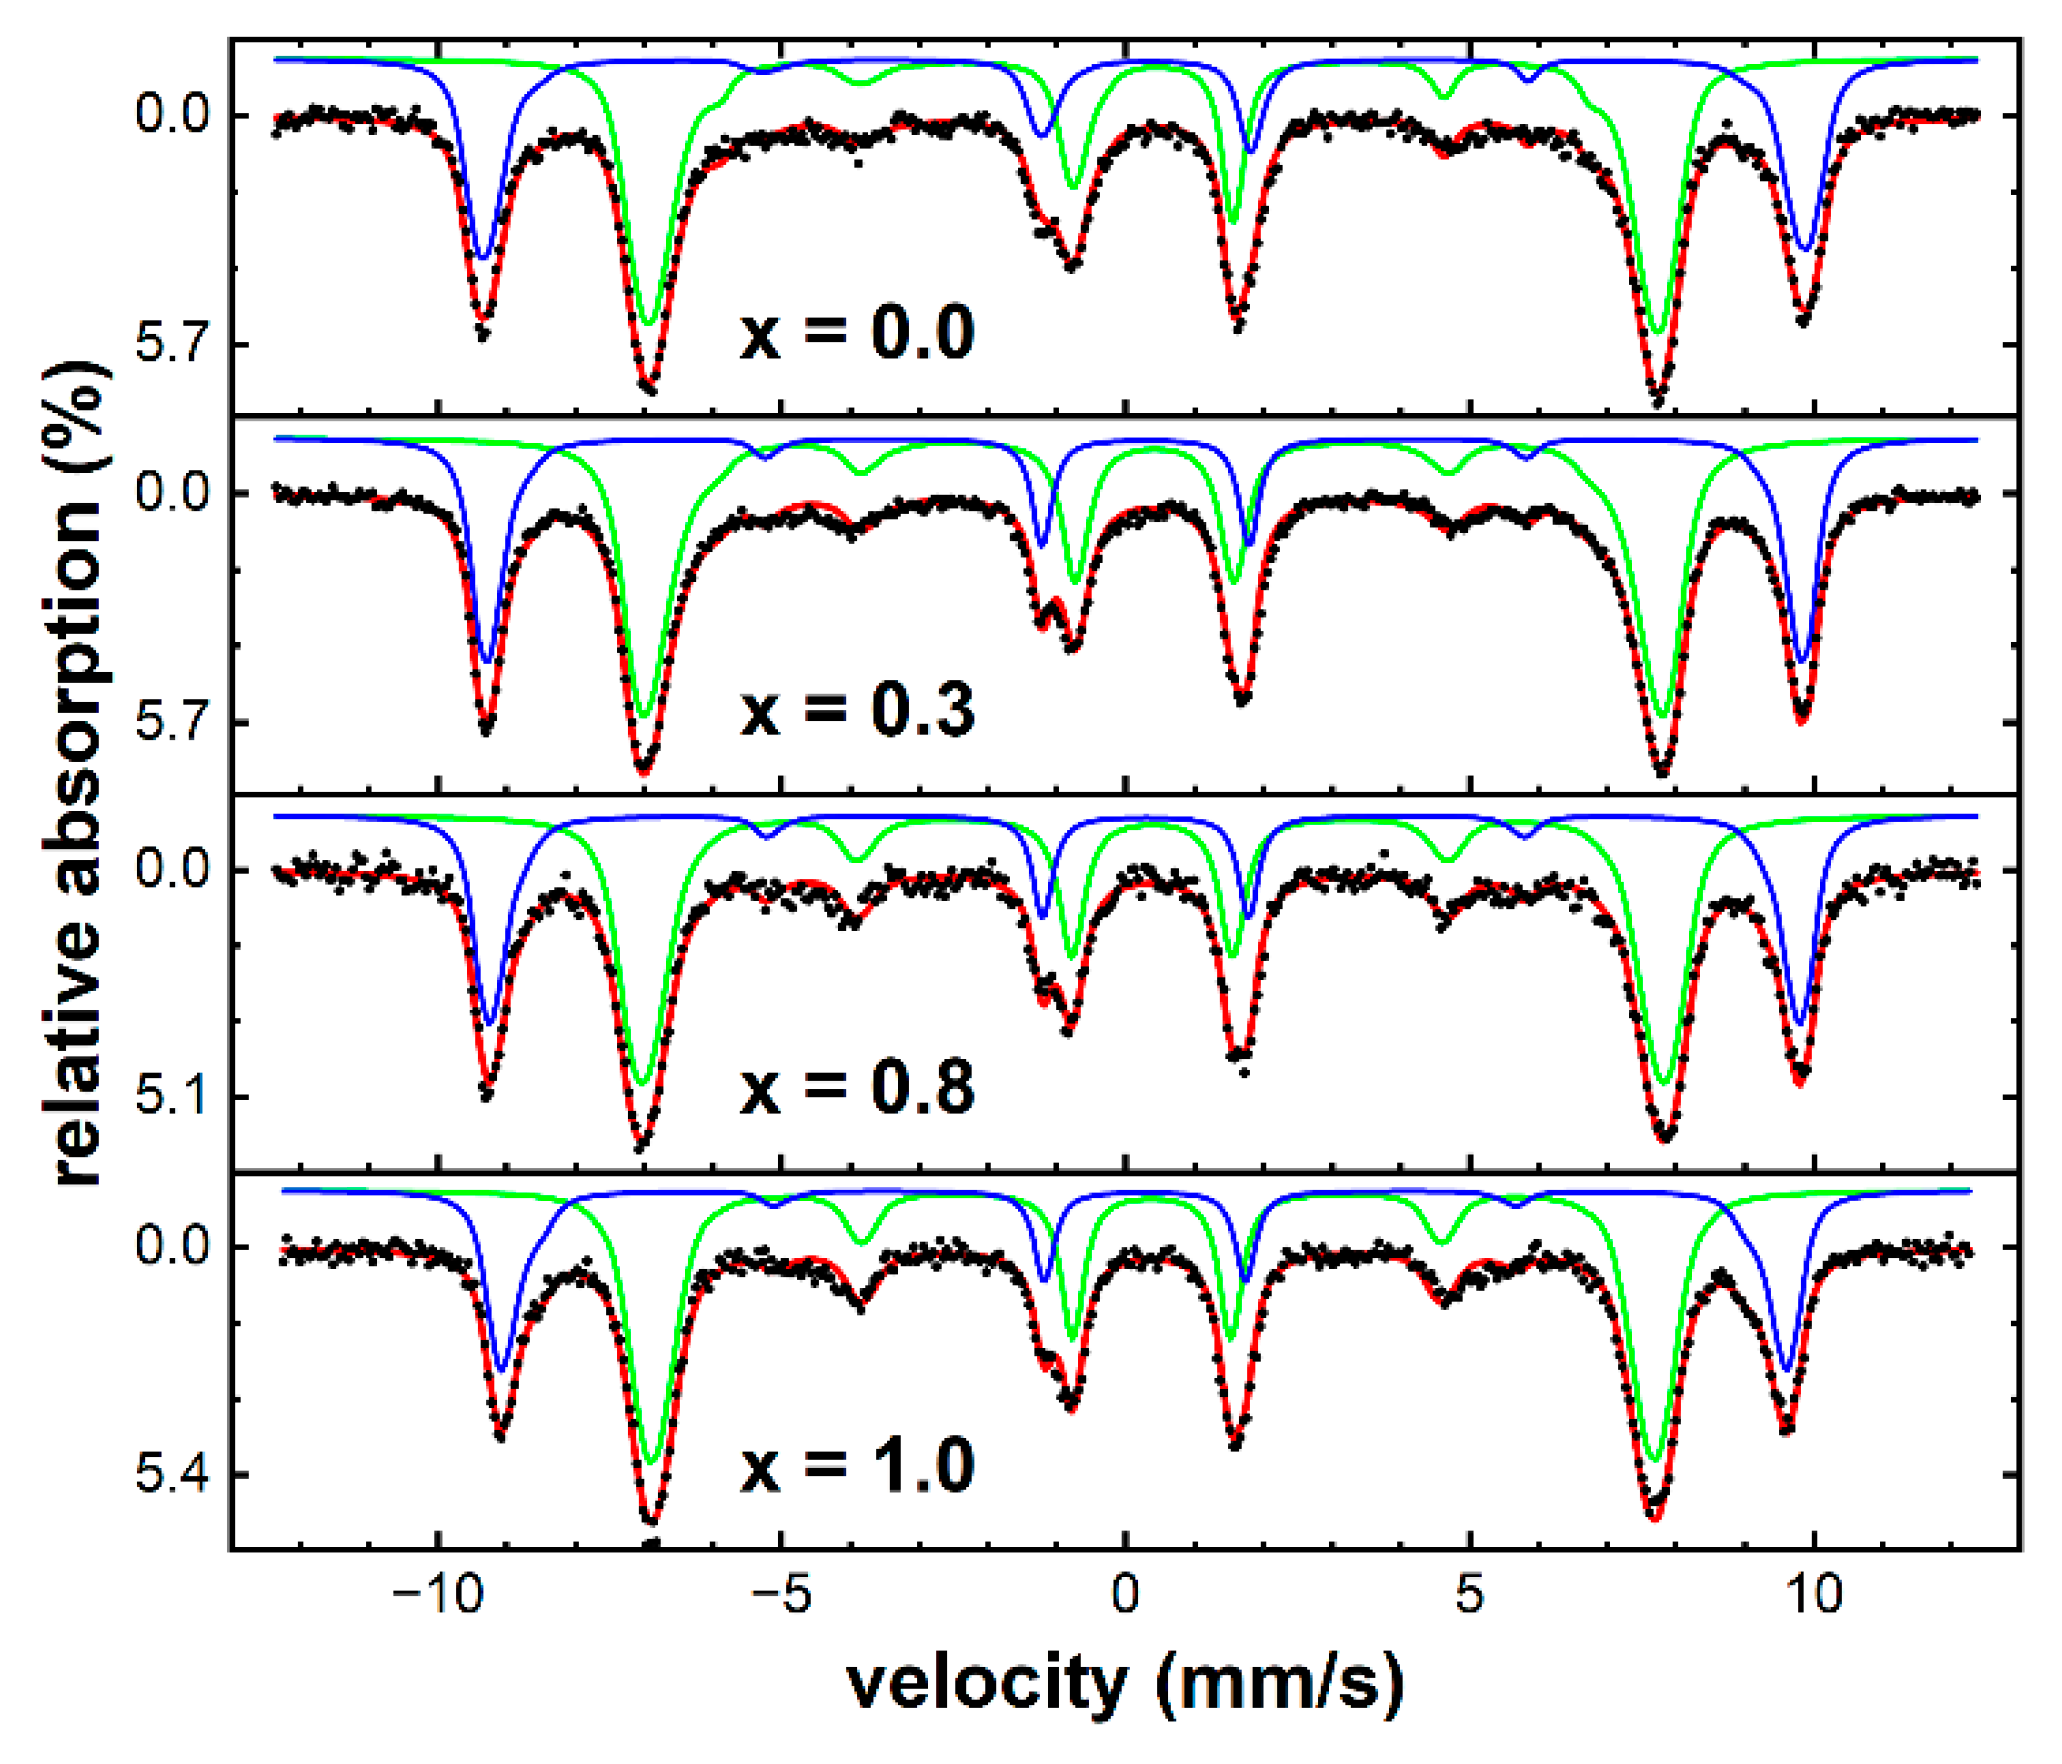
3.2. Series 2—Variation of Cobalt Fraction x
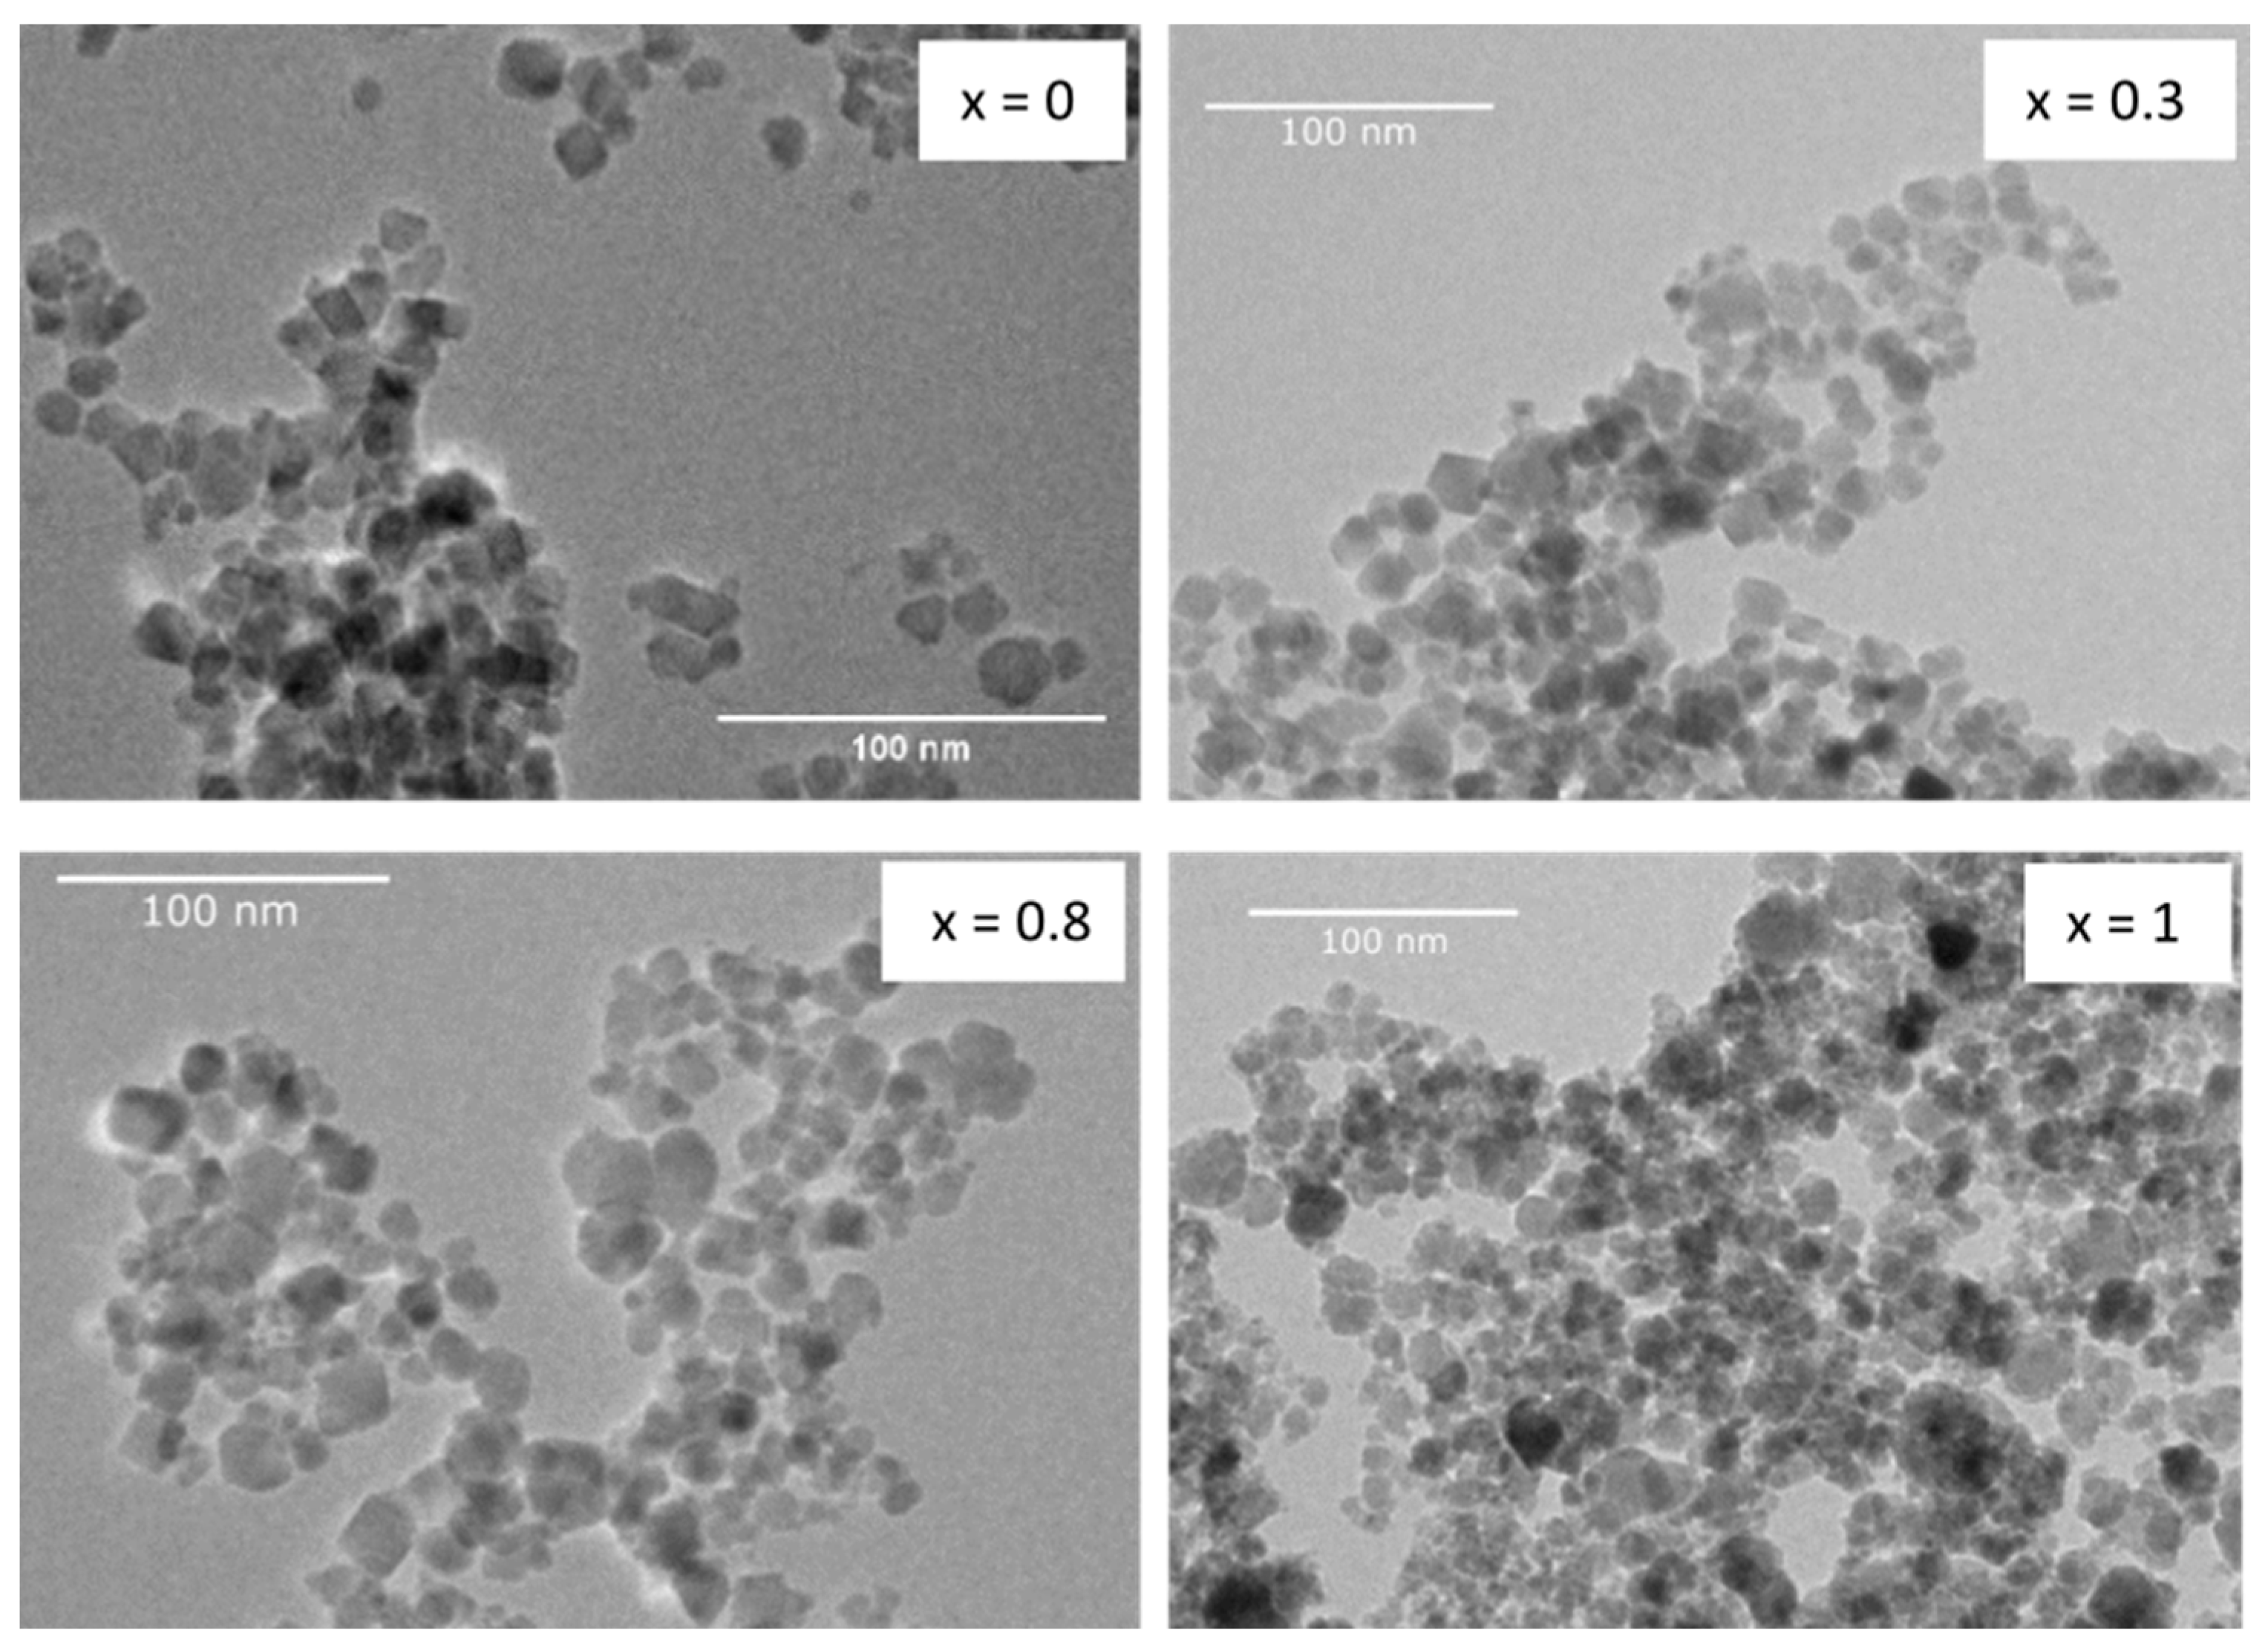
3.2.1. TEM Analysis
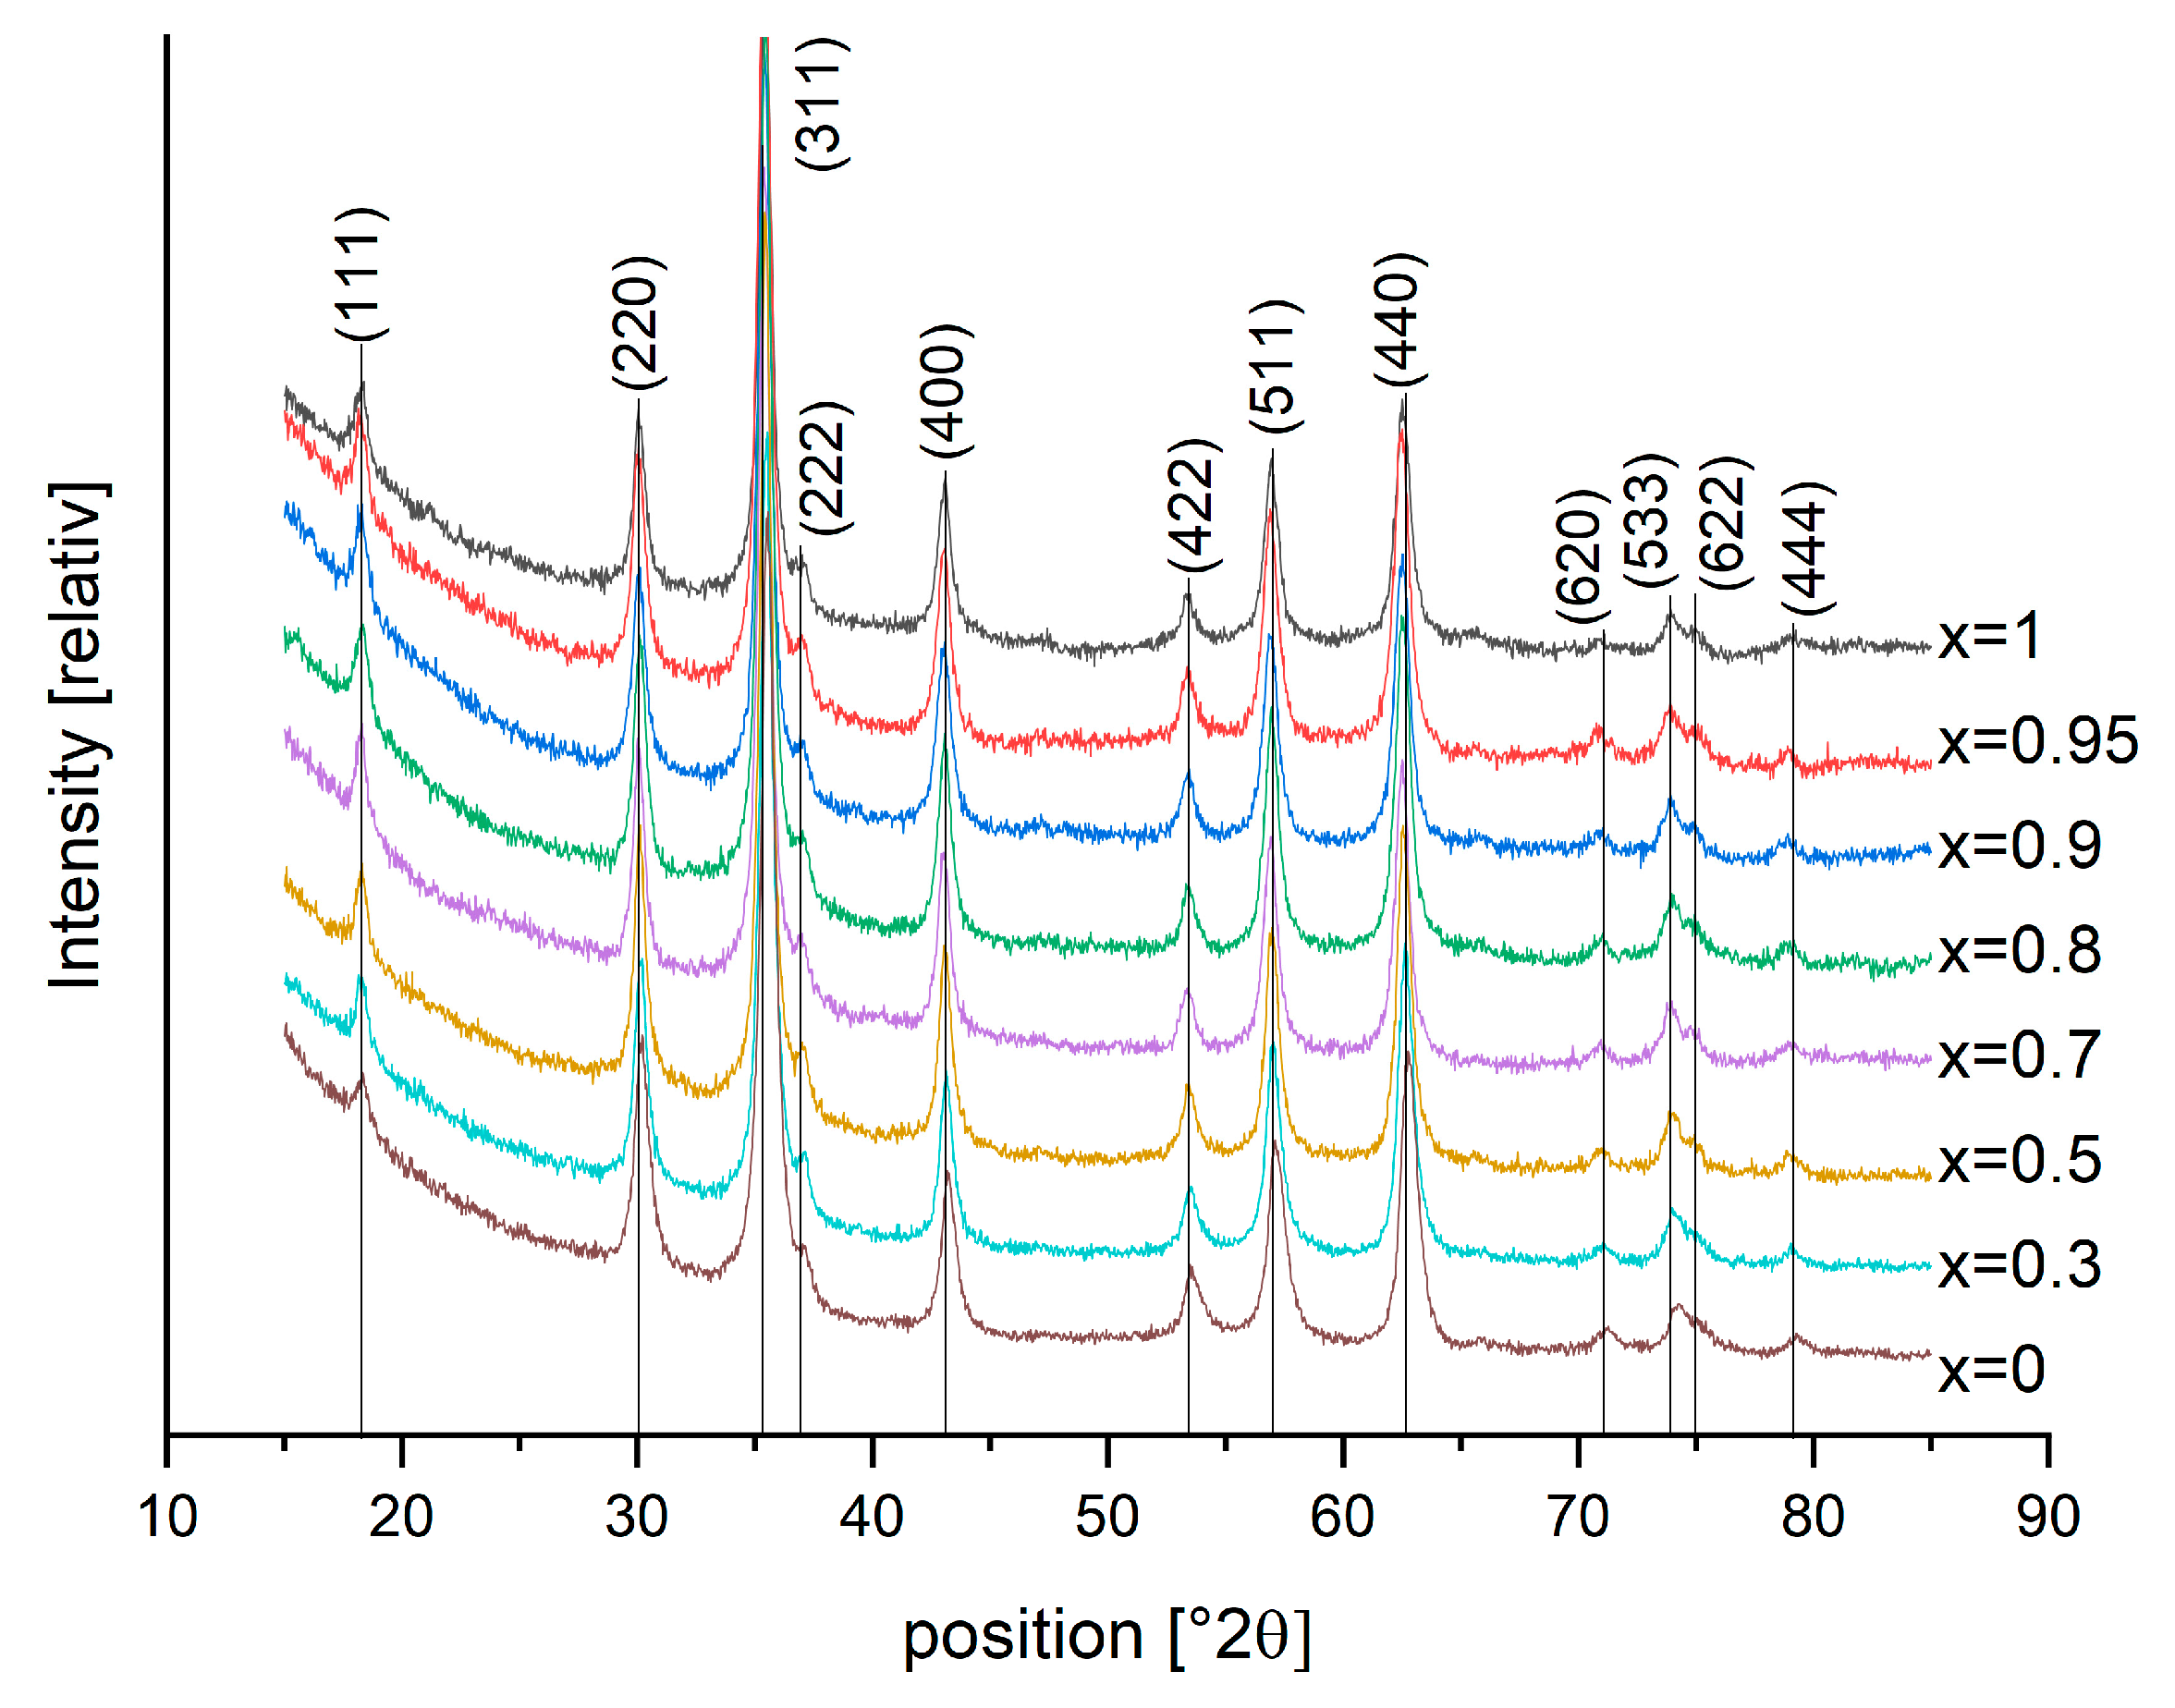
3.2.2. XRD
3.2.3. Magnetic Properties
3.2.4. Mössbauer Spectroscopy
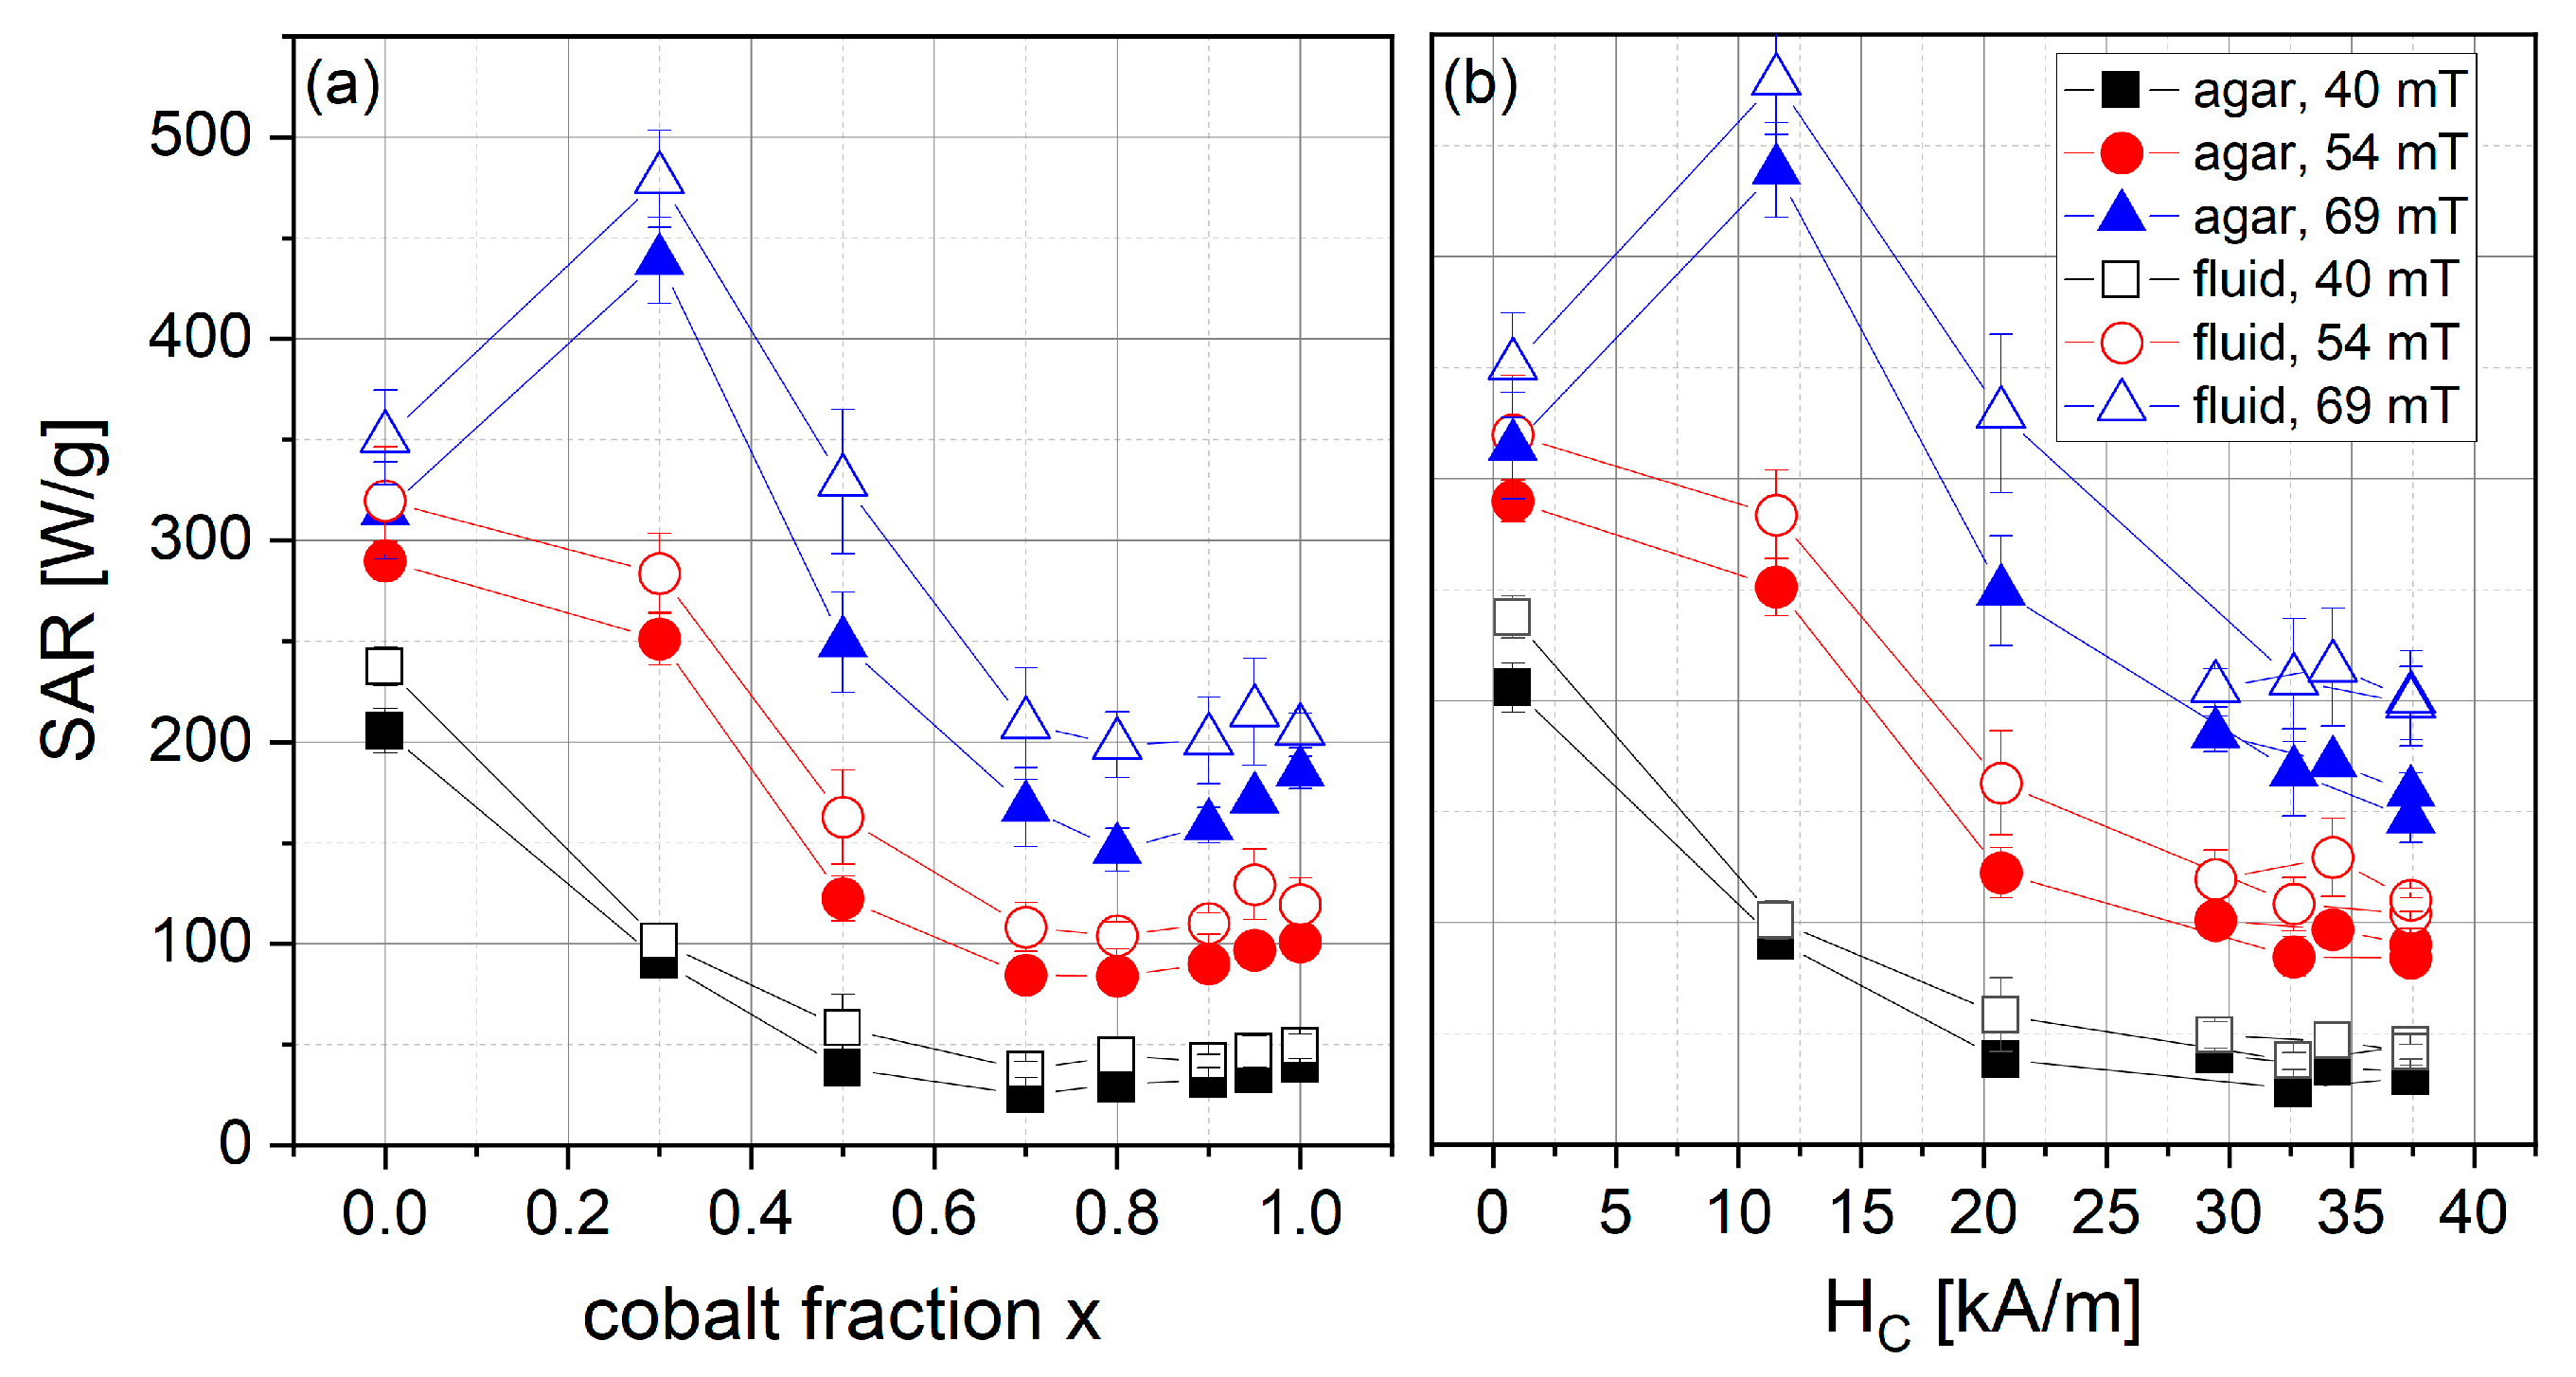
3.2.5. SAR
4. Conclusions
Author Contributions
Funding
Data Availability Statement
Conflicts of Interest
References
- Gordon, R.T.; Hines, J.R.; Gordon, D. Intracellular Hyperthermia. A Biophysical Approach to Cancer Treatment Via Intracellular Temperature and Biophysical Alterations. Med. Hypotheses 1979, 5, 83–102. [Google Scholar] [CrossRef]
- Dutz, S.; Hergt, R. Magnetic particle hyperthermia—A promising tumour therapy? Nanotechnology 2014, 25, 452001. [Google Scholar] [CrossRef] [PubMed]
- Gneveckow, U.; Jordan, A.; Scholz, R.; Brüß, V.; Waldöfner, N.; Ricke, J.; Feussner, A.; Hildebrandt, B.; Rau, B.; Wust, P. Description and characterization of the novel hyperthermia- and thermoablation-system MFH®300F for clinical magnetic fluid hyperthermia. Med. Phys. 2004, 31, 1444–1451. [Google Scholar] [CrossRef] [PubMed]
- Kheirkhah, P.; Denyer, S.; Bhimani, A.D.; Arnone, G.D.; Esfahani, D.R.; Aguilar, T.; Zakrzewski, J.; Venugopal, I.; Habib, N.; Gallia, G.L.; et al. Magnetic Drug Targeting: A Novel Treatment for Intramedullary Spinal Cord Tumors. Sci. Rep. 2018, 8, 11417. [Google Scholar] [CrossRef]
- Tietze, R.; Lyer, S.; Dürr, S.; Struffert, T.; Engelhorn, T.; Schwarz, M.; Eckert, E.; Göen, T.; Vasylyev, S.; Peukert, W.; et al. Efficient drug-delivery using magnetic nanoparticles—Biodistribution and therapeutic effects in tumour bearing rabbits. Nanomed. Nanotechnol. Biol. Med. 2013, 9, 961–971. [Google Scholar] [CrossRef] [PubMed]
- Cunningham, C.H.; Arai, T.; Yang, P.C.; McConnell, M.V.; Pauly, J.M.; Conolly, S.M. Positive contrast magnetic resonance imaging of cells labeled with magnetic nanoparticles. Magn. Reson. Med. 2005, 53, 999–1005. [Google Scholar] [CrossRef]
- Besenhard, M.O.; Panariello, L.; Kiefer, C.; LaGrow, A.P.; Storozhuk, L.; Perton, F.; Begin, S.; Mertz, D.; Thanh, N.T.K.; Gavriilidis, A. Small iron oxide nanoparticles as MRI T1 contrast agent: Scalable inexpensive water-based synthesis using a flow reactor. Nanoscale 2021, 13, 8795–8805. [Google Scholar] [CrossRef] [PubMed]
- Hergt, R.; Dutz, S. Magnetic particle hyperthermia—Biophysical limitations of a visionary tumour therapy. J. Magn. Magn. Mater. 2007, 311, 187–192. [Google Scholar] [CrossRef]
- Thomas, J.A.; Schnell, F.; Kaveh-Baghbaderani, Y.; Berensmeier, S.; Schwaminger, S.P. Immunomagnetic Separation of Microorganisms with Iron Oxide Nanoparticles. Chemosensors 2020, 8, 17. [Google Scholar] [CrossRef]
- Sung, Y.J.; Suk, H.-J.; Sung, H.Y.; Li, T.; Poo, H.; Kim, M.-G. Novel antibody/gold nanoparticle/magnetic nanoparticle nanocomposites for immunomagnetic separation and rapid colorimetric detection of Staphylococcus aureus in milk. Biosens. Bioelectron. 2013, 43, 432–439. [Google Scholar] [CrossRef]
- Dutz, S. Nanopartikel in Der Medizin—Magnetische Eisenoxid-Nanopartikel Für Intrakorporale Erwärmungsanwendungen; Verlag Dr. Kovač: Hamburg, Germany, 2008. [Google Scholar]
- Noh, S.-H.; Na, W.; Jang, J.-T.; Lee, J.-H.; Lee, E.J.; Moon, S.H.; Lim, Y.; Shin, J.-S.; Cheon, J. Nanoscale Magnetism Control via Surface and Exchange Anisotropy for Optimized Ferrimagnetic Hysteresis. Nano Lett. 2012, 12, 3716–3721. [Google Scholar] [CrossRef] [PubMed]
- Yang, Y.; Liu, X.; Lv, Y.; Herng, T.S.; Xu, X.; Xia, W.; Zhang, T.; Fang, J.; Xiao, W.; Ding, J. Orientation Mediated Enhancement on Magnetic Hyperthermia of Fe3O4 Nanodisc. Adv. Funct. Mater. 2015, 25, 812–820. [Google Scholar] [CrossRef]
- Nemati, Z.; Alonso, J.; Rodrigo, I.; Das, R.; Garaio, E.; García, J.A.; Orue, I.; Phan, M.-H.; Srikanth, H. Improving the Heating Efficiency of Iron Oxide Nanoparticles by Tuning Their Shape and Size. J. Phys. Chem. C 2018, 122, 2367–2381. [Google Scholar] [CrossRef]
- Reyes-Ortega, F.; Delgado, Á.V.; Iglesias, G.R. Modulation of the Magnetic Hyperthermia Response Using Different Superparamagnetic Iron Oxide Nanoparticle Morphologies. Nanomaterials 2021, 11, 627. [Google Scholar] [CrossRef]
- Lévy, M.; Wilhelm, C.; Siaugue, J.-M.; Horner, O.; Bacri, J.-C.; Gazeau, F. Magnetically induced hyperthermia: Size-dependent heating power of γ-Fe2O3 nanoparticles. J. Phys. Condens. Matter 2008, 20, 204133. [Google Scholar] [CrossRef] [PubMed]
- Li, Q.; Kartikowati, C.W.; Horie, S.; Ogi, T.; Iwaki, T.; Okuyama, K. Correlation between particle size/domain structure and magnetic properties of highly crystalline Fe3O4 nanoparticles. Sci. Rep. 2017, 7, 9894. [Google Scholar] [CrossRef] [PubMed]
- Zahn, D.; Landers, J.; Buchwald, J.; Diegel, M.; Salamon, S.; Müller, R.; Köhler, M.; Ecke, G.; Wende, H.; Dutz, S. Ferrimagnetic Large Single Domain Iron Oxide Nanoparticles for Hyperthermia Applications. Nanomaterials 2022, 12, 343. [Google Scholar] [CrossRef]
- Sickafus, K.E.; Wills, J.M.; Grimes, N.W. Structure of Spinel. J. Am. Ceram. Soc. 2004, 82, 3279–3292. [Google Scholar] [CrossRef]
- Cedeño-Mattei, Y.; Perales-Pérez, O.; Uwakweh, O. Synthesis of high-coercivity non-stoichiometric cobalt ferrite nanocrystals: Structural and magnetic characterization. Mater. Chem. Phys. 2012, 132, 999–1006. [Google Scholar] [CrossRef]
- Yu, Y.; Mendoza-Garcia, A.; Ning, B.; Sun, S. Cobalt-substituted magnetite nanoparticles and their assembly into ferrimagnetic nanoparticle arrays. Adv. Mater. 2013, 25, 3090–3094. [Google Scholar] [CrossRef]
- Yasemian, A.R.; Kashi, M.A.; Ramazani, A. Exploring the effect of Co concentration on magnetic hyperthermia properties of CoxFe3−xO4 nanoparticles. Mater. Res. Express 2020, 7, 16113. [Google Scholar] [CrossRef]
- Kumar, P.; Pathak, S.; Singh, A.; Kuldeep; Khanduri, H.; Wang, X.; Basheed, G.; Pant, R. Optimization of cobalt concentration for improved magnetic characteristics and stability of CoxFe3−xO4 mixed ferrite nanomagnetic fluids. Mater. Chem. Phys. 2021, 265, 124476. [Google Scholar] [CrossRef]
- Gil, F.A.; Benavides, O.; Martínez, V.S.; de la Cruz-May, L.; Patiño, C.C. Synthesis and Characterization of Cobalt Ferrite CoxFe3−xO4 Nanoparticles by Raman Spectroscopy and X-ray Diffraction. Int. J. Met. Met. Phys. 2020, 5, 47. [Google Scholar] [CrossRef]
- Dutz, S.; Buske, N.; Landers, J.; Gräfe, C.; Wende, H.; Clement, J.H. Biocompatible Magnetic Fluids of Co-Doped Iron Oxide Nanoparticles with Tunable Magnetic Properties. Nanomaterials 2020, 10, 1019. [Google Scholar] [CrossRef]
- Betancourt-Galindo, R.; Ayala-Valenzuela, O.; García-Cerda, L.; Fernández, O.R.; Matutes-Aquino, J.; Ramos, G.; Yee-Madeira, H. Synthesis and magneto-structural study of CoxFe3−xO4 nanoparticles. J. Magn. Magn. Mater. 2005, 294, e33–e36. [Google Scholar] [CrossRef]
- Babukutty, B.; Kalarikkal, N.; Nair, S.S. Studies on structural, optical and magnetic properties of cobalt substituted magnetite fluids (CoxFe1−xFe2O4). Mater. Res. Express 2017, 4, 35906. [Google Scholar] [CrossRef]
- Anjum, S.; Tufail, R.; Rashid, K.; Zia, R.; Riaz, S. Effect of cobalt doping on crystallinity, stability, magnetic and optical properties of magnetic iron oxide nano-particles. J. Magn. Magn. Mater. 2017, 432, 198–207. [Google Scholar] [CrossRef]
- Degen, T.; Sadki, M.; Bron, E.; König, U.; Nénert, G. The Highscore Suite. Powder Diffr. 2014, 29, S13–S18. [Google Scholar] [CrossRef]
- Dutz, S.; Müller, R.; Eberbeck, D.; Hilger, I.; Zeisberger, M. Magnetic nanoparticles adapted for specific biomedical applications. Biomed. Eng. Biomed. Tech. 2015, 60, 405–416. [Google Scholar] [CrossRef]
- Toraya, H. A new method for quantitative phase analysis using X-ray powder diffraction: Direct derivation of weight fractions from observed integrated intensities and chemical compositions of individual phases. Corrigendum. J. Appl. Crystallogr. 2017, 50, 665. [Google Scholar] [CrossRef]
- O’Neill, H.S.C.; Navrotsky, A. Simple Spinels; Crystallographic Parameters, Cation Radii, Lattice Energies, and Cation Distribution. Am. Mineral. 1983, 68, 181–194. [Google Scholar]
- Cai, J.; Liu, J.; Gao, Z.; Navrotsky, A.; Suib, S.L. Synthesis and Anion Exchange of Tunnel Structure Akaganeite. Chem. Mater. 2001, 13, 4595–4602. [Google Scholar] [CrossRef]
- Kahnes, M.; Müller, R.; Töpfer, J. Phase formation and magnetic properties of CoFe2O4/CoFe2 nanocomposites. Mater. Chem. Phys. 2019, 227, 83–89. [Google Scholar] [CrossRef]
- Nlebedim, I.; Moses, A.; Jiles, D. Non-stoichiometric cobalt ferrite, CoxFe3−xO4 (x=1.0 to 2.0): Structural, magnetic and magnetoelastic properties. J. Magn. Magn. Mater. 2013, 343, 49–54. [Google Scholar] [CrossRef]
- Ateia, E.E.; Abdelatif, G.; Soliman, F.S. Optimizing the physical properties of calcium nanoferrites to be suitable in many applications. J. Mater. Sci. Mater. Electron. 2017, 28, 5846–5851. [Google Scholar] [CrossRef]
- Ferreira, T.; Waerenborgh, J.; Mendonça, M.; Nunes, M.; Costa, F. Structural and morphological characterization of FeCo2O4 and CoFe2O4 spinels prepared by a coprecipitation method. Solid State Sci. 2003, 5, 383–392. [Google Scholar] [CrossRef]
- Kawano, S.; Achiwa, N.; Yamamoto, N.; Higashi, S.-N. Metalion distribution and magnetic structure of Fe-substituted cobaltite spinel: FeCo2O4. Mater. Res. Bull. 1976, 11, 911–916. [Google Scholar] [CrossRef]
- Wahba, A.M.; Mohamed, M.B. Structural and magnetic characterization and cation distribution of nanocrystalline CoxFe3−xO4 ferrites. J. Magn. Magn. Mater. 2015, 378, 246–252. [Google Scholar] [CrossRef]
- Arakaki, A.; Takahashi, M.; Hosokawa, M.; Matsunaga, T.; Tanaka, T. Bacterial Inactivation by Applying an Alternating Electromagnetic Field Using PAMAM Dendron-modified Magnetic Nanoparticles. Electrochemistry 2016, 84, 324–327. [Google Scholar] [CrossRef]
- Jolivet, J.-P.; Tronc, E.; Chanéac, C. Iron oxides: From molecular clusters to solid. A nice example of chemical versatility. Comptes Rendus Geosci. 2006, 338, 488–497. [Google Scholar] [CrossRef]
- Dutrizac, J.E.; Riveros, P.A. The precipitation of hematite from ferric chloride media at atmospheric pressure. Met. Mater. Trans. B 1999, 30, 993–1001. [Google Scholar] [CrossRef]
- Gnanaprakash, G.; Philip, J.; Raj, B. Effect of divalent metal hydroxide solubility product on the size of ferrite nanoparticles. Mater. Lett. 2007, 61, 4545–4548. [Google Scholar] [CrossRef]
- Ammar, S.; Jouini, N.; Fiévet, F.; Beji, Z.; Smiri, L.; Moliné, P.; Danot, M.; Greneche, J.-M. Magnetic properties of zinc ferrite nanoparticles synthesized by hydrolysis in a polyol medium. J. Phys. Condens. Matter 2006, 18, 9055–9069. [Google Scholar] [CrossRef]
- Pankhurst, Q.A.; Pollard, R.J. Mossbauer spectra of antiferromagnetic powders in applied fields. J. Phys. Condens. Matter 1990, 2, 7329–7337. [Google Scholar] [CrossRef]
- Urtizberea, A.; Luis, F.; Millán, A.; Natividad, E.; Palacio, F.; Kampert, E.; Zeitler, U. Thermoinduced magnetic moment in akaganéite nanoparticles. Phys. Rev. B 2011, 83, 214426. [Google Scholar] [CrossRef]
- Murad, E. Mössbauer and X-ray Data on Β-Feooh (Akaganéite). Clay Miner. 1979, 14, 273–283. [Google Scholar] [CrossRef]
- Dezsi, I.; Keszthelyi, L.; Kulgawczuk, D.; McInar, B.; Eissa, N.A. Mössbauer Study of Β-and Δ-Feooh and Their Disintegration Products. Phys. Status Solidi B 1967, 22, 617–629. [Google Scholar] [CrossRef]
- Jones, D.H.; Srivastava, K.K.P. Many-state relaxation model for the Mössbauer spectra of superparamagnets. Phys. Rev. B 1986, 34, 7542–7548. [Google Scholar] [CrossRef]
- Daou, T.J.; Grenèche, J.M.; Pourroy, G.; Buathong, S.; Derory, A.; Ulhaq-Bouillet, C.; Donnio, B.; Guillon, D.; Begin-Colin, S. Coupling Agent Effect on Magnetic Properties of Functionalized Magnetite-Based Nanoparticles. Chem. Mater. 2008, 20, 5869–5875. [Google Scholar] [CrossRef]
- Takahashi, M.; Fine, M.E. Magnetic Behavior of Quenched and Aged CoFe2O4–Co3O4 Alloys. J. Appl. Phys. 1972, 43, 4205–4216. [Google Scholar] [CrossRef]
- De Guire, M.R.; O’Handley, R.C.; Kalonji, G. The Cooling Rate Dependence of Cation Distributions in CoFe2O4. J. Appl. Phys. 1989, 65, 3167–3172. [Google Scholar] [CrossRef]
- Müller, R.; Dutz, S.; Neeb, A.; Cato, A.; Zeisberger, M. Magnetic heating effect of nanoparticles with different sizes and size distributions. J. Magn. Magn. Mater. 2013, 328, 80–85. [Google Scholar] [CrossRef]


| Parameter | Abbreviation | Unit | Used Values | |||
|---|---|---|---|---|---|---|
| Duration of NaOH addition | dadd | min | 0 | 2 | 4 | 8 |
| Addition temperature | Tadd | °C | 25 | 40 | 65 | 88 |
| End temperature | Tend | °C | 70 | 85 | 97 | |
| Duration of reaction | dreact | min | 30 | 60 | 90 | |
| O2 Atmosphere | N2 Atmosphere | ||||||||
|---|---|---|---|---|---|---|---|---|---|
| dadd | Tadd | Tend | dreact | Size | Crystallinity | a | Size | Crystallinity | a |
| min | °C | °C | min | nm | % | Å | nm | % | Å |
| 0 | 40 | 97 | 60 | 12.9 | 42.7 | 8.391 | 11.4 | 43.6 | 8.396 |
| 2 | 12.6 | 43.6 | 8.383 | 15.7 | 41.4 | 8.395 | |||
| 4 | 12.0 | 35.6 | 8.364 | 17.0 | 37.8 | 8.392 | |||
| 8 | 13.6 | 40.0 | 8.384 | 17.4 | 36.3 | 8.395 | |||
| 0 | 25 | 97 | 60 | 13.3 | 42.3 | 8.389 | 11.0 | 36.0 | 8.392 |
| 40 | 12.9 | 42.7 | 8.391 | 11.4 | 43.6 | 8.396 | |||
| 65 | 13.8 | 26.9 | 8.415 | 12.1 | 44.4 | 8.398 | |||
| 85 | 13.8 | 38.9 | 8.381 | 14.1 | 38.4 | 8.395 | |||
| 2 | 25 | 97 | 60 | 11.3 | 33.0 | 8.375 | 14.4 | 38.5 | 8.401 |
| 40 | 12.6 | 43.6 | 8.383 | 15.7 | 41.4 | 8.395 | |||
| 65 | 13.0 | 33.3 | 8.372 | 18.0 | 36.9 | 8.393 | |||
| 85 | 14.2 | 32.7 | 8.426 | 12.5 | 28.5 | 8.417 | |||
| 2 | 40 | 70 | 60 | 12.8 | 30.7 | 8.342 | 10.3 | 28.2 | 8.364 |
| 85 | 11.9 | 35.4 | 8.355 | 15.4 | 38.4 | 8.402 | |||
| 97 | 12.6 | 43.6 | 8.383 | 15.7 | 41.4 | 8.395 | |||
| 2 | 40 | 97 | 30 | 12.0 | 34.8 | 8.376 | 15.5 | 33.1 | 8.400 |
| 60 | 12.6 | 43.6 | 8.383 | 15.7 | 41.4 | 8.395 | |||
| 90 | 11.9 | 37.4 | 8.361 | 16.4 | 34.3 | 8.405 | |||
| O2 Atmosphere | N2 Atmosphere | ||||||
|---|---|---|---|---|---|---|---|
| dadd | Tadd | Tend | dreact | MRT,2T | HC | MRT,2T | HC |
| [min] | [°C] | [°C] | [min] | [Am2/kg] | [kA/m] | [Am2/kg] | [kA/m] |
| 0 | 40 | 97 | 60 | 51.67 ± 1.1 | 28.30 ± 4.1 | 59.44 ± 0.8 | 10.16 ± 0.2 |
| 2 | 39.40 ± 0.5 | 38.72 ± 2.2 | 52.21 ± 0.8 | 26.87 ± 1.4 | |||
| 4 | 36.44 ± 1.1 | 44.91 ± 3.0 | 49.90 ± 2.4 | 27.81 ± 3.4 | |||
| 8 | 36.79 ± 0.5 | 41.65 ± 2.1 | 49.54 ± 0.8 | 24.05 ± 2.0 | |||
| 0 | 25 | 97 | 60 | 47.53 ± 0.5 | 39.84 ± 2.6 | 60.27 ± 0.3 | 9.22 ± 0.1 |
| 40 | 51.67 ± 1.1 | 28.30 ± 4.1 | 59.44 ± 0.8 | 10.16 ± 0.2 | |||
| 65 | 52.13 ± 0.8 | 29.41 ± 1.8 | 61.47 ± 0.5 | 11.63 ± 0.5 | |||
| 85 | 48.51 ± 2.5 | 12.33 ± 1.5 | 54.08 ± 8.0 | 10.86 ± 2.3 | |||
| 2 | 25 | 97 | 60 | 34.70 ± 0.8 | 24.98 ± 2.3 | 55.03 ± 0.5 | 26.60 ± 0.9 |
| 40 | 39.40 ± 0.5 | 38.72 ± 2.2 | 52.21 ± 0.8 | 26.87 ± 1.4 | |||
| 65 | 28.49 ± 1.6 | 61.28 ± 11.6 | 51.74 ± 1.8 | 30.45 ± 2.8 | |||
| 85 | 14.06 ± 4.0 | 18.11 ± 2.6 | 7.55 ± 0.4 | 1.01 ± 0.4 | |||
| 2 | 40 | 70 | 60 | 13.27 ± 0.6 | 108.31 ± 2.3 | 19.52 ± 2.1 | 4.65 ± 0.7 |
| 85 | 24.70 ± 1.8 | 60.14 ± 11.4 | 51.89 ± 1.9 | 25.50 ± 1.9 | |||
| 97 | 39.40 ± 0.5 | 38.72 ± 2.2 | 52.21 ± 0.8 | 26.87 ± 1.4 | |||
| 2 | 40 | 97 | 30 | 29.90 ± 1.0 | 40.00 ± 5.3 | 43.68 ± 1.4 | 23.05 ± 1.4 |
| 60 | 39.40 ± 0.5 | 38.72 ± 2.2 | 52.21 ± 0.8 | 26.87 ± 1.4 | |||
| 90 | 32.51 ± 2.8 | 39.19 ± 7.6 | 55.33 ± 1.5 | 32.22 ± 2.3 | |||
| x | Co2+/ Fe2++Fe3+ | HC @ 5 K [kA/m] | HC @ 300 K [kA/m] | M9T @ 5 K [Am2/kg] | M9T @ 300 K [Am2/kg] | a [Å] | Size [nm] | Crystallinity [%] |
|---|---|---|---|---|---|---|---|---|
| 0 | 0.00 | 18.31 | 0.80 | 81.57 | 70.77 | 8.380 | 12.4 | 50.6 |
| 0.3 | 0.11 | 464.07 | 11.54 | 91.62 | 76.52 | 8.391 | 14.4 | 50.1 |
| 0.5 | 0.20 | 431.43 | 20.70 | 93.65 | 77.43 | 8.395 | 16.5 | 45.8 |
| 0.7 | 0.30 | 548.44 | 32.64 | 90.01 | 72.48 | 8.407 | 16.6 | 45.0 |
| 0.8 | 0.36 | 612.92 | 37.41 | 90.97 | 72.81 | 8.397 | 15.2 | 40.4 |
| 0.9 | 0.43 | 757.79 | 37.41 | 92.08 | 72.38 | 8.406 | 14.5 | 40.5 |
| 0.95 | 0.46 | 717.99 | 34.23 | 88.41 | 68.57 | 8.410 | 14.5 | 41.3 |
| 1 | 0.50 | 751.42 | 29.45 | 81.98 | 61.92 | 8.405 | 16.4 | 34.3 |
Disclaimer/Publisher’s Note: The statements, opinions and data contained in all publications are solely those of the individual author(s) and contributor(s) and not of MDPI and/or the editor(s). MDPI and/or the editor(s) disclaim responsibility for any injury to people or property resulting from any ideas, methods, instructions or products referred to in the content. |
© 2023 by the authors. Licensee MDPI, Basel, Switzerland. This article is an open access article distributed under the terms and conditions of the Creative Commons Attribution (CC BY) license (https://creativecommons.org/licenses/by/4.0/).
Share and Cite
Zahn, D.; Landers, J.; Diegel, M.; Salamon, S.; Stihl, A.; Schacher, F.H.; Wende, H.; Dellith, J.; Dutz, S. Optimization of Magnetic Cobalt Ferrite Nanoparticles for Magnetic Heating Applications in Biomedical Technology. Nanomaterials 2023, 13, 1673. https://doi.org/10.3390/nano13101673
Zahn D, Landers J, Diegel M, Salamon S, Stihl A, Schacher FH, Wende H, Dellith J, Dutz S. Optimization of Magnetic Cobalt Ferrite Nanoparticles for Magnetic Heating Applications in Biomedical Technology. Nanomaterials. 2023; 13(10):1673. https://doi.org/10.3390/nano13101673
Chicago/Turabian StyleZahn, Diana, Joachim Landers, Marco Diegel, Soma Salamon, Andreas Stihl, Felix H. Schacher, Heiko Wende, Jan Dellith, and Silvio Dutz. 2023. "Optimization of Magnetic Cobalt Ferrite Nanoparticles for Magnetic Heating Applications in Biomedical Technology" Nanomaterials 13, no. 10: 1673. https://doi.org/10.3390/nano13101673
APA StyleZahn, D., Landers, J., Diegel, M., Salamon, S., Stihl, A., Schacher, F. H., Wende, H., Dellith, J., & Dutz, S. (2023). Optimization of Magnetic Cobalt Ferrite Nanoparticles for Magnetic Heating Applications in Biomedical Technology. Nanomaterials, 13(10), 1673. https://doi.org/10.3390/nano13101673