Abstract
Owing to its high reliability and accuracy, the ratiometric luminescent thermometer can provide non-contact and fast temperature measurements. In particular, the nanomaterials doped with lanthanide ions can achieve multi-mode luminescence and temperature measurement by modifying the type of doped ions and excitation light source. The better penetration of the near-infrared (NIR) photons can assist bio-imaging and replace thermal vision cameras for photothermal imaging. In this work, we prepared core–shell cubic phase nanomaterials doped with lanthanide ions, with Ba2LuF7 doped with Er3+/Yb3+/Nd3+ as the core and Ba2LaF7 as the coating shell. The nanoparticles were designed according to the passivation layer to reduce the surface energy loss and enhance the emission intensity. Green upconversion luminescence can be observed under both 980 nm and 808 nm excitation. A single and strong emission band can be obtained under 980 nm excitation, while abundant and weak emission bands appear under 808 nm excitation. Meanwhile, multi-mode ratiometric optical thermometers were achieved by selecting different emission peaks in the NIR window under 808 nm excitation for non-contact temperature measurement at different tissue depths. The results suggest that our core–shell NIR nanoparticles can be used to assist bio-imaging and record temperature for biomedicine.
1. Introduction
As a basic parameter, temperature has been widely observed and measured in many fields, such as bioengineering, medical treatment, and physical chemistry [1,2,3,4,5]. Ratio thermometers are based on the multiple emissions provided by phosphors, usually with significant relative sensitivity, Sr. The dual-emission ratio luminescence thermometer shows the resolvable emissions of two different emitters and can be used as a self-reference ratio [6,7]. Temperature-sensitive signal changes can be measured using ratio intensities rather than absolute photoluminescence intensities to reduce the influence of external factors [8]. On the one hand, the high accuracy and reliability of fluorescent nanoparticles in the application of ratio optical temperature measurement can be achieved [9]. On the other hand, lanthanide-doped nanoparticles can generate upconversion luminescence under the excitation of an external excitation light source [10]. Therefore, noninvasive, non-contact biological tissue temperature measurements based on lanthanide-doped nanoparticles are possible [11].
In fact, in the field of non-contact thermometry, lanthanide-doped nanoscale temperature probes can achieve NIR emission at the same time through NIR excitation [12]. Compared with luminescence thermometers based on other materials, lanthanide-doped nanoscale temperature probes can have richer NIR emission bands by changing the doping elements, which provides more options for multi-mode temperature measurement [13,14,15]. Different from visible light, the absorption and scattering of NIR photons in in vivo environments are significantly reduced. This avoids possible tissue damage caused by UV light, providing a greater reading of tissue penetration depth and optimizing the signal-to-noise ratio [16,17]. The excellent penetrability of the NIR region to biological tissues determines its potential in biological applications, especially for the second biological window (NIR region 2). The second biological window is not only convenient for multi-mode optical measurement but also coincides with the NIR imaging window. This gives the second biological window full use of the NIR-II window (1000–1350 nm) for in vivo fluorescence imaging. This advantage is not available in conventional visible light fluorescence imaging and the NIR-I window (700–950 nm). The imaging quality is greatly improved due to low self-fluorescence and reduced scattering [18,19,20].
In this paper, the core–shell lanthanide-doped nanoparticles are designed as multi-mode NIR nanothermometers, and their applicability in temperature sensing applications is demonstrated. Compared with 980 nm, 808 nm excitation is more difficult to be scattered and absorbed by water in tumor tissues, and NIR emission involves the NIR-II window and NIR-I window [21,22,23]. Therefore, by using the two windows, not only multi-mode optical temperature measurement of tissues at different depths can be realized, but they also can be applied for deep biological NIR tissue imaging. Nanoparticles possess two optical properties, temperature-dependent thermal coupling energy level and phonon-assisted thermal sensitivity fluctuation [24,25,26]. These optical properties make Nd3+/Yb3+/Er3+-doped Ba2LuF7 nanocrystals have the potential to work in biological tissues as ratio optical thermometers. Their maximum thermal sensitivity is 0.63% K−1, which is superior to some lanthanide-doped fluoride nanoparticles and quantum dot materials, as shown in Table S1 [27,28,29]. The nanocrystals have certain absorptivity and reflectance for NIR excitation sources, as shown in Figure S1. At the same time, multiple thermal coupled energy levels can be obtained in a single probe by observing emissions in different regions and selecting different emission ratios, to realize multi-mode temperature measurement [30,31]. The novelty of this work lies in the realization of multi-mode optical temperature measurement using different NIR windows and taking into account the imaging of biological windows, which provides new support for the application of the lanthanide-doping nano platform in tumor detection and treatment.
2. Materials and Methods
2.1. Sample Fabrication
Nanocrystals with the nominal chemical formula of Ba2Lu1-x-yF7: zEr3+/yYb3+ xNd3+ were prepared from trifluoroacetate materials. The values of x, y, and z are 0.03, 0.24, and 0.03, respectively. The precursor of lanthanide trifluoroacetic acid was prepared from the corresponding lanthanide and BaCO3 and trifluoroacetic acid (99%). The raw materials were composed of Lu2O3, BaCO3, Er2O3, Nd2O3, Yb2O3, and La2O3. The purity of the above oxides is 99.99%. The nanomaterials were fabricated by thermal decomposition. In the case of the Ba2LuF7: 3%Nd3+, 24%Yb3+, 3%Er3+ triple-doped samples, 0.015 mmol of Er2O3, 0.35 mmol of Lu2O3, 0.12 mmol of Yb2O3, and 0.015 mmol of Nd2O3 were dissolved to transparency in 10 mL trifluoroacetic acid solution, where the concentration of the trifluoroacetic acid solution was 50% at 105 °C. The temperature rose to 120 °C and slowly evaporated the remaining water and acid until it left a dry solid. After that, the trifluoroacetate was mixed with 11 mL octadecene and 7 mL oleic acid in a three-necked flask. The purity of oleic acid and octadecene here is 90%. The solution was heated to 130 °C in a nitrogen-filled flask and stirred quickly for 90 min to remove the remaining oxygen and water. It was then heated to 300 °C under dry nitrogen at 10 °C/min and kept at this temperature for 2 h. All the above chemical materials were obtained from Aladdin in Shanghai.
2.2. Characterization of Sample
The X-ray diffraction (XRD) data were collected by X-ray diffractometer (D2 PHASER, Bruker, Germany) with Cu-Kα (1.5406 Å) radiation. The elemental composition of nanocrystals was investigated by X-ray photoelectron spectroscopic analysis (XPS, K-Alpha, Thermo Scientific, WWLP, USA). The surface morphology and particle size distribution of nanocrystals were recorded by a transmission electron microscope (TEM, Tecnai G2 F20, FEI, OR, USA). The optical temperature measurement platform built by us not only recorded the temperature detection performance of the prepared nanocrystals but also evaluated their photothermal performance. The fluorescence spectrophotometer type QM8075-11(HORIBA, Japan) was used to record the photoluminescence spectra of nanomaterials. The ultraviolet absorption spectrum and Fourier transform infrared spectrum of nanoparticles were obtained by an ultraviolet spectrophotometer (UV-3600, SHIMADZU, Japan) and a Fourier transform infrared spectrometer (iS50, Nicolet, WI, USA), respectively. The NIR imaging of nanoparticles was performed by a NIR camera in a dark chamber (3200 OV1080P, Angeleyes, ShengZhen, China). In the absence of additional instructions, the above experiments were carried out at room temperature.
3. Results and Discussion
3.1. Phase Structure and Morphology of Ba2LuF7@Ba2LaF7 Nanoparticles
The morphology and size of the compound were measured by transmission electron microscope (TEM). As demonstrated in Figure 1a,b, the Ba2LuF7@Ba2LaF7 nanocrystals were composed of a large number of cubic phase nanoparticles, about 10 nanometers in length. Figure 1a–c show the morphological characterization of nanocrystals at different scales. Based on 100 nanoparticles, Figure 1d also reveals that synthesized Ba2LuF7@Ba2LaF7 nanoparticles were uniformly sized with mean particle sizes of 10 ± 2 nm. Moreover, the structure of the synthesized nanocrystals was confirmed by X-ray diffraction (XRD) in Figure 1e. According to the half-width of the three strongest diffraction peaks of the XRD pattern, the average diameter of the nanoparticles was about 12.7 nm, which was calculated by the Debye–Scherrer formula. The calculated results were found to be close to the TEM analysis. The XRD patterns for the synthesized Ba2LuF7@Ba2LaF7 nanoparticles (Figure 1a) confirmed that the samples are crystalline with the diffraction peaks indexed to Ba2LaF7 (PDF # 49-0099). The diffraction peak of the Ba2LuF7@Ba2LaF7 nanoparticles was slightly offset from the Ba2LaF7 (PDF # 49-0099), which was due to the substitution of La3+ ions by Lu3+ ions in the lattice position, forming the cubic phase Ba2LuF7. For the sake of deeply comprehending the impact of the Yb3+/Nd3+/Er3+ ions doping on the crystal structure of the studied samples, the Rietveld refinements of the typical Ba2LuF7: Yb3+/Nd3+/Er3+@Ba2LaF7 nanoparticles based on their XRD data were carried, as depicted in Figure 1f. As expected, these calculated diffraction bands were identical to those of the experimental data, which implied that the resultant nanoparticles exhibited a pure cubic phase [32]. As shown on the upper right in Figure 1c, the high-resolution TEM image consisted of clear lattice fringes with a spacing of around 0.213 nm.
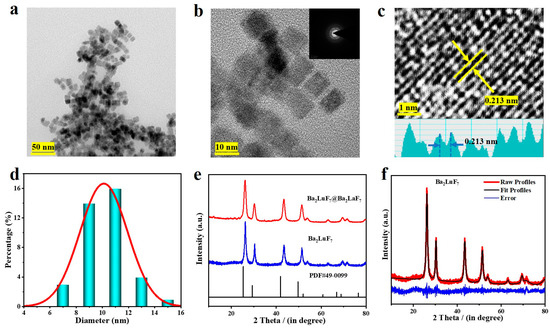
Figure 1.
(a) Morphological characterization of nanocrystals at 50 nm scales was obtained by TEM. (b) Morphological characterization of nanocrystals at 10 nm scales was obtained by TEM. The selective area electron diffraction (SAED) pattern is presented in the illustration on the upper right. (c) The high-resolution TEM (HR-TEM) image of Ba2LuF7@Ba2LaF7. (d) The particle size distribution plot for Ba2LuF7@Ba2LaF7. (e) XRDs of tri-doped Ba2LaF7 and Ba2LuF7@Ba2LaF7 nanocrystals were compared with those of standard cards. (f) Rietveld XRD refinement for Ba2LuF7@Ba2LaF7 nanocrystals.
3.2. XPS Analysis of Ba2LuF7 and Ba2LuF7@Ba2LaF7 Nanoparticles
The chemical composition and electronics state information of Ba2LuF7 and Ba2LuF7@Ba2LaF7 nanoparticles were investigated by X-ray photoelectron spectroscopic (XPS) analysis. Figure S2a,b describe the recorded XPS spectra of Ba2LuF7 and Ba2LuF7@Ba2LaF7 nanoparticles, respectively. In addition, these XPS survey spectrum peaks verified the presence of Ba, Lu, La, and F aspects. Additionally, the C1s peak located at a binding energy of 285 eV might be due to the XPS instrument’s adventitious hydrocarbon. In Figure S2c, The Ba 3d deconvoluted spectrum shows the binding energy peak, and 780 eV for Ba 3d spin-orbit components is fairly similar to the theoretical value of Ba2+. Figure S2d–f core level spectra show the peaks on La 3d, Lu 4d, and F 1s at 836, 198, and 684 eV, respectively [33]. This proved the existence of Ba2LuF7 and Ba2LaF7. Therefore, the XPS studies confirmed that Ba2LuF7@Ba2LaF7 nanoparticles were obtained without foreign contaminants.
3.3. Photoluminescence Properties of Nanoparticles
We investigated the near-infrared upconversion photoluminescence properties of the Ba2LuF7: Nd3+ /Er3+/ Yb3+ system based on the spectral data of the nanoparticle system. The photoemission spectrum of the prepared tri-doped Ba2LuF7 nanoparticles under 808 nm photoexcitation is shown in Figure 2a. The curve shown in Figure 2a shows that the upconversion emission performance of all samples is consistent with the reported performance. It consists of four strong peaks triggered by the Yb3+/Er3+/Nd3+ transition, and the central wavelengths are 974 nm, 1052 nm, 1321 nm, and 1527 nm, respectively. These transitions are reported to correspond to the 2F5/2→2F7/2 transition of the Yb3+ ion. This proves that Yb3+: 2F5/2 level populations can be reached from Nd3+ ions to Yb3+ ions through phonon-assisted energy transfer (PAET) [34,35]. Furthermore, the PAET process between Er3+ and Yb3+ can be viewed as a 4I13/2→4I15/2 transition, because the emission of Er3+ can also be found in the fluorescence spectrum of tri-doped Ba2LuF7 nanoparticles. In addition, the emission of Ba2LuF7: Yb3+/Nd3+/Er3+ (1052 nm and 1321 nm) in the near-infrared region matches the 4F3/2→4F11/2 and 4F3/2→4I13/2 transitions of Nd3+ ions [36,37]. Finally, the transitions of Yb3+, Nd3+, and Er3+ marked in Figure 2c are distributed in the NIR region of NIR-I, NIR-II, and NIR-III.
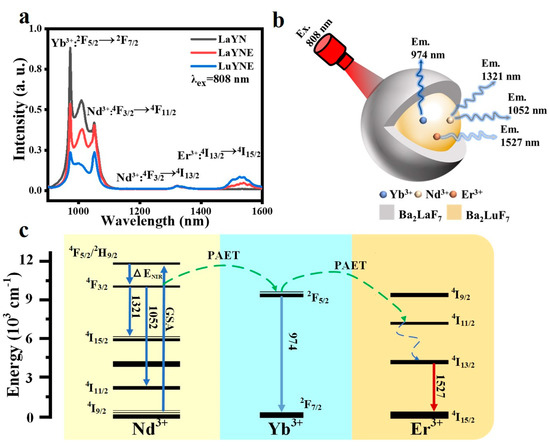
Figure 2.
(a) The emission spectra of Yb3+/Nd3+ and Yb3+/Er3+/Nd3+ codoped Ba2LaF7 and Ba2LuF7 nanoparticles, and the excitation light source wavelength is 808 nm. (b) Schematic illustration of the luminescent nanoparticles excited by 808 nm laser. (c) General energy level diagram of Er3+, Yb3+, and Nd3+ ions.
In addition, it was found that both green and red upconversion emission intensities were sharply increased by enhancing the excitation optical power, and that the slopes of the emission peaks obtained by linear fitting were 1.213, 1.166, and 1.160, respectively.
Figure S3a,b show that these transitions correspond to two photons, which is beneficial in reducing the energy loss caused by scattered light, thus facilitating fluorescence imaging [38]. Similarly, the same pattern applies to launches located at NIR-I and NIR-II. Notably, the coating of a Ba2LaF7 shell onto Ba2LuF7: Yb3+/Nd3+/Er3+ nanoparticles enhanced the upconversion luminescence intensity 3.5-fold (Figure S3c,d). These results suggest that Ba2LaF7 shell passivation can effectively mitigate the quenching of trapped upconversion luminescence on nanocrystal surfaces.
3.4. Sensitivity of Ratiometric Thermometry for Nanoparticles
The upconversion emission spectra of nanoparticles prepared in this study were fitted as temperature-dependent functions to verify their feasibility as optical thermometers under the premise of temperature control in the 308–528 K range. As disclosed in Figure 3a, the upconversion emission intensity of Ba2LuF7: Yb3+/Nd3+/Er3+ nanoparticles depends on temperature. Figure 3a specifically shows that the upconversion emission intensity corresponding to the Nd3+ ion shows an opposite trend with the increase in temperature, which is triggered by the thermal quenching effect, according to common reports. However, from the integrated upconversion intensities spectral curve at different room temperatures (Figure 3b), the emission intensity of the 2F5/2→2F7/2 transition increases slowly compared with that of the 4F3/2→4F11/2 transition due to the phonon auxiliary heat of the Nd3+ phonon. After it is verified that the FIR values of the two kinds of emissions depend on temperature, it can be predicted that the nanoparticles prepared in this work have the potential to be used in optical temperature sensors. Compared with the thermal coupling energy levels of 540 and 521 nm in Figure S3, the corresponding energy level emissions of 974 and 1052 nm also accord with the Boltzmann factor to control the thermal balance, which can be described as the following:

Figure 3.
(a) Photoluminescence spectra curve of the Ba2LuF7: Yb3+/Nd3+/Er3+ nanoparticles covering 308–528 K temperature range. Integrated upconversion intensities at 974 nm and 1052 nm. (b) Temperature dependence of the fluorescence ratio values of thermally coupled energy levels. (c) Ln(FIR) is an inverse absolute function of absolute temperature. (d) The temperature function of the thermal coupling level of nanomaterials based on the fitting of Sa and Sr values.
K and T correspond to the Boltzmann constant and Kelvin scale temperature, respectively; C, as a constant, is related to the choice of the main material; is determined by the energy gap between the 4F3/2 and 2F5/2 states. As disclosed in Figure 3b, the relative value of I1052 weakened steadily. Meanwhile, the decline of I1052 exceeds that of I974. I974/I1052 reveals an escalating trend from 0.88775 to 2.12769, because the downward trends in I974 and I1052 were different.
The absolute temperature (1/T) and ln(I974/I1052) were linearly fitted according to Equation (1). This is an inverse curve with a regression coefficient (R2) of 0.99829, and all points could pass through the fitting line, as disclosed in Figure 3c. The relevant parameters of the fitted curve are −0.06535 and 2.0198, respectively, corresponding to the slope and intercept. The fitting curve of Ln(I974/I1052) and 1/T has a good linear trend in the temperature range of 308 K to 528 K.
As an important index to measure optical temperature sensitivity, Sa represents absolute sensitivity and Sr represents relative sensitivity. The value of Sa can be calculated by the following formula:
Figure 3d shows the function curve of Sa and Sr from 308 to 548 K concerning temperature. Since the slope and intercept of the fitted line were obtained in Figure 3c, the values of Sr and Sa can be obtained only by substituting them into Equations (3) and (2). As disclosed in the figure, due to the influence of the auxiliary heat of the Nd3+ ion phonon, the greatest Sa first occurs when the curve is at 368 K, which is 0.50% K−1, and then it gradually decreases as the temperature goes up. When the temperature goes up, Sr decreases gradually. At this point, the greatest value is 0.63% K−1 at 308 K.
As an important parameter to measure the performance of optical thermometers, the relative temperature can be calculated by the following formula:
Because a certain amount of Nd3+ ions were added into the prepared Yb3+/Er3+ nanocrystals in this work, a new emission peak in the near-infrared region of the excitation spectrum could be observed. The nanocrystals were exposed to an 808 nm light source. For instance, the peak of the spectrum at 1321 nm is the energy level transition of Nd3+: 4I3/2→4I15/2. It can be understood from the revelation in Figure 4a that the upconversion luminescence intensity declines with the rise in temperature, within the range of 308 ~ 548 K. Similarly, due to the phonon-assisted heat of Er3+ phonons, the emission intensity of the 4I13/4→4I15/2 transition fluctuates with the rise and fall of the experimental temperature. Figure 4b shows a comparison of the luminescence intensity from 308 to 548 K with temperature changes at 1321 nm and 1527 nm wavelengths. As mentioned above, even though the luminescence intensity corresponding to the 1321 nm level declines with the rise in temperature, the luminescence intensity corresponding to the 1527 nm level decays faster under the same conditions. This will cause the FIR value of I1321/I1527 to decline when the temperature rises. It has the greatest FIR of 0.31652 at 308 K and the least FIR of 0.22582 at 548 K.
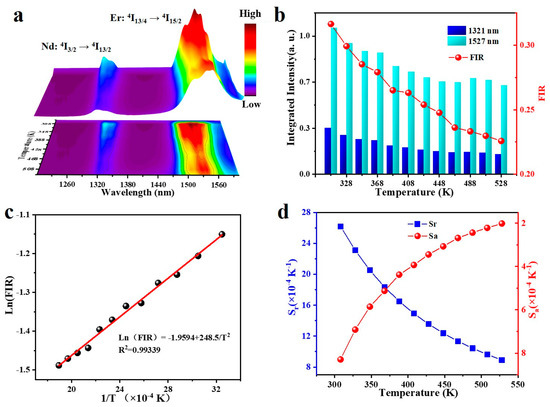
Figure 4.
(a) Photoluminescence emission spectra curve of the Ba2LuF7: Nd3+/Yb3+/Er3+ nanoparticles covering 308–528 K temperature range. Integrated upconversion intensities at 1321 nm and 1527 nm. (b) Temperature dependence of the fluorescence ratio values of thermally coupled energy levels. Dependence of FIR values of the (b) thermally coupled levels on temperature. (c) Ln(FIR) as an inverse absolute function of inverse absolute temperature. (d) The temperature function of the thermal coupling level of nanomaterials based on the fitting of Sa and Sr values. Sa and Sr values are based on the (d) thermally coupled levels as a function of temperature.
As shown in Figure 4c, Ln(FIR) was linearly fitted to 1/T by Equation (1) to obtain a line with R2 = 0.99339. According to the fitting results, the calculated Ln(FIR) value coincides with the fitting line. The relevant parameters of the fitted curve are 0.2465 and −1.9594, respectively. Figure 4d reveals the curve composed of the values of Sa and Sr calculated by substituting them into Equations (2) and (3). In the range of 308 K to 548 K, Sa rose with the rise in temperature, and the greatest value was 0.08% K−1. The variation trend of the Sr value was opposite to that of Sa, and the greatest value was 0.262% K−1.
3.5. Fluorescence Imaging of Nanoparticles in Biological Windows
According to the above data, nanoparticles have the potential to be applied in multi-mode fluorescence temperature measurement, which provides the possibility for the universality of non-contact tissue temperature measurement. As shown in Figure S4, the non-contact optical temperature measurement system simulates biological tissues at different depths by controlling lipid thickness. Nanoparticles are injected into biological tissues. The light received under the excitation of the 808 nm external excitation light source more easily penetrates the NIR region of biological tissues than the visible light spectrometer. The NIR region used by different temperature measurement modes in this work can be found in Figure S5. These thermometric models are based on the energy transfer process between Yb3+/Nd3+/Er3+. Nd3+ ions in the first region and the second region are used as the selector switch to determine the fluorescence ratio temperature measurement for narrowband separation and broad-band separation, respectively. The fluorescence ratio thermometry of mode-two width separation can detect deeper tissues thanks to the excellent penetration of NIR region 2, and the fluorescence ratio thermometry of mode-one narrow separation has higher sensitivity.
NIR window luminescence has low water absorption efficiency and good tissue penetration, which is often used in biological tissue imaging [39,40,41,42]. Taking the two emissions of region 1 and region 2 in mode 1 as an example (Figure 5a), it can be noticed that core–shell nanoparticles in the darkroom under the NIR source glow brightly and clearly in the field of view of the infrared camera (Figure 5b). As shown in Figure 5c, chicken tissues with thicknesses of 2 mm, 4 mm, and 6 mm were selected for imaging. In the image of the 2 mm tissue there are shaded areas, which are attached bone sheets on the back of the biological tissue. This indicates that the NIR emission of nanocrystals has different transmittance to different tissue components, which makes it possible to image foreign bodies in tissues. In 4 mm and 6 mm tissue imaging, more obvious cartilage tissue and ribs can be observed, which further confirms the imaging ability of nanocrystals. In addition, the addition of 12 mm human pinky finger imaging still allows relatively clear observation of bones and joints, indicating the potential of nanocrystals for deep tissue imaging. Furthermore, image quality improvement combined with algorithm image processing can further improve image clarity to achieve auxiliary tumor tissue and blood vessel imaging, which reflects the potential of nanocrystals in fine tissue imaging. Hence, the nanoparticles are injected into mice after being biologically modified to help image specific tissues and organs through the mice’s circulatory system. As for multi-mode fluorescence ratio temperature measurement, the receiving window can be selected according to the depth of the desired imaging location due to the stronger tissue penetration of the NIR second region window. Taken together, these results finally show that our nanocrystals have some possibility for imaging in biological windows.
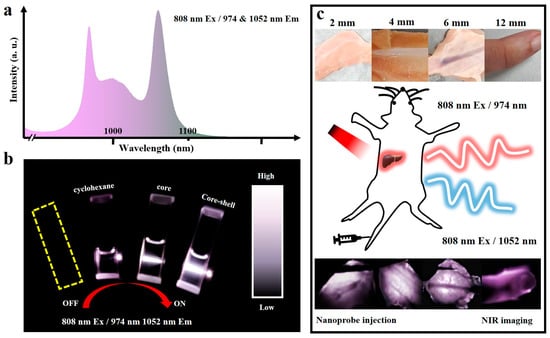
Figure 5.
(a) The selected NIR imaging interval. (b) NIR luminescence of nanoparticles. (c) Schematic of biological tissue imaging of nanoparticles.
4. Conclusions
All in all, we worked on the non-contact multifunctional biological applications of lanthanide-doped nanoparticles based on NIR luminescence. On this basis, the advantages of FIR optical thermometry technology were shown, and the maximum Sr is close to 0.63% K−1 in the range of 308–538 K. The FIR temperature measurement mode can be selected according to the tissue depth of the temperature measurement site. The flexible selection broadens the application scenario and gives broad application prospects in the field of optical thermometry. At the same time, the NIR imaging of the material reveals that the temperature-assisted imaging of the material works well in practical applications. In the end, the lanthanide-doped nanoparticles designed in this paper have potential applications in NIR luminescence-assisted imaging and multi-mode optical temperature measurement of biological tissues.
Supplementary Materials
The following supporting information can be downloaded at: https://www.mdpi.com/article/10.3390/nano13010219/s1, Table S1. Comparison of optical properties of some nanomaterials and their applications in proportional nanothermometers; Figure S1. (a) UV absorption spectra of nanoparticles in cyclohexane. (b) Fourier infrared spectroscopy of nanoparticles; Figure S2. (a,b) XPS survey spectra of the Ba2LuF7: Yb3+/Nd3+/Er3+ and Ba2LuF7: Yb3+/ Nd3+/Er3+@Ba2LaF7 nanoparticles, respectively. And deconvoluted spectra of (c) Ba 3d, (d) La 3d, (e) Lu 4d, and (f) F 1s region of Ba2LuF7@Ba2LaF7; Figure S3. (a) Upconversion luminescence spectra in visible regions of nanocrystals excited at different power densities of 980 nm. (b) The relationship between emission intensity and excitation power. (c,d) Comparison of upconversion luminescence intensity between core and core-shell nanoparticles; Figure S4. Diagram of the non-contact temperature measuring system; Figure S5. Schematic diagram of multi-mode temperature measurement principle.
Author Contributions
Conceptualization, methodology, software, validation, formal analysis, investigation, visualization, writing—original draft preparation, H.L.; writing—reviewing and editing, G.B., E.H., Y.L., H.X., S.X. and L.C.; project administration, resources, supervision, G.B. All authors have read and agreed to the published version of the manuscript.
Funding
This work was funded by the Zhejiang Provincial Natural Science Foundation of China (LZ21E020004) and the National Natural Science Foundation of China (6217032304).
Acknowledgments
This work was supported by the Zhejiang Provincial Natural Science Foundation of China (LZ21E020004) and the National Natural Science Foundation of China (6217032304).
Conflicts of Interest
The authors declare no conflict of interest.
References
- Zheng, B.; Fan, J.; Chen, B.; Qin, X.; Wang, J.; Wang, F.; Deng, R.; Liu, X. Rare-earth doping in nanostructured inorganic materials. Chem. Rev. 2022, 122, 5519–5603. [Google Scholar] [CrossRef]
- An, R.; Liang, Y.; Deng, R.; Lei, P.; Zhang, H. Hollow nanoparticles synthesized via Ostwald ripening and their upconversion luminescence-mediated Boltzmann thermometry over a wide temperature range. Light Sci. Appl. 2022, 11, 217. [Google Scholar] [CrossRef] [PubMed]
- Otari, S.V.; Kumar, M.; Anwar, M.Z.; Thorat, N.D.; Patel, S.K.; Lee, D.; Lee, J.H.; Lee, J.K.; Kang, Y.C.; Zhang, L. Rapid synthesis and decoration of reduced graphene oxide with gold nanoparticles by thermostable peptides for memory device and photothermal applications. Sci. Rep. 2017, 7, 10980. [Google Scholar] [CrossRef] [PubMed]
- Zhou, B.; Shi, B.; Jin, D.; Liu, X. Controlling upconversion nanocrystals for emerging applications. Nat. Nanotechnol. 2015, 10, 924–936. [Google Scholar] [CrossRef] [PubMed]
- Du, P.; Tang, J.; Li, W.; Luo, L. Exploiting the diverse photoluminescence behaviors of NaLuF4: xEu3+ nanoparticles and g-C3N4 to realize versatile applications in white light-emitting diode and optical thermometer. Chem. Eng. J. 2021, 406, 127165. [Google Scholar] [CrossRef]
- Jia, M.; Chen, X.; Sun, R.; Wu, D.; Li, X.; Shi, Z.; Chen, G.; Shan, C. Lanthanide-based ratiometric luminescence nanothermometry. Nano Res. 2022. [Google Scholar] [CrossRef]
- Sun, Z.; Jia, M.; Wei, Y.; Cheng, J.; Sheng, T.; Fu, Z. Constructing new thermally coupled levels based on different emitting centers for high sensitive optical thermometer. Chem. Eng. J. 2020, 381, 122654. [Google Scholar] [CrossRef]
- Xue, J.; Yu, Z.; Noh, H.M.; Lee, B.R.; Choi, B.C.; Park, S.H.; Jeong, J.H.; Du, P.; Song, M. Designing multi-mode optical thermometers via the thermochromic LaNbO4: Bi3+/Ln3+ (Ln = Eu, Tb, Dy, Sm) phosphors. Chem. Eng. J. 2021, 415, 128977. [Google Scholar] [CrossRef]
- Gupta, C.; Pauzauskie, P.J. Semiconductor yields sensitive thermometry. Nat. Photonics 2022, 16, 407–408. [Google Scholar] [CrossRef]
- Ansari, A.A.; Parchur, A.K.; Nazeeruddin, M.K.; Tavakoli, M.M. Coord. Luminescent lanthanide nanocomposites in thermometry: Chemistry of dopant ions and host matrices. Chem. Rev. 2021, 444, 214040. [Google Scholar]
- Kondaveeti, S.; Park, G.D.; Shanmugam, R.; Pagolu, R.; Patel, S.K.; Bisht, A.; Kim, D.R.; Kang, Y.C.; Lee, J.K. Investigating the role of metals loaded on nitrogen-doped carbon-nanotube electrodes in electroenzymatic alcohol dehydrogenation. Appl. Catal. B 2022, 307, 121195. [Google Scholar] [CrossRef]
- Chen, X.; Liu, S.; Huang, K.; Nie, J.; Kang, R.; Tian, X.; Zhang, S.; Li, Y.; Qiu, J. Cr4+ activated NIR-NIR multi-mode luminescent nanothermometer for double biological windows. J. Chem. Eng. J. 2020, 396, 125201. [Google Scholar] [CrossRef]
- Wang, Z.; Jia, M.; Zhang, M.; Jin, X.; Xu, H.; Fu, Z. Trimodal Ratiometric Luminescent Thermometer Covering Three Near-Infrared Transparency Windows. Inorg. Chem. 2021, 60, 14944–14951. [Google Scholar] [CrossRef]
- Xie, Y.; Song, Y.; Sun, G.; Hu, P.; Bednarkiewicz, A.; Sun, L. Lanthanide-doped heterostructured nanocomposites toward advanced optical anti-counterfeiting and information storage. Light Sci. Appl. 2022, 11, 150. [Google Scholar] [CrossRef]
- Wang, F.; Deng, R.; Wang, J.; Wang, Q.; Han, Y.; Zhu, H.; Chen, X.; Liu, X. Tuning upconversion through energy migration in core–shell nanoparticles. Nat. Mater. 2011, 10, 968–973. [Google Scholar] [CrossRef] [PubMed]
- Li, H.; Wang, X.; Ohulchanskyy, T.Y.; Chen, G. Lanthanide-doped near-infrared nanoparticles for biophotonics. Adv. Mater. 2021, 33, 2000678. [Google Scholar] [CrossRef]
- Min, X.; Sun, Y.; Kong, L.; Guan, M.; Fang, M.; Liu, Y.G.; Wu, X.; Huang, Z. Novel pyrochlore-type La2Zr2O7: Eu3+ red phosphors: Synthesis, structural, luminescence properties and theoretical calculation. Dyes Pigm. 2018, 157, 47–54. [Google Scholar] [CrossRef]
- Zheng, S.; Zhang, Z.; Qu, Y.; Zhang, X.; Guo, H.; Shi, X.; Cai, M.; Cao, C.; Hu, Z.; Liu, H.; et al. Radiopharmaceuticals and Fluorescein Sodium Mediated Triple-Modality Molecular Imaging Allows Precise Image-Guided Tumor Surgery. Adv. Sci. 2019, 6, 1900159. [Google Scholar] [CrossRef]
- Nexha, A.; Carvajal, J.J.; Pujol, M.C.; Díaz, F.; Aguiló, M. Lanthanide doped luminescence nanothermometers in the biological windows: Strategies and applications. Nanoscale 2021, 13, 7913–7987. [Google Scholar] [CrossRef]
- Yang, J.; He, S.; Hu, Z.; Zhang, Z.; Cao, C.; Cheng, Z.; Fang, C.; Tian, J. In vivo multifunctional fluorescence imaging using liposome-coated lanthanide nanoparticles in near-infrared-II/IIa/IIb windows. Nano Today 2021, 38, 101120. [Google Scholar] [CrossRef]
- Zhou, T.; Cheng, Q.; Zhang, L.; Zhang, D.; Li, L.; Jiang, T.; Huang, L.; Xu, H.; Hu, M.; Jing, S. Ferrocene-functionalized core–shell lanthanide-doped upconversion nanoparticles: NIR light promoted chemodynamic therapy and luminescence imaging of solid tumors. Chem. Eng. J. 2022, 438, 135637. [Google Scholar] [CrossRef]
- Fan, Y.; Liu, L.; Zhang, F. Exploiting lanthanide-doped upconversion nanoparticles with core/shell structures. Nano Today 2019, 25, 68–84. [Google Scholar] [CrossRef]
- Ding, M.; Dong, B.; Lu, Y.; Yang, X.; Yuan, Y.; Bai, W.; Wu, S.; Ji, Z.; Lu, C.; Zhang, K.; et al. Energy manipulation in lanthanide-doped core–shell nanoparticles for tunable dual-mode luminescence toward advanced anti-counterfeiting. Adv. Mater. 2020, 32, 2002121. [Google Scholar] [CrossRef] [PubMed]
- Kaczmarek, A.M.; Suta, M.; Rijckaert, H.; Van Swieten, T.P.; Van Driessche, I.; Kaczmarek, M.K.; Meijerink, A. High temperature (nano) thermometers based on LiLuF4: Er3+, Yb3+ nano-and microcrystals. Confounded results for core–shell nanocrystals. J. Mater. Chem. C 2021, 9, 3589–3600. [Google Scholar] [CrossRef]
- Geitenbeek, R.G.; Salzmann, B.B.; Nieuwelink, A.E.; Meijerink, A.; Weckhuysen, B.M. Operando nanoscale sensors in catalysis: All eyes on catalyst particles. Chem. Eng. Sci. 2019, 198, 235–240. [Google Scholar] [CrossRef]
- Zhou, Y.; Cheng, Y.; Huang, Q.; Xu, J.; Lin, H.; Wang, Y. Abnormal thermally enhanced upconversion luminescence of lanthanide-doped phosphors: Proposed mechanisms and potential applications. J. Mater. Chem. C 2021, 9, 2220–2230. [Google Scholar] [CrossRef]
- Zhao, H.; Vomiero, A.; Rosei, F. Tailoring the heterostructure of colloidal quantum dots for ratiometric optical nanothermometry. Small 2020, 16, 2000804. [Google Scholar] [CrossRef]
- Haro-González, P.; Martínez-Maestro, L.; Martín, I.R.; García-Solé, J.; Jaque, D. High-sensitivity fluorescence lifetime thermal sensing based on CdTe quantum dots. Small 2012, 8, 2652–2658. [Google Scholar] [CrossRef]
- Lei, P.; An, R.; Li, C.; Feng, J.; Zhang, H. Lanthanide-doped bismuth-based fluoride nanoparticles: Controlled synthesis and ratiometric temperature sensing. CrystEngComm 2020, 22, 3432–3438. [Google Scholar] [CrossRef]
- Zhao, Y.; Bai, G.; Huang, Y.; Liu, Y.; Peng, D.; Chen, L.; Xu, S. Stimuli responsive lanthanide ions doped layered piezophotonic microcrystals for optical multifunctional sensing applications. Nano Energy 2021, 87, 106177. [Google Scholar] [CrossRef]
- Pu, L.; Wang, Y.; Zhao, J.; Jin, M.; Li, L.; Li, P.; Wang, Z.; Guo, C.; Suo, H. Multi-mode ratiometric thermometry using thermo-intensified NIR emission. Chem. Eng. J. 2022, 449, 137890. [Google Scholar] [CrossRef]
- Maurizio, S.L.; Tessitore, G.; Krämer, K.W.; Capobianco, J.A. BaYF5: Yb3+, Tm3+ upconverting nanoparticles with improved population of the visible and near-infrared emitting states: Implications for bioimaging. ACS Appl. Nano Mater. 2021, 4, 5301–5308. [Google Scholar] [CrossRef]
- Yu, X.; Lu, K.; Chen, L. Synergistic effects of oxygen vacancies and the chelation of tetracycline with metallic ions for enhanced degradation of tetracycline over photocatalysts La2−x KxNiMnO6. CrystEngComm 2021, 23, 1455–1471. [Google Scholar] [CrossRef]
- Kolesnikov, I.E.; Afanaseva, E.V.; Kurochkin, M.A.; Vaishlia, E.I.; Kalinichev, A.A. Upconverting NIR-to-NIR LuVO4: Nd3+/Yb3+ Nanophosphors for High-Sensitivity Optical Thermometry. ACS Appl. Mater. Interfaces 2022, 14, 1757–1764. [Google Scholar] [CrossRef] [PubMed]
- Yu, D.; Yu, T.; van Bunningen, A.J.; Zhang, Q.; Meijerink, A.; Rabouw, F.T. Understanding and tuning blue-to-near-infrared photon cutting by the Tm3+/Yb3+ couple. Light Sci. Appl. 2020, 9, 107. [Google Scholar] [CrossRef] [PubMed]
- Marciniak, L.; Piotrowski, W.M.; Drozd, M.; Kinzhybalo, V.; Bednarkiewicz, A.; Dramicanin, M. Activators Lattice Migration Strategy Customized for Tunable Luminescence of Ce3+ Doped β-Ca3 (PO4)2. Adv. Opt. Mater. 2022, 10, 2102856. [Google Scholar] [CrossRef]
- Yuliantini, L.; Djamal, M.; Hidayat, R.; Boonin, K.; Kaewkhao, J.; Yasaka, P. Luminescence and Judd-Ofelt analysis of Nd3+ ion doped oxyfluoride boro-tellurite glass for near-infrared laser application. Mater. Today Proc. 2021, 43, 2655–2662. [Google Scholar] [CrossRef]
- Janiak, F.K.; Bartel, P.; Bale, M.R.; Yoshimatsu, T.; Komulainen, E.; Zhou, M.; Staras, K.; Prieto-Godino, L.L.; Euler, T.; Maravall, M.; et al. Non-telecentric two-photon microscopy for 3D random access mesoscale imaging. Nat. Commun. 2022, 13, 544. [Google Scholar] [CrossRef]
- Lin, H.; Lin, Z.; Zheng, K.; Wang, C.; Lin, L.; Chen, J.; Song, J. Near-Infrared-II Nanomaterials for Fluorescence Imaging and Photodynamic Therapy. Adv. Opt. Mater. 2021, 9, 2002177. [Google Scholar] [CrossRef]
- Ding, F.; Feng, J.; Zhang, X.; Sun, J.; Fan, C.; Ge, Z. Responsive optical probes for deep-tissue imaging: Photoacoustics and second near-infrared fluorescence. Adv. Drug Deliv. Rev. 2021, 173, 141–163. [Google Scholar] [CrossRef]
- Pei, P.; Chen, Y.; Sun, C.; Fan, Y.; Yang, Y.; Liu, X.; Lu, L.; Zhao, M.; Zhang, H.; Zhao, D.; et al. X-ray-activated persistent luminescence nanomaterials for NIR-II imaging. Nat. Nanotechnol. 2021, 16, 1011–1018. [Google Scholar] [CrossRef] [PubMed]
- Lv, Z.; Jin, L.; Cao, Y.; Zhang, H.; Xue, D.; Yin, N.; Zhang, T.; Wang, Y.; Liu, J.; Liu, X.; et al. A nanotheranostic agent based on Nd3+-doped YVO4 with blood-brain-barrier permeability for NIR-II fluorescence imaging/magnetic resonance imaging and boosted sonodynamic therapy of orthotopic glioma. Light Sci. Appl. 2022, 11, 1–10. [Google Scholar] [CrossRef] [PubMed]
Disclaimer/Publisher’s Note: The statements, opinions and data contained in all publications are solely those of the individual author(s) and contributor(s) and not of MDPI and/or the editor(s). MDPI and/or the editor(s) disclaim responsibility for any injury to people or property resulting from any ideas, methods, instructions or products referred to in the content. |
© 2023 by the authors. Licensee MDPI, Basel, Switzerland. This article is an open access article distributed under the terms and conditions of the Creative Commons Attribution (CC BY) license (https://creativecommons.org/licenses/by/4.0/).