Complex Nanowrinkling in Chiral Liquid Crystal Surfaces: From Shaping Mechanisms to Geometric Statistics


Abstract
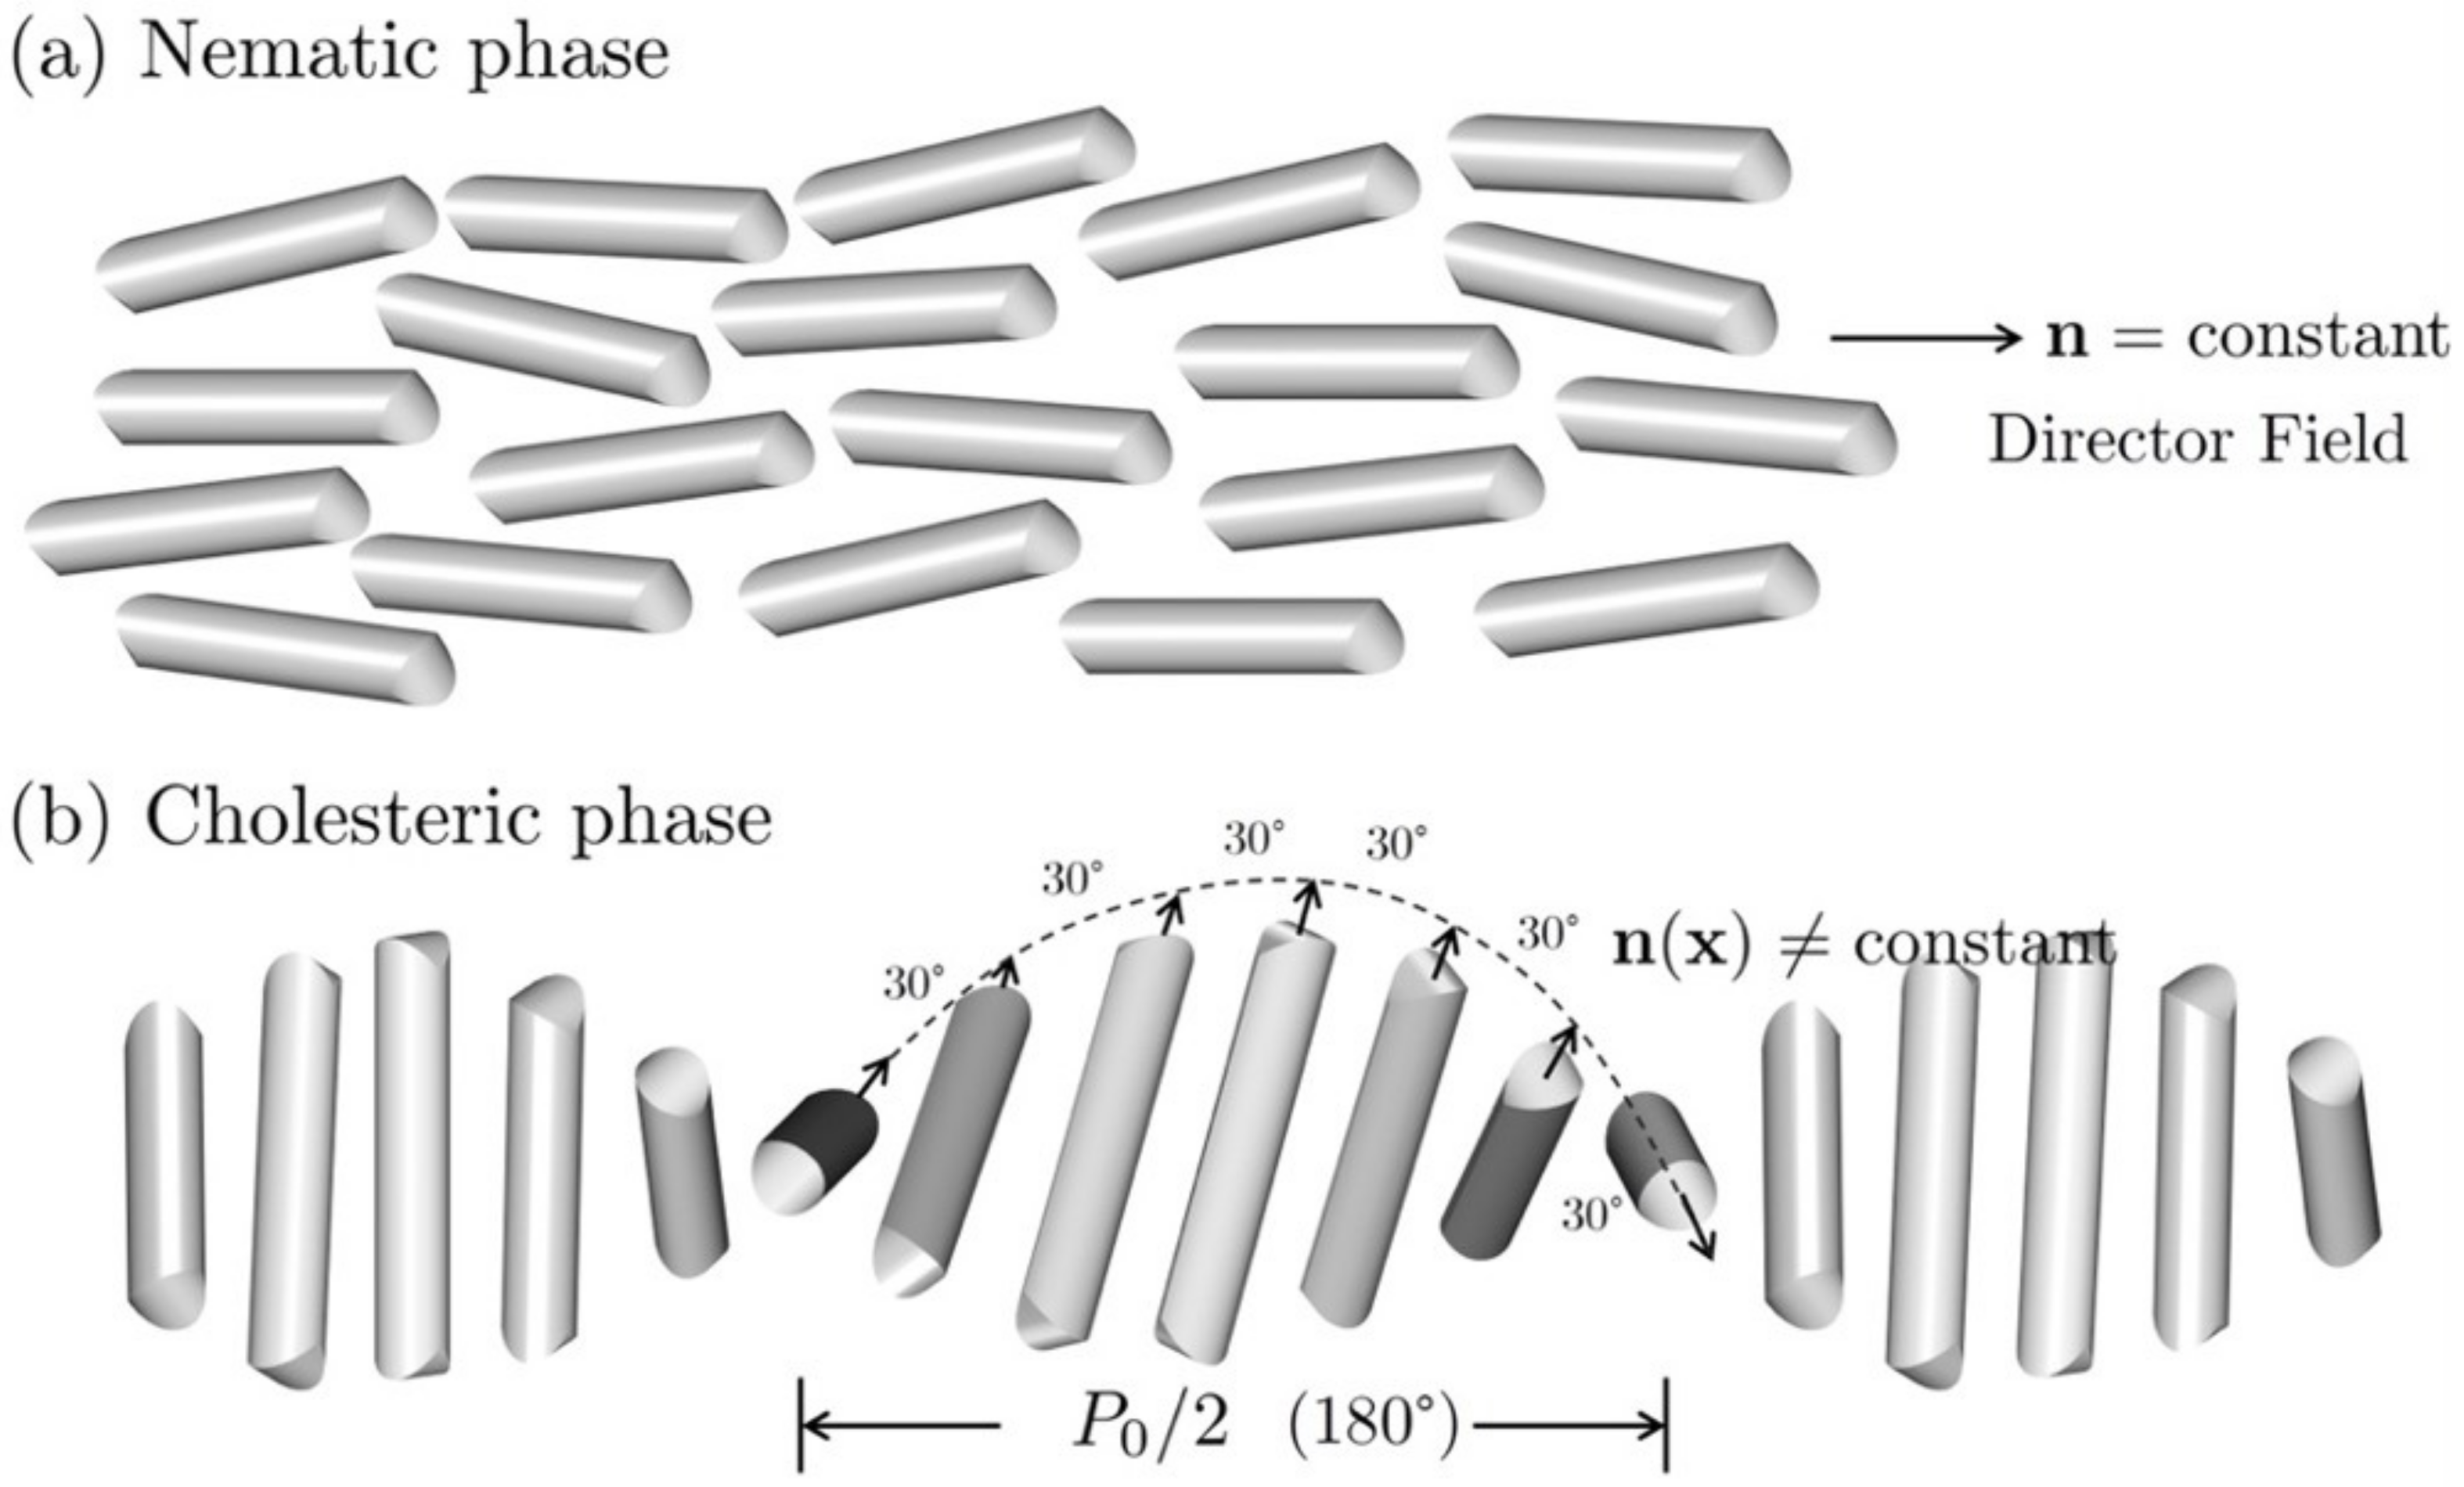
1. Introduction
- 1
- The dimensionless anisotropic-to-isotropic interfacial tension anchoring coefficient ratio (r) transforms orientation features into geometric surface features [48]. If r is relatively small, material orientation scales of the order microns generate surface nanowrinkling, otherwise submicron or micron features will arise;
- 2
2. Theory and Model Formulation
2.1. Surface Energy and Elastic Deformation
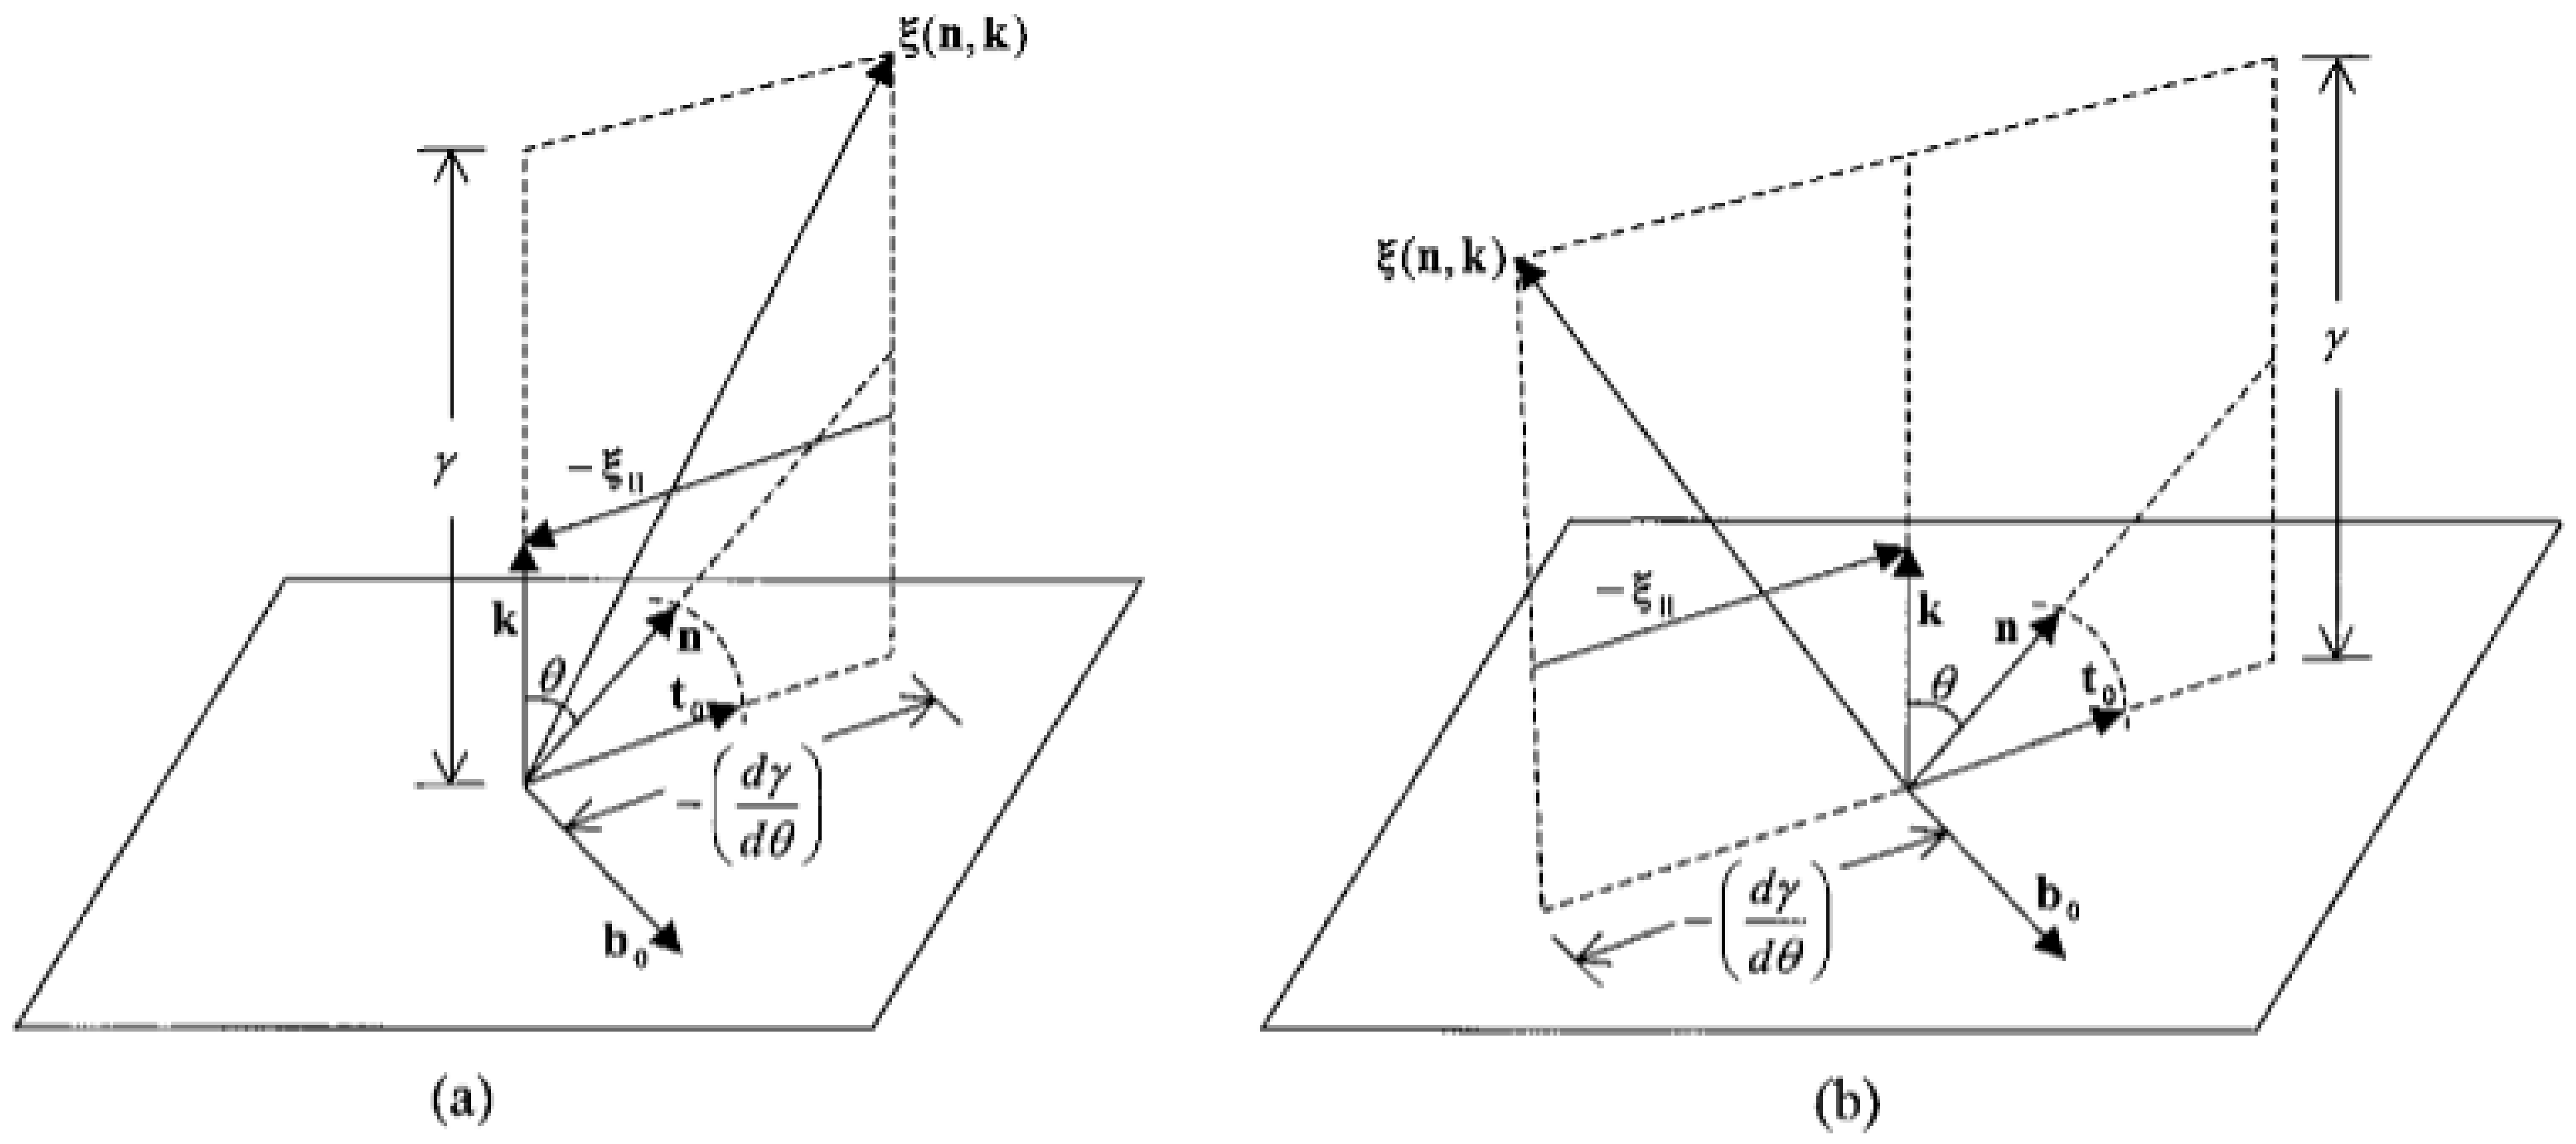
2.2. Cahn–Hoffman Capillary Vector Method
2.3. Linear Approximation
- (1)
- uniaxial egg carton modes: or ;
- (2)
- equibiaxial egg carton modes: and ;
- (3)
- biaxial egg carton modes: and .
3. Results and Discussion
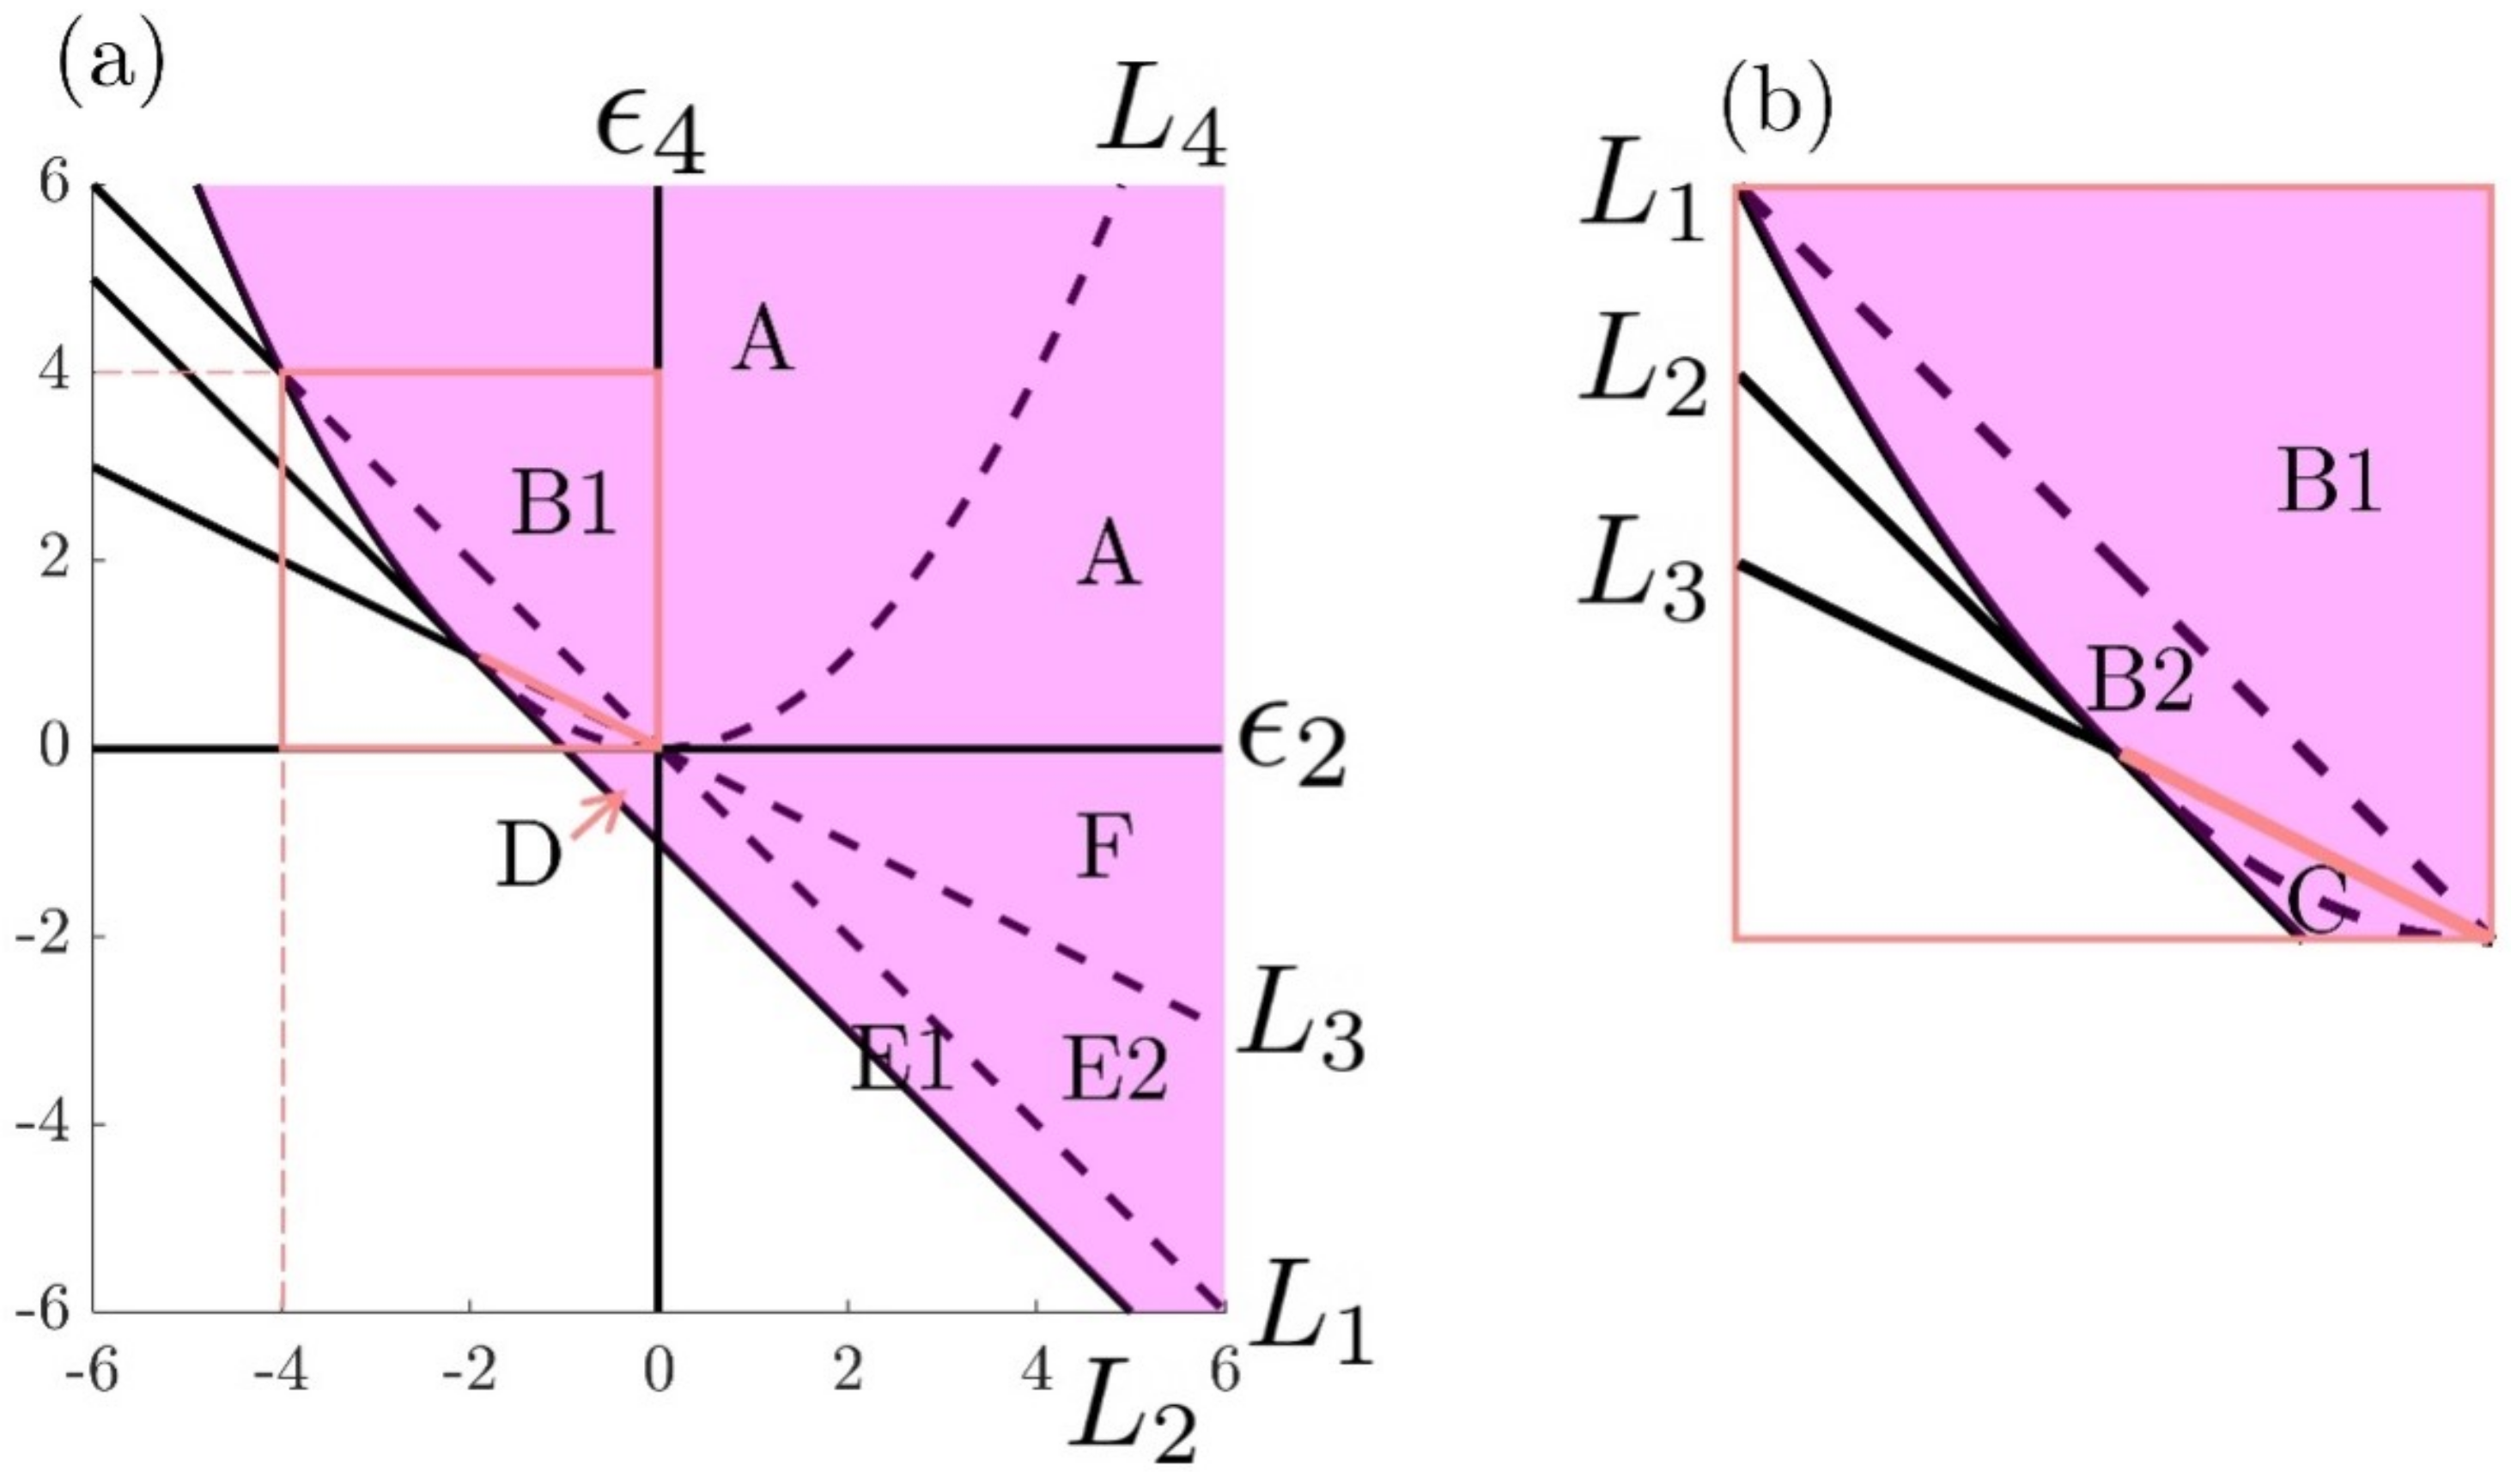
3.1. Parametric Space and Numerical Methods
3.2. Surface Profile
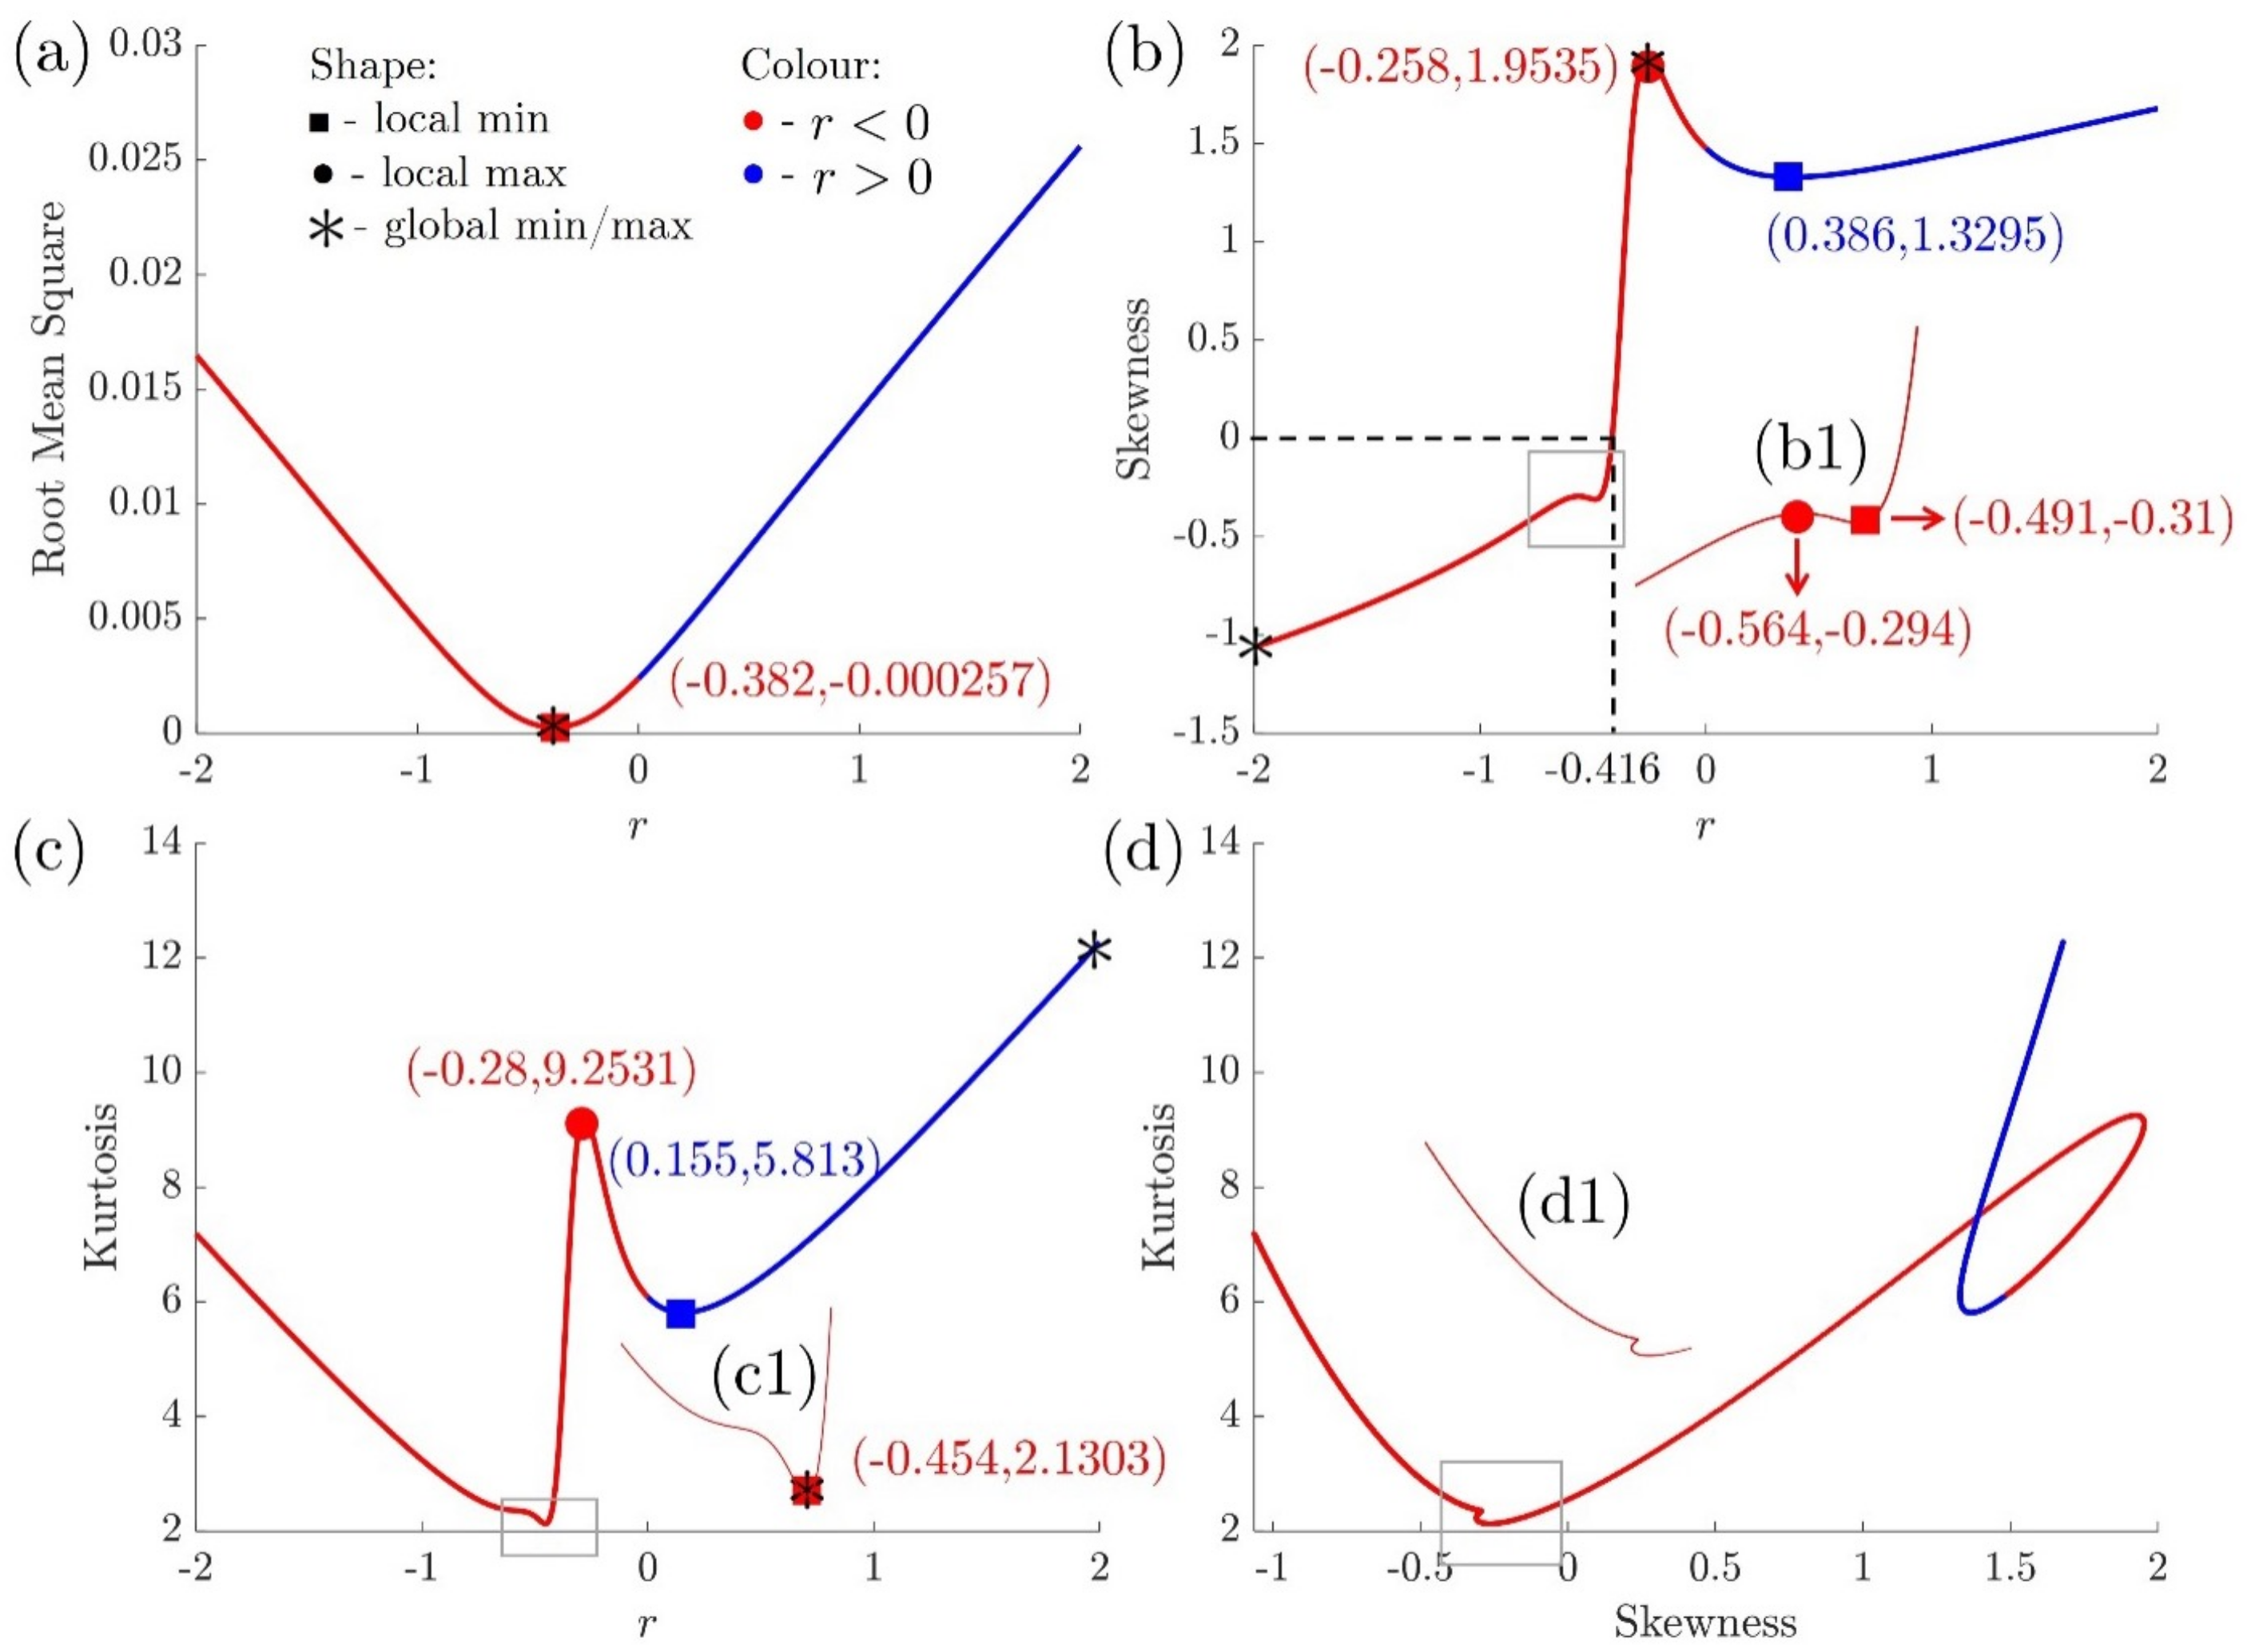
3.3. Skewness and Kurtosis
4. Applications: Pathways to Targeted Surface Roughness Metrics
5. Conclusions
Author Contributions
Funding
Institutional Review Board Statement
Informed Consent Statement
Data Availability Statement
Conflicts of Interest
Abbreviations
| Ssk | Surface skewness |
| Sku | Surface kurtosis |
Appendix A. Instrinsic Differential Geometry and Cahn-Hoffman Capillary Vector
Appendix B. Surface Roughness Parameters
References
- Mitov, M. Cholesteric liquid crystals in living matter. Soft Matter 2017, 13, 4176–4209. [Google Scholar] [CrossRef] [PubMed]
- Giraud-Guille, M.M. Twisted plywood architecture of collagen fibrils in human compact bone osteons. Calcif. Tissue Int. 1988, 42, 167–180. [Google Scholar] [CrossRef] [PubMed]
- Mitov, M.; Dessaud, N. Going beyond the reflectance limit of cholesteric liquid crystals. Nat. Mater. 2006, 5, 361–364. [Google Scholar] [CrossRef] [PubMed]
- Agez, G.; Bitar, R.; Mitov, M. Color selectivity lent to a cholesteric liquid crystal by monitoring interface-induced deformations. Soft Matter 2011, 7, 2841–2847. [Google Scholar] [CrossRef]
- Bisoyi, H.K.; Bunning, T.J.; Li, Q. Stimuli-driven control of the helical axis of self-organized soft helical superstructures. Adv. Mater. 2018, 30, 1706512. [Google Scholar] [CrossRef]
- Scarangella, A.; Soldan, V.; Mitov, M. Biomimetic design of iridescent insect cuticles with tailored, self-organized cholesteric patterns. Nat. Commun. 2020, 11, 1–10. [Google Scholar] [CrossRef]
- Fernandes, S.N.; Geng, Y.; Vignolini, S.; Glover, B.J.; Trindade, A.C.; Canejo, J.P.; Almeida, P.L.; Brogueira, P.; Godinho, M.H. Structural color and iridescence in transparent sheared cellulosic films. Macromol. Chem. Phys. 2013, 214, 25–32. [Google Scholar] [CrossRef]
- Lagerwall, J.P.; Schütz, C.; Salajkova, M.; Noh, J.; Hyun Park, J.; Scalia, G.; Bergström, L. Cellulose nanocrystal-based materials: From liquid crystal self-assembly and glass formation to multifunctional thin films. NPG Asia Mater. 2014, 6, e80. [Google Scholar] [CrossRef]
- Ilca, S.L.; Sun, X.; El Omari, K.; Kotecha, A.; de Haas, F.; DiMaio, F.; Grimes, J.M.; Stuart, D.I.; Poranen, M.M.; Huiskonen, J.T. Multiple liquid crystalline geometries of highly compacted nucleic acid in a dsRNA virus. Nature 2019, 570, 252–256. [Google Scholar] [CrossRef]
- Dierking, I.; Al-Zangana, S. Lyotropic liquid crystal phases from anisotropic nanomaterials. Nanomaterials 2017, 7, 305. [Google Scholar] [CrossRef]
- Wilts, B.D.; Whitney, H.M.; Glover, B.J.; Steiner, U.; Vignolini, S. Natural helicoidal structures: Morphology, self-assembly and optical properties. Mater. Today Proc. 2014, 1, 177–185. [Google Scholar] [CrossRef]
- Mitov, M. Cholesteric liquid crystals with a broad light reflection band. Adv. Mater. 2012, 24, 6260–6276. [Google Scholar] [CrossRef] [PubMed]
- Carrión, F.J.; Martínez-Nicolás, G.; Iglesias, P.; Sanes, J.; Bermúdez, M.D. Liquid crystals in tribology. Int. J. Mol. Sci. 2009, 10, 4102–4115. [Google Scholar] [CrossRef] [PubMed]
- Ermakov, S.; Myshkin, N.; Kolesnikov, V.; Sychev, A. On the mechanism of cholesteric liquid crystal lubricity in metal joint friction. J. Frict. Wear 2015, 36, 496–501. [Google Scholar] [CrossRef]
- Zhang, Y.S.; Wang, Z.Q.; Lin, J.D.; Yang, P.C.; Lee, C.R. Light-Switching Surface Wettability of Chiral Liquid Crystal Networks by Dynamic Change in Nanoscale Topography. Macromol. Rapid Commun. 2021, 43, 2100736. [Google Scholar] [CrossRef]
- Silvestre, N.M.; Figueirinhas Pereira, M.C.; Bernardino, N.R.; Telo da Gama, M.M. Wetting of cholesteric liquid crystals. Eur. Phys. J. E 2016, 39, 1–6. [Google Scholar] [CrossRef]
- Khadem, S.A.; Bagnani, M.; Mezzenga, R.; Rey, A.D. Relaxation dynamics in bio-colloidal cholesteric liquid crystals confined to cylindrical geometry. Nat. Commun. 2020, 11, 1–10. [Google Scholar] [CrossRef]
- Gutierrez, O.F.A.; Rey, A.D. Biological plywood film formation from para-nematic liquid crystalline organization. Soft Matter 2017, 13, 8076–8088. [Google Scholar] [CrossRef]
- Khadem, S.A.; Rey, A.D. Thermodynamic modelling of acidic collagenous solutions: From free energy contributions to phase diagrams. Soft Matter 2019, 15, 1833–1846. [Google Scholar] [CrossRef]
- Rey, A.D. Capillary models for liquid crystal fibers, membranes, films, and drops. Soft Matter 2007, 3, 1349–1368. [Google Scholar] [CrossRef]
- De Luca, G.; Rey, A.D. Dynamic interactions between nematic point defects in the spinning extrusion duct of spiders. J. Chem. Phys. 2006, 124, 144904. [Google Scholar] [CrossRef] [PubMed]
- De Luca, G.; Rey, A. Biomimetics of spider silk spinning process. In Design and Nature III: Comparing Design in Nature with Science and Engineering; WIT Press: Southampton, UK, 2006; pp. 127–136. [Google Scholar]
- Rey, A.D. Liquid crystal models of biological materials and processes. Soft Matter 2010, 6, 3402–3429. [Google Scholar] [CrossRef]
- Rey, A.D.; Herrera-Valencia, E.E. Liquid crystal models of biological materials and silk spinning. Biopolymers 2012, 97, 374–396. [Google Scholar] [CrossRef] [PubMed]
- Rey, A.D.; Herrera-Valencia, E.; Murugesan, Y.K. Structure and dynamics of biological liquid crystals. Liq. Cryst. 2014, 41, 430–451. [Google Scholar] [CrossRef]
- Murugesan, Y.K.; Rey, A.D. Modeling textural processes during self-assembly of plant-based chiral-nematic liquid crystals. Polymers 2010, 2, 766–785. [Google Scholar] [CrossRef]
- Gutierrez, O.F.A.; Rey, A.D. Chiral graded structures in biological plywoods and in the beetle cuticle. Colloid Interface Sci. Commun. 2014, 3, 18–22. [Google Scholar] [CrossRef][Green Version]
- Gutierrez, O.F.A.; Rey, A.D. Structure characterisation method for ideal and non-ideal twisted plywoods. Soft Matter 2014, 10, 9446–9453. [Google Scholar] [CrossRef]
- De Luca, G.; Rey, A. Monodomain and polydomain helicoids in chiral liquid-crystalline phases and their biological analogues. Eur. Phys. J. E 2003, 12, 291–302. [Google Scholar] [CrossRef]
- Wincure, B.; Rey, A.D. Interfacial nematodynamics of heterogeneous curved isotropic-nematic moving fronts. J. Chem. Phys. 2006, 124, 244902. [Google Scholar] [CrossRef]
- Rey, A.D. Mechanical Model for Anisotropic Curved Interfaces with Applications to Surfactant-Laden Liquid- Liquid Crystal Interfaces. Langmuir 2006, 22, 219–228. [Google Scholar] [CrossRef]
- Rey, A.D. Nemato-capillarity theory and the orientation-induced Marangoni flow. Liq. Cryst. 1999, 26, 913–917. [Google Scholar] [CrossRef]
- Smith, G.S. Structural color of Morpho butterflies. Am. J. Phys. 2009, 77, 1010–1019. [Google Scholar] [CrossRef]
- Sharma, V.; Crne, M.; Park, J.O.; Srinivasarao, M. Bouligand structures underlie circularly polarized iridescence of scarab beetles: A closer view. Mater. Today Proc. 2014, 1, 161–171. [Google Scholar] [CrossRef]
- Weaver, J.C.; Milliron, G.W.; Miserez, A.; Evans-Lutterodt, K.; Herrera, S.; Gallana, I.; Mershon, W.J.; Swanson, B.; Zavattieri, P.; DiMasi, E.; et al. The stomatopod dactyl club: A formidable damage-tolerant biological hammer. Science 2012, 336, 1275–1280. [Google Scholar] [CrossRef]
- Patek, S.N.; Korff, W.; Caldwell, R.L. Deadly strike mechanism of a mantis shrimp. Nature 2004, 428, 819–820. [Google Scholar] [CrossRef]
- Tamaoki, N. Cholesteric liquid crystals for color information technology. Adv. Mater. 2001, 13, 1135–1147. [Google Scholar] [CrossRef]
- Tran, L.; Lavrentovich, M.O.; Durey, G.; Darmon, A.; Haase, M.F.; Li, N.; Lee, D.; Stebe, K.J.; Kamien, R.D.; Lopez-Leon, T. Change in stripes for cholesteric shells via anchoring in moderation. Phys. Rev. X 2017, 7, 041029. [Google Scholar] [CrossRef]
- Ryabchun, A.; Yakovlev, D.; Bobrovsky, A.; Katsonis, N. Dynamic diffractive patterns in helix-inverting cholesteric liquid crystals. ACS Appl. Mater. Interfaces 2019, 11, 10895–10904. [Google Scholar] [CrossRef]
- Goto, H. Asymmetric Polymerisation in Liquid Crystals and Resultant Electro-Chiroptical Effect: Structure Organising Polymerisation and Chiral Charge Carrier “Chiralion”. In IOP Conference Series: Materials Science and Engineering; IOP Publishing: Bristol, UK, 2014; Volume 54, p. 012013. [Google Scholar]
- Meister, R.; Dumoulin, H.; Hallé, M.A.; Pieranski, P. The anchoring of a cholesteric liquid crystal at the free surface. J. De Phys. II 1996, 6, 827–844. [Google Scholar] [CrossRef]
- Manda, R.; Pagidi, S.; Bhattacharyya, S.S.; Park, C.H.; Lim, Y.J.; Gwag, J.S.; Lee, S.H. Fast response and transparent optically isotropic liquid crystal diffraction grating. Opt. Express 2017, 25, 24033–24043. [Google Scholar] [CrossRef]
- Amano, R.; Salamon, P.; Yokokawa, S.; Kobayashi, F.; Sasaki, Y.; Fujii, S.; Buka, Á.; Araoka, F.; Orihara, H. Tunable two-dimensional polarization grating using a self-organized micropixelated liquid crystal structure. RSC Adv. 2018, 8, 41472–41479. [Google Scholar] [CrossRef]
- Ajito, T.; Obi, T.; Yamaguchi, M.; Ohyama, N. Multiprimary color display for liquid crystal display projectors using diffraction grating. Opt. Eng. 1999, 38, 1883–1888. [Google Scholar] [CrossRef]
- Provenzano, C.; Pagliusi, P.; Cipparrone, G. Highly efficient liquid crystal based diffraction grating induced by polarization holograms at the aligning surfaces. Appl. Phys. Lett. 2006, 89, 121105. [Google Scholar] [CrossRef]
- Agrawal, A.; Luchette, P.; Palffy-Muhoray, P.; Biswal, S.L.; Chapman, W.G.; Verduzco, R. Surface wrinkling in liquid crystal elastomers. Soft Matter 2012, 8, 7138–7142. [Google Scholar] [CrossRef]
- Wang, Z.; Servio, P.; Rey, A. Wrinkling pattern formation with periodic nematic orientation: From egg cartons to corrugated surfaces. Phys. Rev. E 2022, 105, 034702. [Google Scholar] [CrossRef]
- Rofouie, P.; Pasini, D.; Rey, A.D. Nano-scale surface wrinkling in chiral liquid crystals and plant-based plywoods. Soft Matter 2015, 11, 1127–1139. [Google Scholar] [CrossRef] [PubMed]
- Rey, A.D. Thermodynamics of soft anisotropic interfaces. J. Chem. Phys. 2004, 120, 2010–2019. [Google Scholar] [CrossRef] [PubMed]
- Han, W.; Rey, A. Dynamic simulations of shear-flow-induced chirality and twisted-texture transitions of a liquid-crystalline polymer. Phys. Rev. E 1994, 49, 597. [Google Scholar] [CrossRef]
- Tovkach, O.; Chen, J.; Ripp, M.M.; Zhang, T.; Paulsen, J.D.; Davidovitch, B. Mesoscale structure of wrinkle patterns and defect-proliferated liquid crystalline phases. Proc. Natl. Acad. Sci. USA 2020, 117, 3938–3943. [Google Scholar] [CrossRef]
- Schoenborn, O.L. Phase-Ordering Kinetics on Curved Surfaces. Ph.D. Thesis, University of Toronto, Toronto, ON, Canada, 1998. [Google Scholar]
- Fournier, J. Nontopological saddle-splay and curvature instabilities from anisotropic membrane inclusions. Phys. Rev. Lett. 1996, 76, 4436. [Google Scholar] [CrossRef]
- Sim, J.; Oh, S.; Kim, S.U.; Heo, K.; Park, S.C.; Na, J.H. Self-organized wrinkling of liquid crystalline polymer with plasma treatment. J. Mater. Res. 2018, 33, 4092–4100. [Google Scholar] [CrossRef]
- Zhao, Y.; Yu, Q.; Cheng, W.W.; Li, J.Q.; Zhang, A.Q.; Lei, X.; Yang, Y.; Qin, S.Y. Ti3C2Tx MXene Liquid Crystal: Access to Create Background-Free and Easy-Made Alignment Medium. ACS Nano 2022, 16, 5454–5462. [Google Scholar] [CrossRef] [PubMed]
- Lee, H.W.; You, W.; Barman, S.; Hellstrom, S.; LeMieux, M.C.; Oh, J.H.; Liu, S.; Fujiwara, T.; Wang, W.M.; Chen, B.; et al. Lyotropic Liquid-Crystalline Solutions of High-Concentration Dispersions of Single-Walled Carbon Nanotubes with Conjugated Polymers. Small 2009, 5, 1019–1024. [Google Scholar] [CrossRef] [PubMed]
- Al-Zangana, S.; Iliut, M.; Turner, M.; Vijayaraghavan, A.; Dierking, I. Confinement effects on lyotropic nematic liquid crystal phases of graphene oxide dispersions. 2D Mater. 2017, 4, 041004. [Google Scholar] [CrossRef]
- Rofouie, P.; Pasini, D.; Rey, A. Tunable nano-wrinkling of chiral surfaces: Structure and diffraction optics. J. Chem. Phys. 2015, 143, 09B613_1. [Google Scholar] [CrossRef]
- Wu, Z.L.; Buguin, A.; Yang, H.; Taulemesse, J.M.; Le Moigne, N.; Bergeret, A.; Wang, X.; Keller, P. Microstructured nematic liquid crystalline elastomer surfaces with switchable wetting properties. Adv. Funct. Mater. 2013, 23, 3070–3076. [Google Scholar] [CrossRef]
- Stetsyshyn, Y.; Raczkowska, J.; Budkowski, A.; Awsiuk, K.; Kostruba, A.; Nastyshyn, S.; Harhay, K.; Lychkovskyy, E.; Ohar, H.; Nastishin, Y. Cholesterol-based grafted polymer brushes as alignment coating with temperature-tuned anchoring for nematic liquid crystals. Langmuir 2016, 32, 11029–11038. [Google Scholar] [CrossRef]
- Raczkowska, J.; Stetsyshyn, Y.; Awsiuk, K.; Lekka, M.; Marzec, M.; Harhay, K.; Ohar, H.; Ostapiv, D.; Sharan, M.; Yaremchuk, I.; et al. Temperature-responsive grafted polymer brushes obtained from renewable sources with potential application as substrates for tissue engineering. Appl. Surf. Sci. 2017, 407, 546–554. [Google Scholar] [CrossRef]
- Domel, A.G.; Saadat, M.; Weaver, J.C.; Haj-Hariri, H.; Bertoldi, K.; Lauder, G.V. Shark skin-inspired designs that improve aerodynamic performance. J. R. Soc. Interface 2018, 15, 20170828. [Google Scholar] [CrossRef]
- Nosonovsky, M. Multiscale roughness and stability of superhydrophobic biomimetic interfaces. Langmuir 2007, 23, 3157–3161. [Google Scholar] [CrossRef]
- Boyan, B.D.; Lotz, E.M.; Schwartz, Z. Roughness and hydrophilicity as osteogenic biomimetic surface properties. Tissue Eng. Part A 2017, 23, 1479–1489. [Google Scholar] [CrossRef] [PubMed]
- Dallaeva, D.S.; Tomanek, P. AFM study of structure influence on butterfly wings coloration. Adv. Electr. Electron. Eng. 2012, 10, 120–124. [Google Scholar] [CrossRef]
- Kuang, Y.; Liu, J.; Shi, X. Effect of surface roughness of optical waveguide on imaging quality and a formula of RSE tolerance and incident angle. Opt. Express 2020, 28, 1103–1113. [Google Scholar] [CrossRef] [PubMed]
- Tayebi, N.; Polycarpou, A.A. Reducing the effects of adhesion and friction in microelectromechanical systems (MEMSs) through surface roughening: Comparison between theory and experiments. J. Appl. Phys. 2005, 98, 073528. [Google Scholar] [CrossRef]
- Wainwright, D.K.; Lauder, G.V.; Weaver, J.C. Imaging biological surface topography in situ and in vivo. Methods Ecol. Evol. 2017, 8, 1626–1638. [Google Scholar] [CrossRef]
- Hansson, K.N.; Hansson, S. Skewness and kurtosis: Important parameters in the characterization of dental implant surface roughness—A computer simulation. Int. Sch. Res. Not. 2011, 2011. [Google Scholar] [CrossRef]
- Sonin, A.A. The Surface Physics of Liquid Crystals; Gordon & Breach Science Publishers: Philadelphia, PA, USA, 1995. [Google Scholar]
- Rapini, A.; Papoular, M. Distorsion d’une lamelle nématique sous champ magnétique conditions d’ancrage aux parois. J. Phys. Colloq. 1969, 30, C4-54. [Google Scholar] [CrossRef]
- Wang, Z.; Rofouie, P.; Rey, A.D. Surface anchoring effects on the formation of two-wavelength surface patterns in chiral liquid crystals. Crystals 2019, 9, 190. [Google Scholar] [CrossRef]
- Wang, Z.; Servio, P.; Rey, A. Biaxial nanowrinkling in cholesteric surfaces: Egg carton surfaces through chiral anchoring. Colloid Interface Sci. Commun. 2021, 41, 100372. [Google Scholar] [CrossRef]
- Rofouie, P.; Pasini, D.; Rey, A.D. Morphology of elastic nematic liquid crystal membranes. Soft Matter 2017, 13, 5366–5380. [Google Scholar] [CrossRef]
- Rofouie, P.; Pasini, D.; Rey, A. Multiple-wavelength surface patterns in models of biological chiral liquid crystal membranes. Soft Matter 2017, 13, 541–545. [Google Scholar] [CrossRef] [PubMed]
- Virga, E.G. Variational Theories for Liquid Crystals; Chapman and Hall/CRC: New York, NY, USA, 1994. [Google Scholar]
- Stewart, I.W. The Static and Dynamic Continuum Theory of Liquid Crystals: A Mathematical Introduction; Taylor & Francis: London, UK, 2004. [Google Scholar]
- Hoffman, D.W.; Cahn, J.W. A vector thermodynamics for anisotropic surfaces: I. Fundamentals and application to plane surface junctions. Surf. Sci. 1972, 31, 368–388. [Google Scholar] [CrossRef]
- Cahn, J.; Hoffman, D. A vector thermodlnamics for anisotropic surfaces—II. Curved and faceted surfaces. Acta Metall. 1974, 22, 1205–1214. [Google Scholar] [CrossRef]
- Cheong, A.G.; Rey, A.D. Cahn-Hoffman capillarity vector thermodynamics for liquid crystal interfaces. Phys. Rev. E 2002, 66, 021704. [Google Scholar] [CrossRef]
- Han, T.; Han, Y. Solving large scale nonlinear equations by a new ODE numerical integration method. Appl. Math. 2010, 1, 222. [Google Scholar] [CrossRef]
- Kelley, C.T.; Keyes, D.E. Convergence analysis of pseudo-transient continuation. SIAM J. Numer. Anal. 1998, 35, 508–523. [Google Scholar] [CrossRef]
- Kelley, C.; Liao, L. Explicit pseudo-transient continuation. Computing 2013, 15, 18. [Google Scholar]
- Wang, Z.; Servio, P.; Rey, A.D. Mechanogeometry of nanowrinkling in cholesteric liquid crystal surfaces. Phys. Rev. E 2020, 101, 062705. [Google Scholar] [CrossRef]
- Wang, W.Z.; Chen, H.; Hu, Y.Z.; Wang, H. Effect of surface roughness parameters on mixed lubrication characteristics. Tribol. Int. 2006, 39, 522–527. [Google Scholar] [CrossRef]
- He, X.; Liao, W.; Wang, G.; Zhong, L.; Li, M. Evaluation of hydrodynamic lubrication performance of textured surface from the perspective of skewness and kurtosis. Ind. Lubr. Tribol. 2018, 70, 829–837. [Google Scholar] [CrossRef]
- Liao, W.; Liu, X.; Li, G.; Chen, T. Evaluation of thermal-hydraulic performance of dimpled tube from the perspective of skewness and kurtosis. Int. J. Therm. Sci. 2020, 156, 106469. [Google Scholar] [CrossRef]
- Wang, P.; Chen, G. Basic characteristics of Taylor dispersion in a laminar tube flow with wall absorption: Exchange rate, advection velocity, dispersivity, skewness and kurtosis in their full time dependance. Int. J. Heat Mass Transf. 2017, 109, 844–852. [Google Scholar] [CrossRef]
- Alberghi, S.; Maurizi, A.; Tampieri, F. Relationship between the vertical velocity skewness and kurtosis observed during sea-breeze convection. J. Appl. Meteorol. 2002, 41, 885–889. [Google Scholar] [CrossRef]
- Peta, K.; Bartkowiak, T.; Galek, P.; Mendak, M. Contact angle analysis of surface topographies created by electric discharge machining. Tribol. Int. 2021, 163, 107139. [Google Scholar] [CrossRef]
- Durey, G.; Ishii, Y.; Lopez-Leon, T. Temperature-driven anchoring transitions at liquid crystal/water interfaces. Langmuir 2020, 36, 9368–9376. [Google Scholar] [CrossRef]


Publisher’s Note: MDPI stays neutral with regard to jurisdictional claims in published maps and institutional affiliations. |
© 2022 by the authors. Licensee MDPI, Basel, Switzerland. This article is an open access article distributed under the terms and conditions of the Creative Commons Attribution (CC BY) license (https://creativecommons.org/licenses/by/4.0/).
Share and Cite
Wang, Z.; Servio, P.; Rey, A.D. Complex Nanowrinkling in Chiral Liquid Crystal Surfaces: From Shaping Mechanisms to Geometric Statistics. Nanomaterials 2022, 12, 1555. https://doi.org/10.3390/nano12091555
Wang Z, Servio P, Rey AD. Complex Nanowrinkling in Chiral Liquid Crystal Surfaces: From Shaping Mechanisms to Geometric Statistics. Nanomaterials. 2022; 12(9):1555. https://doi.org/10.3390/nano12091555
Chicago/Turabian StyleWang, Ziheng, Phillip Servio, and Alejandro D. Rey. 2022. "Complex Nanowrinkling in Chiral Liquid Crystal Surfaces: From Shaping Mechanisms to Geometric Statistics" Nanomaterials 12, no. 9: 1555. https://doi.org/10.3390/nano12091555
APA StyleWang, Z., Servio, P., & Rey, A. D. (2022). Complex Nanowrinkling in Chiral Liquid Crystal Surfaces: From Shaping Mechanisms to Geometric Statistics. Nanomaterials, 12(9), 1555. https://doi.org/10.3390/nano12091555