
Adsorption Free Energy of Cellulose Nanocrystal on Water–Oil Interface


Abstract
:1. Introduction
2. Models and Simulation Methods
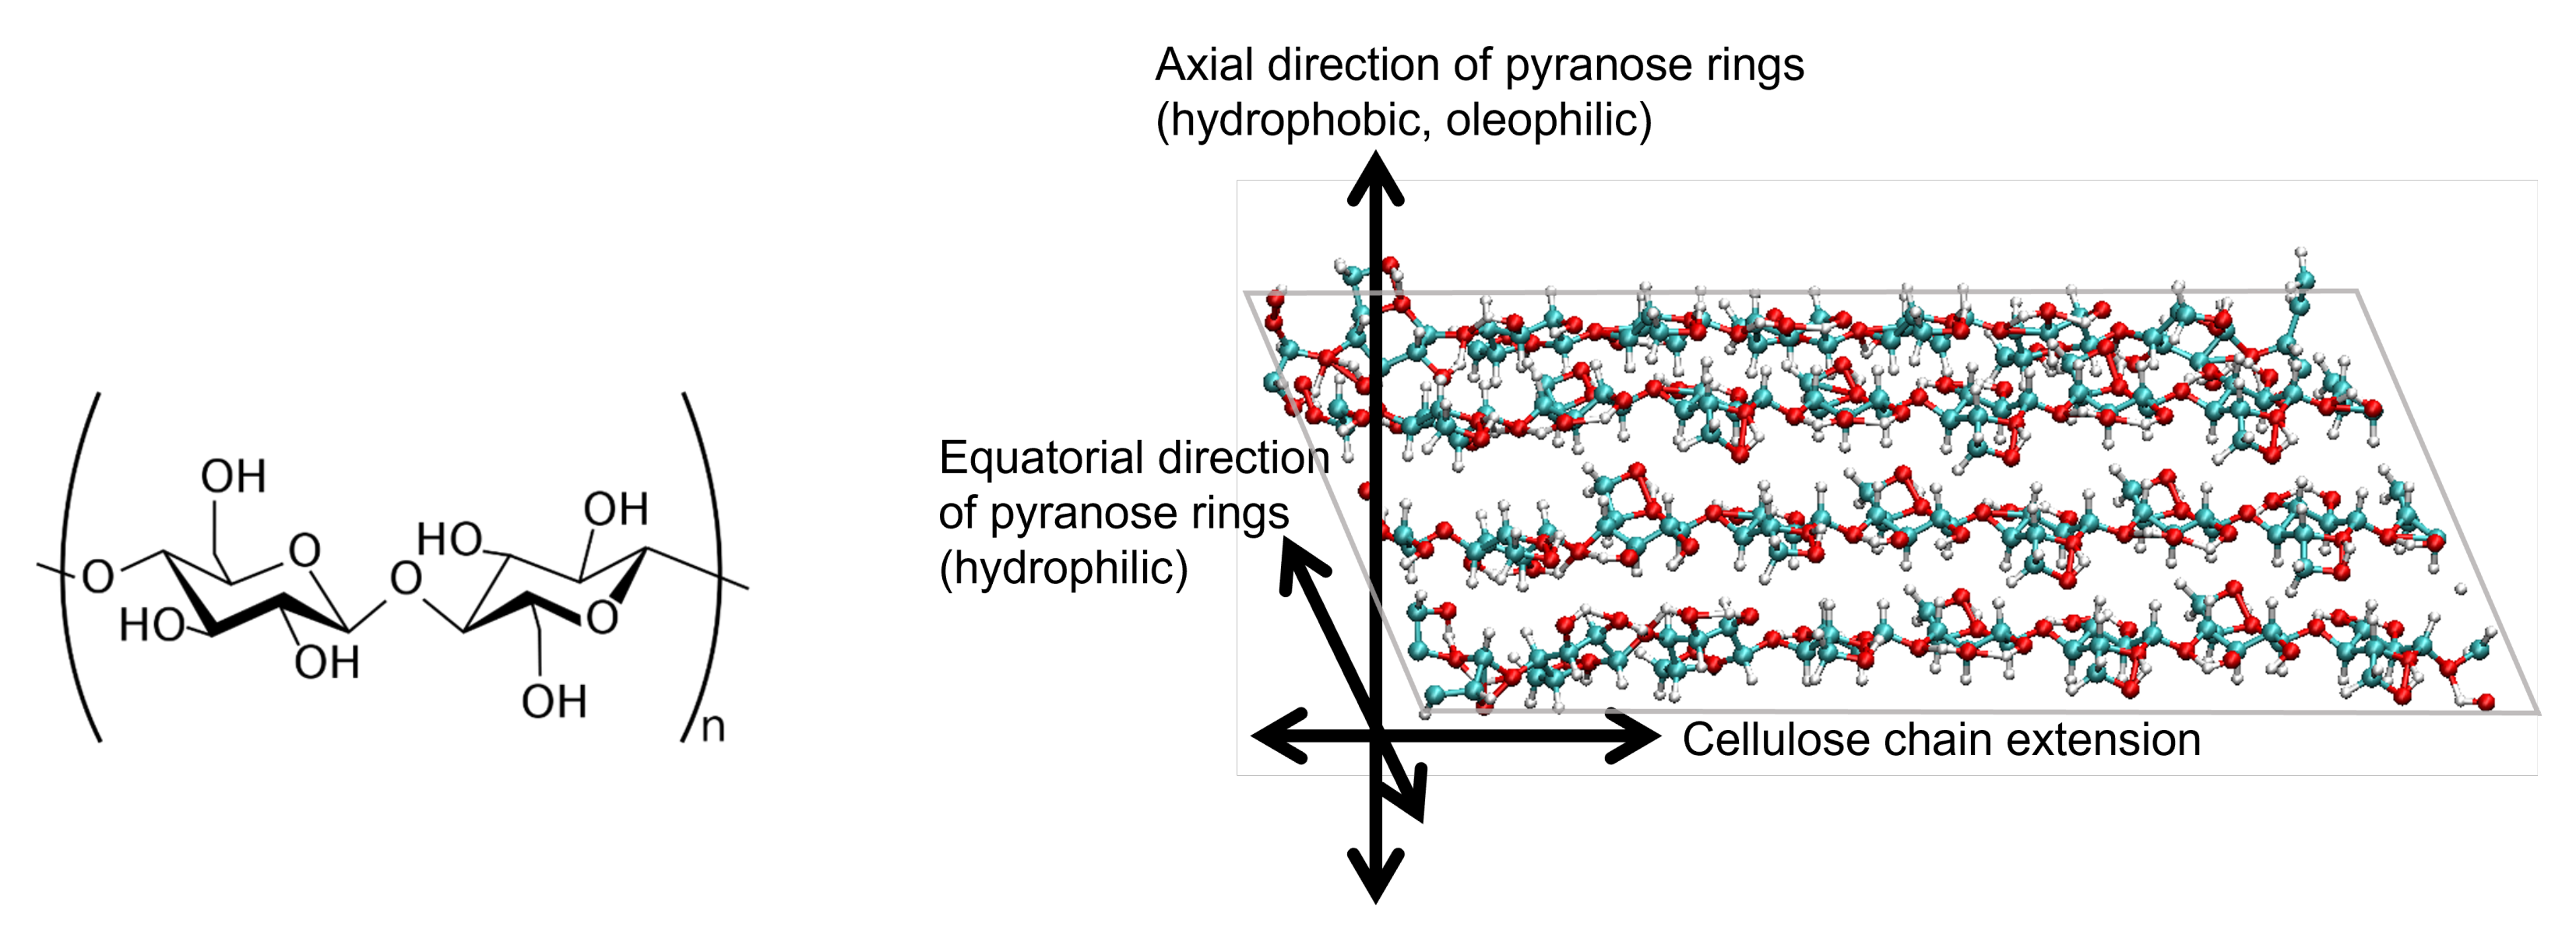
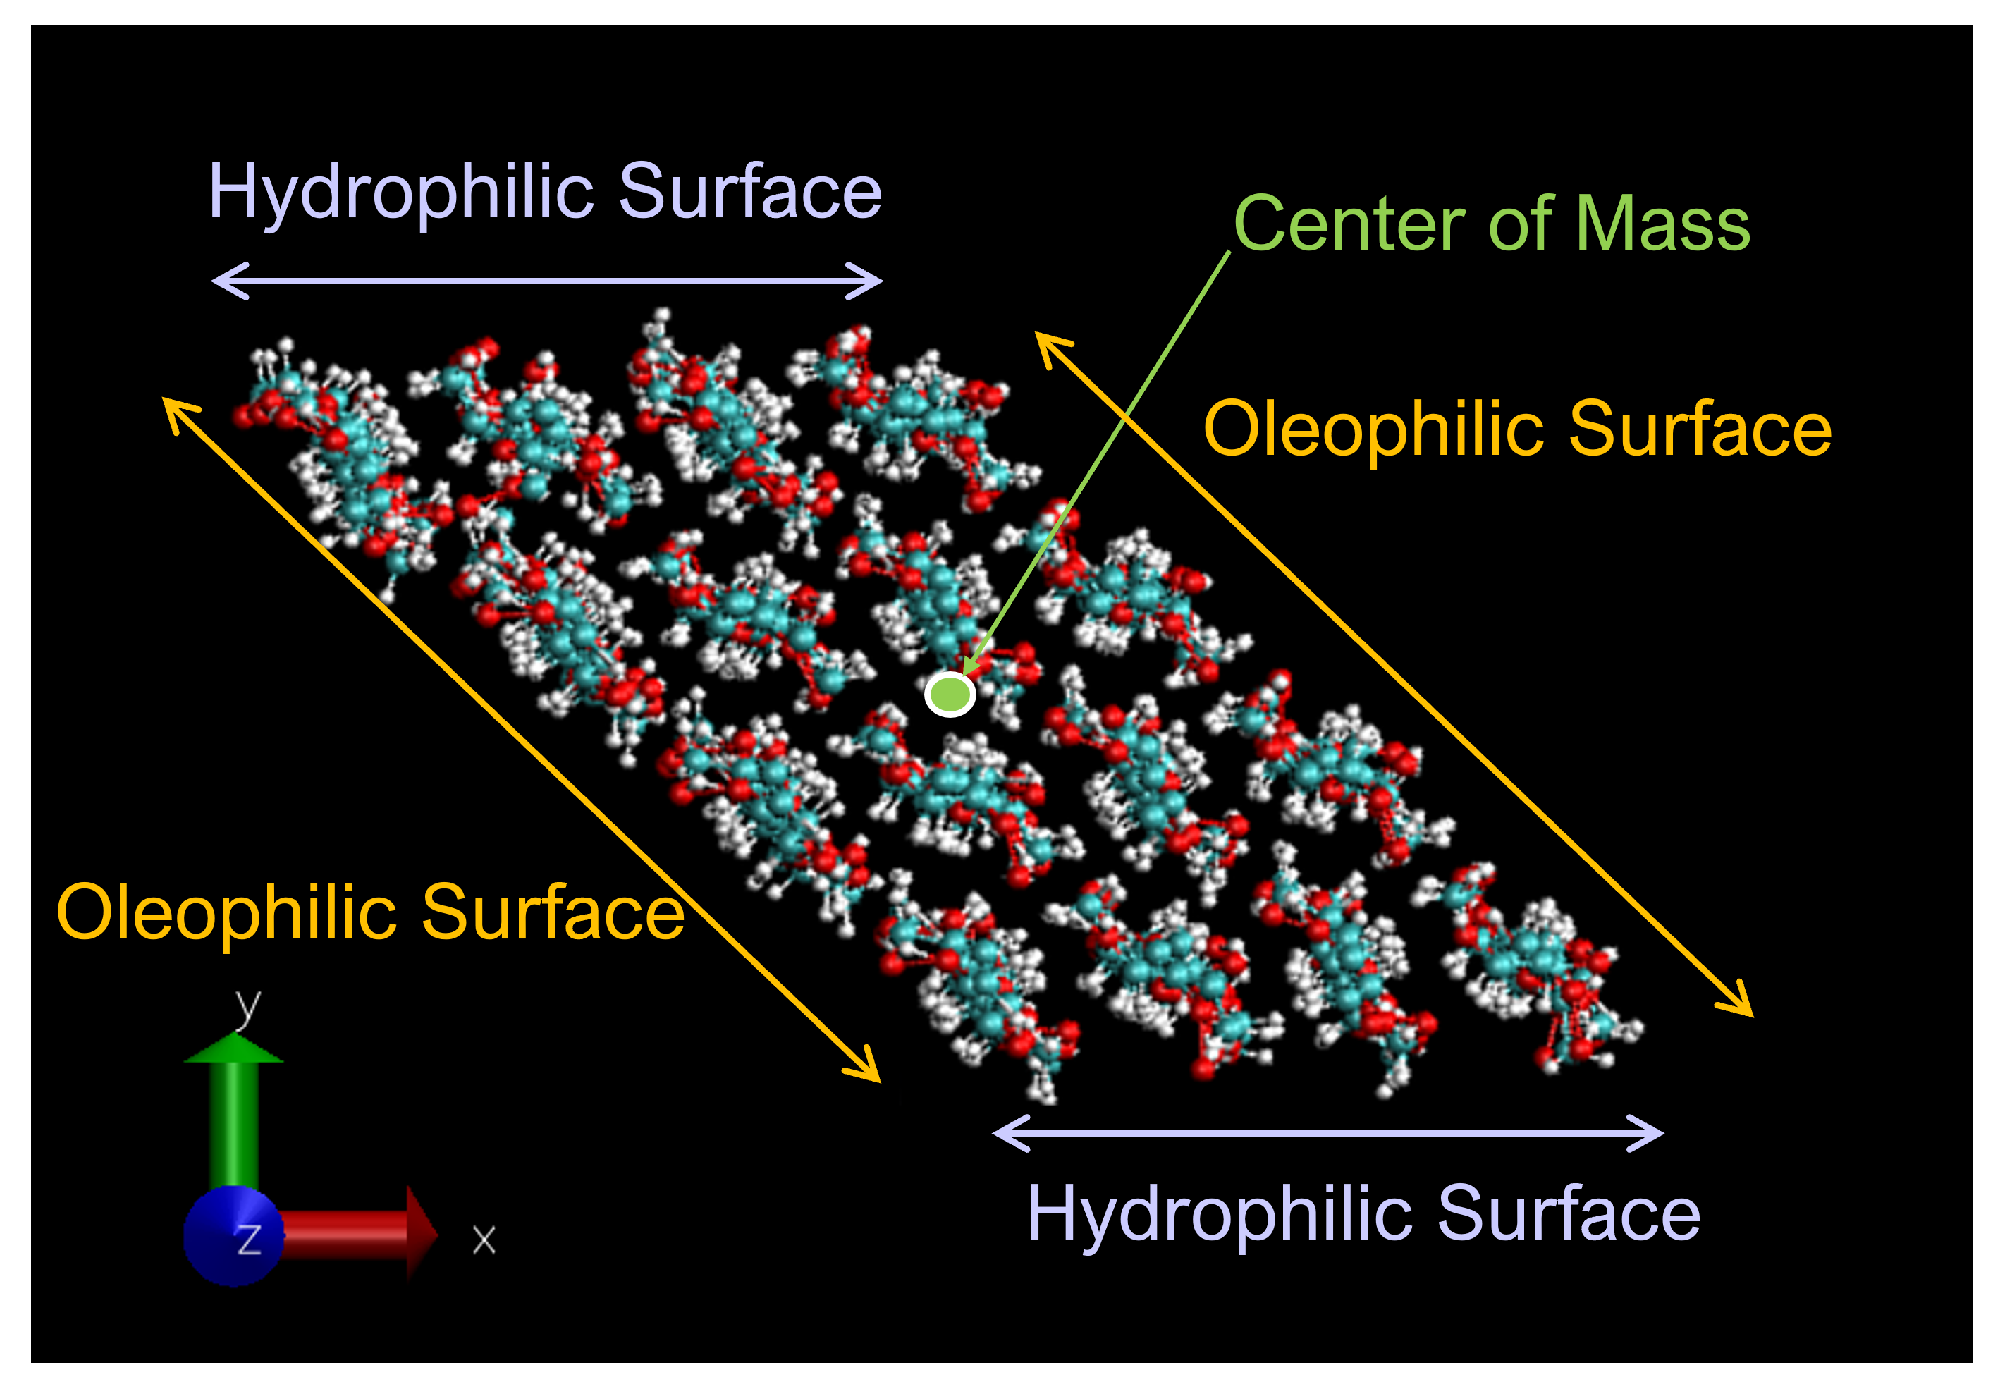
2.1. Cellulose Nanocrystal Model
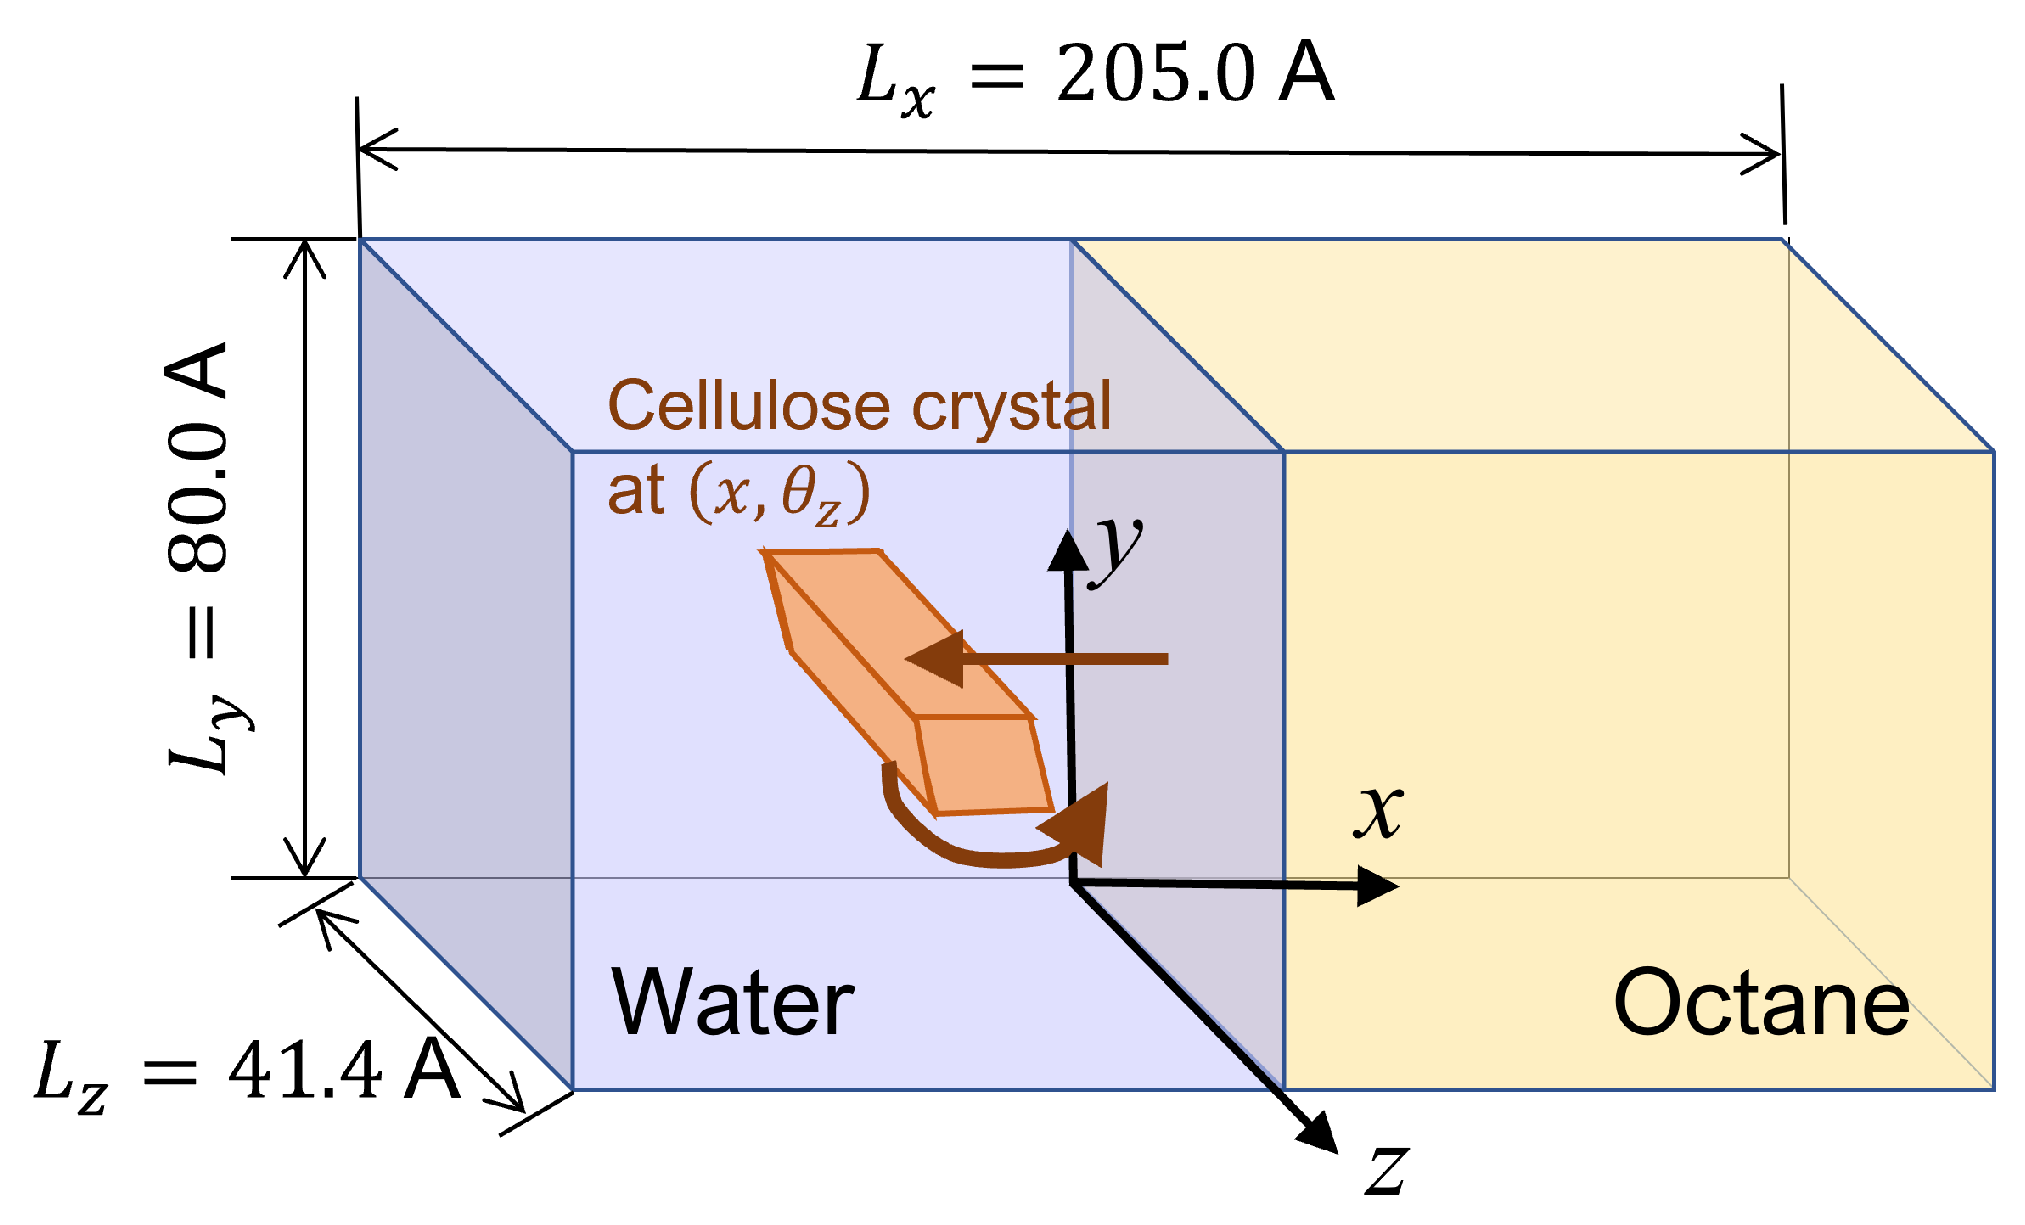
2.2. Simulation System
2.3. MD Simulation
2.4. Construction of Free Energy Surface
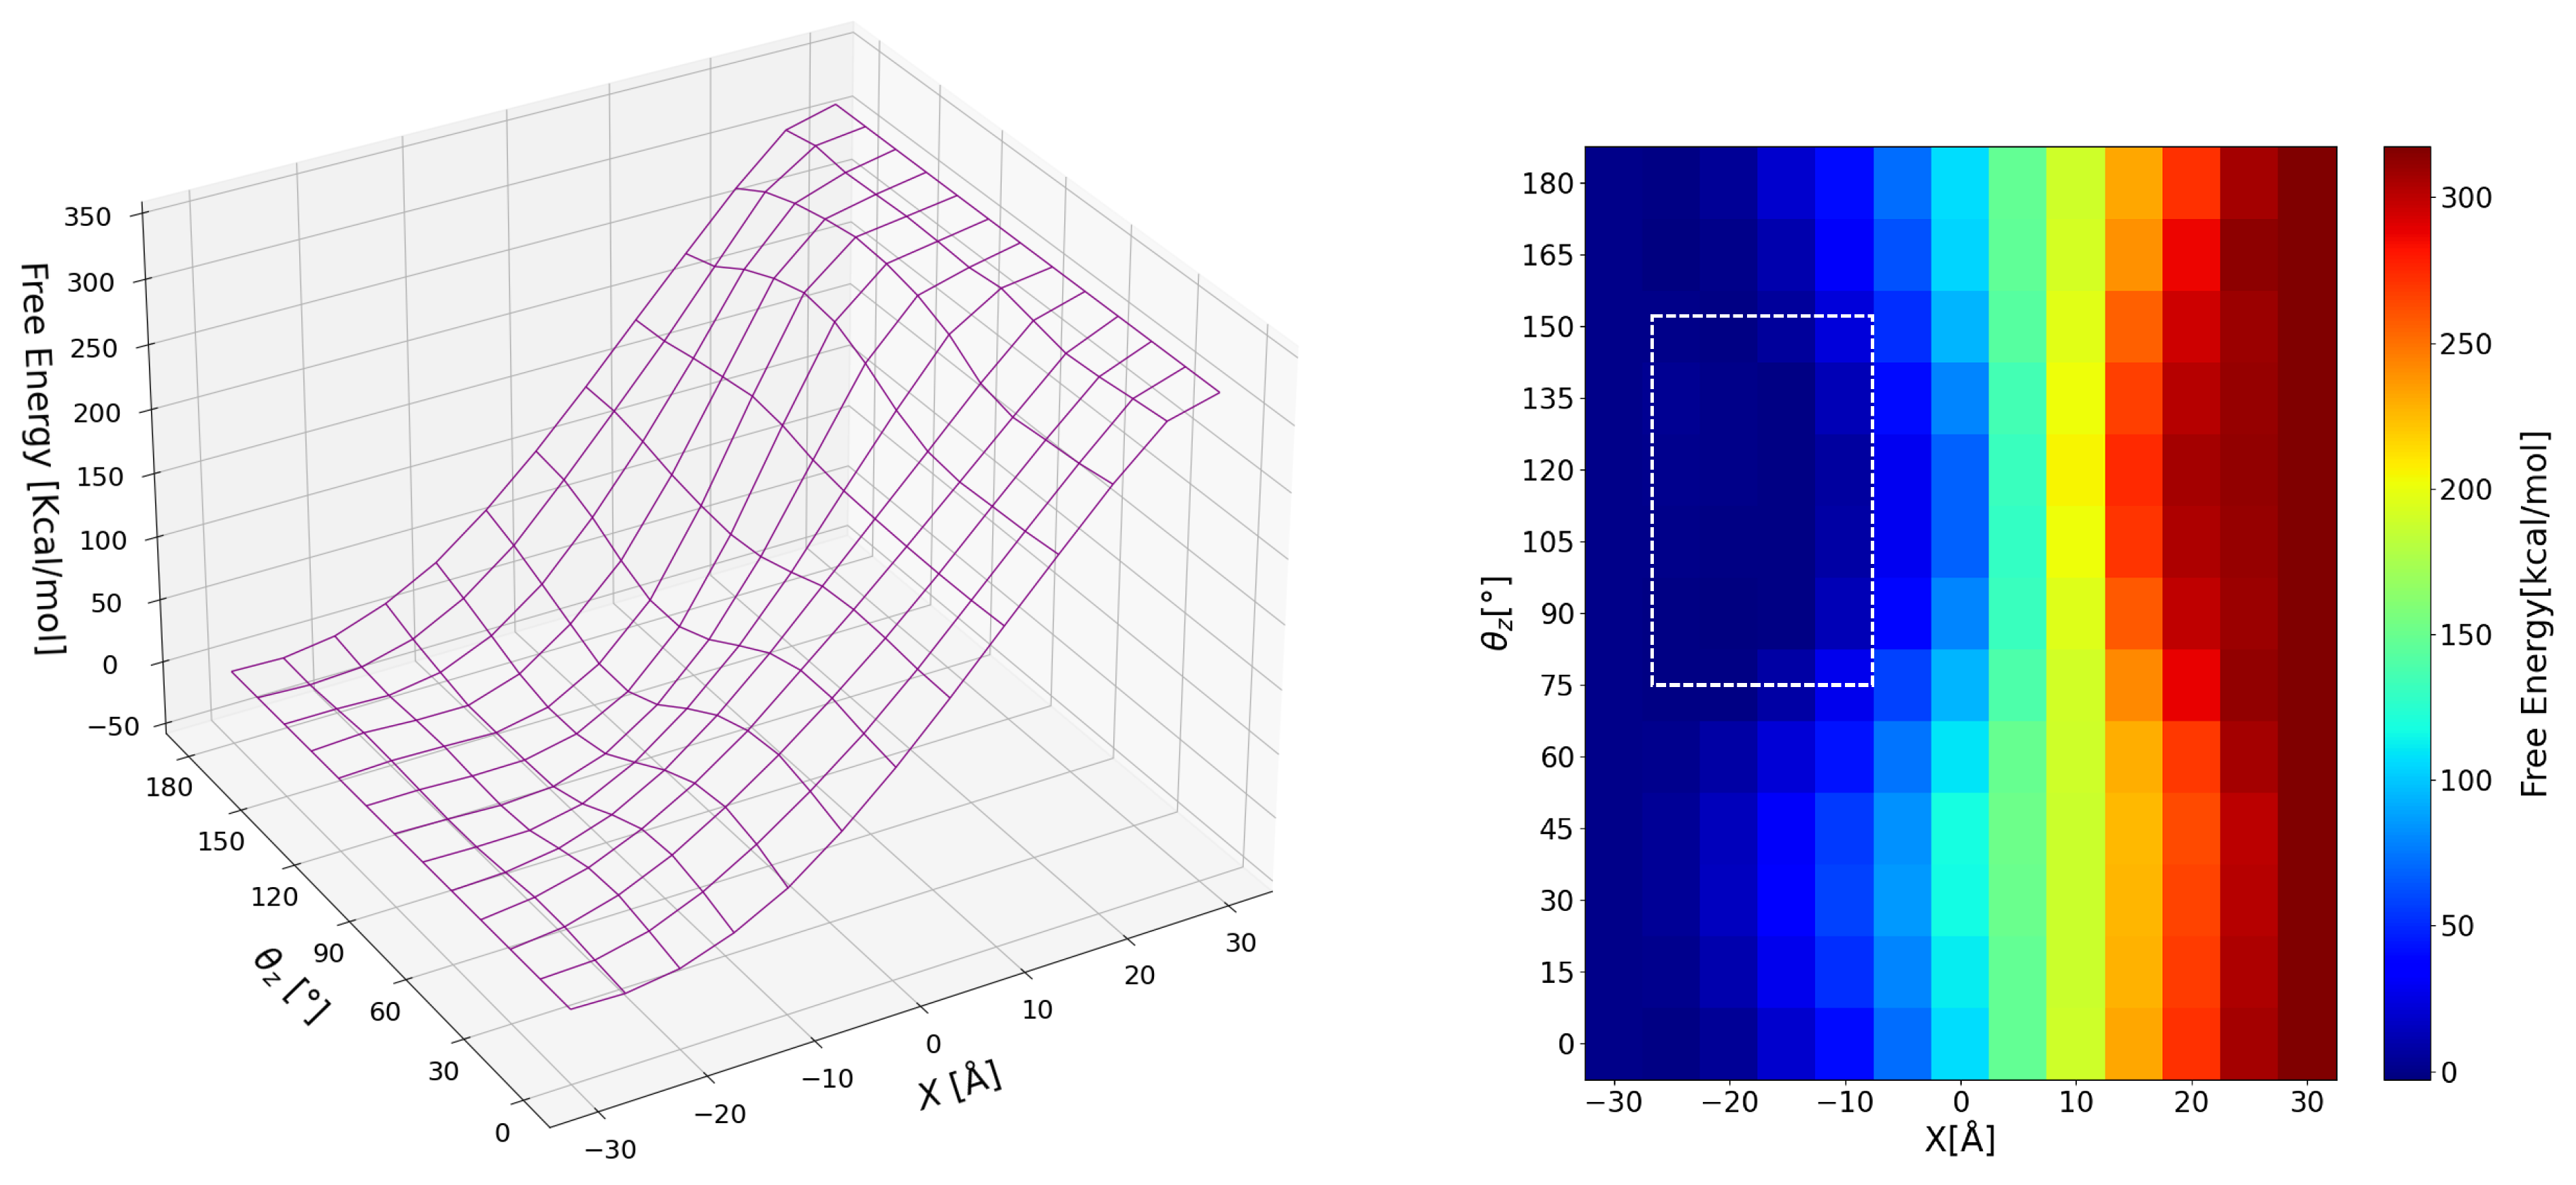
- First, we adopted a coarse grid to roughly investigate the free energy behavior: with Å and with . The number of grid points is thus ;
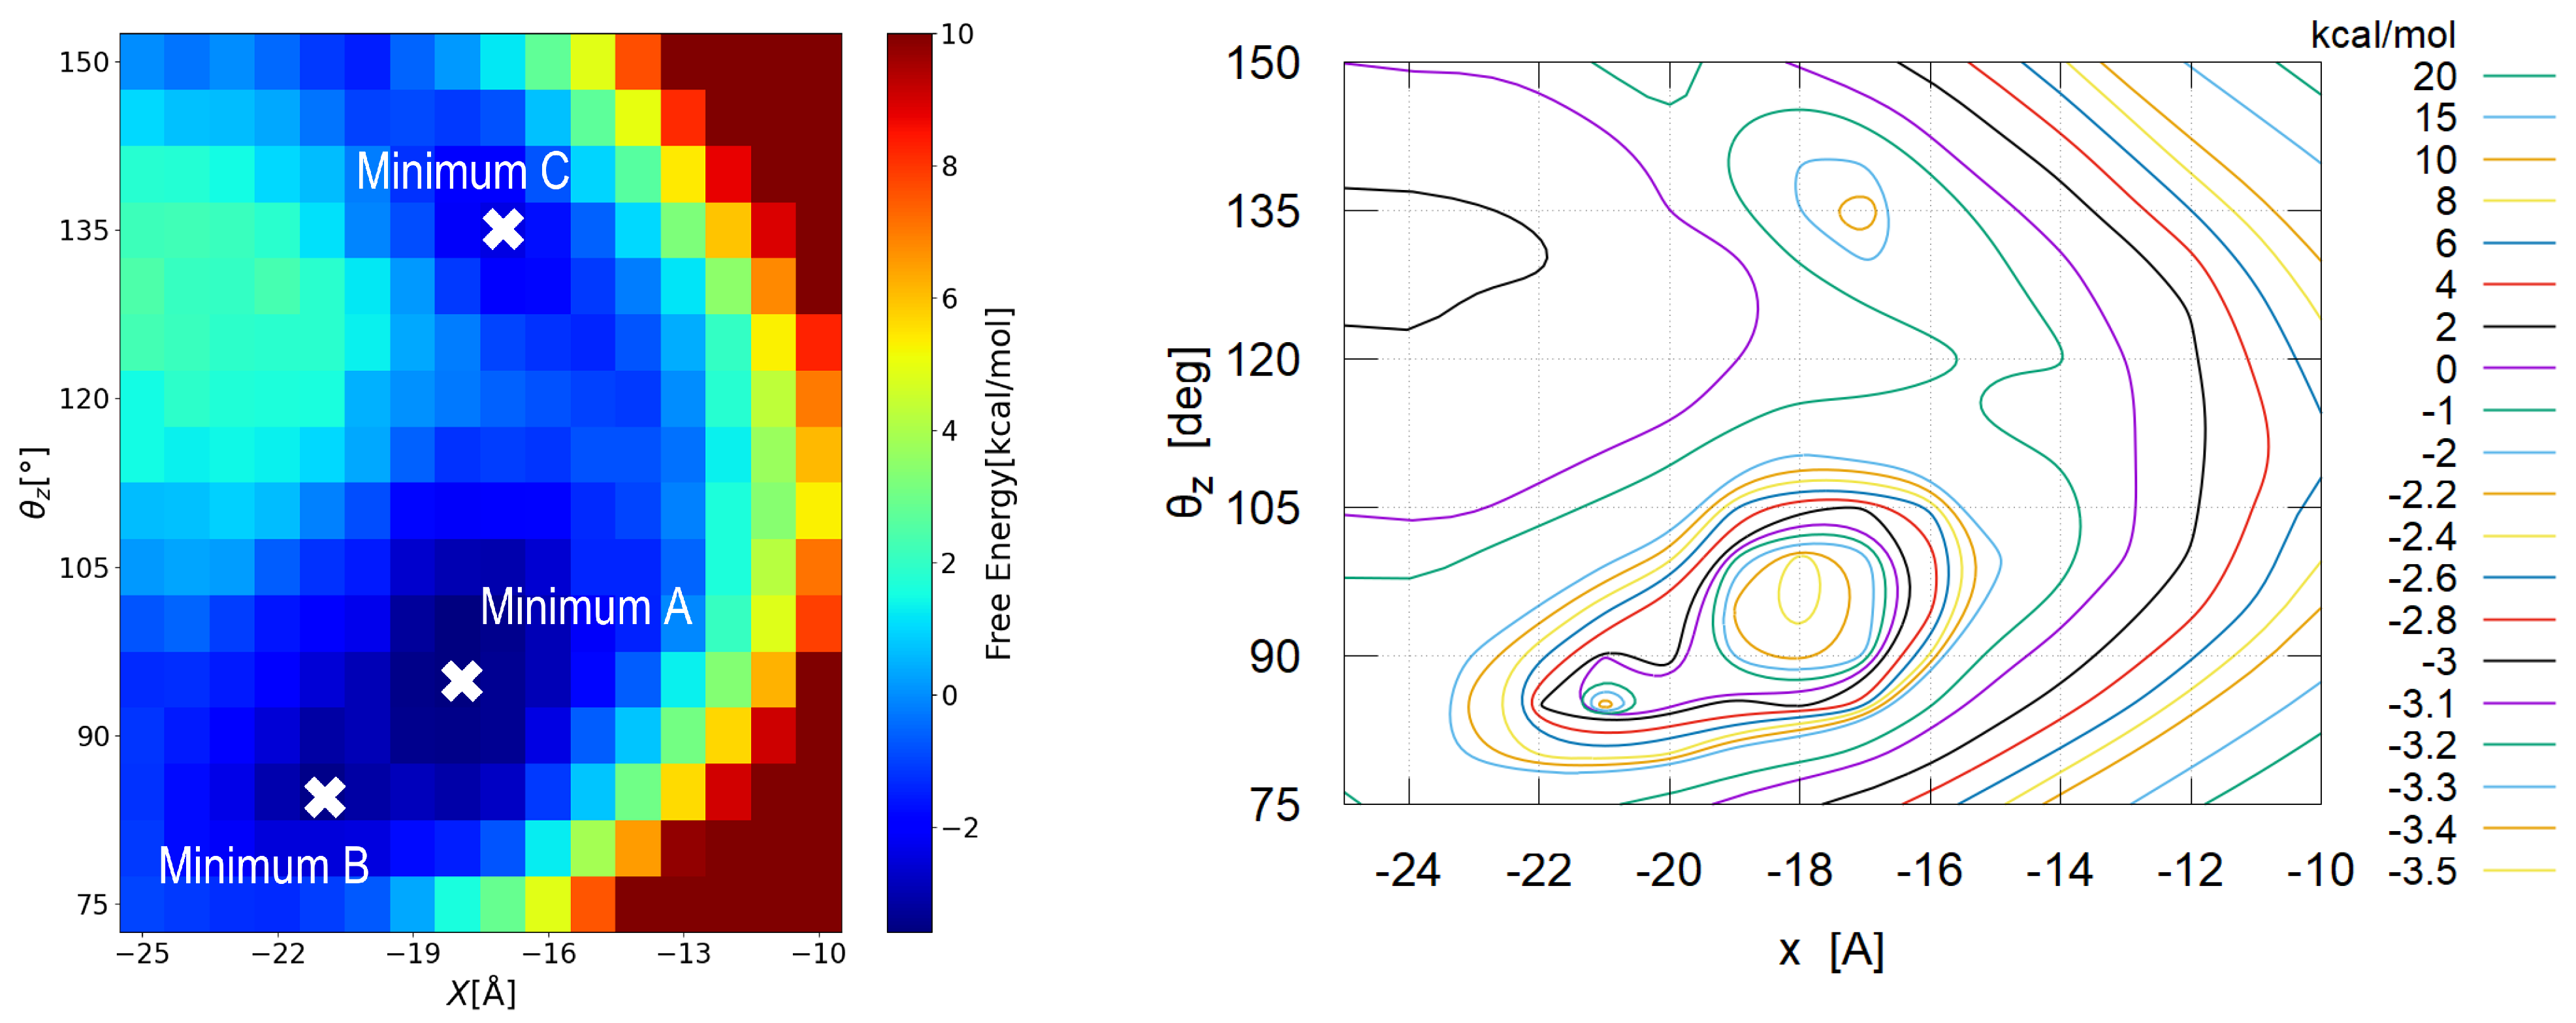
- To evaluate the local minima of the free energy surface more closely, a finer grid was adopted: with Å and with . The number of grid points on this finer grid is .
- Step 1:
- Define irrespective of , which is the “origin” of the free energy.
- Step 2:
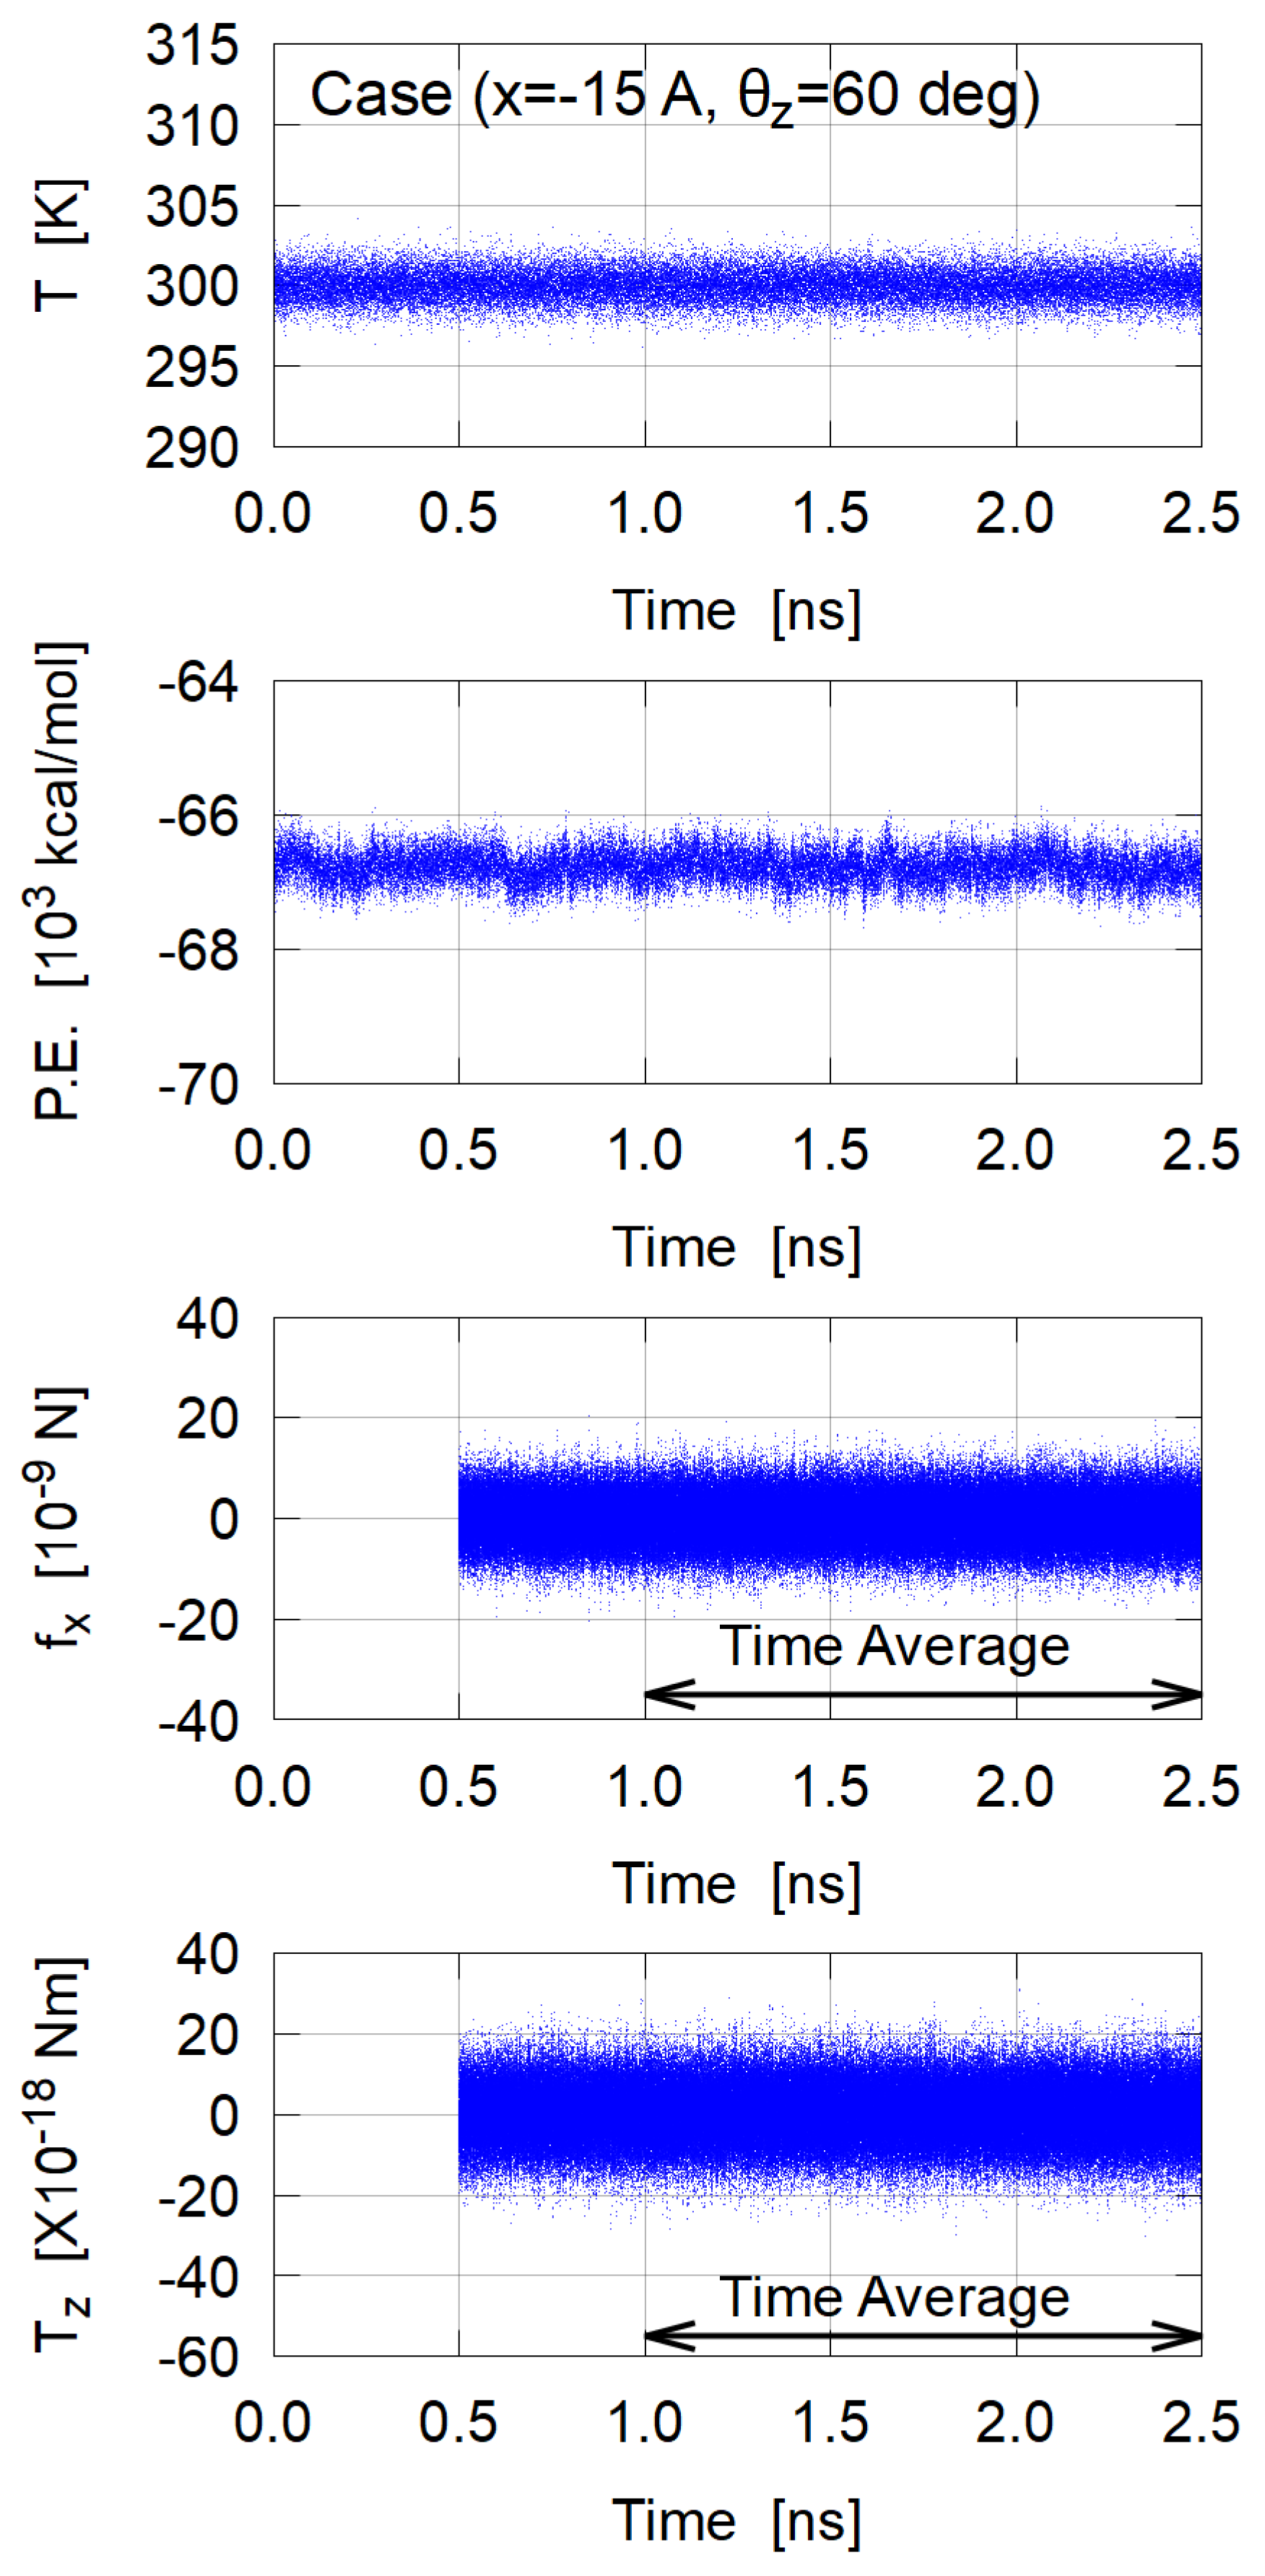
- For each , integration (or summation) in Equation (3) is carried out to obtain preliminary values of . is expected to be constant, but a small dependence remains due to the statistical fluctuations.
- Step 3:
- Assume the average value as the free energy difference , and give it to for all . Thus the boundary values of are determined at this step.
- Step 4:
- Choose a single grid point , Å, randomly.
- Step 5:
- Refine the data at the point using the four neighbor points. With the notation for , for the force component , and for the torque component on grid point , the update is performed as
- Step 6:
- Repeat Steps 4 and 5 enough times to reach a steady state. For our system, a smooth surface of was obtained after repeats.
3. Results and Discussion
3.1. Sampling
3.2. Free Energy Surface
3.2.1. Global View
3.2.2. Detailed View
3.3. Typical Adsorption States
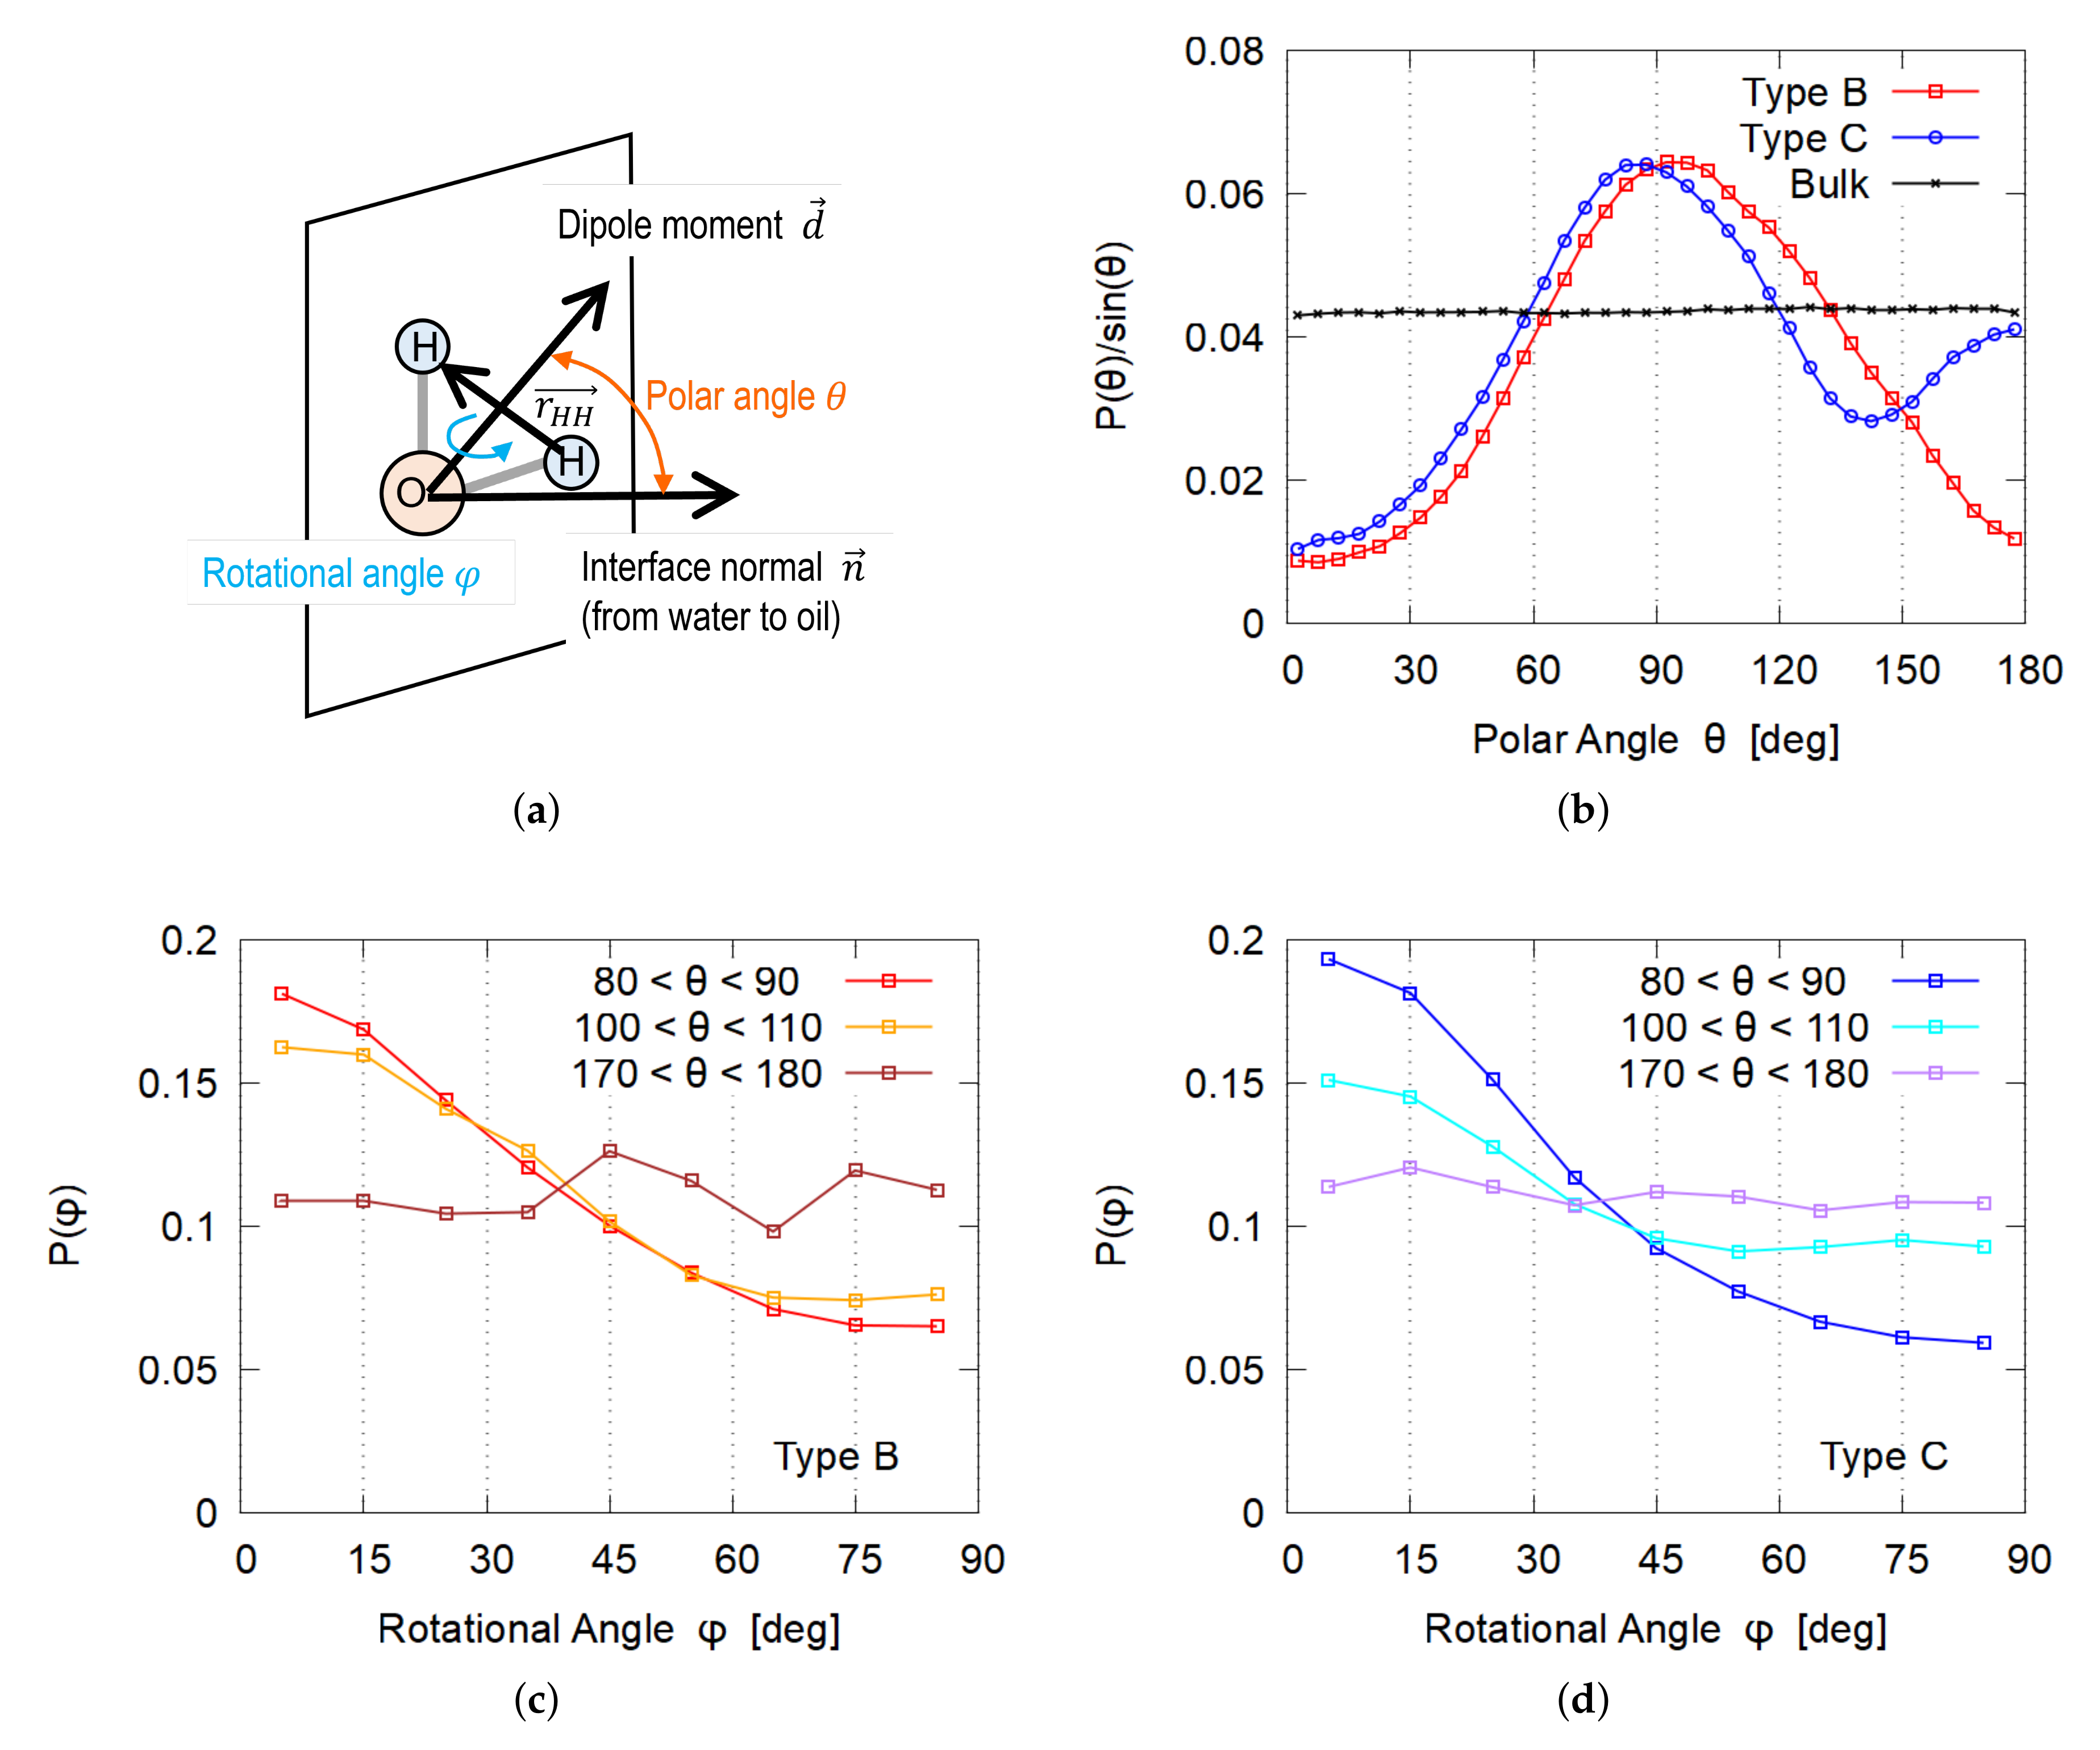
3.4. Orientation of Water Molecules
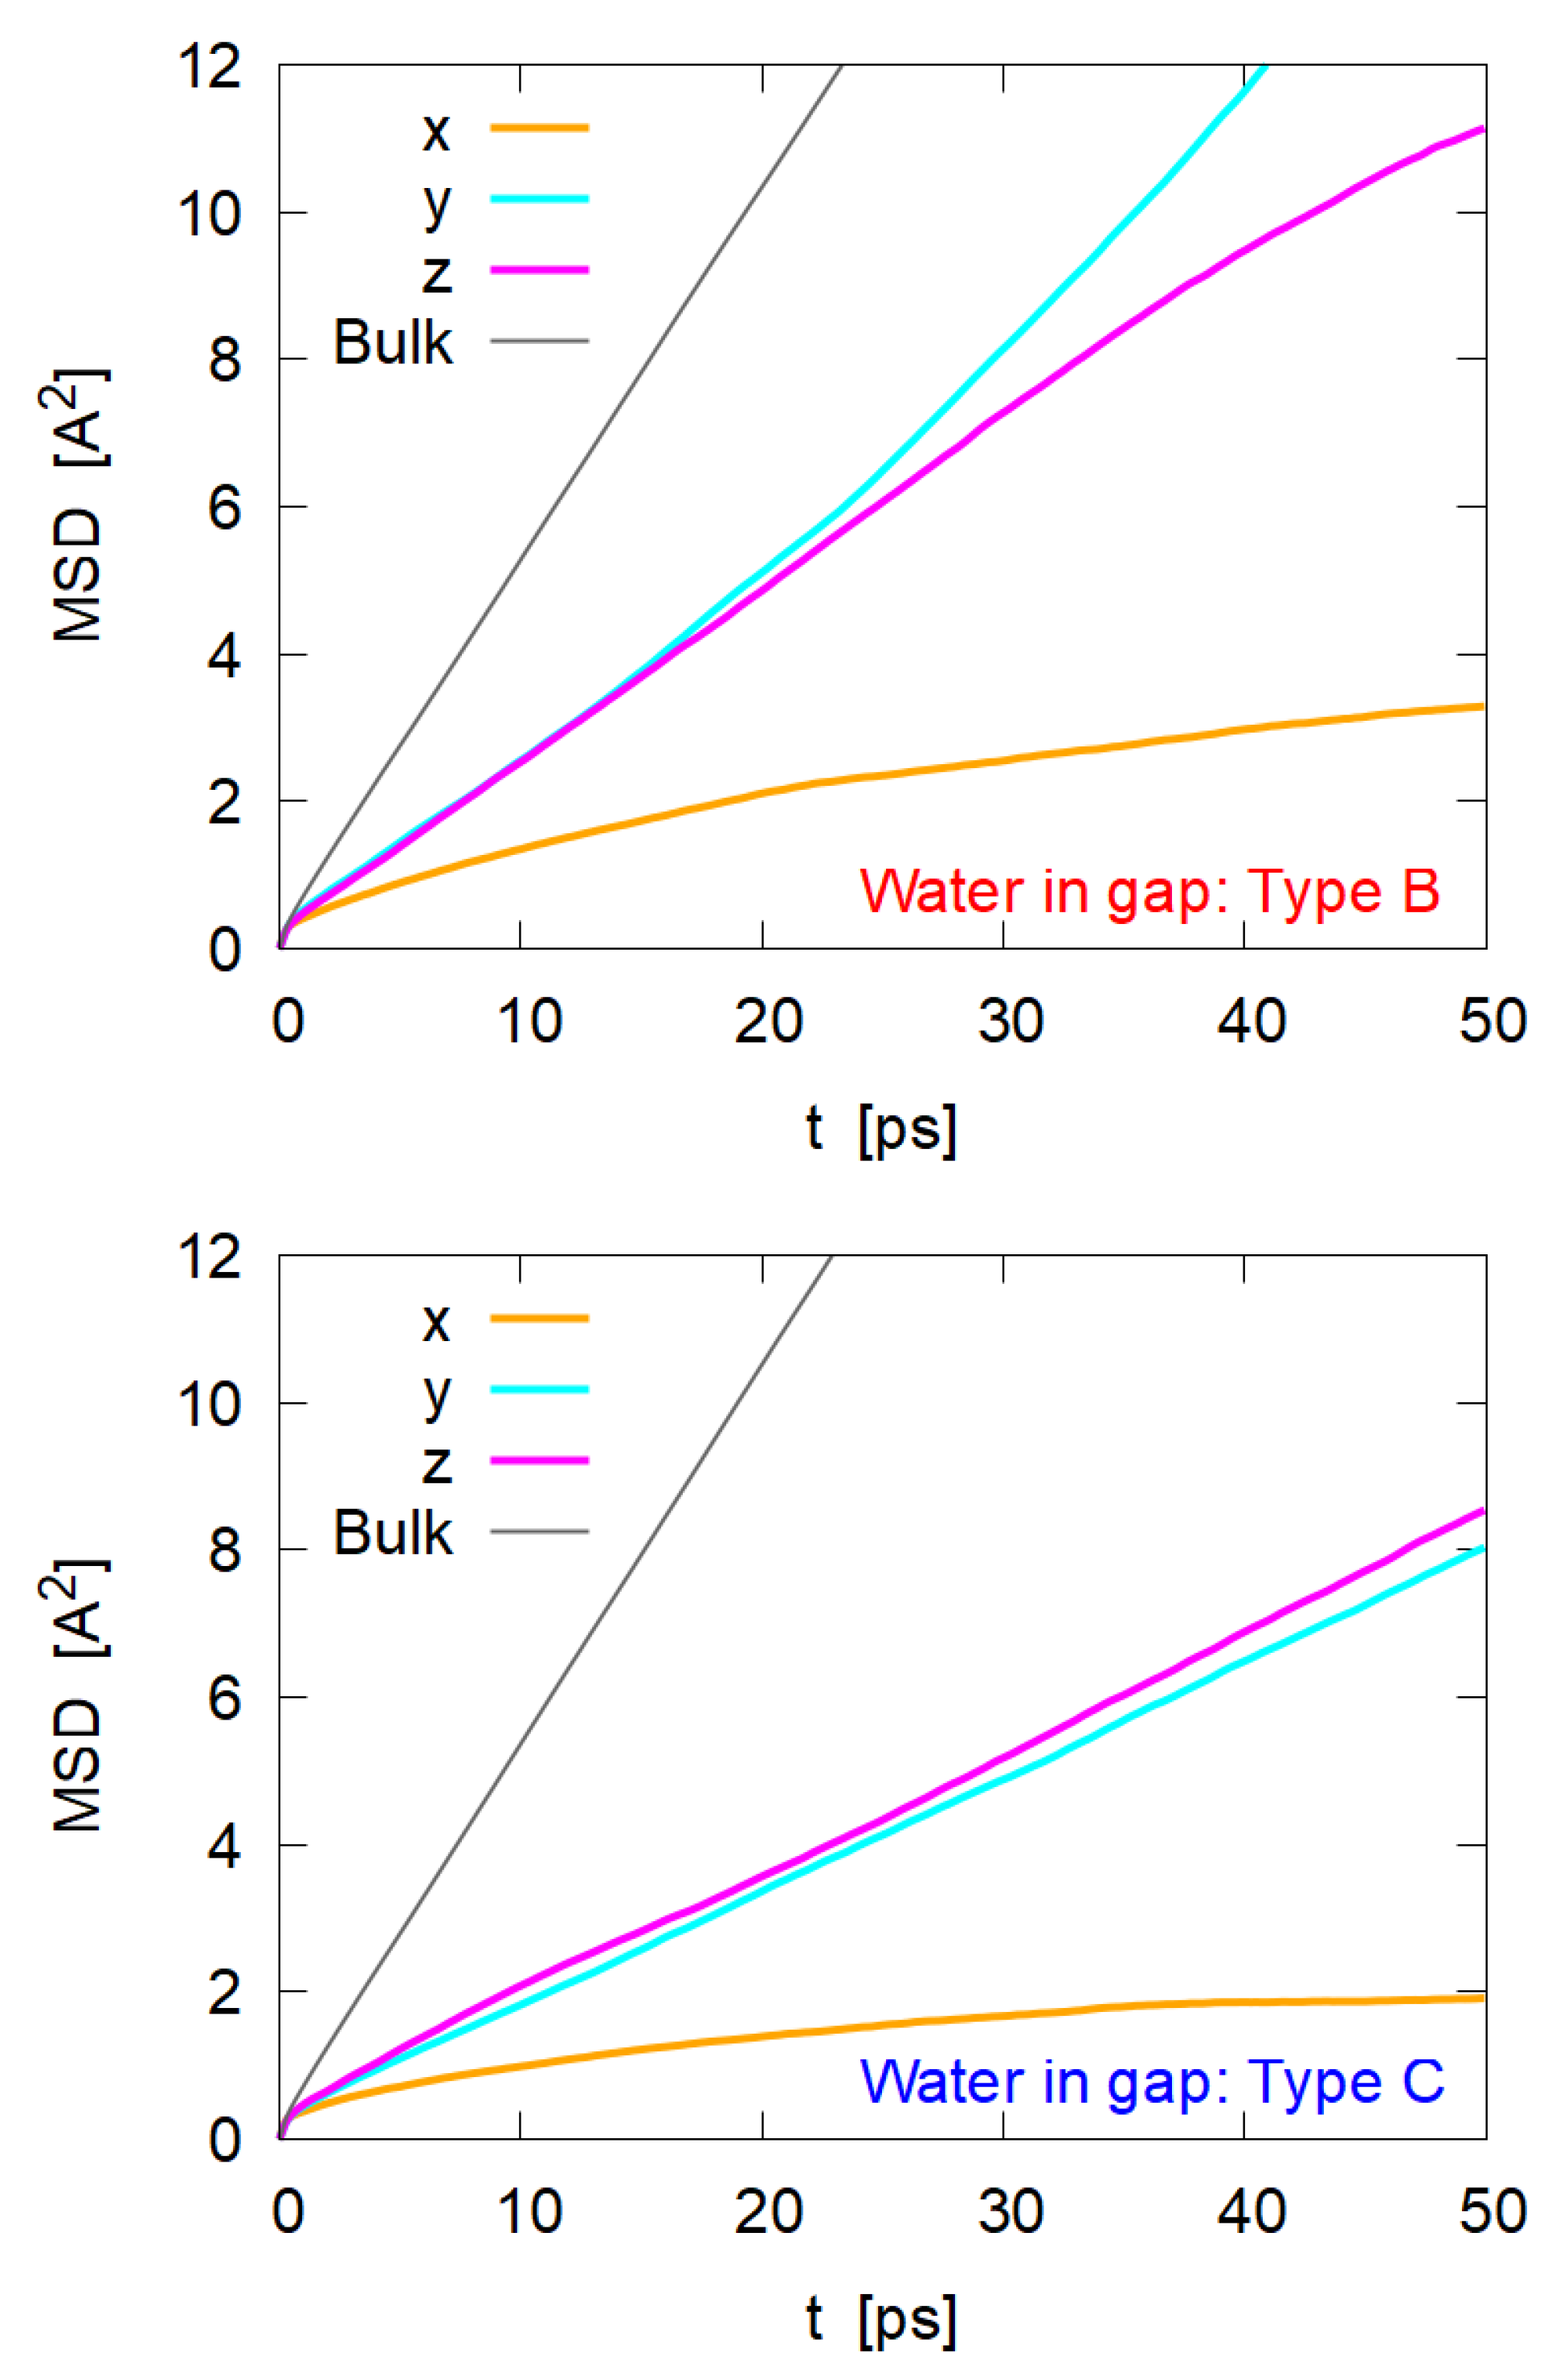
3.5. Diffusion of Water Molecules
- Since the gap distance is only 3–6 Å, it is reasonable that the motion along the x direction would be highly restricted;
- Motions along the y and z directions (i.e., parallel to the nanocrystal surface) are also restricted, but they still show to mobility of molecules in bulk phase;
- Comparing Type B and Type C, the diffusion in Type B is faster than that in Type C, suggesting that water between the oleophilic surface and the oil phase (Type C) is more structured or ordered;
- For Type B, water molecules seem to diffuse more easily to the y direction (i.e., crossing cellulose chains) than to the z direction along the cellulose chains.
3.6. Interface Deformation
4. Conclusions
Author Contributions
Funding
Institutional Review Board Statement
Informed Consent Statement
Data Availability Statement
Acknowledgments
Conflicts of Interest
References
- Klemm, D.; Kramer, F.; Moritz, S.; Lindström, T.; Ankerfors, M.; Gray, D.; Dorris, A. Nanocelluloses: A new family of nature-based materials. Angew. Chem. Int. Ed. 2011, 50, 5438. [Google Scholar] [CrossRef] [PubMed]
- Fujisawa, S.; Togawa, E.; Kuroda, K. Nanocellulose-stabilized Pickering emulsions and their applications. Sci. Technol. Adv. Mater. 2017, 18, 959. [Google Scholar] [CrossRef] [PubMed]
- Klemm, D.; Cranston, E.D.; Fischer, D.; Gama, M.; Kedzior, S.A.; Kralisch, D.; Kramer, F.; Kondo, T.; Lindström, T.; Nietzsche, S.; et al. Nanocellulose as a natural source for groundbreaking applications in materials science: Today’s state. Mater. Today 2018, 21, 720. [Google Scholar] [CrossRef] [Green Version]
- Heise, K.; Kontturi, E.; Allahverdiyeva, Y.; Tammelin, T.; Linder, M.B.; Nonappa; Ikkara, N.O. Nanocellulose: Recent fundamental advances and emerging biological and biomimicking applications. Adv. Mater. 2020, 33, 2004349. [Google Scholar] [CrossRef] [PubMed]
- Oza, K.P.; Frank, S.G. Microcrystalline cellulose stabilized emulsions. J. Disp. Sci. Technol. 1986, 7, 543. [Google Scholar] [CrossRef]
- Rein, D.M.; Khalfin, R.; Cohen, Y. Cellulose as a novel amphiphilic coating for oil-in-water and water-in-oil dispersions. J. Colloid Interface Sci. 2012, 386, 456. [Google Scholar] [CrossRef]
- Jia, X.; Xu, R.; Shen, W.; Xie, M.; Abid, M.; Jabbar, S.; Wang, P.; Zeng, X.; Wu, T. Stabilizing oil-in-water emulsion with amorphous cellulose. Food Hydrocoll. 2015, 43, 275. [Google Scholar] [CrossRef]
- Kalashnikova, K.; Bizot, H.; Bertoncini, P.; Cathala, B.; Capron, I. Cellulosic nanorods of various aspect ratios for oil in water Pickering emulsions. Soft Matter 2013, 9, 952. [Google Scholar] [CrossRef]
- Wen, C.; Yuan, Q.; Liang, H.; Vriesekoop, F. Preparation and stabilization of D-limonene Pickering emulsions by cellulose nanocrystals. Carbohydr. Polym. 2014, 112, 695. [Google Scholar] [CrossRef]
- Cherhal, F.; Cousin, F.; Capron, I. Structural description of the interface of Pickering emulsions stabilized by cellulose nanocrystals. Biomacromolecules 2016, 17, 496. [Google Scholar] [CrossRef]
- Biermann, O.; Hädicke, E.; Koltzenburg, S.; Müller-Plathe, F. Hydrophilicity and lipophilicity of cellulose crystal surfaces. Angew. Chem. Int. Ed. 2001, 40, 3822. [Google Scholar] [CrossRef]
- Alqus, R.; Eichhorn, S.J.; Bryce, R.A. Molecular dynamics of cellulose amphiphilicity at the graphene-water interface. Biomacromolecules 2015, 16, 1771. [Google Scholar] [CrossRef] [PubMed] [Green Version]
- Miyamoto, H.; Rein, D.M.; Ueda, K.; Yamane, C.; Cohen, Y. Molecular dynamics simulation of cellulose-coated oil-in-water emulsions. Cellulose 2017, 24, 2699. [Google Scholar] [CrossRef]
- Roux, B. The calculation of the potential of mean force using computer simulations. Comput. Phys. Commun. 1995, 91, 275. [Google Scholar] [CrossRef]
- Ensing, B.; de Vivo, M.; Liu, Z.; Moore, P.; Klein, M.L. Metadynamics as a tool for exploring free energy landscapes of chemical reactions. Accounts Chem. Res. 2006, 39, 73. [Google Scholar] [CrossRef]
- Branduardi, D.; Gervasio, F.L.; Parrinello, M. From a to B in free energy space. J. Chem. Phys. 2007, 126, 054103. [Google Scholar] [CrossRef]
- Sangiovanni, D.G.; Gueorguiev, G.K.; Kakanakova-Georgieva, A. Ab initio molecular dynamics of atomic-scale surface reactions: Insights into metal organic chemical vapor deposition of AlN on graphene. Phys. Chem. Chem. Phys. 2018, 20, 17751. [Google Scholar] [CrossRef] [Green Version]
- Chandler, D. Introduction to Modern Statistical Mechanics; Oxford University Press: Oxford, UK, 1987; p. 201. ISBN 9780195042771. [Google Scholar]
- Lammps Home Page. Available online: https://www.lammps.org/ (accessed on 5 March 2022).
- Vanommeslaeghe, K.; Hatcher, E.; Acharya, C.; Kundu, S.; Zhong, S.; Shim, J.; Darian, E.; Gucench, O.; Lopes, P.; Vorobyov, I.; et al. CHARMM general force field: A force fIield for drug-like molecules compatible with the CHARMM all-atom additive biological force fields. J. Comput. Chem. 2010, 31, 671. [Google Scholar] [CrossRef] [Green Version]
- Langan, P.; Sukumar, N.; Nishiyama, Y.; Chanzy, H. Synchrotron X-ray structures of cellulose Iβ and regenerated cellulose II at ambient temperature and 100 K. Cellulose 2005, 12, 551. [Google Scholar] [CrossRef]
- Kroon-Batenburg, L.M.J.; Bouma, B.; Kroon, J. Stability of cellulose structures studies by MD simulations. Could Mercerized cellulose II be parallel? Macromoleclules 1996, 29, 5695. [Google Scholar] [CrossRef]
- Jorgensen, W.L.; Chandrasekhar, J.; Madura, J.D.; Impey, R.W.; Klein, M.L. Comparison of simple potential functions for simulating liquid water. J. Chem. Phys. 1983, 79, 926. [Google Scholar] [CrossRef]
- Zhang, Y.; Feller, S.E.; Brooks, B.R.; Pastor, R.W. Computer simulation of liquid/liquid interfaces. I. Theory and application to octane/water. J. Chem. Phys. 1995, 103, 10252. [Google Scholar] [CrossRef]
- Hassan, M.E.; Nielsen, R.F.; Calhoun, J.C. Effect of pressure and temperature on oil-water interfacial tensions for a series of hydrocarbons. Petrol. Trans. AIME 1953, 198, 299. [Google Scholar] [CrossRef]
- Nosé, S. A unified formulation of the constant temperature molecular dynamics methods. J. Chem. Phys. 1984, 81, 511. [Google Scholar] [CrossRef] [Green Version]
- Hockney, R.W.; Eastwood, J.W. Computer Simulation Using Particles; Taylor & Francis: New York, NY, USA, 1988; pp. 120–151. ISBN 9780852743928. [Google Scholar]
- Chen, Q.; Zheng, J.; Xu, Y.; Yin, S.; Liu, F.; Tang, C. Surface modification improves fabrication of Pickering high internal phase emulsions stabilized by cellulose nanocrystals. Food Hydrocoll. 2018, 75, 125. [Google Scholar] [CrossRef]
- Wilson, M.A.; Pohorille, A. Molecular dynamics of the water liquid-vapor interface. J. Phys. Chem. 1987, 91, 4873. [Google Scholar] [CrossRef]
- Matsumoto, M.; Kataoka, Y. Study on liquid vapor interface of water. 1. Simulational results of thermodynamic properties and orientational structure. J. Chem. Phys. 1988, 88, 3233. [Google Scholar] [CrossRef]
- Linse, P. Monte Carlo simulation of liquid-liquid benzene-water interface. J. Chem. Phys. 1987, 86, 4177. [Google Scholar] [CrossRef]
- van Buuren, A.R.; Marrink, S.J.; Berendsen, H.J.C. A molecular dynamics study of the decane/water interface. J. Phys. Chem. 1993, 97, 9206. [Google Scholar] [CrossRef] [Green Version]
- Wang, J.H. Self-diffusion coefficients of water. J. Phys. Chem. 1965, 69, 4412. [Google Scholar] [CrossRef]
- Tsimpanogiannis, I.N.; Moultos, O.A.; Franco, L.F.M.; Spera, M.B.d.; Erdös, M.; Economou, I.G. Self-diffusion coefficient of bulk and confined water: A critical review of classical molecular simulation studies. Mol. Sim. 2019, 45, 425. [Google Scholar] [CrossRef] [Green Version]
- Sendner, C.; Horinek, D.; Bocquet, L.; Netz, R.R. Interfacial water at hydrophobic and hydrophilic surfaces: Slip, viscosity, and diffusion. Langmuir 2009, 25, 10768. [Google Scholar] [CrossRef] [PubMed]
- Jeddi, M.K.; Castrillón, S.R.-V. Dynamics of water monolayers confined by chemically heterogeneous surfaces: Observation of surface-induced anisotropic diffusion. J. Phys. Chem. B 2017, 121, 9666. [Google Scholar] [CrossRef] [PubMed]
- Pal, S.; Mondal, S.; Pal, P.; Das, A.; Pramanik, S.; Maity, J. Fabrication of durable, fluorine-free superhydrophobic cotton fabric for efficient self-cleaning and heavy/light oil-water separation. Colloid Interface Sci. Commun. 2021, 44, 100469. [Google Scholar] [CrossRef]
- Ge, J.; Wu, G.; Yoon, S.; Kim, M.; Choi, N. Study on the preparation and lipophilic properties of polyvinyl alcohol (PVA) nanofiber membranes via green electrospinning. Nanomaterials 2021, 11, 2514. [Google Scholar] [CrossRef] [PubMed]


| Cell Size | 205.0 Å × 80.0 Å × 41.4 Å | |
| Temperature | 300 K | |
| Density | Water | 989.0 kg/m3 |
| Octane | 759.0 kg/m3 | |
| Number of atoms in cellulose nanocrystal | 2688 | |
| Number of molecules | Water | typically 11,000 |
| Octane | typically 1300 | |
| Distance of potential cutoff in real space | 10 Å | |
| Accepted relative errors in PPPM | 10−4 | |
| Time step | 0.5 fs | |
| Total number of steps for each case | (2.5 ns) |
| Cross-Sectional View | Enlarged View | |
|---|---|---|
| Type A: Direct contact kcal/mol | 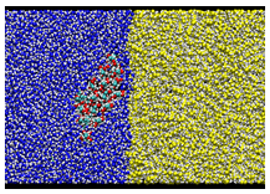 | 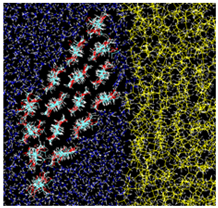 |
| Type B: Hydrophilic surface/Water/Oil kcal/mol | 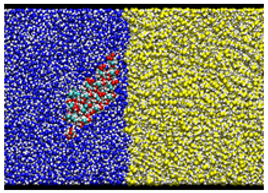 |  |
| Type C: Oleophilic surface/Water/Oil kcal/mol |  |  |
| In Gap | Bulk | |||
|---|---|---|---|---|
| [10−8 m2/s] | Type B | Type C | Our Simulation | Experiment [33] |
| Normal to surface: Dx | <0.02 | <0.005 | ||
| Crossing chain array: Dy | 0.17 | 0.078 | 0.27 | 0.257 (at 25 °C) |
| Along chains: Dz | 0.12 | 0.085 | ||
Publisher’s Note: MDPI stays neutral with regard to jurisdictional claims in published maps and institutional affiliations. |
© 2022 by the authors. Licensee MDPI, Basel, Switzerland. This article is an open access article distributed under the terms and conditions of the Creative Commons Attribution (CC BY) license (https://creativecommons.org/licenses/by/4.0/).
Share and Cite
Ito, K.; Matsumoto, M. Adsorption Free Energy of Cellulose Nanocrystal on Water–Oil Interface. Nanomaterials 2022, 12, 1321. https://doi.org/10.3390/nano12081321
Ito K, Matsumoto M. Adsorption Free Energy of Cellulose Nanocrystal on Water–Oil Interface. Nanomaterials. 2022; 12(8):1321. https://doi.org/10.3390/nano12081321
Chicago/Turabian StyleIto, Kenya, and Mitsuhiro Matsumoto. 2022. "Adsorption Free Energy of Cellulose Nanocrystal on Water–Oil Interface" Nanomaterials 12, no. 8: 1321. https://doi.org/10.3390/nano12081321
APA StyleIto, K., & Matsumoto, M. (2022). Adsorption Free Energy of Cellulose Nanocrystal on Water–Oil Interface. Nanomaterials, 12(8), 1321. https://doi.org/10.3390/nano12081321