
Analysis of the Effect of Electrode Materials on the Sensitivity of Quartz Crystal Microbalance


Abstract
:1. Introduction
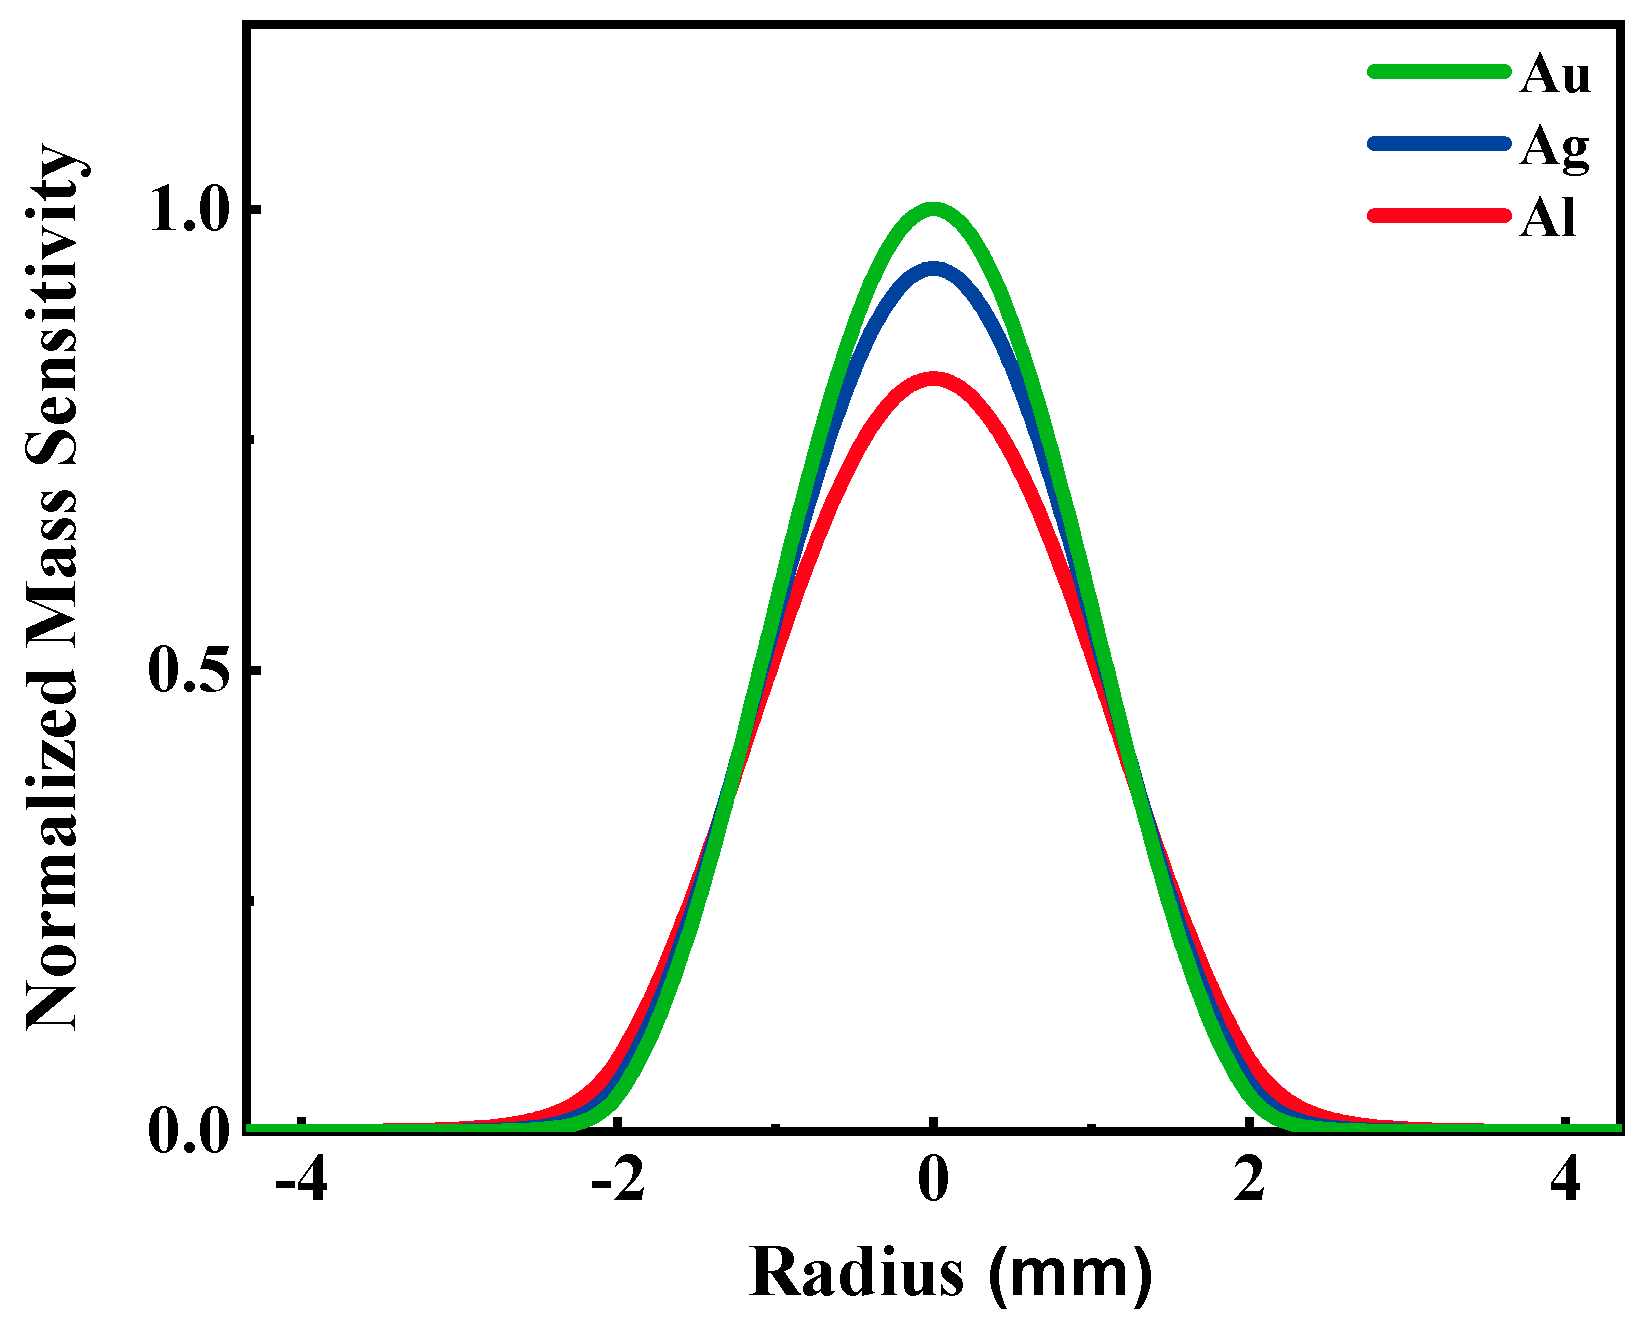
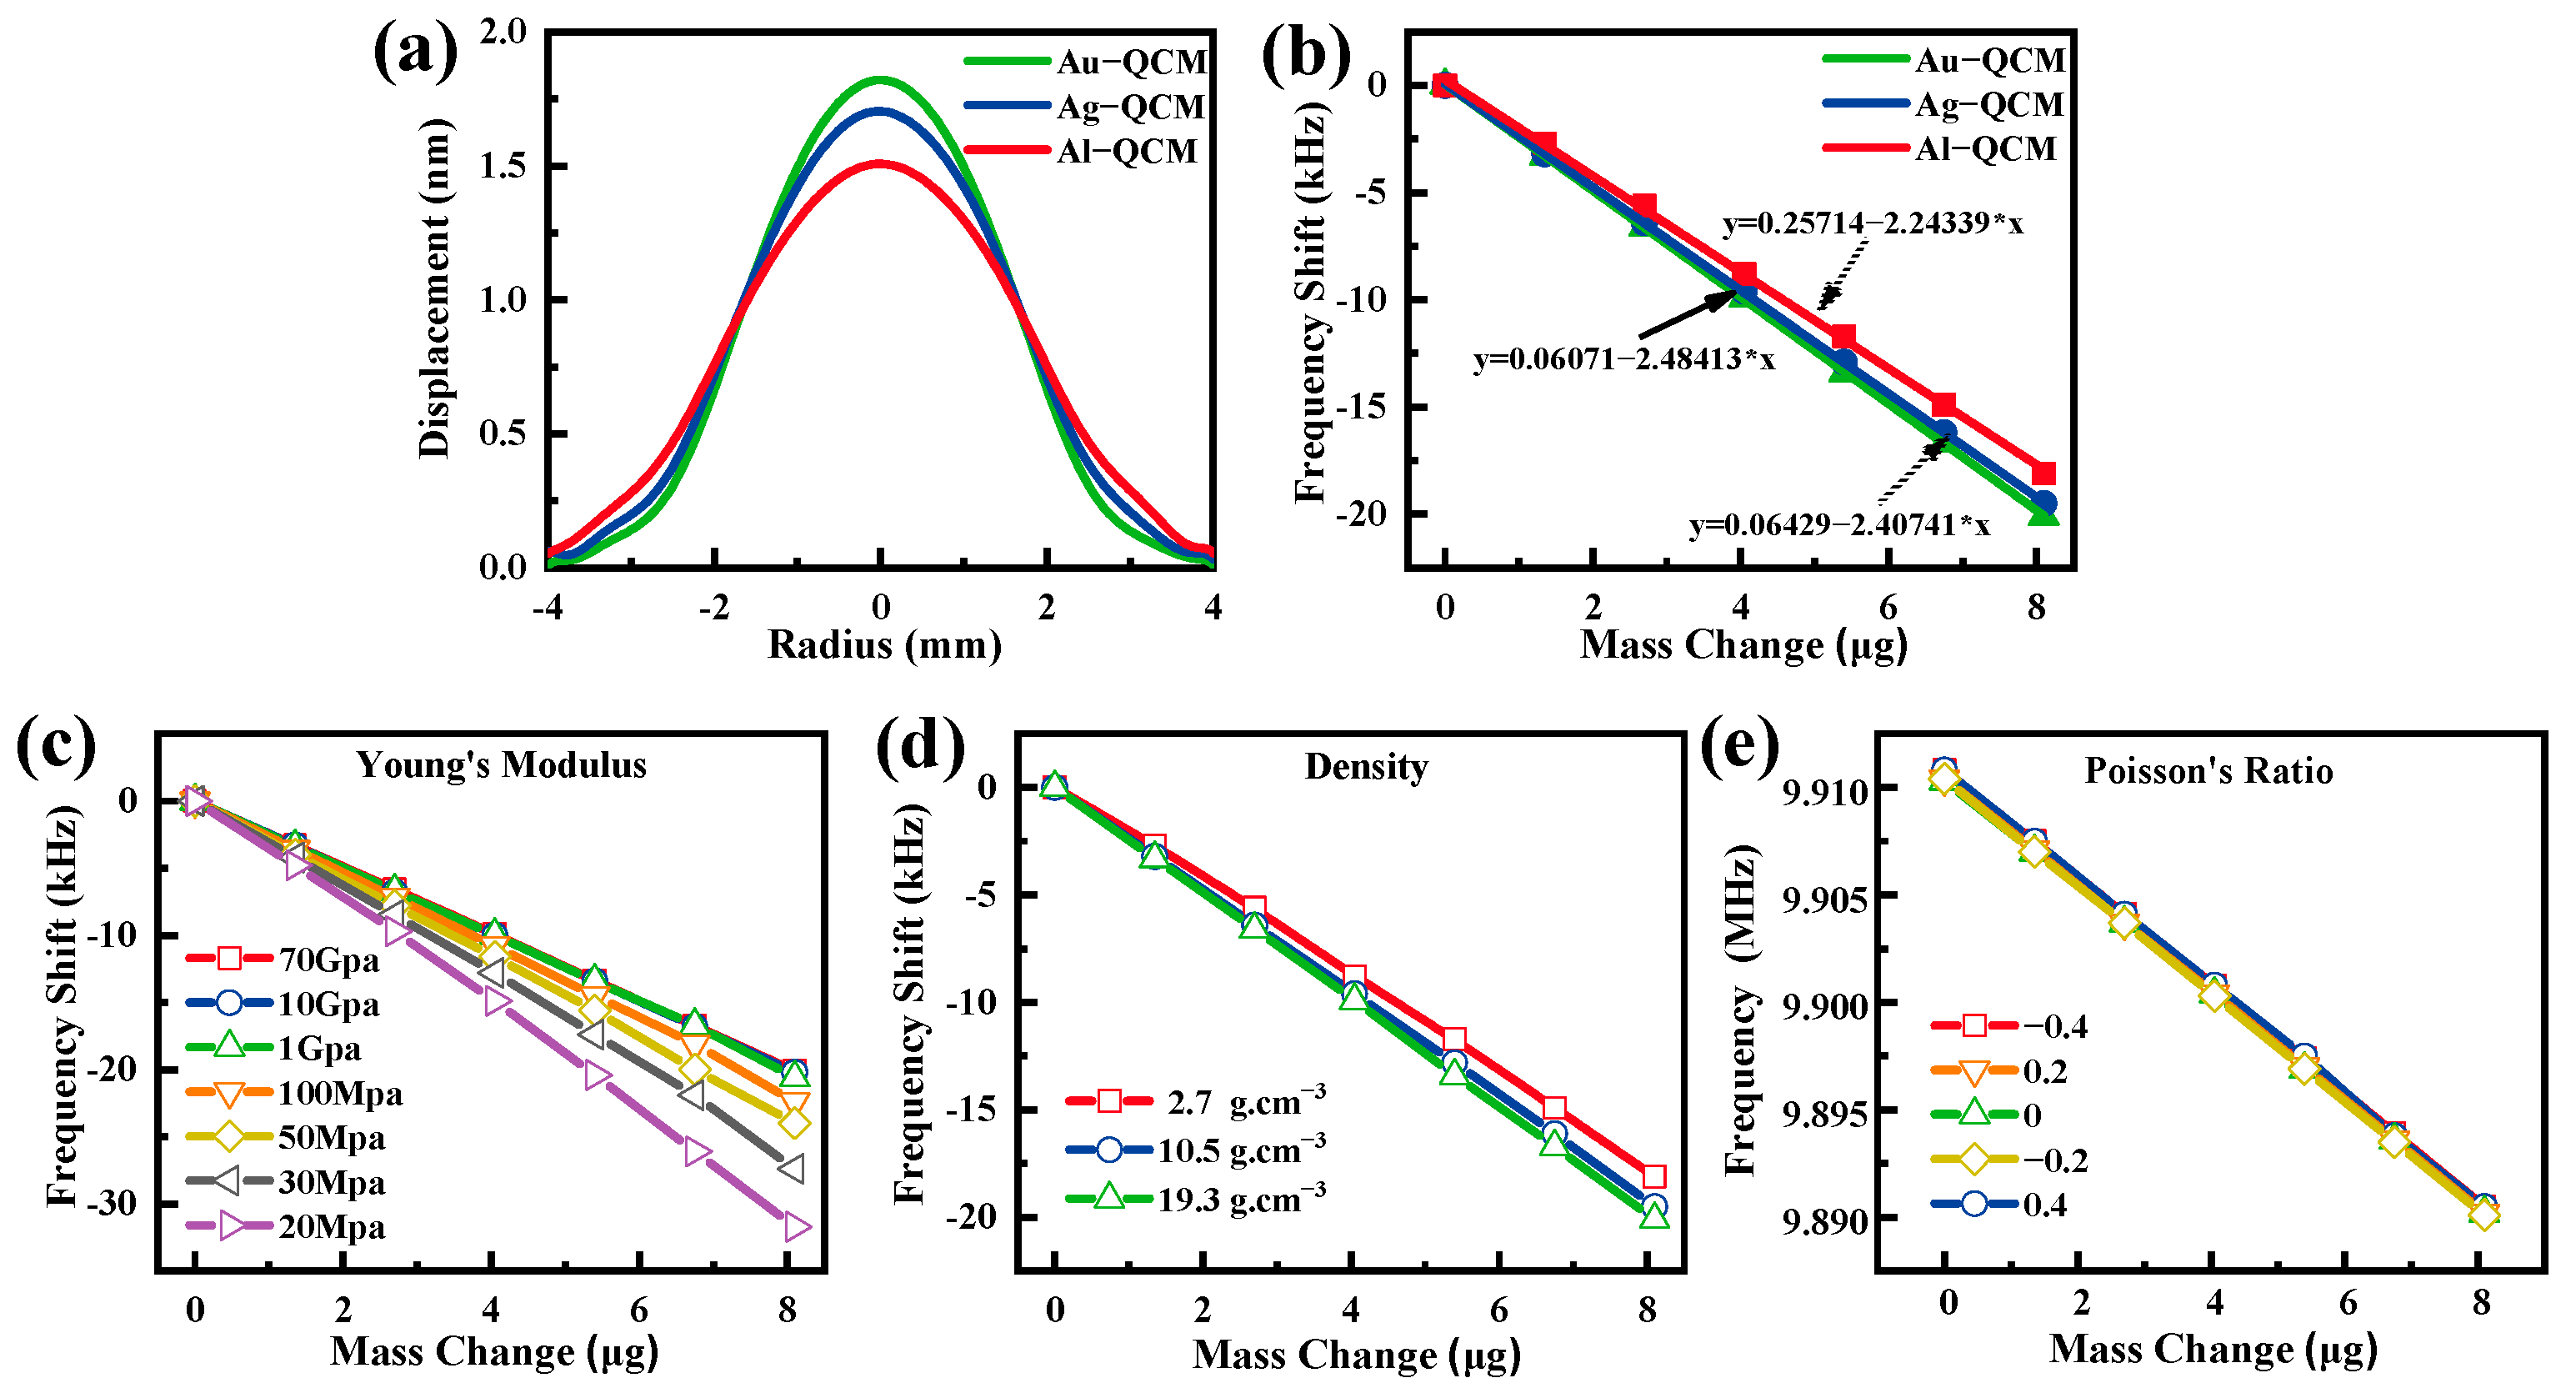
2. Theory
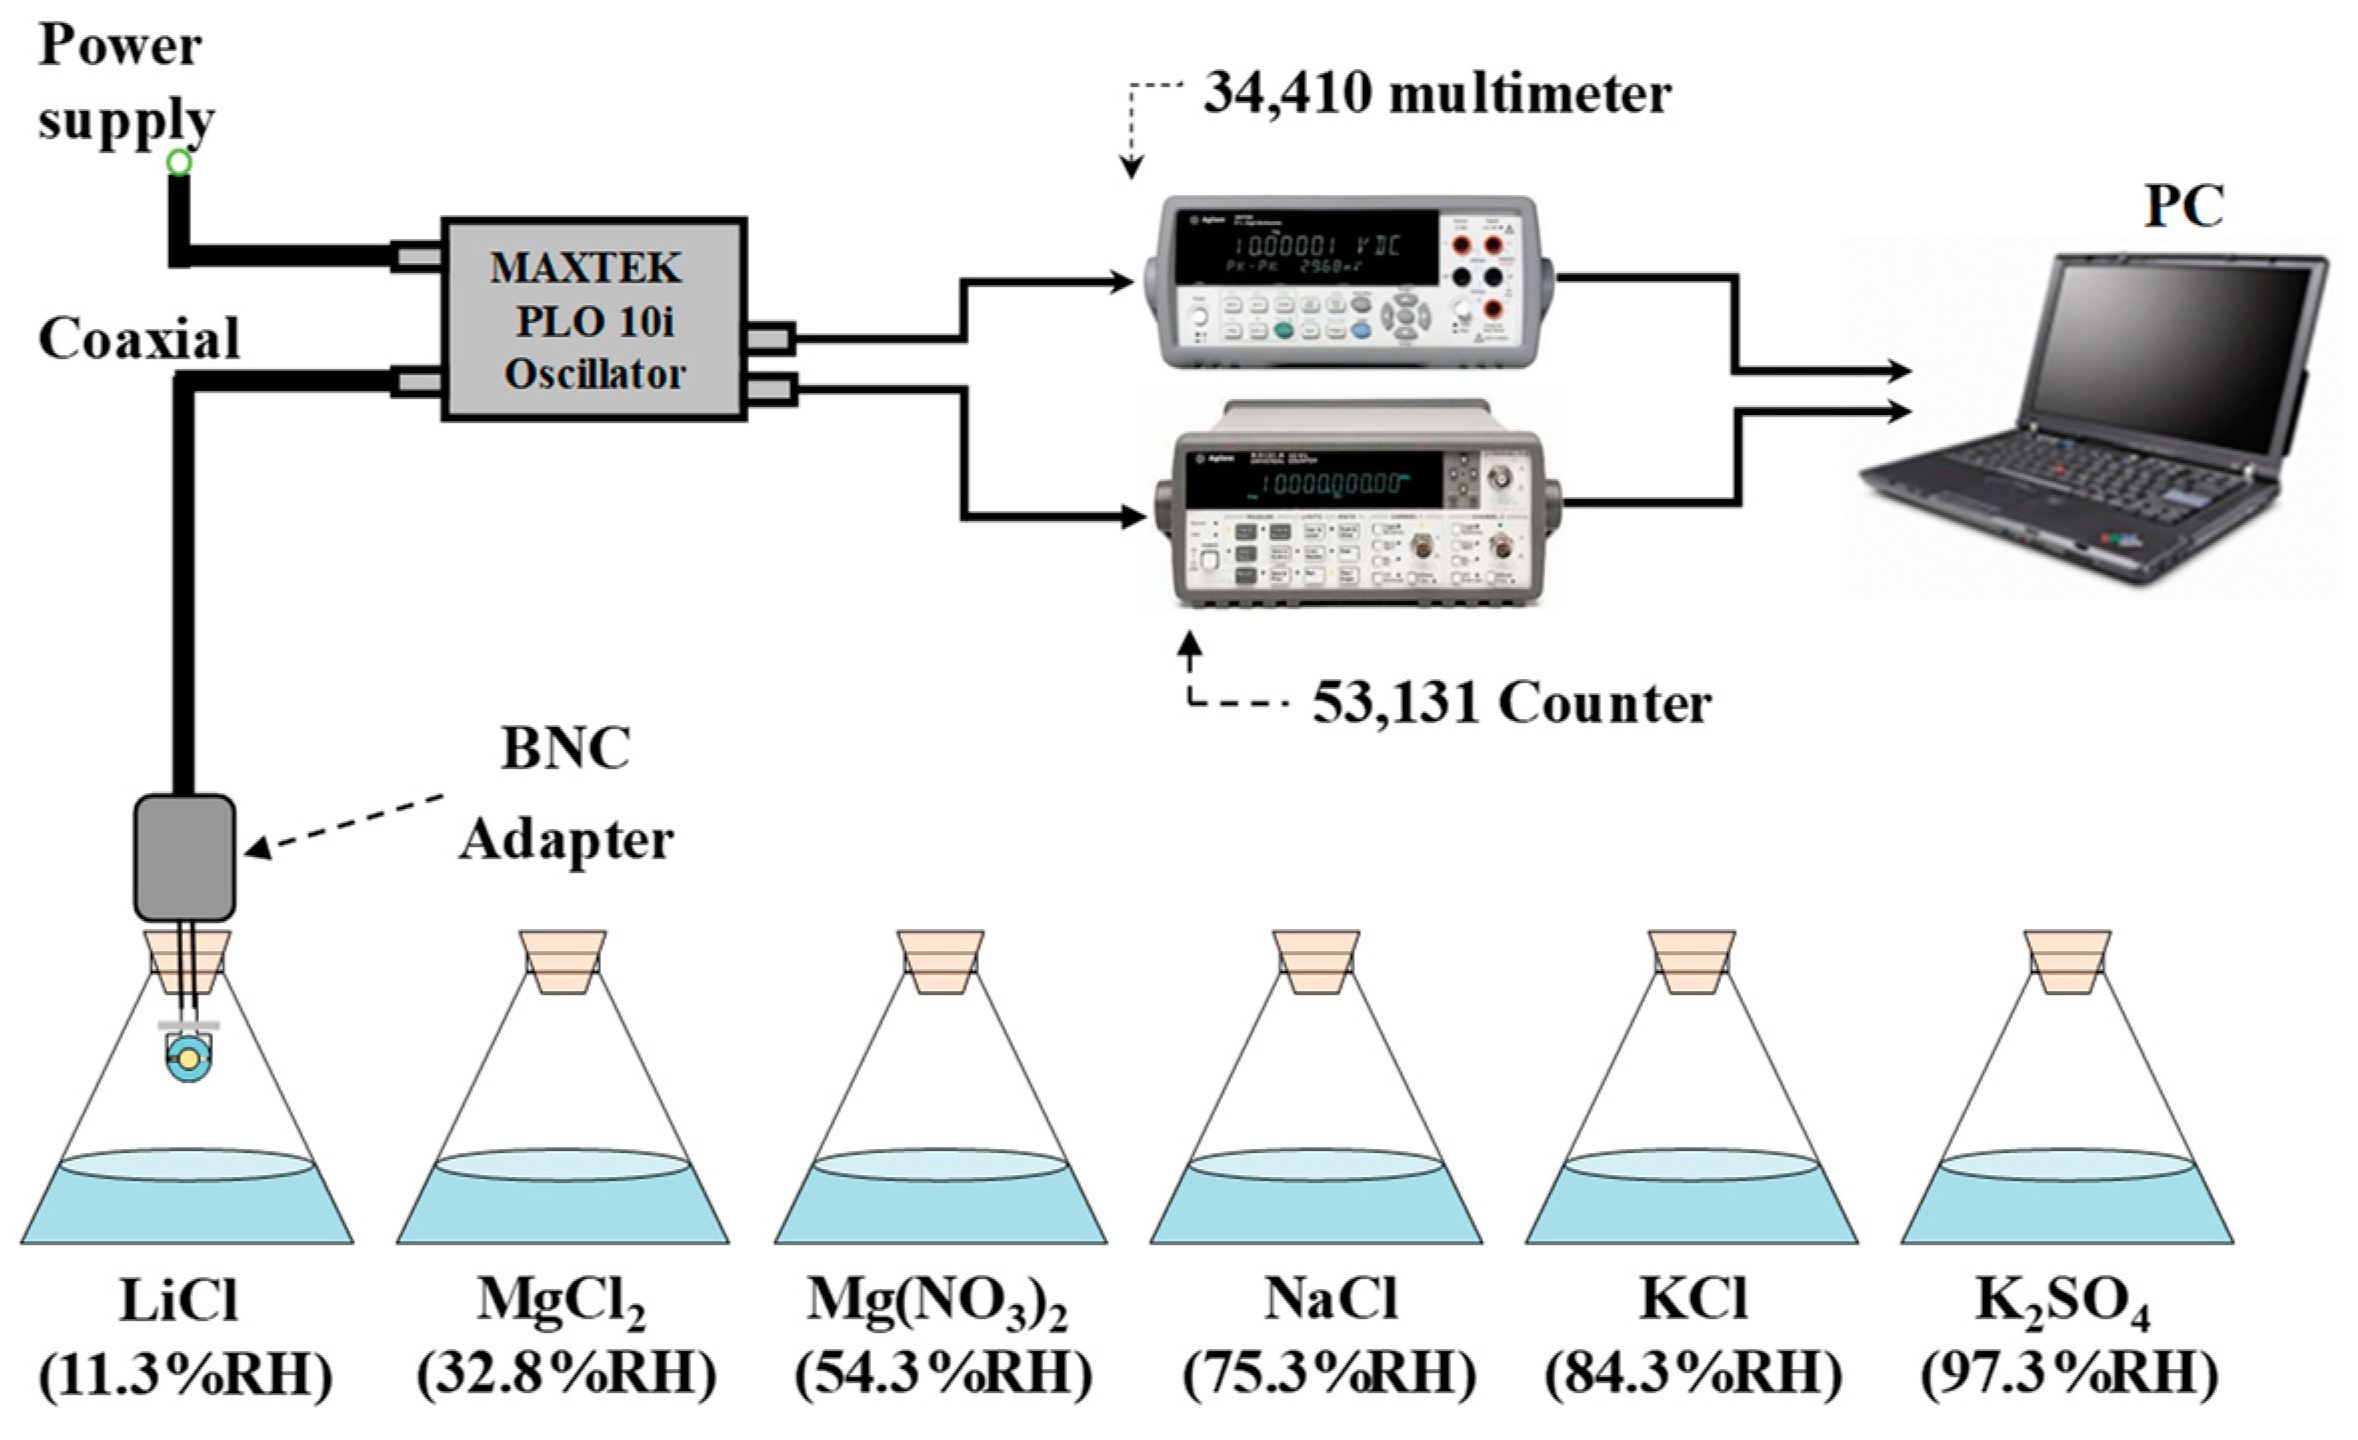
3. Experiment
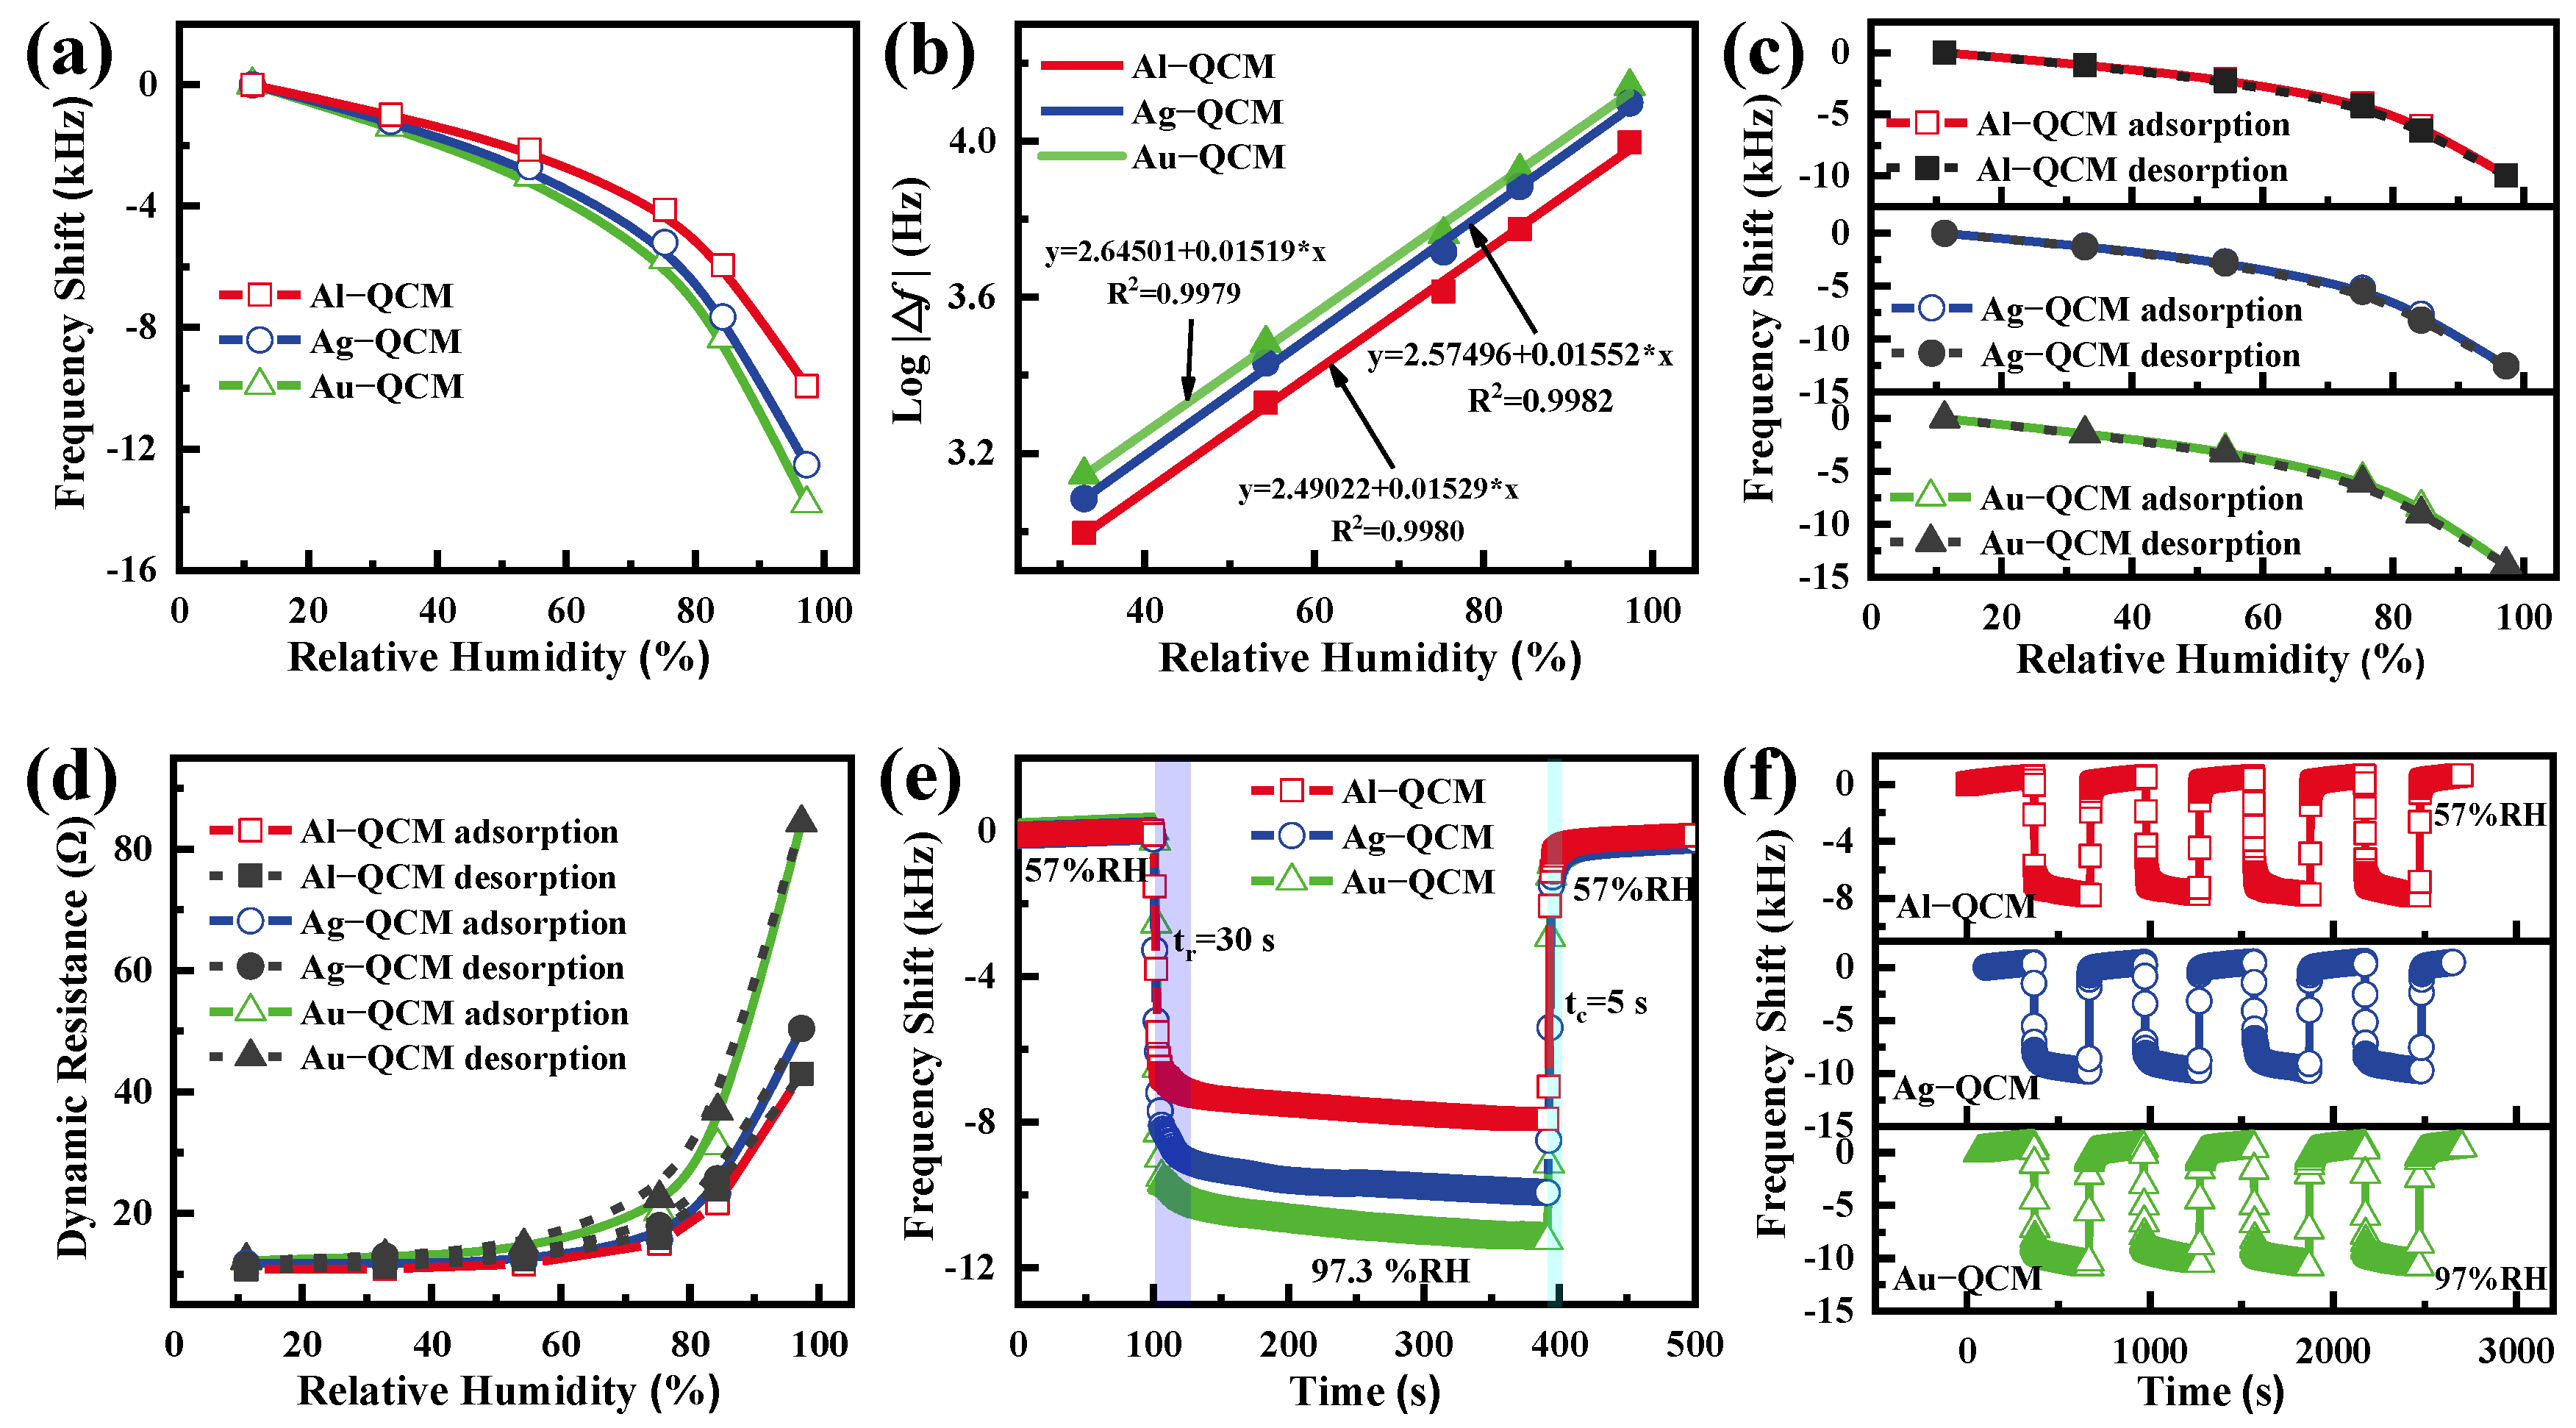
4. Results and Discussion
5. Conclusions
Author Contributions
Funding
Conflicts of Interest
References
- Lim, H.J.; Saha, T.; Tey, B.T.; Tan, W.S.; Ooi, C.W. Quartz crystal microbalance-based biosensors as rapid diagnostic devices for infectious diseases. Biosens. Bioelectron. 2020, 168, 112513. [Google Scholar] [CrossRef] [PubMed]
- Noi, K.; Ikenaka, K.; Mochizuki, H.; Goto, Y.; Ogi, H. Disaggregation Behavior of Amyloid β Fibrils by Anthocyanins Studied by Total-Internal-Reflection-Fluorescence Microscopy Coupled with a Wireless Quartz-Crystal Microbalance Biosensor. Anal. Chem. 2021, 93, 11176–11183. [Google Scholar] [CrossRef] [PubMed]
- Li, D.; Xie, Z.; Qu, M.; Zhang, Q.; Fu, Y.; Xie, J. Virtual Sensor Array Based on Butterworth–Van Dyke Equivalent Model of QCM for Selective Detection of Volatile Organic Compounds. ACS Appl. Mater. Interfaces 2021, 13, 47043–47051. [Google Scholar] [CrossRef] [PubMed]
- Fauzi, F.; Rianjanu, A.; Santoso, I.; Triyana, K. Gas and humidity sensing with quartz crystal microbalance (QCM) coated with graphene-based materials—A mini review. Sens. Actuators A Phys. 2021, 330, 112837. [Google Scholar] [CrossRef]
- Ji, Y.; Yin, Z.-W.; Yang, Z.; Deng, Y.-P.; Chen, H.; Lin, C.; Yang, L.; Yang, K.; Zhang, M.; Xiao, Q.; et al. From bulk to interface: Electrochemical phenomena and mechanism studies in batteries via electrochemical quartz crystal microbalance. Chem. Soc. Rev. 2021, 50, 10743–10763. [Google Scholar] [CrossRef]
- Torad, N.L.; El-Hosainy, H.; Esmat, M.; El-Kelany, K.E.; Tahawy, R.; Na, J.; Ide, Y.; Fukata, N.; Chaikittisilp, W.; Hill, J.P.; et al. Phenyl-Modified Carbon Nitride Quantum Nanoflakes for Ultra-Highly Selective Sensing of Formic Acid: A Combined Experimental by QCM and Density Functional Theory Study. ACS Appl. Mater. Interfaces 2021, 13, 48595–48610. [Google Scholar] [CrossRef]
- Miller, J.G.; Bolef, D.I. Acoustic wave analysis of the operation of quartz-crystal film-thickness monitors. J. Appl. Phys. 1968, 39, 5815–5816. [Google Scholar] [CrossRef]
- Yao, Y.; Huang, X.; Zhang, B.; Zhang, Z.; Hou, D.; Zhou, Z. Facile fabrication of high sensitivity cellulose nanocrystals based QCM humidity sensors with asymmetric electrode structure. Sens. Actuators B Chem. 2020, 302, 127192. [Google Scholar] [CrossRef]
- Chen, Q.; Huang, X.; Yao, Y.; Luo, K.; Pan, H.; Wang, Q. Ringed Electrode Configuration Enhances the Sensitivity of QCM Humidity Sensor Based on Lignin Through Fringing Field Effect. IEEE Sens. J. 2021, 21, 22450–22458. [Google Scholar] [CrossRef]
- Yao, Y.; Huang, X.; Chen, Q.; Zhang, Z.; Ling, W. High sensitivity and high stability QCM humidity sensors based on polydopamine coated cellulose nanocrystals/graphene oxide nanocomposite. Nanomaterials 2020, 10, 2210. [Google Scholar] [CrossRef]
- Kartanas, T.; Levin, A.; Toprakcioglu, Z.; Scheidt, T.; Hakala, T.A.; Charmet, J.; Knowles, T.P.J. Label-Free Protein Analysis Using Liquid Chromatography with Gravimetric Detection. Anal. Chem. 2021, 93, 2848–2853. [Google Scholar] [CrossRef] [PubMed]
- Sauerbrey, G. Verwendung von Schwingquarzen zur Wägung dünner Schichten und zur Mikrowägung. Z. Phys. 1959, 155, 206–222. [Google Scholar] [CrossRef]
- Josse, F.; Lee, Y.; Martin, S.J.; Cernosek, R.W. Analysis of the radial dependence of mass sensitivity for modified-electrode quartz crystal resonators. Anal. Chem. 1998, 70, 237–247. [Google Scholar] [CrossRef]
- Huang, X.; Chen, Q.; Pan, W.; Hu, J. The Effect of Electrode thickness on Mass Sensitivity of QCM Cannot Be Ignored. IEEE Trans. Ultrason. Ferroelectr. Freq. Control 2020, 68, 1458–1461. [Google Scholar] [CrossRef] [PubMed]
- Chen, Q.; Huang, X.; Pan, W.; Xu, Y.; Fan, Z. Investigation on mass sensitivity of n-m type electrode quartz crystal microbalance. Sensors 2019, 19, 2125. [Google Scholar] [CrossRef] [PubMed] [Green Version]
- Huang, X.; Chen, Q.; Pan, W.; Hu, J.; Yao, Y. Assessing the mass sensitivity for different electrode materials commonly used in quartz crystal microbalances (QCMs). Sensors 2019, 19, 3968. [Google Scholar] [CrossRef] [Green Version]
- Huang, X.; Pan, W.; Hu, J.; Bai, Q. The exploration and confirmation of the maximum mass sensitivity of quartz crystal microbalance. IEEE Trans. Ultrason. Ferroelectr. Freq. Control 2018, 65, 1888–1892. [Google Scholar] [CrossRef]
- Pan, W.; Huang, X.; Chen, Q. Analysis of the Uniformization of the QCM Mass Sensitivity Distribution through a Dot Multiring Electrode Structure. Anal. Chem. 2021, 93, 16828–16834. [Google Scholar] [CrossRef]
- Huang, X.; Bai, Q.; Pan, W.; Hu, J. Quartz crystal microbalance with approximately uniform sensitivity distribution. Anal. Chem. 2018, 90, 6367–6370. [Google Scholar] [CrossRef]
- Richardson, A.; Bhethanabotla, V.R.; Smith, A.L.; Josse, F. Patterned electrodes for thickness shear mode quartz resonators to achieve uniform mass sensitivity distribution. IEEE Sens. J. 2009, 9, 1772–1777. [Google Scholar] [CrossRef]
- Liu, X.; Zhang, D.; Wang, D.; Li, T.; Song, X.; Kang, Z. A humidity sensing and respiratory monitoring system constructed from quartz crystal microbalance sensors based on a chitosan/polypyrrole composite film. J. Mater. Chem. A 2021, 9, 14524–14533. [Google Scholar] [CrossRef]
- Zhang, D.; Song, X.; Wang, Z.; Chen, H. Ultra-highly sensitive humidity sensing by polydopamine/graphene oxide nanostructure on quartz crystal microbalance. Appl. Surf. Sci. 2021, 538, 147816. [Google Scholar] [CrossRef]
- Yuan, Z.; Tai, H.; Ye, Z.; Liu, C.; Xie, G.; Du, X.; Jiang, Y. Novel highly sensitive QCM humidity sensor with low hysteresis based on graphene oxide (GO)/poly(ethyleneimine) layered film. Sens. Actuators B Chem. 2016, 234, 145–154. [Google Scholar] [CrossRef]
- Yao, Y.; Chen, X.; Guo, H.; Wu, Z. Graphene oxide thin film coated quartz crystal microbalance for humidity detection. Appl. Surf. Sci. 2011, 257, 7778–7782. [Google Scholar] [CrossRef]
- Lv, C.; Hu, C.; Luo, J.; Liu, S.; Qiao, Y.; Zhang, Z.; Song, J.; Shi, Y.; Cai, J.; Watanabe, A. Recent Advances in Graphene-Based Humidity Sensors. Nanomaterials 2019, 9, 422. [Google Scholar] [CrossRef] [Green Version]
- Yao, Y.; Chen, X.; Ma, W.; Ling, W. Quartz crystal microbalance humidity sensors based on nanodiamond sensing films. IEEE Trans. Nanotechnol. 2014, 13, 386–393. [Google Scholar] [CrossRef]


| Au-QCM | 9,960,680 | 9,943,400 | 17,280 |
| Ag-QCM | 9,996,550 | 9,980,120 | 16,430 |
| Al-QCM | 10,031,820 | 10,019,350 | 12,470 |
Publisher’s Note: MDPI stays neutral with regard to jurisdictional claims in published maps and institutional affiliations. |
© 2022 by the authors. Licensee MDPI, Basel, Switzerland. This article is an open access article distributed under the terms and conditions of the Creative Commons Attribution (CC BY) license (https://creativecommons.org/licenses/by/4.0/).
Share and Cite
Chen, Q.; Huang, X.; Yao, Y.; Mao, K. Analysis of the Effect of Electrode Materials on the Sensitivity of Quartz Crystal Microbalance. Nanomaterials 2022, 12, 975. https://doi.org/10.3390/nano12060975
Chen Q, Huang X, Yao Y, Mao K. Analysis of the Effect of Electrode Materials on the Sensitivity of Quartz Crystal Microbalance. Nanomaterials. 2022; 12(6):975. https://doi.org/10.3390/nano12060975
Chicago/Turabian StyleChen, Qiao, Xianhe Huang, Yao Yao, and Kunlei Mao. 2022. "Analysis of the Effect of Electrode Materials on the Sensitivity of Quartz Crystal Microbalance" Nanomaterials 12, no. 6: 975. https://doi.org/10.3390/nano12060975
APA StyleChen, Q., Huang, X., Yao, Y., & Mao, K. (2022). Analysis of the Effect of Electrode Materials on the Sensitivity of Quartz Crystal Microbalance. Nanomaterials, 12(6), 975. https://doi.org/10.3390/nano12060975