
Enhanced Fe-TiO2 Solar Photocatalysts on Porous Platforms for Water Purification

 ,
, 
 ,
,  ,
,  ,
,  and
and 
Abstract
:
1. Introduction
2. Experimental Procedure
2.1. Preparation of Pure and Fe-TiO2 Nanostructures via Surfactant-Assisted Microwave Irradiation
2.2. Impregnation of Nanoparticles in Polymeric Substrates by Drop-Casting
2.3. Photocatalytic Activity
3. Characterization Techniques
4. Results and Discussion
4.1. Characterization of the Synthesized Nanoparticles
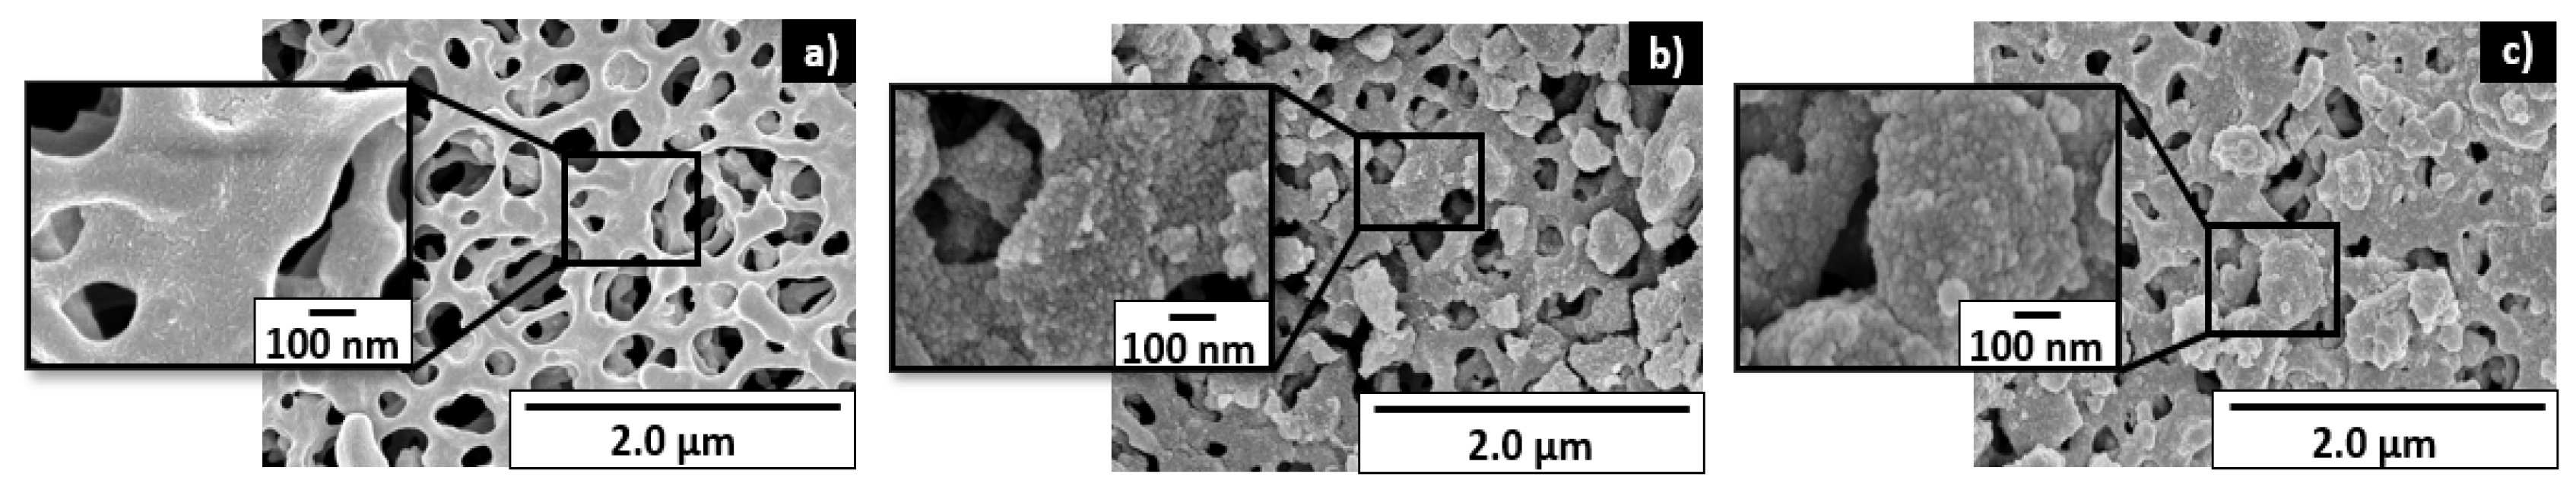
4.1.1. SEM Analysis
4.1.2. XRD Analysis
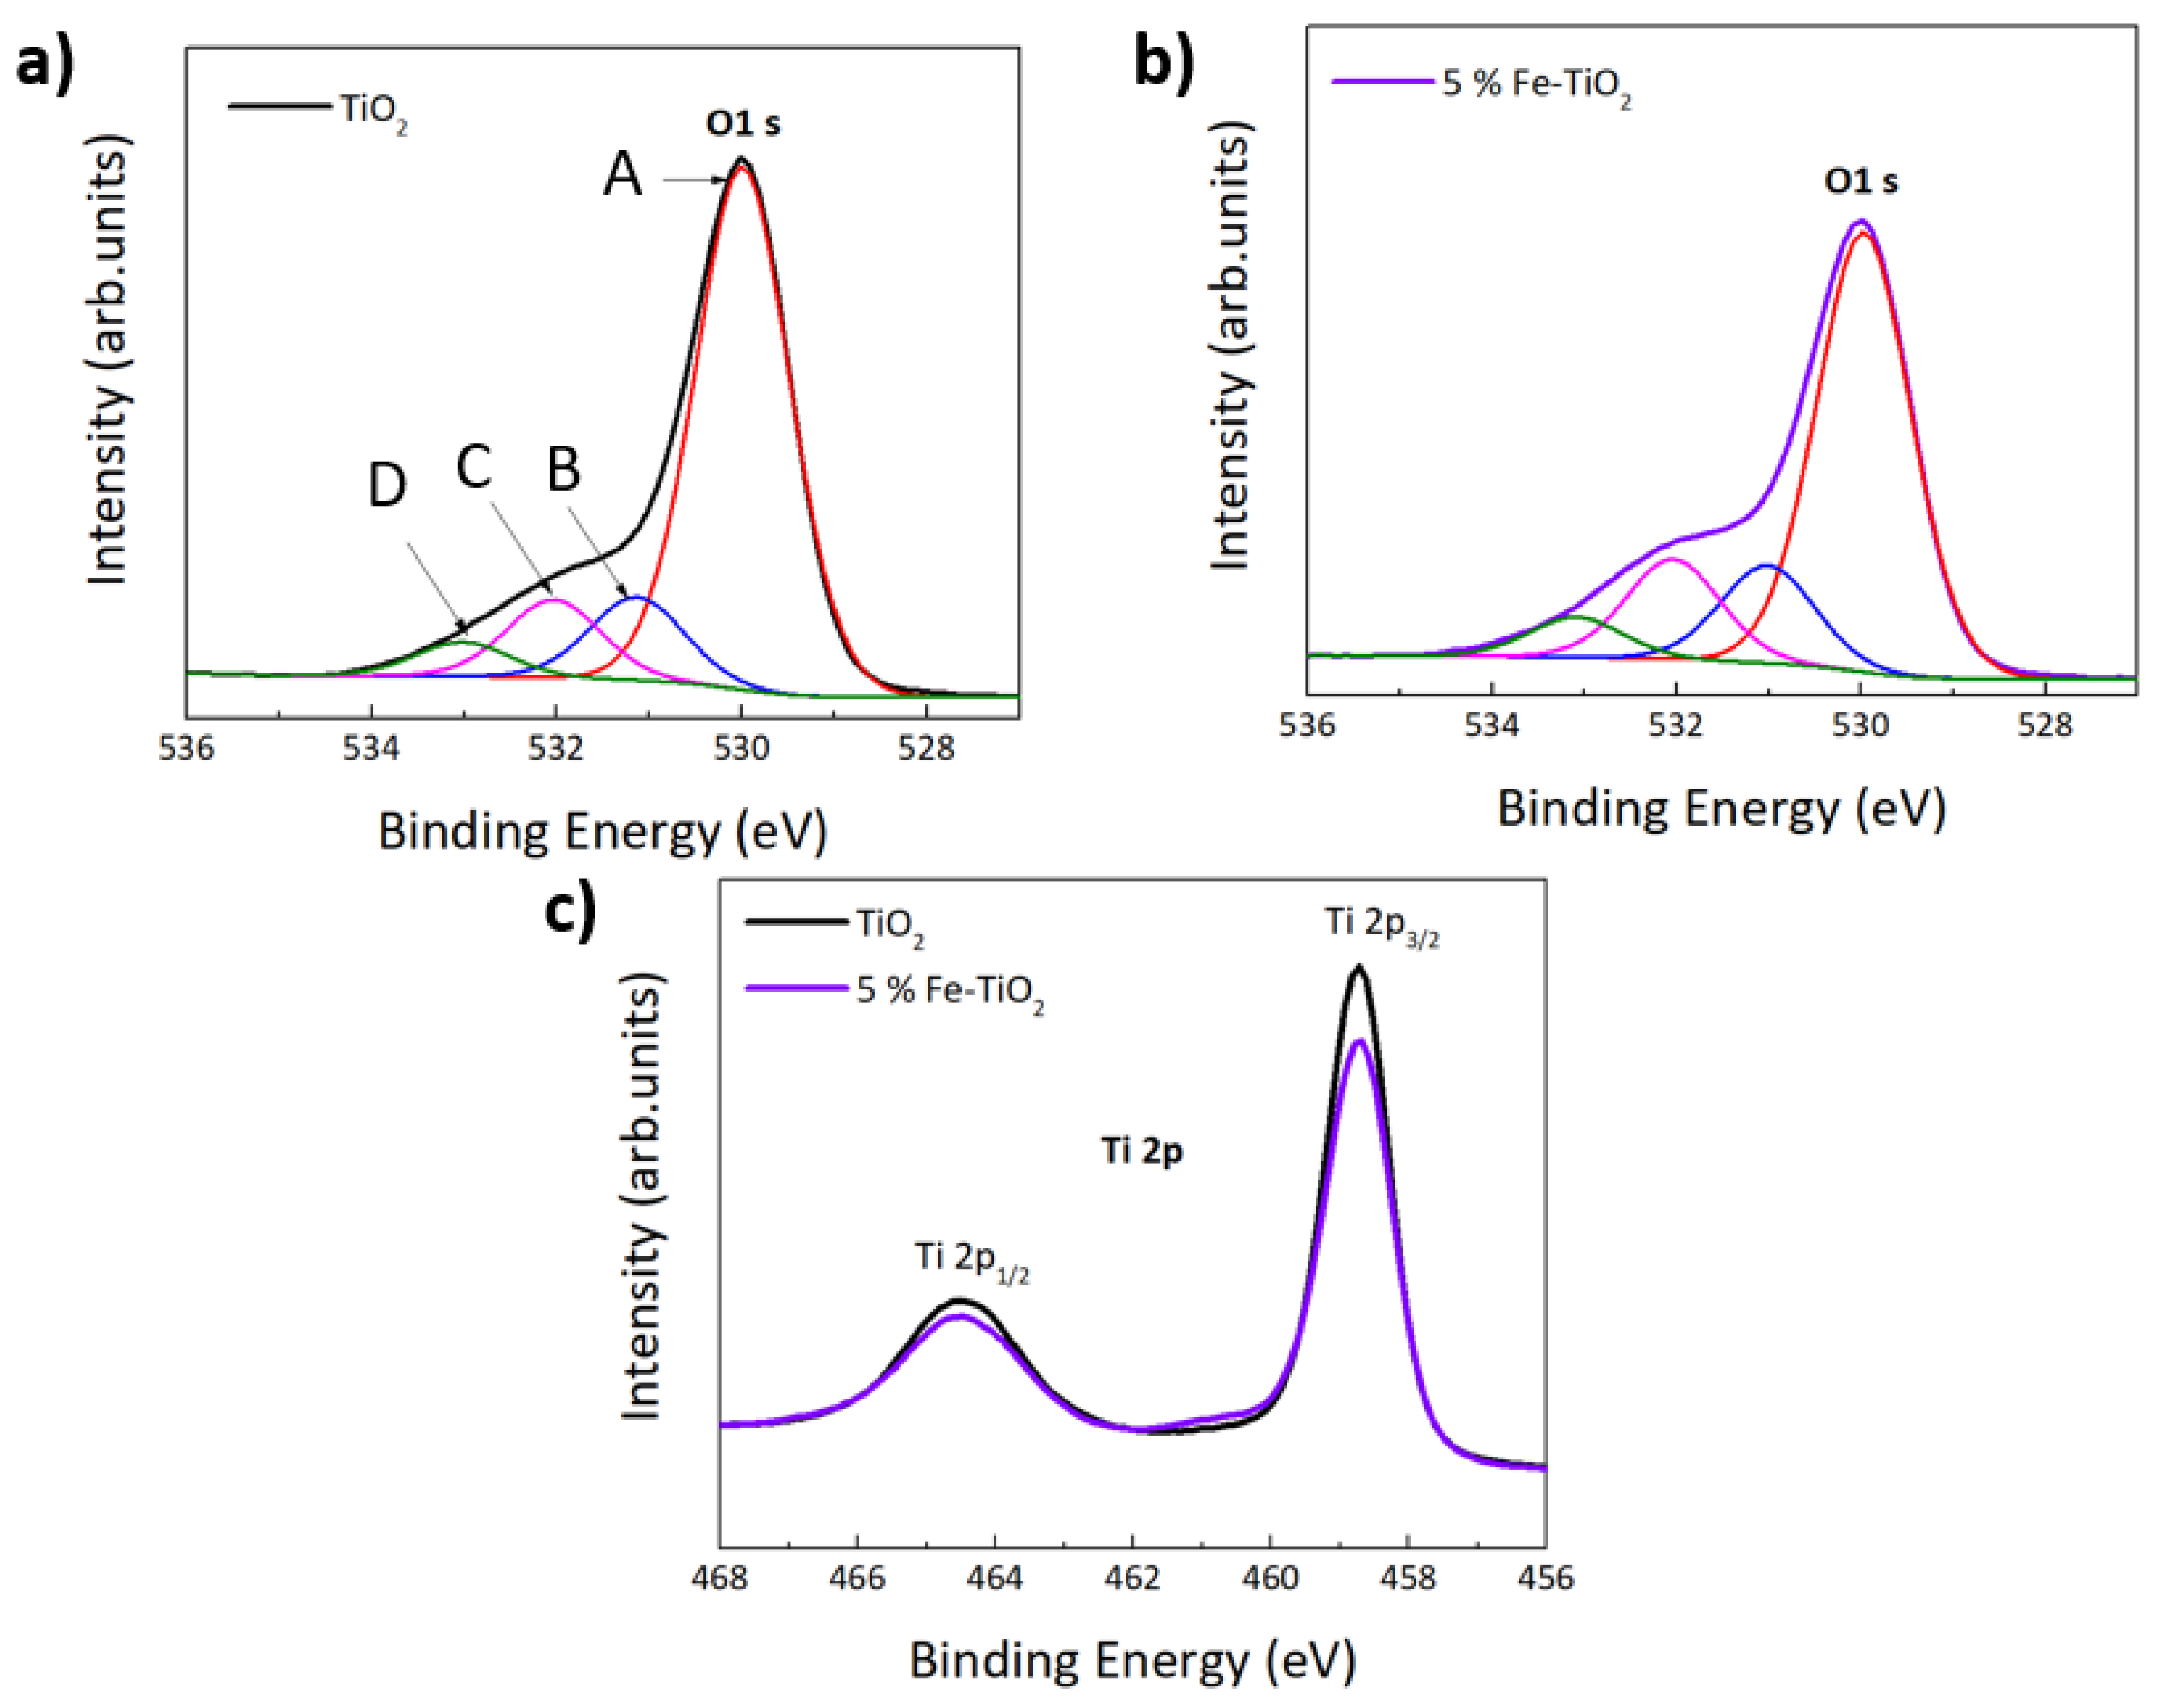
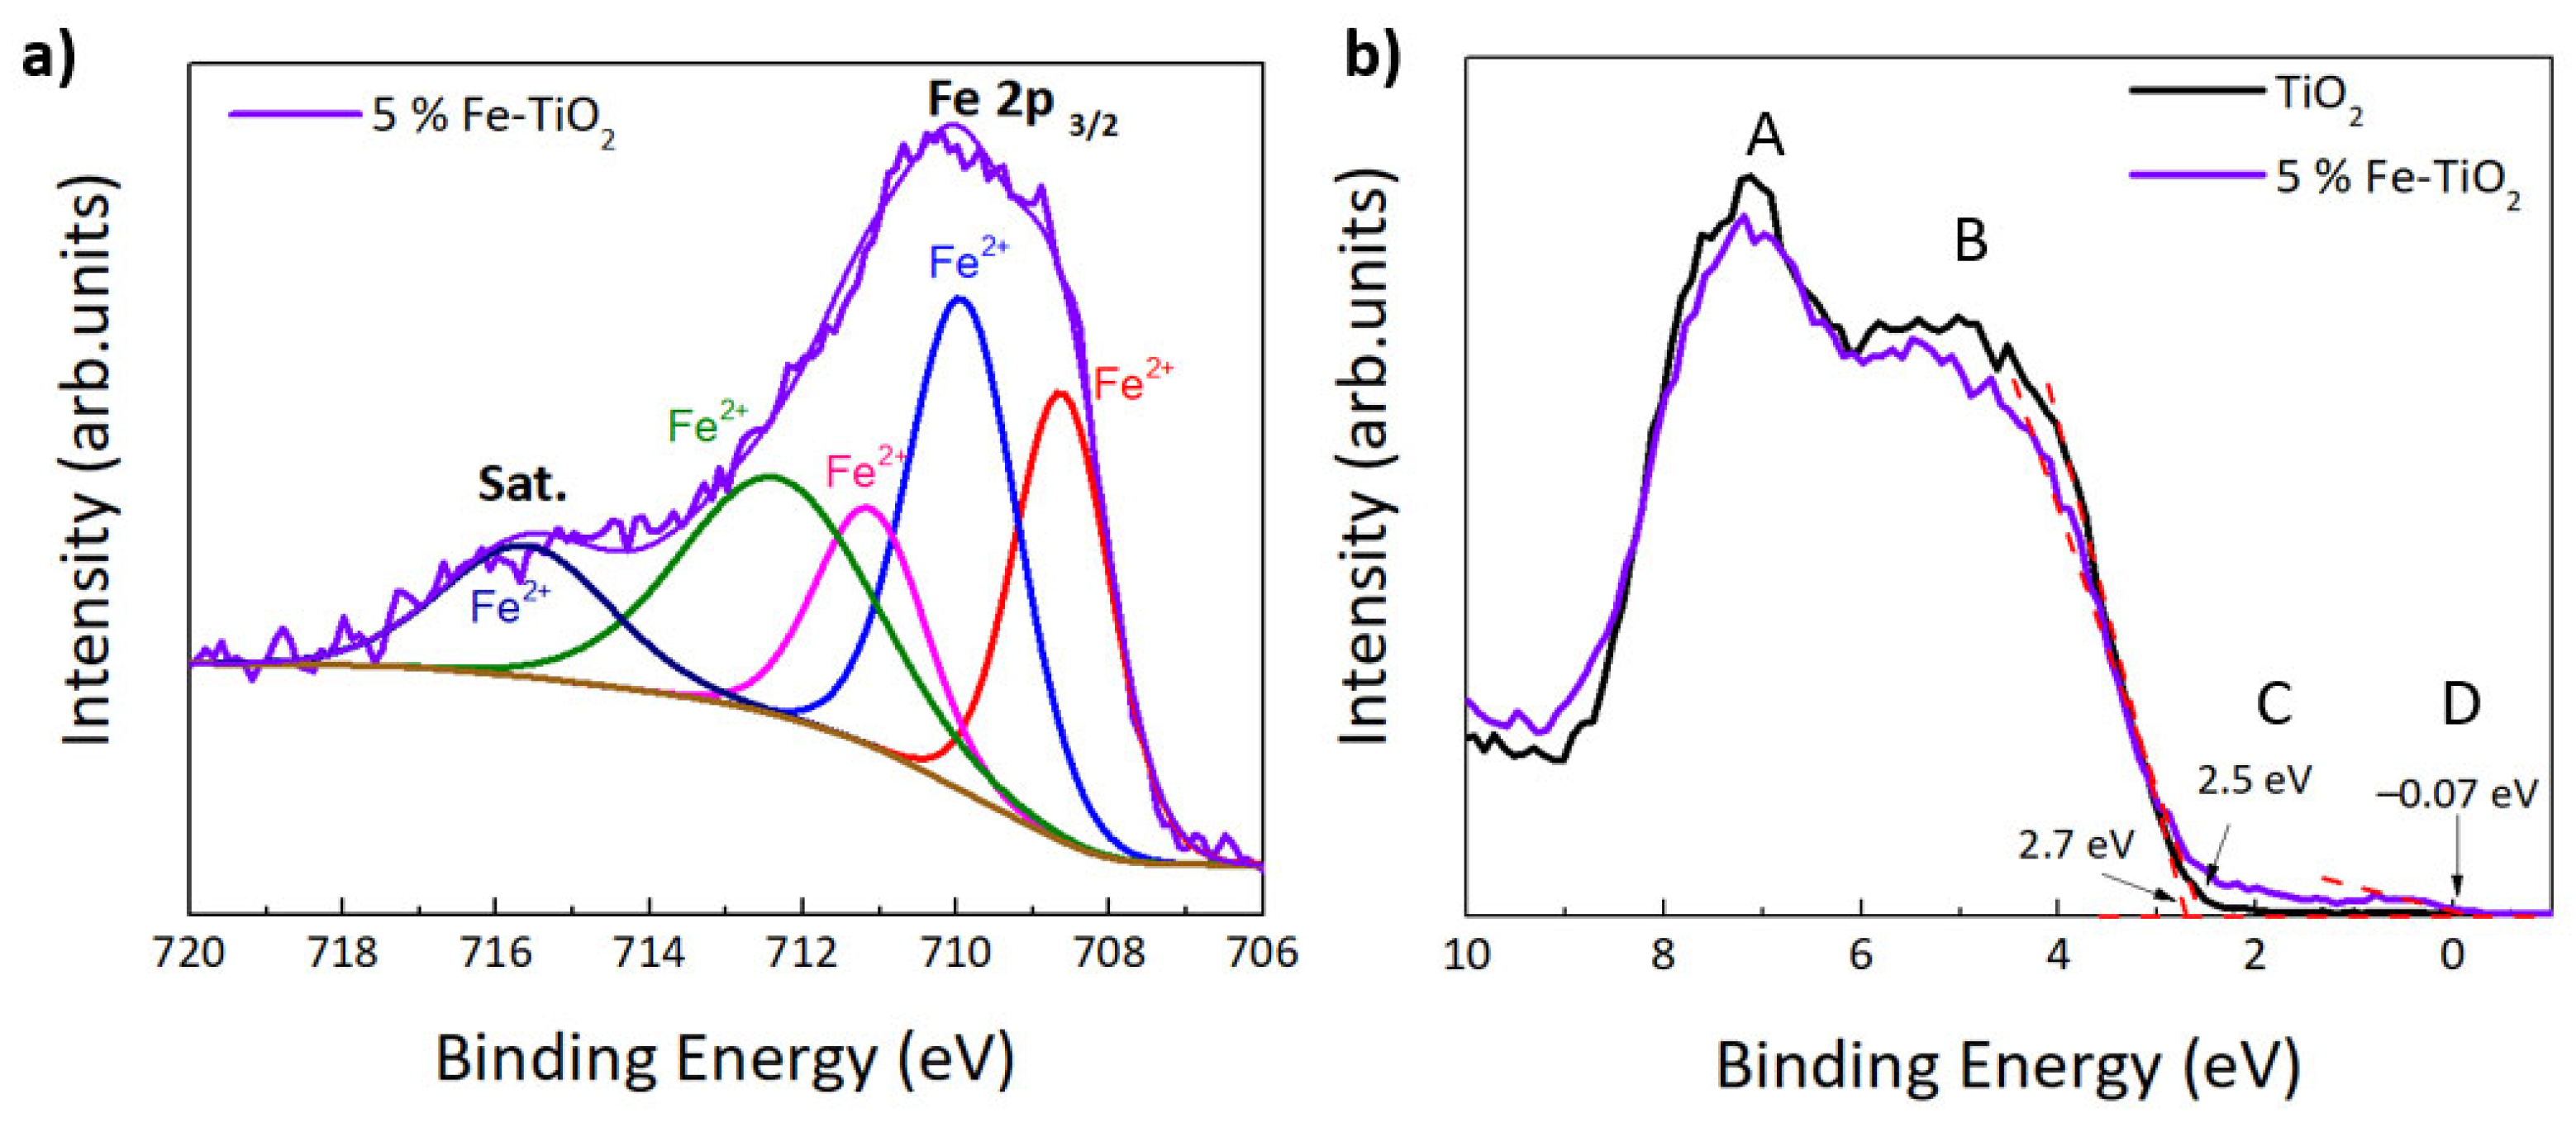
4.1.3. XPS Analysis
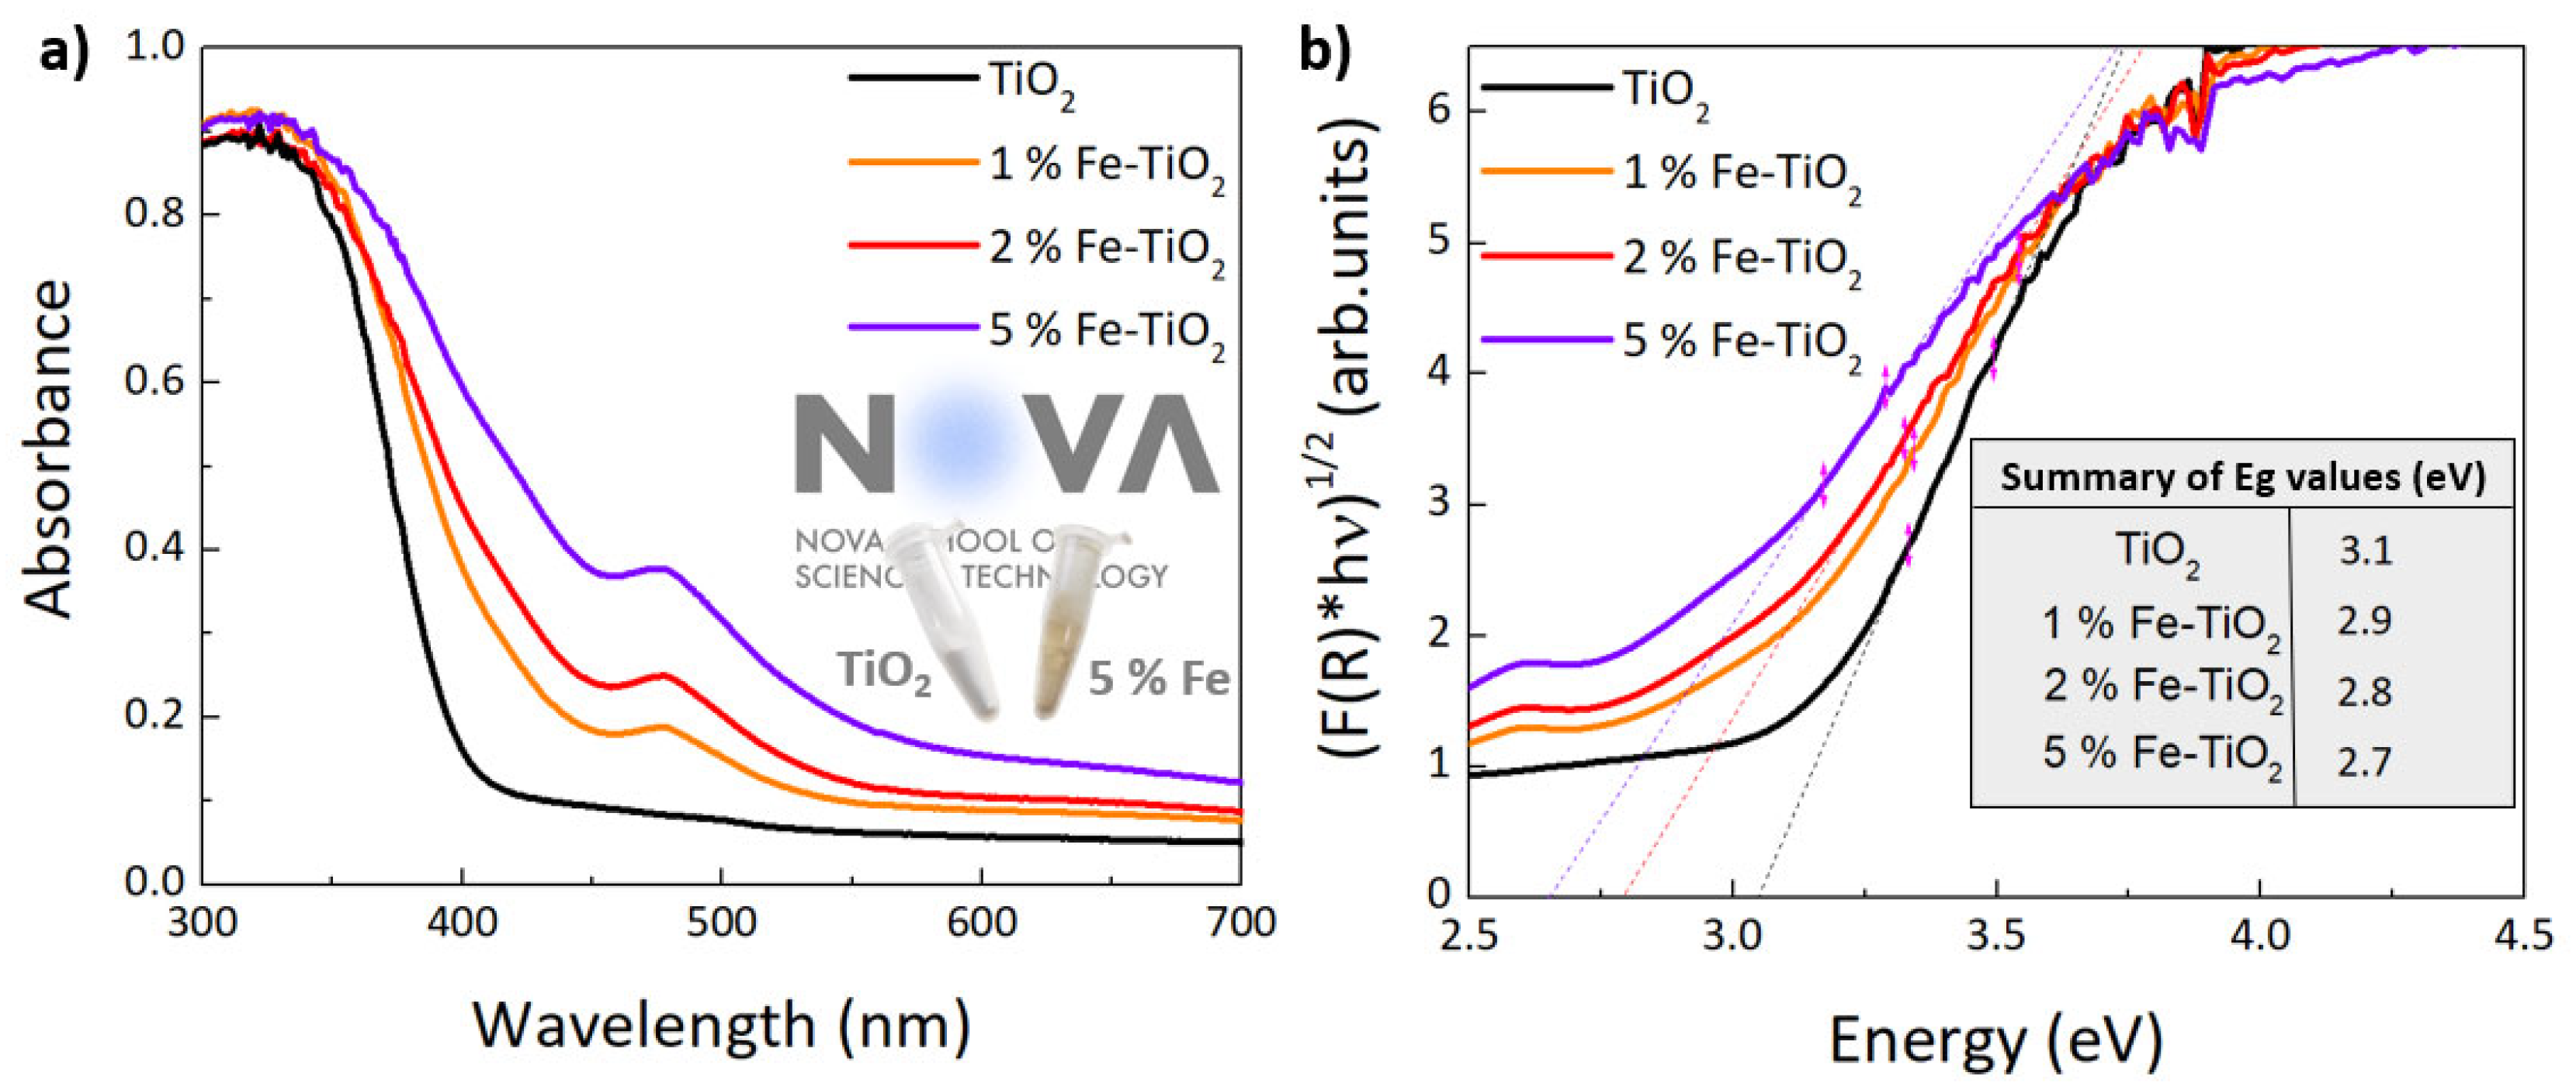
4.1.4. Optical Characterization
4.2. Characterization of the Impregnated Substrates
4.3. Photocatalytic Performance
4.4. Reusability Tests
5. Conclusions
Supplementary Materials
Author Contributions
Funding
Data Availability Statement
Conflicts of Interest
References
- Rodríguez, P.A.O.; Pecchi, G.A.; Casuscelli, S.G.; Elías, V.R.; Eimer, G.A. A simple synthesis way to obtain iron-doped TiO2 nanoparticles as photocatalytic surfaces. Chem. Phys. Lett. 2019, 732, 136643. [Google Scholar] [CrossRef]
- Neena, D.; Kondamareddy, K.K.; Bin, H.; Lu, D.; Kumar, P.; Dwivedi, R.K.; Pelenovich, V.O.; Zhao, X.Z.; Gao, W.; Fu, D. Enhanced visible light photodegradation activity of RhB/MB from aqueous solution using nanosized novel Fe-Cd co-modified ZnO. Sci. Rep. 2018, 8, 1–12. [Google Scholar]
- Rani, S.; Aggarwal, M.; Kumar, M.; Sharma, S.; Kumar, D. Removal of methylene blue and rhodamine B from water by zirconium oxide/graphene. Water Sci. 2016, 30, 51–60. [Google Scholar] [CrossRef] [Green Version]
- Shen, S.; Li, R.; Wang, H.; Fu, J. Carbon Dot–Doped Titanium Dioxide Sheets for the Efficient Photocatalytic Performance of Refractory Pollutants. Front. Chem. 2021, 9, 706343. [Google Scholar] [CrossRef]
- Wu, D.; Zhao, C.; Xu, Y.; Zhang, X.; Yang, L.; Zhang, Y.; Gao, Z.; Song, Y.Y. Modulating Solar Energy Harvesting on TiO2 Nanochannel Membranes by Plasmonic Nanoparticle Assembly for Desalination of Contaminated Seawater. ACS Appl. Nano Mater. 2020, 3, 10895–10904. [Google Scholar] [CrossRef]
- Odling, G.; Robertson, N. Bridging the gap between laboratory and application in photocatalytic water purification. Catal. Sci. Technol. 2019, 9, 533–545. [Google Scholar] [CrossRef] [Green Version]
- Schneider, J.; Matsuoka, M.; Takeuchi, M.; Zhang, J.; Horiuchi, Y.; Anpo, M.; Bahnemann, D.W. Understanding TiO2 Photocatalysis: Mechanisms and Materials. Chem. Rev. 2014, 114, 9919–9986. [Google Scholar] [CrossRef]
- Borges, M.E.; Sierra, M.; Cuevas, E.; García, R.D.; Esparza, P. Photocatalysis with solar energy: Sunlight-responsive photocatalyst based on TiO2 loaded on a natural material for wastewater treatment. Sol. Energy 2016, 135, 527–535. [Google Scholar] [CrossRef]
- Rajeshwar, K.; Osugi, M.E.; Chanmanee, W.; Chenthamarakshan, C.R.; Zanoni, M.V.B.; Kajitvichyanukul, P.; Krishnan-Ayer, R. Heterogeneous photocatalytic treatment of organic dyes in air and aqueous media. J. Photochem. Photobiol. Photochem. Rev. 2008, 9, 171–192. [Google Scholar] [CrossRef]
- He, F.; Jeon, W.; Choi, W. Photocatalytic air purification mimicking the self-cleaning process of the atmosphere. Nat. Commun. 2021, 12, 1–4. [Google Scholar] [CrossRef]
- Fernández-Catalá, J.; Berenguer-Murcia, Á.; Cazorla-Amorós, D. Photocatalytic oxidation of VOCs in gas phase using capillary microreactors with commercial TiO2 (P25) fillings. Materials 2018, 11, 1149. [Google Scholar] [CrossRef] [Green Version]
- Nunes, D.; Pimentel, A.; Branquinho, R.; Fortunato, E.; Martins, R. Metal oxide-based photocatalytic paper: A green alternative for environmental remediation. Catalysts 2021, 11, 504. [Google Scholar] [CrossRef]
- Nunes, D.; Pimentel, A.; Araujo, A.; Calmeiro, T.R.; Panigrahi, S.; Pinto, J.V.; Barquinha, P.; Gama, M.; Fortunato, E.; Martins, R. Enhanced UV Flexible Photodetectors and Photocatalysts Based on TiO2 Nanoplatforms. Springer Nat. 2018, 61, 1591–1606. [Google Scholar] [CrossRef] [Green Version]
- Nakata, K.; Fujishima, A. TiO2 photocatalysis: Design and applications. J. Photochem. Photobiol. Photochem. Rev. 2012, 13, 169–189. [Google Scholar] [CrossRef]
- Xu, C.; Liu, T.; Guo, W.; Sun, Y.; Liang, C.; Cao, K.; Guan, T.; Liang, Z.; Jiang, L. 3D Printing of Powder-Based Inks into Functional Hierarchical Porous TiO2 Materials. Adv. Eng. Mater. 2020, 22, 1901088. [Google Scholar] [CrossRef]
- Humayun, M.; Raziq, F.; Khan, A.; Luo, W. Modification strategies of TiO2 for potential applications in photocatalysis: A critical review. Green Chem. Lett. Rev. 2018, 11, 86–102. [Google Scholar] [CrossRef] [Green Version]
- Dima, R.S.; Phuthu, L.; Maluta, N.E.; Kirui, J.K.; Maphanga, R.R. Electronic, Structural, and Optical Properties of Mono-Doped and Co-Doped (210) TiO2 Brookite Surfaces for Application in Dye-Sensitized Solar Cells—A First Principles Study. Materials 2021, 14, 3918. [Google Scholar] [CrossRef]
- Heng, Z.W.; Chong, W.C.; Pang, Y.L.; Sim, L.C.; Koo, C.H. Photocatalytic degradation of organic pollutants using green oil palm frond-derived carbon quantum dots/titanium dioxide as multifunctional photocatalysts under visible light radiation. Chin. J. Chem. Eng. 2021, 12, 1–31. [Google Scholar]
- Bono, N.; Ponti, F.; Punta, C.; Candiani, G. Effect of UV Irradiation and TiO2-Photocatalysis on Airborne Bacteria and Viruses: An Overview. Materials 2021, 14, 1075. [Google Scholar] [CrossRef]
- Reda, S.M.; Khairy, M.; Mousa, M.A. Photocatalytic activity of nitrogen and copper doped TiO2 nanoparticles prepared by microwave-assisted sol-gel process. Arab. J. Chem. 2020, 13, 86–95. [Google Scholar] [CrossRef]
- Zhao, J.; Chen, C.; Ma, W. Photocatalytic Degradation of Organic Pollutants Under Visible Light Irradiation. Top. Catal. 2005, 35, 269–278. [Google Scholar] [CrossRef]
- Landolsi, Z.; Ben Assaker, I.; Nunes, D.; Fortunato, E.; Martins, R.; Chtourou, R.; Ammar, S. Enhanced electrical and photocatalytic properties of porous TiO2 thin films decorated with Fe2O3 nanoparticles. J. Mater. Sci. Mater. Electron. 2020, 31, 20753–20773. [Google Scholar] [CrossRef]
- Nunes, D.; Pimentel, A.; Gonçalves, A.; Pereira, S.; Branquinho, R.; Barquinha, P.; Martins, R. Metal Oxide Nanostructures for Sensor Applications. Semicond. Sci. Technol 2019, 34, 043001. [Google Scholar] [CrossRef] [Green Version]
- Khairy, M.; Zakaria, W. Effect of metal-doping of TiO2 nanoparticles on their photocatalytic activities toward removal of organic dyes. Egypt. J. Pet. 2014, 23, 419–426. [Google Scholar] [CrossRef] [Green Version]
- Khlyustova, A.; Sirotkin, N.; Kusova, T.; Kraev, A.; Titov, V.; Agafonov, A. Doped TiO2: The effect of doping elements on photocatalytic activity. Mater. Adv. 2020, 1, 1193–1201. [Google Scholar] [CrossRef]
- Pongwan, P.; Wetchakun, K.; Phanichphant, S.; Wetchakun, N. Enhancement of visible-light photocatalytic activity of Cu-doped TiO2 nanoparticles. Res. Chem. Intermed. 2016, 42, 2815–2830. [Google Scholar] [CrossRef]
- Yu, J.C.; Li, G.; Wang, X.; Hu, X.; Leung, C.W.; Zhang, Z. An ordered cubic Im3m mesoporous Cr-TiO2 visible light photocatalyst. Chem. Commun. 2006, 25, 2717–2719. [Google Scholar] [CrossRef] [PubMed]
- Ganesh, I.; Gupta, A.K.; Kumar, P.P.; Sekhar, P.S.C.; Radha, K.; Padmanabham, G.; Sundararajan, G. Preparation and characterization of Ni-doped TiO2 materials for photocurrent and photocatalytic applications. Sci. World J. 2012, 2012, 1–16. [Google Scholar] [CrossRef] [Green Version]
- Yoong, L.S.; Chong, F.K.; Dutta, B.K. Development of copper-doped TiO2 photocatalyst for hydrogen production under visible light. Energy 2009, 34, 1652–1661. [Google Scholar] [CrossRef]
- Ethiraj, A.S.; Rhen, D.S.; Soldatov, A.V.; Ali, G.A.M.; Bakr, Z.H. Efficient and Recyclable Cu Incorporated TiO2 Nanoparticle Catalyst for Organic Dye Photodegradation. Int. J. Thin Film Sci. Technol. 2021, 10, 169–182. [Google Scholar]
- Li, X.; Guo, Z.; He, T. The doping mechanism of Cr into TiO2 and its influence on the photocatalytic performance. Phys. Chem. Chem. Phys. 2013, 15, 20037–20045. [Google Scholar] [CrossRef]
- Avansi, W.; Arenal, R.; De Mendonça, V.R.; Ribeiro, C.; Longo, E. Vanadium-doped TiO2 anatase nanostructures: The role of V in solid solution formation and its effect on the optical properties. CrystEngComm 2014, 16, 5021–5027. [Google Scholar] [CrossRef]
- Jiang, K.; Zhang, J.; Luo, R.; Wan, Y.; Liu, Z.; Chen, J. A facile synthesis of Zn-doped TiO2 nanoparticles with highly exposed (001) facets for enhanced photocatalytic performance. RSC Adv. 2021, 11, 7627–7632. [Google Scholar] [CrossRef]
- Huang, F.; Yan, A.; Zhao, H. Influences of Doping on Photocatalytic Properties of TiO2 Photocatalyst. In Semiconductor Photocatalysis—Materials, Mechanisms and Applications; Cao, W., Ed.; IntechOpen: London, UK, 2016; ISBN 978-953-51-2483-2. [Google Scholar]
- Ali, T.; Tripathi, P.; Azam, A.; Raza, W.; Ahmed, A.S.; Ahmed, A.; Muneer, M. Photocatalytic performance of Fe-doped TiO2 nanoparticles under visible-light irradiation. Mater. Res. Express 2017, 4, 015022. [Google Scholar] [CrossRef]
- Sathishkumara, P.; Anandana, S.; Maruthamuthub, P.; Swaminathanc, T.; Zhoud, M.; Ashokkumard, M. Synthesis of Fe3+ doped TiO2 photocatalysts for the visible assisted degradation of an azo dye. Colloids Surf. Physicochem. Eng. Asp. 2011, 375, 231–236. [Google Scholar] [CrossRef]
- Tian, F.; Wu, Z.; Tong, Y.; Wu, Z.; Cravotto, G. Microwave-Assisted Synthesis of Carbon-Based (N, Fe)-Codoped TiO2 for the Photocatalytic Degradation of Formaldehyde. Nanoscale Res. Lett. 2015, 10, 1–12. [Google Scholar] [CrossRef] [Green Version]
- Crişan, M.; Drăgan, N.; Crişan, D.; Ianculescu, A.; Niţoi, I.; Oancea, P.; Todan, L.; Stan, C.; Stănică, N. The effects of Fe, Co and Ni dopants on TiO2 structure of sol–gel nanopowders used as photocatalysts for environmental protection: A comparative study. Ceram. Int. 2016, 42, 3088–3095. [Google Scholar] [CrossRef]
- Ghasemi, S.; Rahimnejad, S.; Setayesh, S.R.; Rohani, S.; Gholami, M.R. Transition metal ions effect on the properties and photocatalytic activity of nanocrystalline TiO2 prepared in an ionic liquid. J. Hazard. Mater. 2009, 172, 1573–1578. [Google Scholar] [CrossRef]
- Mogal, S.I.; Mishra, M.; Gandhi, V.G.; Tayade, R.J. Metal doped titanium dioxide: Synthesis and effect of metal ions on physico-chemical and photocatalytic properties. Mater. Sci. Forum 2013, 734, 364–378. [Google Scholar] [CrossRef]
- Choi, W.; Termin, A.; Hoffmann, M.R. The role of metal ion dopants in quantum-sized TiO2: Correlation between photoreactivity and charge carrier recombination dynamics. J. Phys. Chem. 1994, 98, 13669–13679. [Google Scholar] [CrossRef]
- Zhang, Z.; Wang, C.-C.; Zakaria, R.; Ying, J.Y. Role of Particle Size in Nanocrystalline TiO2-Based Photocatalysts. J. Phys. Chem. 1998, 102, 10871–10878. [Google Scholar] [CrossRef]
- Nasralla, N.H.S.; Yeganeh, M.; Astuti, Y.; Piticharoenphun, S.; Šiller, L. Systematic study of electronic properties of Fe-doped TiO2 nanoparticles by X-ray photoemission spectroscopy. J. Mater. Sci. Mater. Electron. 2018, 29, 17956–17966. [Google Scholar] [CrossRef] [Green Version]
- Zhu, J.; Chen, F.; Zhang, J.; Chen, H.; Anpo, M. Fe3+-TiO2 photocatalysts prepared by combining sol-gel method with hydrothermal treatment and their characterization. J. Photochem. Photobiol. Chem. 2006, 180, 196–204. [Google Scholar] [CrossRef]
- Maragatha, J.; Rajendran, S.; Endo, T.; Karuppuchamy, S. Microwave synthesis of metal doped TiO2 for photocatalytic applications. J. Mater. Sci. Mater. Electron. 2017, 28, 5281–5287. [Google Scholar] [CrossRef]
- Senthil Kumar, R.; Gnanavel, B.; Jegatheesan, A. Microwave assisted synthesis and characterization of pure and Cr doped TiO2 with improved photo-efficiency. J. Mater. Sci. Mater. Electron. 2018, 29, 6501–6510. [Google Scholar] [CrossRef]
- Machut, C.; Kania, N.; Léger, B.; Wyrwalski, F.; Noël, S.; Addad, A.; Monflier, E.; Ponchel, A. Fast Microwave Synthesis of Gold-Doped TiO2 Assisted by Modified Cyclodextrins for Photocatalytic Degradation of Dye and Hydrogen Production. Catalysts 2020, 10, 801. [Google Scholar] [CrossRef]
- De La Hoz, A.; Díaz-Ortiz, A.; Prieto, P. CHAPTER 1:Microwave-Assisted Green Organic Synthesis. In Alternative Energy Sources for Green Chemistry; Royal Society of Chemistry: London, UK, 2016; pp. 1–33. [Google Scholar]
- Nunes, D.; Pimentel, A.; Santos, L.; Barquinha, P.; Fortunato, E.; Martins, R. Photocatalytic TiO2 Nanorod Spheres and Arrays Compatible with Flexible Applications. Catalysts 2017, 7, 60. [Google Scholar] [CrossRef] [Green Version]
- Nunes, D.; Pimentel, A.; Pinto, J.V.; Calmeiro, T.R.; Nandy, S.; Barquinha, P.; Pereira, L.; Carvalho, P.A.; Fortunato, E.; Martins, R. Photocatalytic behavior of TiO2 films synthesized by microwave irradiation. Catal. Today 2016, 278, 262–270. [Google Scholar] [CrossRef]
- Pimentel, A.; Nunes, D.; Pereira, S.; Martins, R.; Fortunato, E. Photocatalytic Activity of TiO2 Nanostructured Arrays Prepared by Microwave-Assisted Solvothermal Method. In Semiconductor Photocatalysis—Materials, Mechanisms and Applications; IntechOpen: London, UK, 2016; Chapter 3. [Google Scholar]
- Freire, T.; Fragoso, A.R.; Matias, M.; Vaz Pinto, J.; Marques, A.C.; Pimentel, A.; Barquinha, P.; Huertas, R.; Fortunato, E.; Martins, R.; et al. Enhanced solar photocatalysis of TiO2 nanoparticles and nanostructured thin films grown on paper. Nano Express 2021, 2, 040002. [Google Scholar] [CrossRef]
- Romero, V.M.J.; Santaclara, J.G.; Oar-Arteta, L.; van Koppen, L.; Osadchii, D.Y.; Gascon, J.; Kapteijn, F. Photocatalytic properties of TiO2 and Fe-doped TiO2 prepared by metal organic framework-mediated synthesis. Chem. Eng. J. 2019, 360, 75–88. [Google Scholar] [CrossRef]
- Zurita-Luna, U.; Zárate-Medina, J.; Gallegos-Hernández, A.Y.; Romero-Toledo, R.; Apolinar-Cortés, J. Effect of temperature, pressure and power in obtaining TiO2 and TiO2-Fe via microwaves and evaluation of photocatalytic activity with synthesis time. Acta Univ. 2019, 29, 1–13. [Google Scholar] [CrossRef]
- Wu, D.-F.; Wang, C.-S.; Liao, X.-H. Microwave Synthesis of Cu, Fe-doped TiO2 and Its Application for Photocatalytic Degradation of Organic Wastewater. Proc. 2015 Int. Conf. Mater. Sci. Appl. 2014, 3, 153–157. [Google Scholar]
- Moradi, H.; Eshaghi, A.; Hosseini, S.R.; Ghani, K. Fabrication of Fe-doped TiO2 nanoparticles and investigation of photocatalytic decolorization of reactive red 198 under visible light irradiation. Ultrason. Sonochem. 2016, 32, 314–319. [Google Scholar] [CrossRef]
- Ellouzi, I.; El hajjaji, S.; Harir, M.; Schmitt-Kopplin, P.; Laânab, L. Coprecipitation Synthesis of Fe-Doped TiO2 from Various Commercial TiO2 for Photocatalytic Reaction. Int. J. Environ. Res. 2020, 14, 605–613. [Google Scholar] [CrossRef]
- Zhou, Y.; Zhang, L.; Tao, S. Porous TiO2 with large surface area is an efficient catalyst carrier for the recovery of wastewater containing an ultrahigh concentration of dye. RSC Adv. 2018, 8, 3433–3442. [Google Scholar] [CrossRef] [Green Version]
- Feng, H.; Zhang, M.-H.; Liya, E.Y. Hydrothermal Synthesis and Photocatalytic Performance of Metal-Ions Doped TiO2. Appl. Catal. A Gen. 2012, 413, 238–244. [Google Scholar] [CrossRef]
- Zhang, M.; Lei, J.; Shi, Y.; Zhang, L.; Ye, Y.; Li, D.; Changdao, M. Molecular weight effects of PEG on the crystal structure and photocatalytic activities of PEG-capped TiO2 nanoparticles. RCS Adv. 2016, 6, 83366–83372. [Google Scholar] [CrossRef]
- Fumin, W.; Zhansheng, S.; Feng, G.; Jinting, J.; Motonari, A. Morphology Control of anatase TiO2 by surfactant-assisted Hydrothermal Method. Chin. J. Chem. Eng. 2007, 15, 754–759. [Google Scholar]
- Kubiak, A.; Bielan, Z.; Bartkowiak, A.; Gabała, E.; Piasecki, A.; Zalas, M.; Zielińska-Jurek, A.; Janczarek, M.; Siwińska-Ciesielczyk, K.; Jesionowski, T. Synthesis of titanium dioxide via surfactant-assisted microwave method for photocatalytic and dye-sensitized solar cells applications. Catalysts 2020, 10, 586. [Google Scholar] [CrossRef]
- Jang, I.; Leong, H.; Oh, S.-G. Effects of surfactants on the preparation of TiO2 nanoparticles in microwave-assisted sol-gel process and their photocatalytic activity. Korean J. Chem. Eng. 2016, 33, 1647–1652. [Google Scholar] [CrossRef]
- AL-Jawad, S.M.H.; Taha, A.A.; Salim, M.M. Synthesis and characterization of pure and Fe doped TiO2 thin films for antimicrobial activity. Optik 2017, 142, 42–53. [Google Scholar] [CrossRef]
- Sonawane, R.S.; Kale, B.; Dongare, M. Preparation and photo-catalytic activity of Fe-TiO2 thin films prepared by sol-gel dip coating. Mater. Chem. Phys. 2004, 85, 52–57. [Google Scholar] [CrossRef]
- Zhang, H.; Zhu, H. Preparation of Fe-doped TiO2 nanoparticles immobilized on polyamide fabric. Appl. Surf. Sci. 2012, 258, 10034–10041. [Google Scholar] [CrossRef]
- Yadav, A.K.; Haque, S.M.; Shukla, D.K.; Phase, D.M.; Jha, S.N.; Bhattacharyya, D. Local structural investigations of Fe-doped TiO2 amorphous thin films. Thin Solid Film. 2020, 716, 138435. [Google Scholar] [CrossRef]
- Huertas, R.M.; Fraga, M.C.; Crespo, J.G.; Pereira, V.J. Solvent-Free Process for the Development of Photocatalytic Membranes. Molecules 2019, 24, 4481. [Google Scholar] [CrossRef] [PubMed] [Green Version]
- Sadale, S.B.; Noda, K.; Kobayashi, K.; Yamada, H.; Matsushige, K. Real-time investigation on photocatalytic oxidation of gaseous methanol with nanocrystalline WO3–TiO2 composite films. Thin Solid Film. 2012, 520, 3847–3851. [Google Scholar] [CrossRef]
- Seo, C.; Jang, D.; Chae, J.; Shin, S. Altering the coffee ring effect by adding a surfactant like viscous polymer solution. Sci. Rep. 2017, 7, 1–9. [Google Scholar] [CrossRef] [Green Version]
- Wilkinson, J.; Tam, C.; Askounis, A.; Qi, S. Suppression of the coffee-ring effect by tailoring the viscosity of pharmaceutical sessile drops. Colloids Surf. A Physicochem. Eng. Asp. 2021, 614, 126144. [Google Scholar] [CrossRef]
- Ooi, Y.; Hanasaki, I.; Mizumura, D.; Matsuda, Y. Suppressing the coffee-ring effect of colloidal droplets by dispersed cellulose nanofibers. Sci. Technol. Adv. Mater. 2017, 18, 316–324. [Google Scholar] [CrossRef]
- Mampallil, D.; Eral, H.B. A review on suppression and utilization of the coffee-ring effect. Adv. Colloid Interface Sci. 2018, 252, 38–54. [Google Scholar] [CrossRef]
- Parsa, M. Wetting and Evaporation of Nanosuspension Droplets. Ph.D. Thesis, Université de Valenciennes et du Hainaut-Cambresis, Valenciennes, France, 2017. [Google Scholar]
- Iwashita, N. X-ray Powder Diffraction. In Materials Science and Engineering of Carbon: Characterization; Inagaki, M., Kang, F., Eds.; Butterworth-Heinemann: Oxford, UK, 2016; pp. 7–25. [Google Scholar]
- Degen, T.; Sadki, M.; Bron, E.; König, U.; Nénert, G. The HighScore suite. Powder Diffr. 2014, 29, S13–S18. [Google Scholar] [CrossRef] [Green Version]
- Yamashita, T.; Hayes, P. Analysis of XPS spectra of Fe2+ and Fe3+ ions in oxide materials. Appl. Surf. Sci. 2008, 254, 2441–2449. [Google Scholar] [CrossRef]
- Bharti, B.; Barman, P.B.; Kumar, R. XRD analysis of undoped and Fe doped TiO2 nanoparticles by Williamson Hall method. AIP Conf. Proc. 2015, 1675, 030025. [Google Scholar]
- Luu, L.; Nguyen, Q.T.; Ho, S.T. Synthesis and characterization of Fe-doped TiO2 photocatalyst by the sol–gel method. Adv. Nat. Sci. Nanosci. Nanotechnol. 2010, 1, 015008. [Google Scholar] [CrossRef]
- Ahmad, M.M.; Mushtaq, S.; Al Qahtani, H.S.; Sedky, A.; Alam, M.W. Investigation of TiO2 Nanoparticles Synthesized by Sol-Gel Method for Effectual Photodegradation, Oxidation and Reduction Reaction. Crystals 2021, 11, 1456. [Google Scholar] [CrossRef]
- Tesfaye, L.; Bekele, B.; Saka, A.; Ramaswamy, K.; Nagaprasad, N.; Sivaramasundaram, K. Investigating Spectroscopic and Structural Properties of Cr doped TiO2 NPs Synthesized through Sol gel Deposition Technique. Tierärztliche Prax. 2021, 41, 860–872. [Google Scholar]
- Vijayalakshmi, K.; Jereil, S.D. Influence of Fe catalytic doping on the properties of TiO2 nanoparticles synthesized by microwave method. J. Mater. Sci. Mater. Electron. 2014, 25, 5089–5094. [Google Scholar] [CrossRef]
- Fernandes, C.; Santa, A.; Santos, Â.; Bahubalindruni, P.; Deuermeier, J.; Martins, R.; Fortunato, E.; Barquinha, P. A Sustainable Approach to Flexible Electronics with Zinc-Tin Oxide Thin-Film Transistors. Adv. Electron. Mater. 2018, 4, 1800032. [Google Scholar] [CrossRef]
- Abidov, A.; Allabergenov, B.; Lee, J.; Jeon, H.-W.; Kim, S. X-ray Photoelectron Spectroscopy Characterization of Fe Doped TiO2 Photocatalyst. Int. J. Mater. Mech. Manuf. 2013, 1, 294–296. [Google Scholar] [CrossRef]
- Bharti, B.; Kumar, S.; Lee, H.N.; Kumar, R. Formation of oxygen vacancies and Ti3+ state in TiO2 thin film and enhanced optical properties by air plasma treatment. Sci. Rep. 2016, 6, 1–12. [Google Scholar] [CrossRef]
- Zhu, L.; Lu, Q.; Lv, L.; Wang, Y.; Hu, Y.; Deng, Z.; Lou, Z.; Hou, Y.; Teng, F. Ligand-free rutile and anatase TiO2 nanocrystals as electron extraction layers for high performance inverted polymer solar cells. RSC Adv. 2017, 7, 20084–20092. [Google Scholar] [CrossRef] [Green Version]
- Biesinger, M.C.; Payne, B.P.; Grosvenor, A.P.; Lau, L.W.M.; Gerson, A.R.; Smart, R.S.C. Resolving surface chemical states in XPS analysis of first row transition metals, oxides and hydroxides: Cr, Mn, Fe, Co and Ni. Appl. Surf. Sci. 2011, 257, 2717–2730. [Google Scholar] [CrossRef]
- Grosvenor, A.P.; Kobe, B.A.; Biesinger, M.C.; McIntyre, N.S. Investigation of multiplet splitting of Fe 2p XPS spectra and bonding in iron compounds. Surf. Interface Anal. 2004, 36, 1564–1574. [Google Scholar] [CrossRef]
- Bagus, P.S.; Nelin, C.J.; Brundle, C.R.; Vincent Crist, B.; Lahiri, N.; Rosso, K.M. Covalency in Fe2O3 and FeO: Consequences for XPS satellite intensity. J. Chem. Phys. 2020, 153, 194702. [Google Scholar] [CrossRef] [PubMed]
- Deuermeier, J.; Fortunato, E.; Martins, R.; Klein, A. Energy band alignment at the nanoscale. Appl. Phys. Lett. 2017, 110, 51603. [Google Scholar] [CrossRef]
- Bonkerud, J.; Zimmermann, C.; Weiser, P.M.; Vines, L.; Monakhov, E.V. On the permittivity of titanium dioxide. Sci. Rep. 2021, 11, 1–5. [Google Scholar] [CrossRef]
- Liu, P.; Franchini, C.; Marsman, M.; Kresse, G. Assessing model-dielectric-dependent hybrid functionals on the antiferromagnetic transition-metal monoxides MnO, FeO, CoO, and NiO. J. Phys. Condens. Matter 2019, 32, 015502. [Google Scholar] [CrossRef]
- Morikawa, T.; Ohwaki, T.; Suzuki, K.I.; Moribe, S.; Tero-Kubota, S. Visible-light-induced photocatalytic oxidation of carboxylic acids and aldehydes over N-doped TiO2 loaded with Fe, Cu or Pt. Appl. Catal. Environ. 2008, 83, 56–62. [Google Scholar] [CrossRef]
- Ismail, M.A.; Hedhili, M.N.; Anjum, D.H.; Singaravelu, V.; Chung, S.H. Synthesis and Characterization of Iron-Doped TiO2 Nanoparticles Using Ferrocene from Flame Spray Pyrolysis. Catalysts 2021, 11, 438. [Google Scholar] [CrossRef]
- Bapna, K.; Phase, D.M.; Choudhary, R.J. Study of valence band structure of Fe doped anatase TiO2 thin films. J. Appl. Phys. 2011, 110, 43910. [Google Scholar] [CrossRef]
- Feng, N.; Liu, F.; Huang, M.; Zheng, A.; Wang, Q.; Chen, T.; Cao, G.; Xu, J.; Fan, J.; Deng, F. Unravelling the Efficient Photocatalytic Activity of Boron-induced Ti3+ Species in the Surface Layer of TiO2. Sci. Rep. 2016, 6, 1–9. [Google Scholar] [CrossRef] [Green Version]
- Li, K.; Wang, H.; Pan, C.; Wei, J.; Xiong, R.; Shi, J. Enhanced photoactivity of Fe + N Codoped anatase-rutile TiO2 nanowire film under visible light irradiation. Int. J. Photoenergy 2012, 1, 2012. [Google Scholar]
- Mansour, H.; Omri, K.; Bargougui, R.; Ammar, S. Novel α-Fe2O3/TiO2 nanocomposites with enhanced photocatalytic activity. Appl. Phys. Mater. Sci. Process. 2020, 126, 1–10. [Google Scholar] [CrossRef]
- Ganesh, I.; Kumar, P.P.; Gupta, A.K.; Sekhar, P.S.C.; Radha, K.; Padmanabham, G.; Sundararajan, G. Preparation and characterization of Fe-doped TiO2 powders for solar light response and photocatalytic applications. Process. Appl. Ceram. 2012, 6, 21–36. [Google Scholar] [CrossRef]
- Niu, Y.; Xing, M.; Zhang, J.; Tian, B. Visible light activated sulfur and iron co-doped TiO2 photocatalyst for the photocatalytic degradation of phenol. Catal. Today 2013, 201, 159–166. [Google Scholar] [CrossRef]
- Ginting, L.Y.; Agusta, M.K.; Lubis, A.H.; Dipojono, H.K. Cr, Fe—Doped Anatase TiO2 Photocatalyst: DFT+U Investigation on Band Gap. Adv. Mater. Res. 2014, 893, 31–34. [Google Scholar] [CrossRef]
- Makuła, P.; Pacia, M.; Macyk, W. How To Correctly Determine the Band Gap Energy of Modified Semiconductor Photocatalysts Based on UV-Vis Spectra. J. Phys. Chem. Lett. 2018, 9, 6814–6817. [Google Scholar] [CrossRef] [Green Version]
- Shyniya, C.R.; Bhabu, K.A.; Rajasekaran, T.R. Enhanced electrochemical behavior of novel acceptor doped titanium dioxide catalysts for photocatalytic applications. J. Mater. Sci. Mater. Electron. 2017, 28, 6959–6970. [Google Scholar] [CrossRef]
- Wang, Y.; Li, L.; Huang, X.; Li, Q.; Li, G. New insights into fluorinated TiO2 (brookite, anatase and rutile) nanoparticles as efficient photocatalytic redox catalysts. RSC Adv. 2015, 5, 34302–34313. [Google Scholar] [CrossRef]
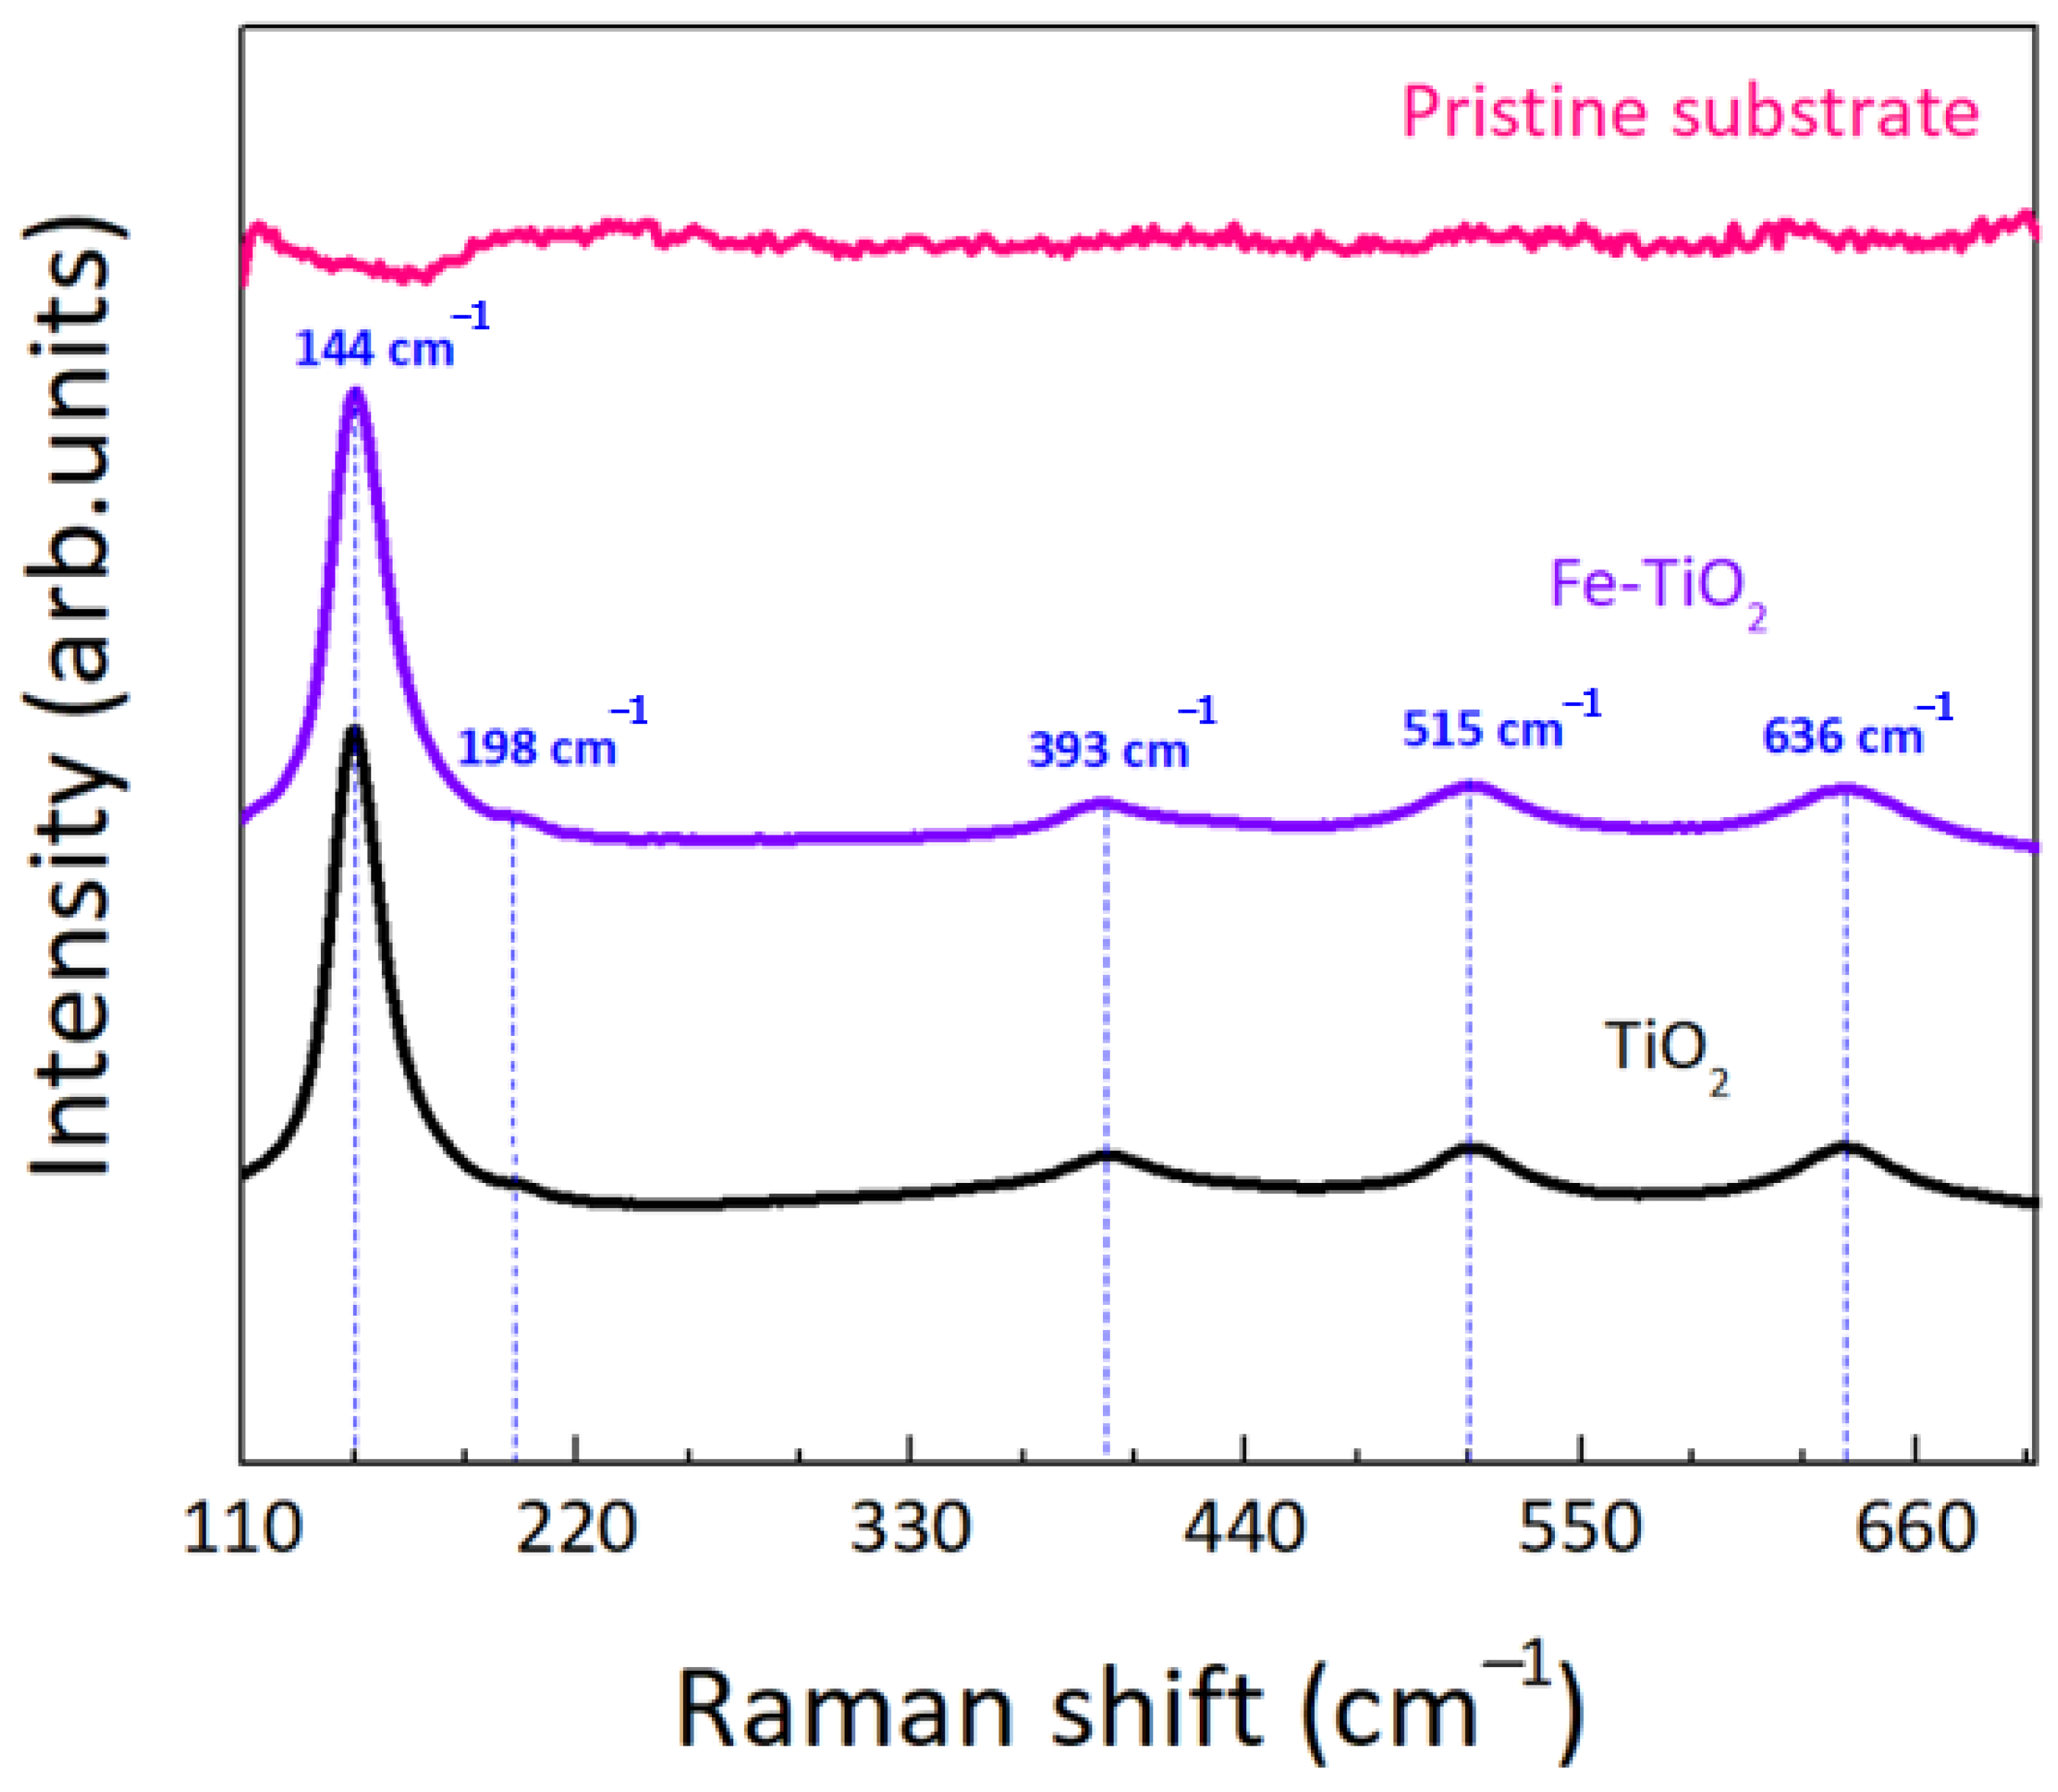
- Ohsaka, T.; Izumi, F.; Fujiki, Y. Raman Spectrum of Anatase, TiO2. J. Raman Spectrosc. 1978, 7, 321–324. [Google Scholar] [CrossRef]
- Yu, S.; Yun, H.J.; Lee, D.M.; Yi, J. Preparation and characterization of Fe-doped TiO2 nanoparticles as a support for a high performance CO oxidation catalyst. J. Mater. Chem. 2012, 22, 12629–12635. [Google Scholar] [CrossRef]
- Ekoi, E.J.; Gowen, A.; Dorrepaal, R.; Dowling, D.P. Characterisation of titanium oxide layers using Raman spectroscopy and optical profilometry: Influence of oxide properties. Results Phys. 2019, 12, 1574–1585. [Google Scholar] [CrossRef]
- Araújo, M.M.; Silva, L.K.R.; Sczancoski, J.C.; Orlandi, M.O.; Longo, E.; Santos, A.G.D.; Sá, J.L.S.; Santos, R.S.; Luz, G.E.; Cavalcante, L.S. Anatase TiO2 nanocrystals anchored at inside of SBA-15 mesopores and their optical behavior. Appl. Surf. Sci. 2016, 389, 1137–1147. [Google Scholar] [CrossRef] [Green Version]
- Zhao, J.; Wu, T.; Wu, K.; Oikawa, K.; Hidaka, H.; Serpone, N. Photoassisted degradation of dye pollutants. 3. Degradation of the cationic dye rhodamine B in aqueous anionic surfactant/TiO2 dispersions under visible light irradiation: Evidence for the Need of Substrate Adsorption on TiO2 Particles. Environ. Sci. Technol. 1998, 32, 2394–2400. [Google Scholar] [CrossRef]
- Eshaghi, A.; Mozaffarinia, R.; Pakshir, M.; Eshaghi, A. Photocatalytic properties of TiO2 sol-gel modified nanocomposite films. Ceram. Int. 2011, 37, 327–331. [Google Scholar] [CrossRef]
- Alkaykh, S.; Mbarek, A.; Ali-Shattle, E.E. Photocatalytic degradation of methylene blue dye in aqueous solution by MnTiO3 nanoparticles under sunlight irradiation. Heliyon 2020, 6, e03663. [Google Scholar] [CrossRef]
- El Mragui, A.; Logvina, Y.; Pinto da Silva, L.; Zegaoui, O.; C G Esteves da Silva, J. Synthesis of Fe- and Co-Doped TiO2 with Improved Photocatalytic Activity Under Visible Irradiation Toward Carbamazepine Degradation. Materials 2019, 12, 3874. [Google Scholar] [CrossRef] [Green Version]
- Fu, W.; Li, G.; Wang, Y.; Zeng, S.; Yan, Z.; Wang, J.; Xin, S.; Zhang, L.; Wu, S.; Zhang, Z. Facile formation of mesoporous structured mixed-phase (anatase/rutile) TiO2 with enhanced visible light photocatalytic activity. Chem. Commun. 2018, 54, 58–61. [Google Scholar] [CrossRef]
- Han, G.; Kim, J.Y.; Kim, K.J.; Lee, H.; Kim, Y.M. Controlling surface oxygen vacancies in Fe-doped TiO2 anatase nanoparticles for superior photocatalytic activities. Appl. Surf. Sci. 2020, 507, 144916. [Google Scholar] [CrossRef]
- Zhang, J.; Zhou, P.; Liu, J.; Yu, J. New understanding of the difference of photocatalytic activity among anatase, rutile and brookite TiO2. Phys. Chem. Chem. Phys. 2014, 16, 20382–20386. [Google Scholar] [CrossRef]
- Tan, H.; Zhao, Z.; Zhu, W.B.; Coker, E.N.; Li, B.; Zheng, M.; Yu, W.; Fan, H.; Sun, Z. Oxygen vacancy enhanced photocatalytic activity of pervoskite SrTiO3. ACS Appl. Mater. Interfaces 2014, 6, 19184–19190. [Google Scholar] [CrossRef] [PubMed]
- Zhao, Y.; Zhao, Y.; Shi, R.; Wang, B.; Waterhouse, G.I.; Wu, L.-Z.; Tung, C.-H.; Zhang, T. Tuning Oxygen Vacancies in Ultrathin TiO2 Nanosheets to Boost Photocatalytic Nitrogen Fixation up to 700 nm. Adv. Mater. 2019, 31, 1806482. [Google Scholar] [CrossRef]
- Hu, J.; Li, S.; Chu, J.; Niu, S.; Wang, J.; Du, Y.; Li, Z.; Han, X.; Xu, P. Understanding the Phase-Induced Electrocatalytic Oxygen Evolution Reaction Activity on FeOOH Nanostructures. ACS Catal. 2019, 9, 10705–10711. [Google Scholar] [CrossRef]
- Colina-Márquez, J.; Machuca-Martínez, F.; Puma, G.L.; Mueses, M.A. Photocatalysis: Fundamentals, Materials and Potential. In Molecules; Pichat, P., Ed.; MDPI: Basel, Switzerland, 2016; pp. 1–664. [Google Scholar]
- Gao, W.; Ran, C.; Wang, M.; Li, L.; Sun, Z.; Yao, X. The role of reduction extent of graphene oxide in the photocatalytic performance of Ag/AgX (X = Cl, Br)/rGO composites and the pseudo-second-order kinetics reaction nature of the Ag/AgBr system. Phys. Chem. Chem. Phys. 2016, 18, 18219–18226. [Google Scholar] [CrossRef] [PubMed]
- Rytwo, G.; Zelkind, A.L. Evaluation of Kinetic Pseudo-Order in the Photocatalytic Degradation of Ofloxacin. Catalysts 2022, 12, 24. [Google Scholar] [CrossRef]
- de Araujo Scharnberg, A.R.; de Loreto, A.C.; Wermuth, T.B.; Alves, A.K.; Arcaro, S.; dos Santos, P.A.M.; Rodriguez, A.D.A.L. Porous ceramic supported TiO2 nanoparticles: Enhanced photocatalytic activity for Rhodamine B degradation. Boletín Soc. Española Cerámica Vidr. 2020, 59, 230–238. [Google Scholar] [CrossRef]
- Nunes, D.; Fragoso, A.R.; Freire, T.; Matias, M.; Marques, A.C.; Martins, R.; Fortunato, E.; Pimentel, A. Ultrafast Microwave Synthesis of WO3 Nanostructured Films for Solar Photocatalysis. Phys. Status Solidi—Rapid Res. Lett. 2021, 15, 2100196. [Google Scholar] [CrossRef]
- Moulai, F.; Fellahi, O.; Messaoudi, B.; Hadjersi, T.; Zerroual, L. Electrodeposition of nanostructured γ-MnO2 film for photodegradation of Rhodamine B. Ionics 2018, 24, 2099–2109. [Google Scholar] [CrossRef]


| TiO2 | 1% Fe-TiO2 | 2% Fe-TiO2 | 5% Fe-TiO2 | |
|---|---|---|---|---|
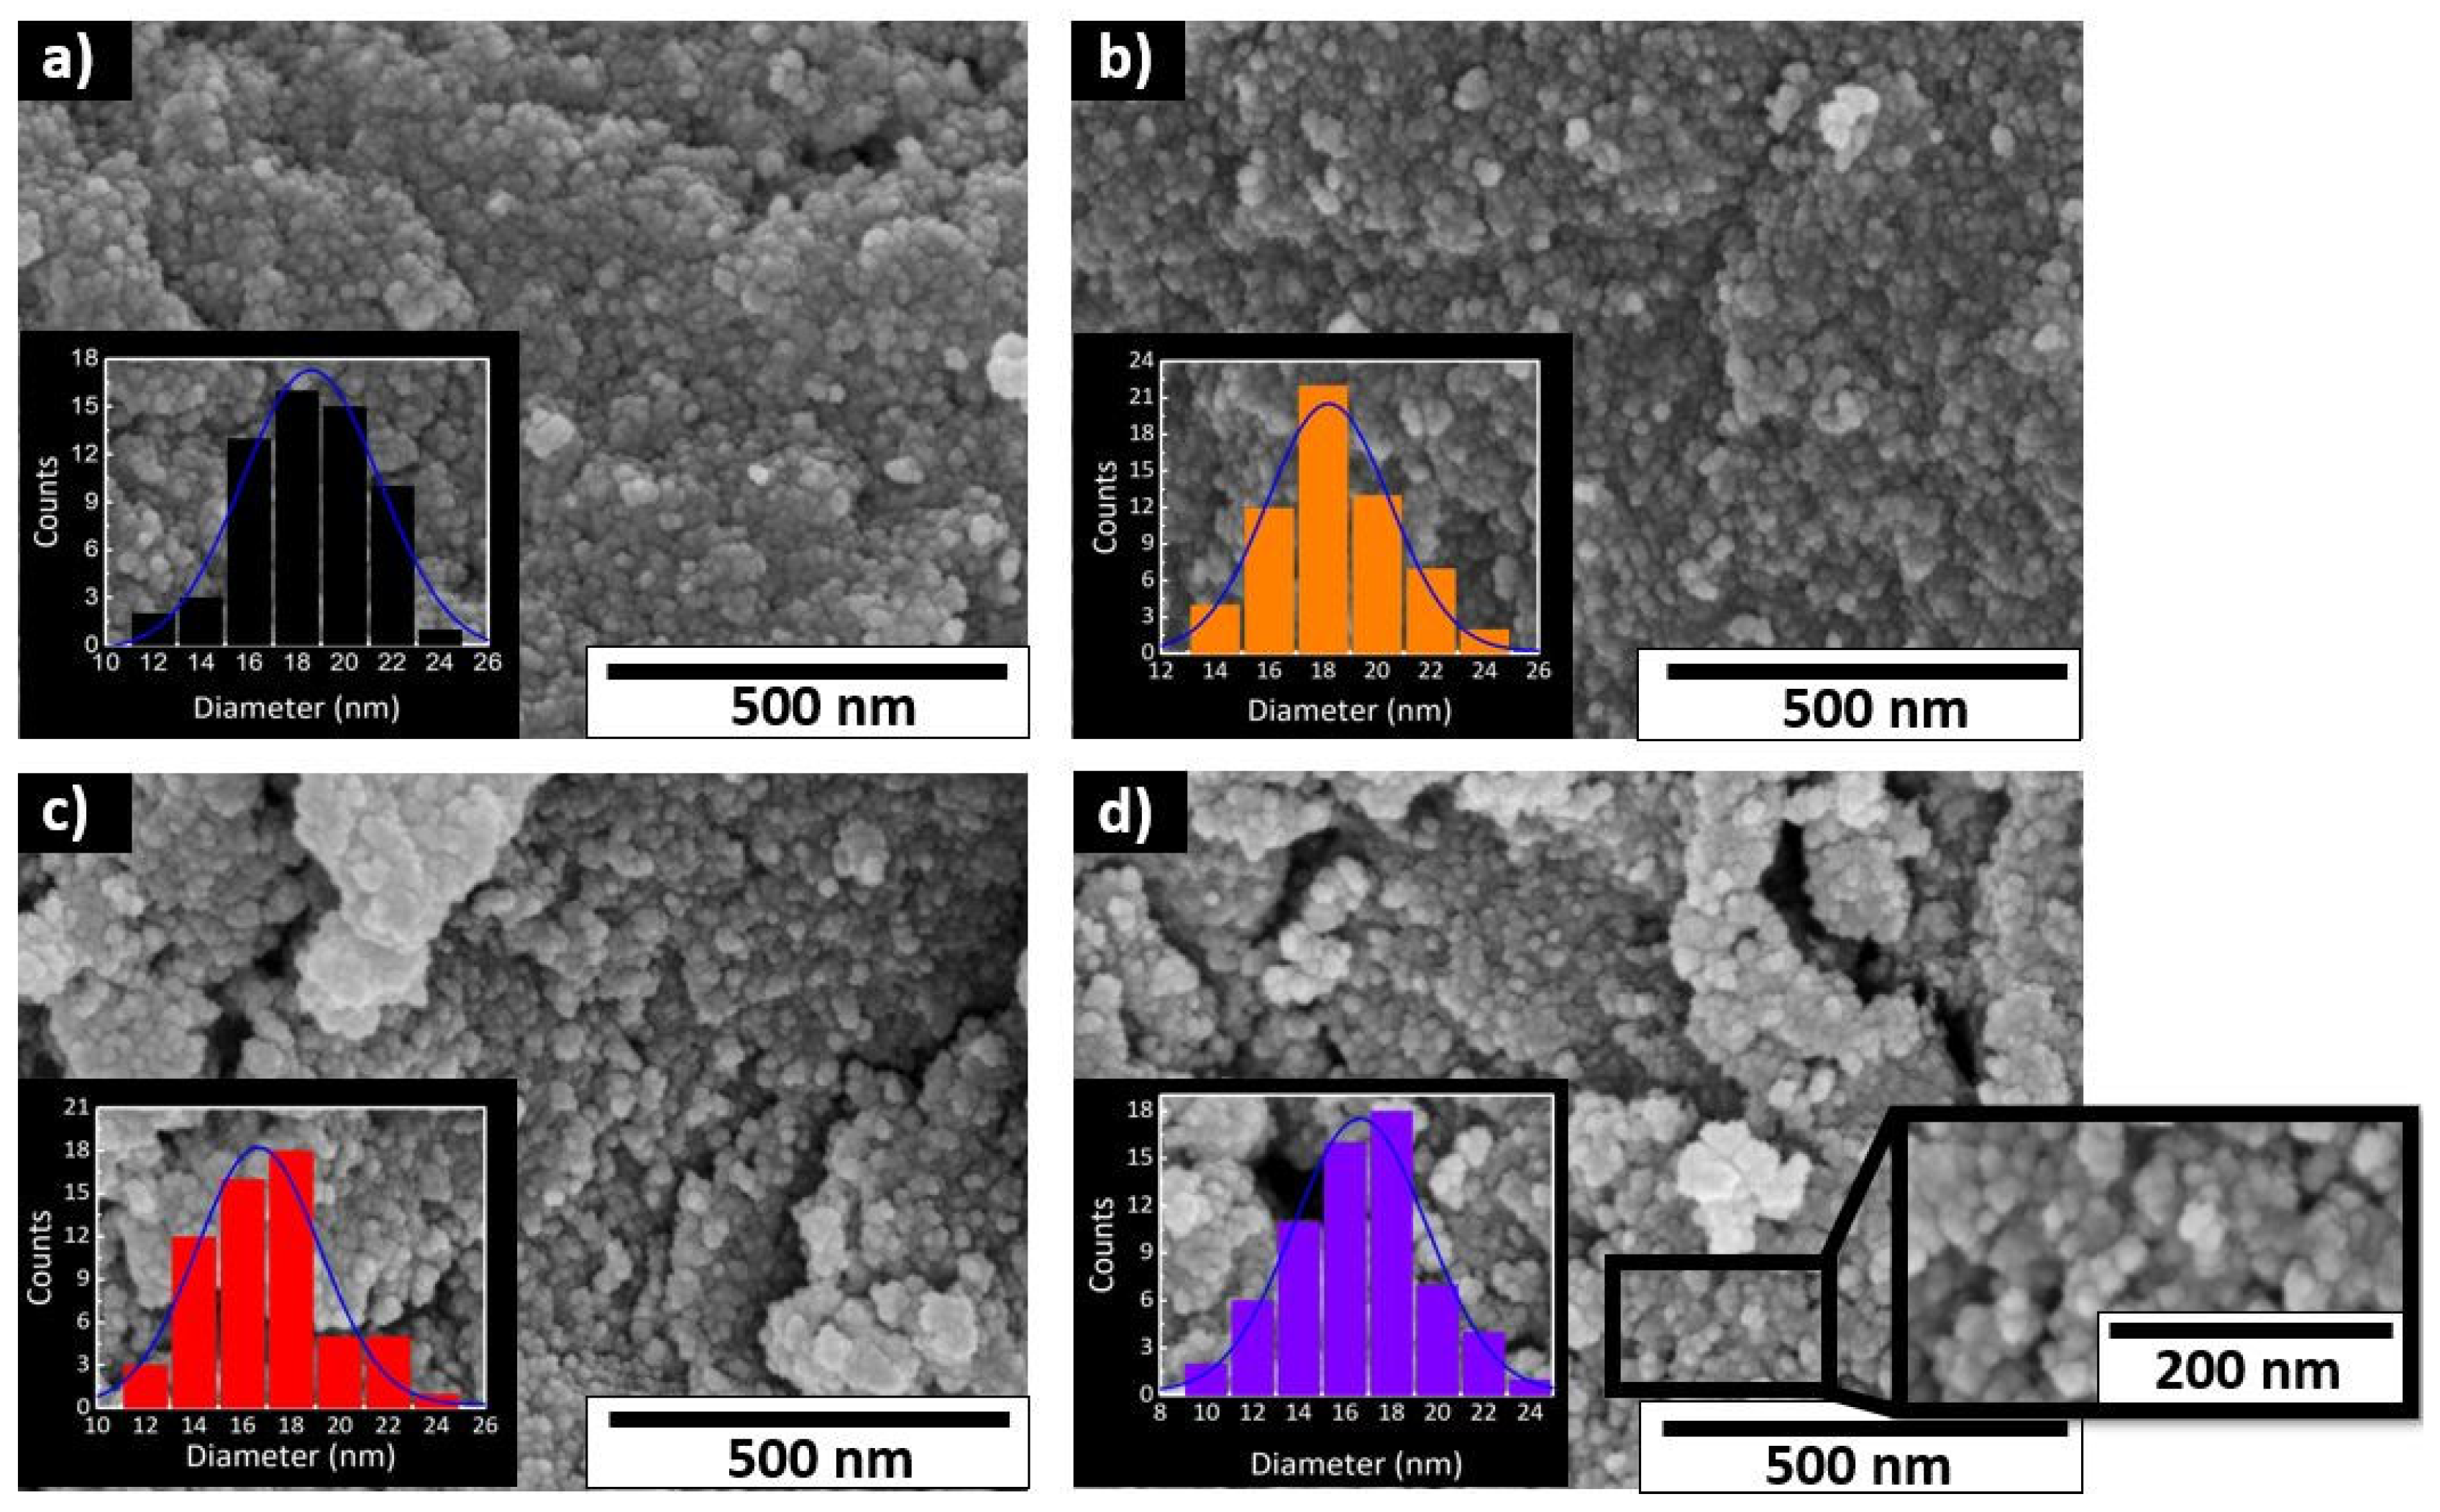
| Sizes (nm) | 6.0 | 5.7 | 5.2 | 4.9 |
| Elements | At. % |
|---|---|
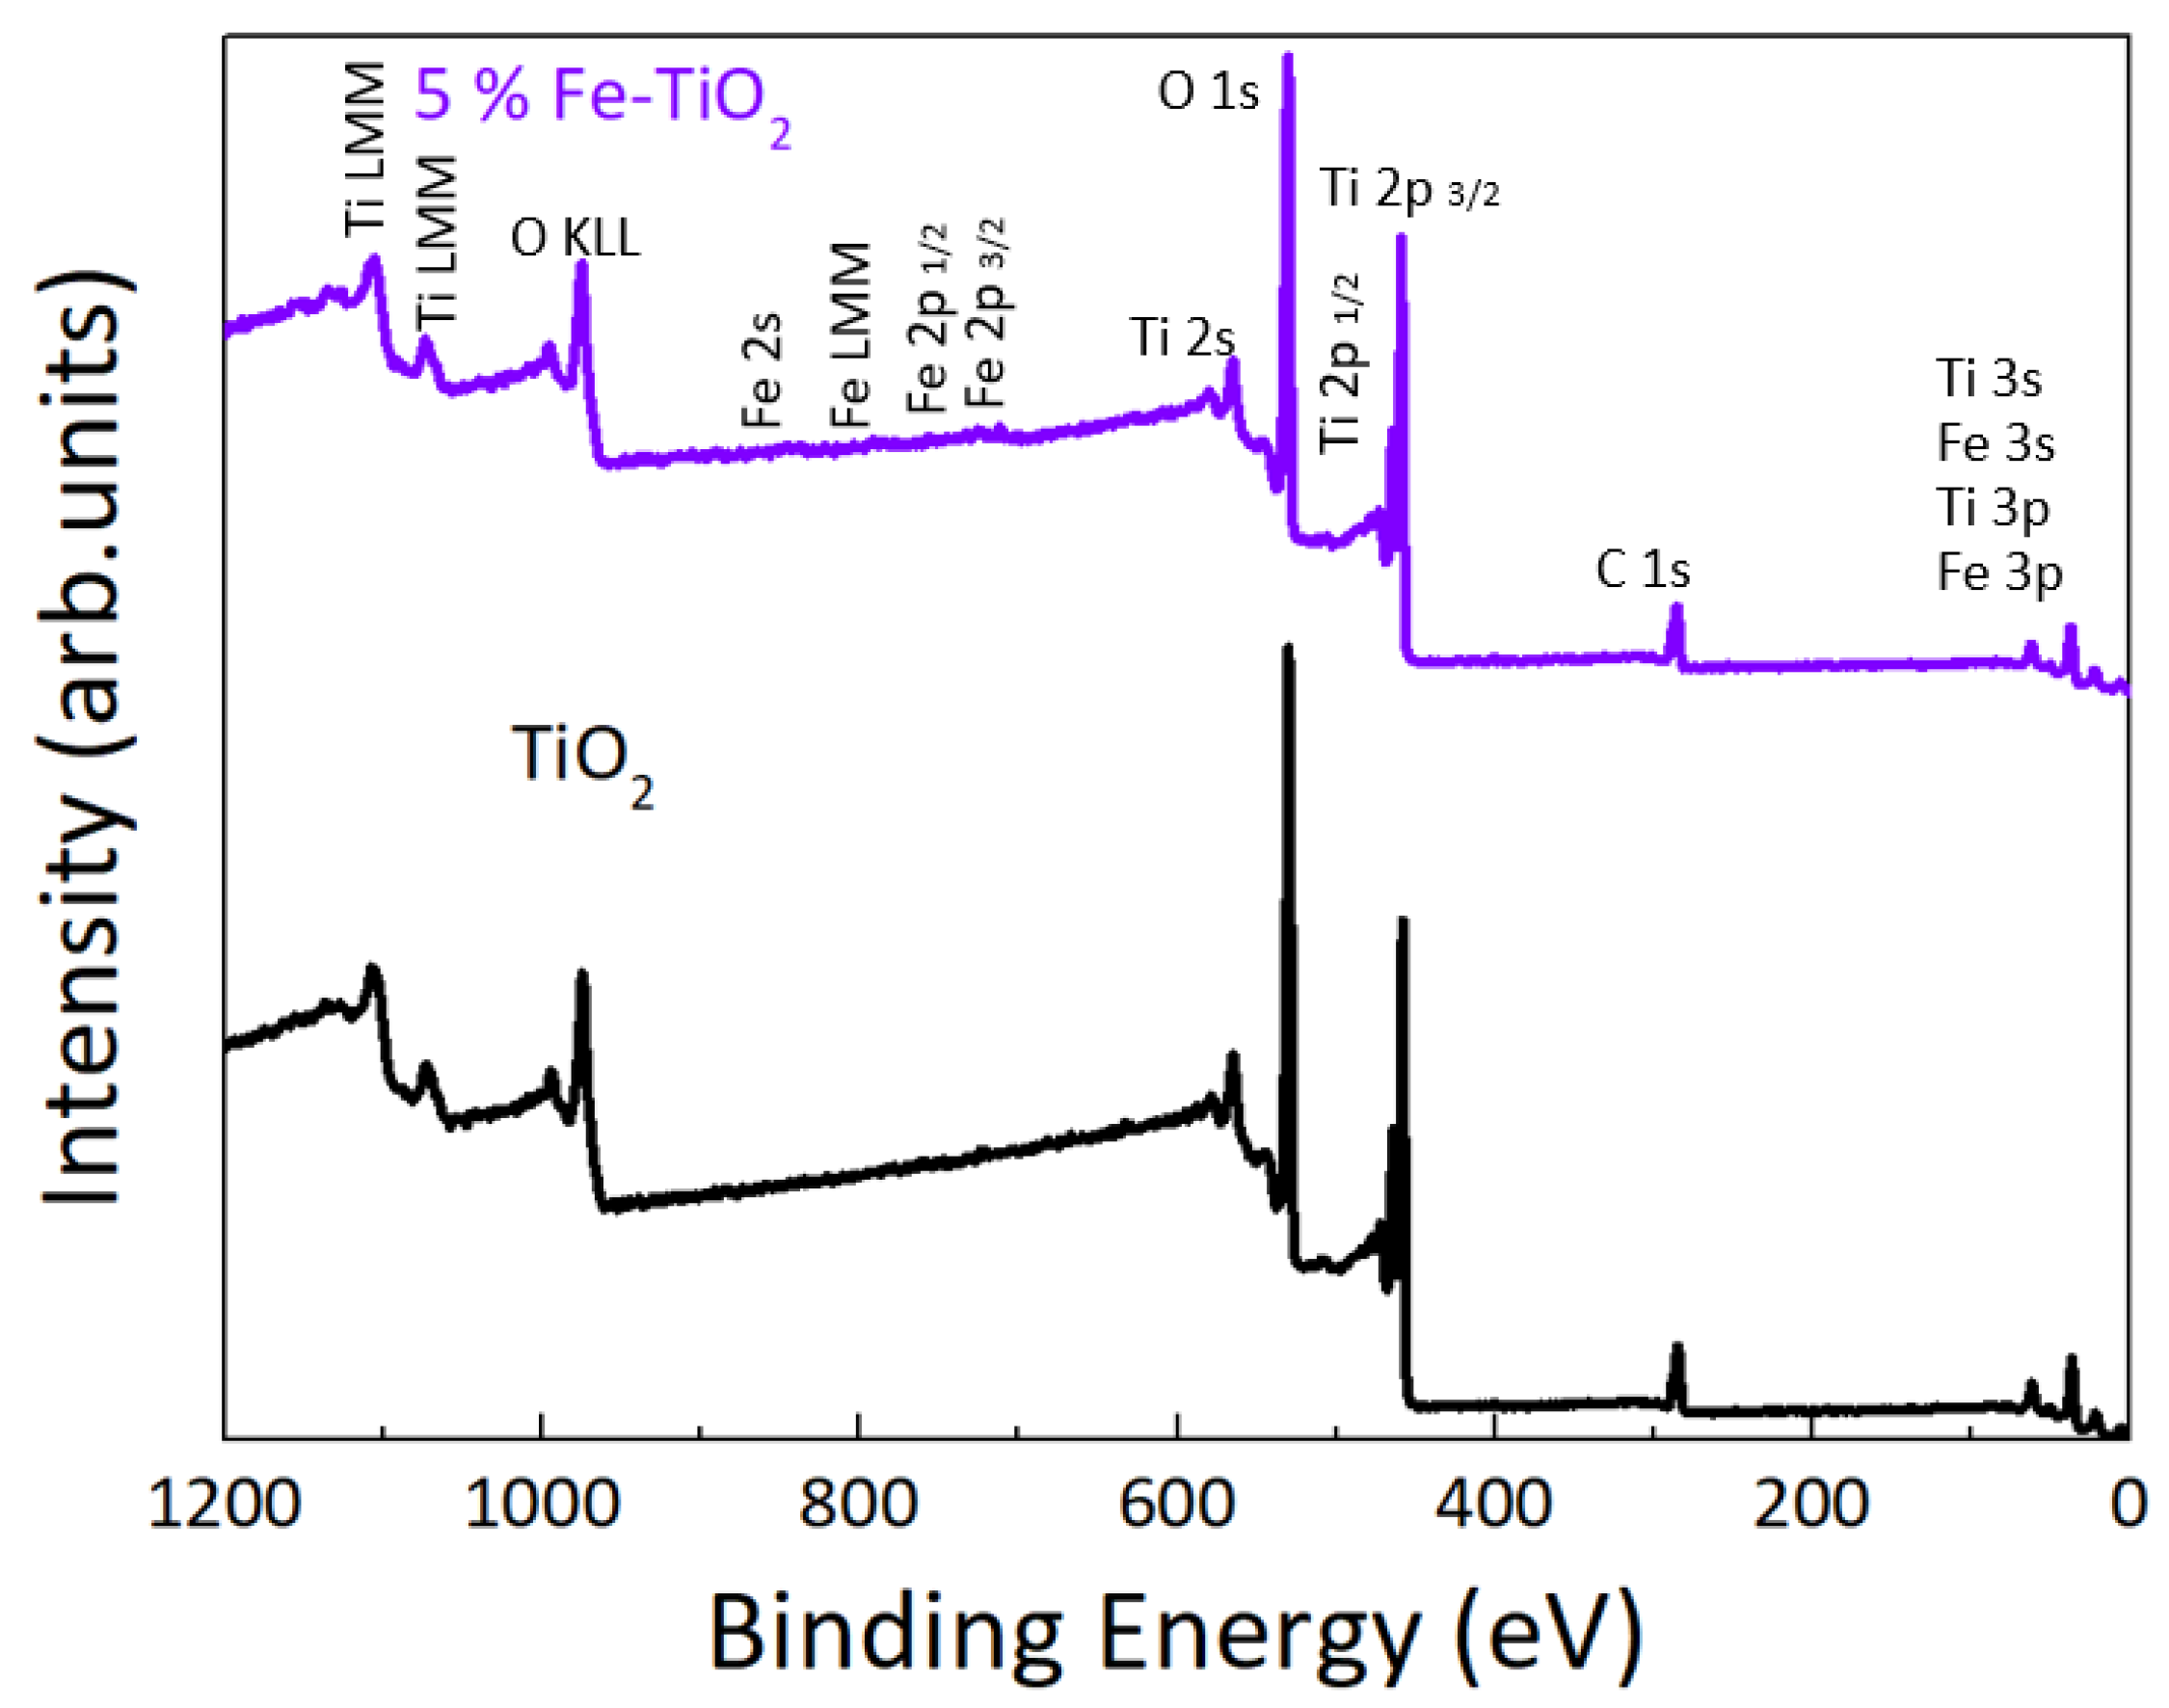
| C | 32.8 |
| Ti | 26.8 |
| O | 39.0 |
| Fe | 1.40 |
| Total | 100 |
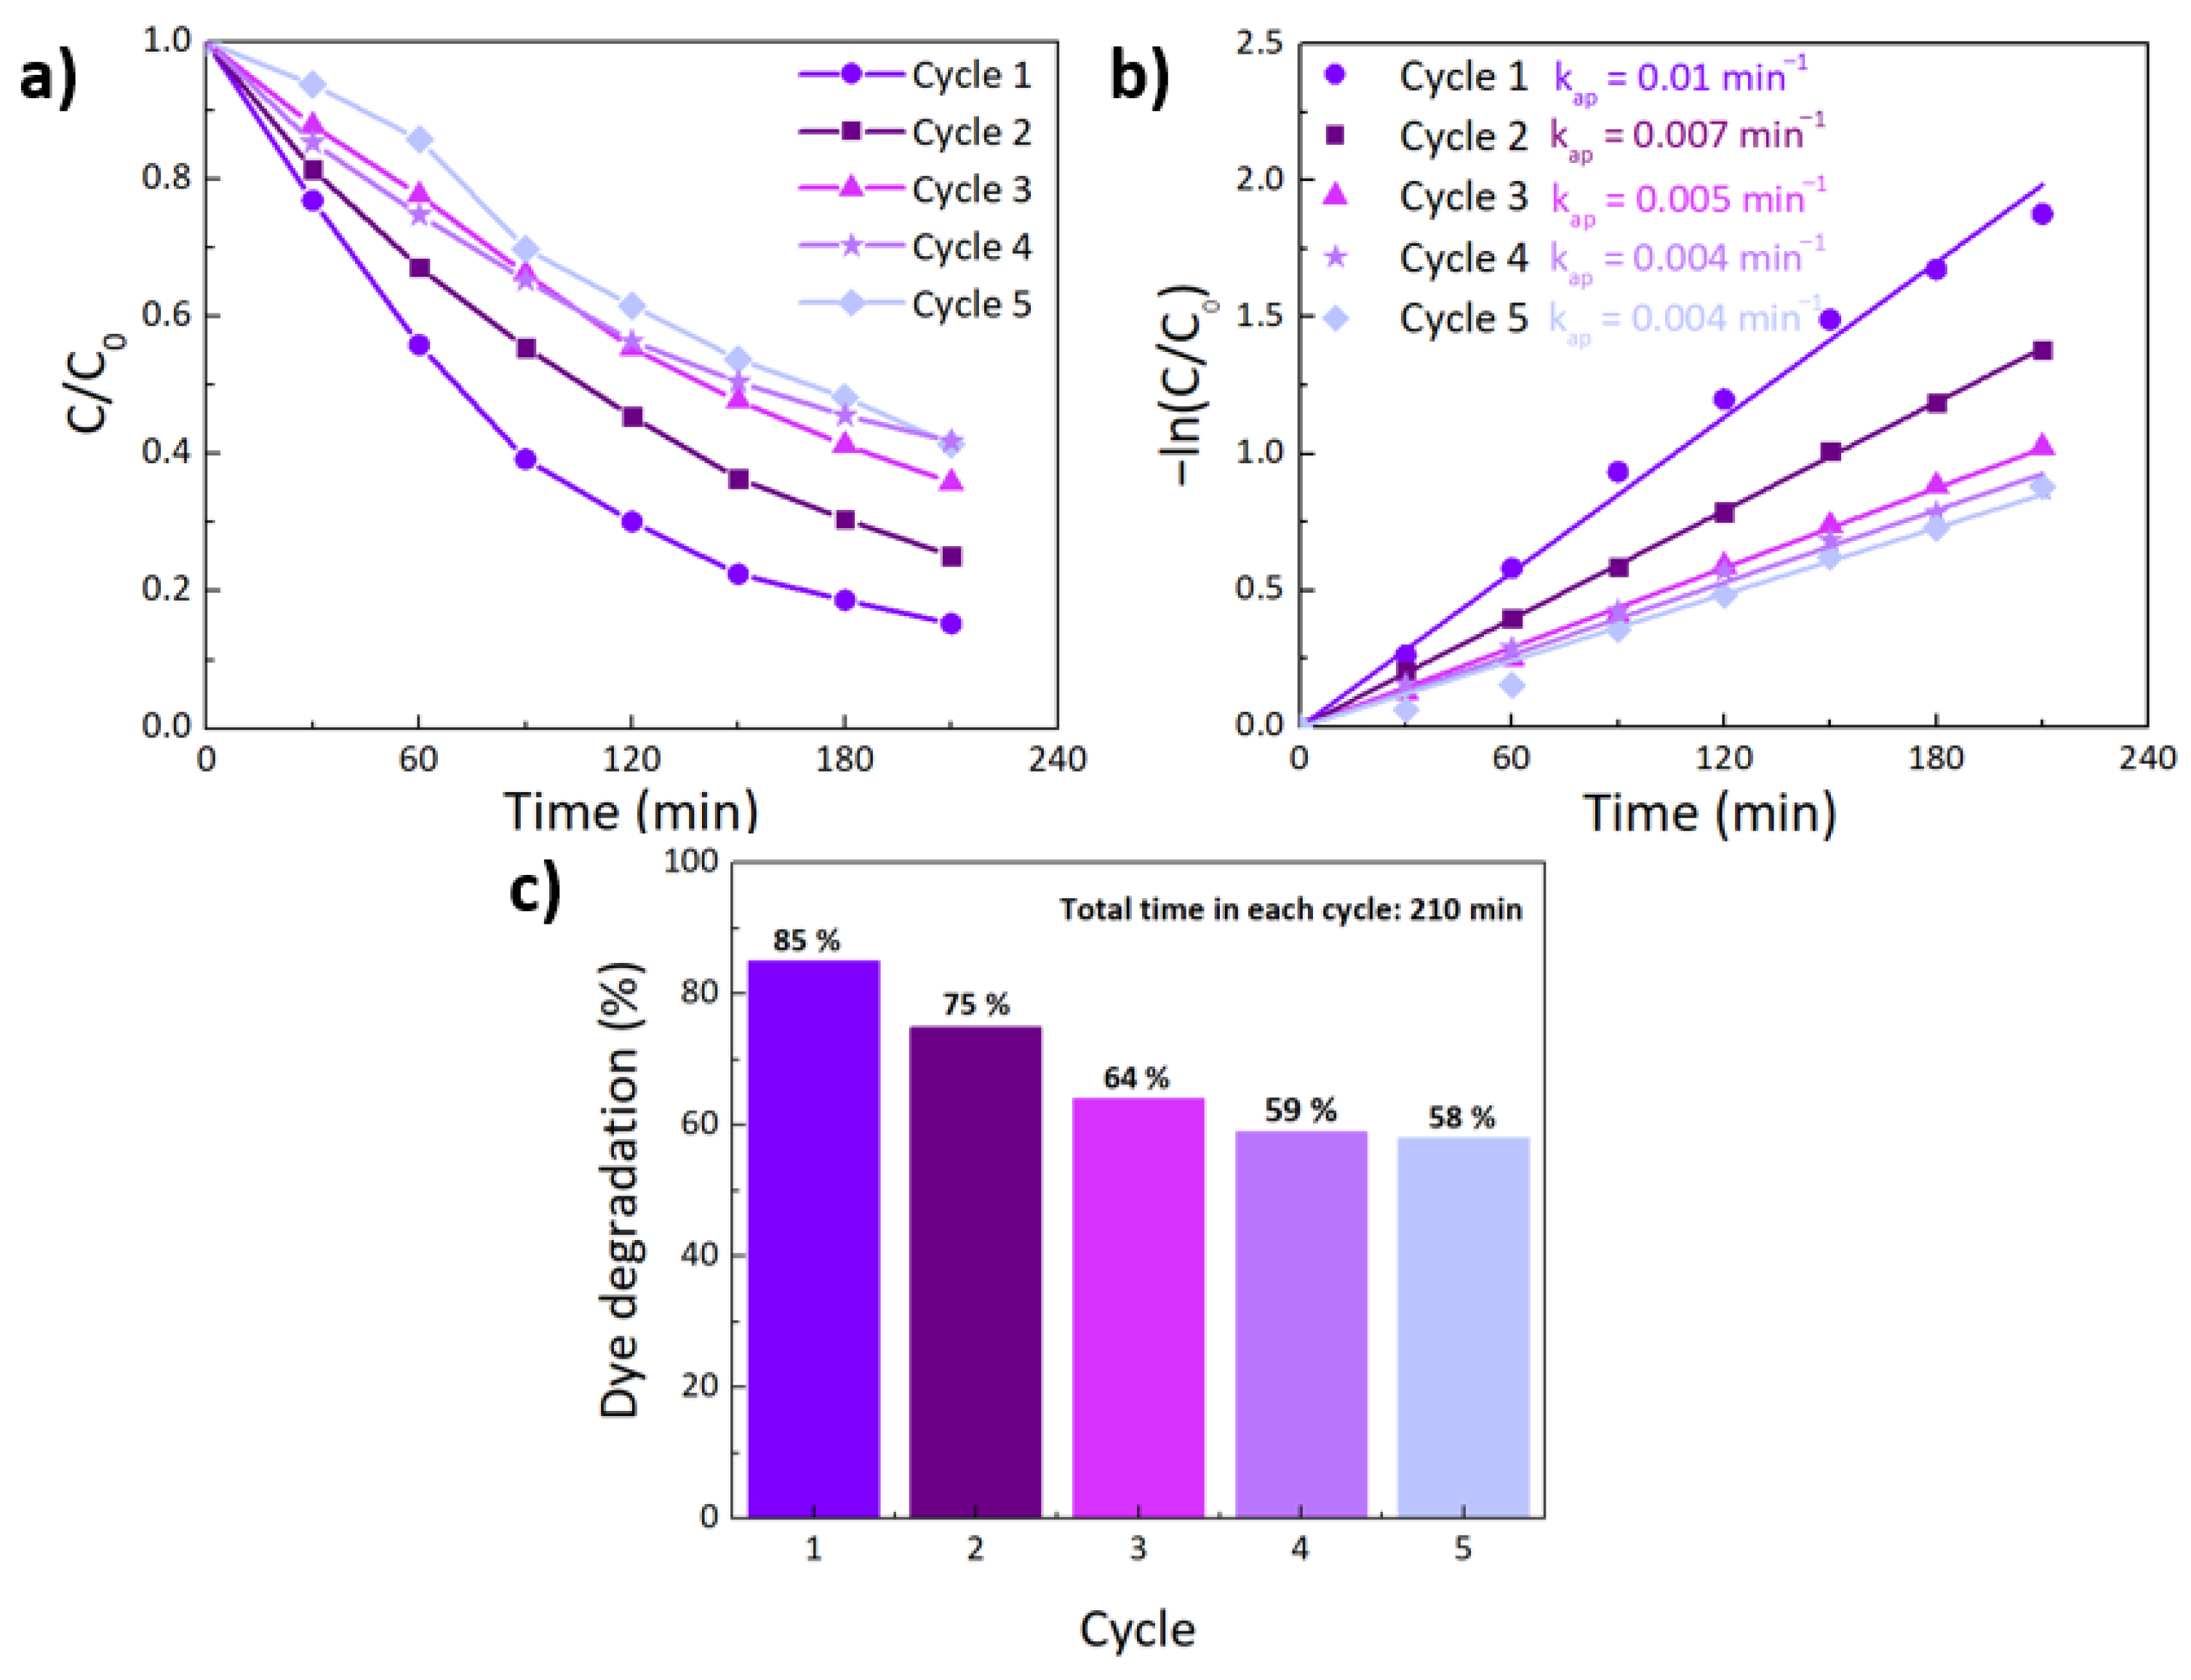
| kap (min−1) | kap (L mg−1 min−1) | R2 | Half-Life Time t1/2 (min) | ||
|---|---|---|---|---|---|
| Pseudo-second order reaction fitting | Pristine | - | 0.007 | 0.99 | 143 |
| Pseudo-first order reaction fitting | TiO2 | 0.007 | - | 0.99 | 99 |
| 5% Fe-TiO2 | 0.01 | - | 0.98 | 69 |
Publisher’s Note: MDPI stays neutral with regard to jurisdictional claims in published maps and institutional affiliations. |
© 2022 by the authors. Licensee MDPI, Basel, Switzerland. This article is an open access article distributed under the terms and conditions of the Creative Commons Attribution (CC BY) license (https://creativecommons.org/licenses/by/4.0/).
Share and Cite
Matias, M.L.; Pimentel, A.; Reis-Machado, A.S.; Rodrigues, J.; Deuermeier, J.; Fortunato, E.; Martins, R.; Nunes, D. Enhanced Fe-TiO2 Solar Photocatalysts on Porous Platforms for Water Purification. Nanomaterials 2022, 12, 1005. https://doi.org/10.3390/nano12061005
Matias ML, Pimentel A, Reis-Machado AS, Rodrigues J, Deuermeier J, Fortunato E, Martins R, Nunes D. Enhanced Fe-TiO2 Solar Photocatalysts on Porous Platforms for Water Purification. Nanomaterials. 2022; 12(6):1005. https://doi.org/10.3390/nano12061005
Chicago/Turabian StyleMatias, Maria Leonor, Ana Pimentel, Ana S. Reis-Machado, Joana Rodrigues, Jonas Deuermeier, Elvira Fortunato, Rodrigo Martins, and Daniela Nunes. 2022. "Enhanced Fe-TiO2 Solar Photocatalysts on Porous Platforms for Water Purification" Nanomaterials 12, no. 6: 1005. https://doi.org/10.3390/nano12061005
APA StyleMatias, M. L., Pimentel, A., Reis-Machado, A. S., Rodrigues, J., Deuermeier, J., Fortunato, E., Martins, R., & Nunes, D. (2022). Enhanced Fe-TiO2 Solar Photocatalysts on Porous Platforms for Water Purification. Nanomaterials, 12(6), 1005. https://doi.org/10.3390/nano12061005