Abstract
The reactivity of a heterogeneous rhodium(III) and ruthenium(II) complex-functionalized TiO2 nanoparticle (NP) system is reported. The ruthenium and rhodium metal complexes work in tandem on the TiO2 NPs surface to generate H2 through water reduction under simulated and normal sunlight irradiation. The functionalized TiO2 NPs outperformed previously reported homogeneous systems in turnover number (TON) and frequency (TOF). The influence of individual components within the system, such as pH, additive, and catalyst, were tested. The NP material was characterized using TGA-MS, 1H NMR spectroscopy, FTIR spectroscopy, solid absorption spectroscopy, and ICP-MS. Gas chromatography was used to determine the reaction kinetics and recyclability of the NP-supported photocatalyst.
1. Introduction
The increasing energy demand of the world population has led to the unsustainable consumption of fossil fuels and emission of greenhouse gases [1,2,3]. Within the next century, fossil fuels will be substantially depleted if consumption rates or energy sources do not change [4]. The development of cleaner, renewable, available, and less-expensive energy solutions has become a central societal and research imperative [5].
Dihydrogen is an outstanding candidate as fuel, possessing key advantages, including long term storage and carbon-free combustion. Liquid or high-pressure gaseous dihydrogen has high gravimetric energy density while lacking volumetric energy density compared to liquid fossil fuels [6]. Hydrogen is the most abundant element in the universe and the tenth most abundant element in the earth’s crust by weight percentage. Terrestrially, only small amounts of elemental H2 occur, with most hydrogen found within molecules, most commonly water [7]. This means dihydrogen for use as fuel must be generated through chemical transformations.
The most common processes for large-scale dihydrogen preparation are water electrolysis and steam methane reforming [8]. Both technologies require high amounts of energy and work best with non-sustainable metal catalysts [8,9,10]. An imperative is improving energy efficiency and using sustainable, recyclable, or easily recoverable catalysts [11]. One option is to combine energy harvesting and dihydrogen evolution using photocatalysts that work under sunlight irradiation [12].
Homogeneous photocatalytic systems can be very efficient, although catalyst recovery can be extremely challenging and cost or energy-intensive [13,14]. In particular, multicomponent systems are problematic. Heterogeneous catalysts are often easier to recover but have the disadvantage of inactive interior volumes with only surface sites being catalytically active [13,14,15]. An alternative is to surface-functionalize nanoparticle (NP) scaffolds composed of cheap and abundant elements with photocatalysts. Such immobilized photocatalysts offer greater catalyst-to-volume ratios than bulk heterogeneous catalysts, which translates to enhanced catalytic activity and turnover. An additional benefit of NPs is the ability to disperse them in liquid phases [16,17,18,19]. A number of heterogeneous NP photocatalytic systems, including CdS NPs [20], Cu-doped TiO2 NPs [21] or ZnO NPs [22], Pt-doped TiO2 NPs [23] or ZnO NPs [24], Ti3+ doped TiO2 NPs [25], and TiO2 mediated ligand-capped RuO2 NPs [26], have been reported as efficient systems for dihydrogen generation. Results of comparable systems are summarized in Table 1.

Table 1.
Comparative H2 evolution materials in the literature.
We now describe the immobilization of components from a previously reported aqueous photochemical system for water reduction under simulated sunlight irradiation [27]. The system utilizes TiO2 NPs supporting ruthenium(II) and rhodium(III) 2,2′-bipyridine (bpy) complexes as photosensitizer and relay species, respectively Scheme 1) [27]. The complexes at the desired surface ratio are assembled on [2,2′-bipyridine]-4,4′-diylbis(phosphonic acid) (1) functionalized NPs (1@TiO2). Comparative studies with ZrO2 NPs are also reported. ZrO2 is an insulator and the NPs are commercially available. The change from TiO2 (band gap = 3.2 eV) [28] to ZrO2 (band gap = 5.1 eV) [29] was expected to yield insights into metal complex to NP surface bonding and electronic interactions.
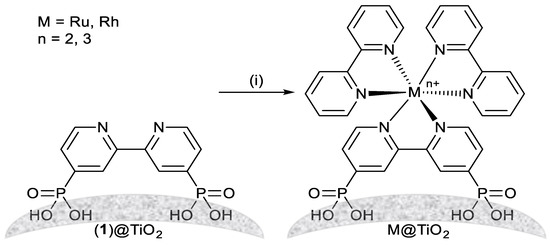
Scheme 1.
Assembly of metal complexes on TiO2 NPs starting from NPs functionalized with 1. Conditions: (i) MCl3·3H2O (M = Ru or Rh), bpy, EtOH: H2O, 160 °C, autoclave, 1 h.
The NPs were characterized using Fourier-transform infrared (FTIR) and solid-state absorption spectroscopies, thermogravimetric analysis mass spectrometry (TGA-MS), triple quadrupole inductively coupled plasma mass spectrometry (ICP-QQQ-MS), and matrix-assisted laser desorption/ionization (MALDI) mass spectrometry while dihydrogen generation was analysed using gas chromatography (GC, see ESI† for details).
2. Materials and Methods
2.1. General
RuCl3·3H2O was purchased from Oxkem Ltd., Reading, UK. RhCl3·3H2O was purchased from Johnson Matthey, Materials Technology UK. 2,2′-Bipyridine and triethanolamine (TEOA) were purchased from Apollo Scientific Ltd., Stockport, UK and Sigma-Aldrich Chemie GmbH, Buchs, Switzerland respectively while K2[PtCl4] was purchased from Alfa Aesar GmbH & Co KG, Karlsruhe, Germany. TiO2 NPs (AEROXIDE TiO2 P25) were purchased from Evonik Industries, Essen, Germany or Sigma-Aldrich Chemie GmbH, Buchs, Switzerland. Pristine ZrO2 NPs (<100 nm particle size) were purchased from Sigma-Aldrich Chemie GmbH, Buchs, Switzerland. For further characterization see ESI†. cis-[Ru(bpy)2Cl2] and anchoring ligand (1) were prepared according to the literature (see ESI† for synthetic details) [30,31,32,33,34,35]. Instrumentation details are given in the ESI†. Calculated major MALDI peaks given in the experimental sections were calculated using the most abundant isotopes (e.g., 102Ru, 35Cl).
2.2. Synthetic Procedures
2.2.1. TiO2 NPs Functionalization
NP activation and functionalization with ligand (1) were carried out according to our previously published procedure [36,37]. The procedures were adjusted according to the molecular weight for anchoring ligand (1) (see following section).
2.2.2. Activation of Commercial P25 TiO2 NPs
The commercially available NPs were activated as previously reported [36]. The procedure was scaled up as follows. Commercial P25 TiO2 NPs (5.00 g) were dispersed by sonication for 15 min in dilute aqueous HNO3 (70 mL, 3 M). The mixture was then stirred for 30 min. The suspension was centrifuged (10 min, 7000 rpm) and the NPs were washed once with milliQ water (70 mL). The NPs were added to milliQ water (50 mL) and dispersed by sonication for 10 min. The suspension was then stirred overnight. The suspension was centrifuged (10 min, 7000 rpm) and the NPs were washed with milliQ water (2 × 50 mL). The activated NPs (4.83 g) were stored in a sealed vial under N2 after drying under high vacuum. TGA: weight loss/%, 1.8 (<380 °C), 0.3 (380–900 °C). TGA-MS: amu, 18, 30 (<380 °C), 18, 44 (380–900 °C). FTIR spectroscopy: 1607, 1582, 1427, and 1298 cm−1. ICP-MS: No ruthenium or rhodium were detected in either the pristine or activated NPs.
2.2.3. Preparation of 1@TiO2
The functionalization was performed as previously reported [36,37] with the procedure adjusted for the anchoring ligand 4,4′-bis(phosphonato)-2,2′-bipyridine as follows. (1) (25.0 mg, 0.079 mmol, 1 eq.) and milliQ water (18 mL) were added to a microwave vial and dispersed by sonication for 1 min. Activated TiO2 NPs (727 mg, 33.9 TiO2 eq.) were added. The suspension was dispersed by sonication for 10 min. The microwave vial was sealed, and the reaction mixture heated for 3 h at 130 °C in the microwave reactor. The suspension was centrifuged (20 min, 7000 rpm) after cooling to room temperature. The NPs were separated from the solvent. The white 1@TiO2 NPs (742 mg) were stored in a sealed vial under N2 after drying under high vacuum. For NMR spectroscopic measurements, 1@TiO2 NPs (5–10 mg) were dispersed in 500 µL D2O in an NMR tube. TGA: weight loss/%, 0.7 (<380 °C), 2.9 (380–900 °C). TGA-MS: amu, 18 (<380 °C), 18, 44 (380–900 °C). FTIR spectroscopy: 1630, 1590, 1540, 1500, 1480, 1430 and 1160 cm–1. ICP-MS: No ruthenium or rhodium was detected. Solid-state absorption spectroscopy: 400–670 nm (weak). MALDI m/z: 317.1 [(1) + H]+ (calc. 317.0), 379.1 [(1) − H + TiO]+ (calc. 378.9), 445.0 [(1) + H + Ti2O2]+ (calc. 444.9) and 656.0 [(1)2 + H + Na]+ (calc. 656.0).
2.2.4. Ru@TiO2
The metal complex was formed directly on the NP surface. Hence, 1@TiO2 (45.9 mg), RuCl3·3H2O (1.03 mg, 3.9 µmol), and 2,2′-bipyridine (1.56 mg, 10.0 µmol) were added to a vial. H2O (5 mL) and EtOH (3 mL) were added, and the mixture was thoroughly dispersed using sonication and stirring. The suspension was transferred to an autoclave PTFE liner with additional EtOH (2 mL). The autoclave was sealed and then heated in an oven with 320 °C/h to 160 °C. The autoclave was left at 160 °C for 1 h. After cooling down the autoclave was opened and the suspension was centrifuged (20 min, 7000 rpm). The resulting NPs were washed with H2O (3 × 10 mL) and EtOH (1 × 10 mL). Ru@TiO2 was isolated as dark orange powder. 1H-NMR spectroscopy, MALDI, TGA-MS, FTIR spectroscopy, ICP-MS, and solid absorption spectroscopy were performed on the NPs. TGA: weight loss/%, 1.5 (<380 °C), 4.6 (380–900 °C). TGA-MS: amu, 18 (<380 °C), 18, 44 (380–900 °C). FTIR spectroscopy: 1640, 1604, 1465, 1447, 1423, 1398, 1156, and 1049 cm–1. ICP-MS: ruthenium present. Solid-state absorption spectroscopy: 400–490 nm, 490–700 nm (weak). MALDI m/z: 414.1 [Ru(bpy)2]+ (calc. 414.0), 535.1 [Ru(1) + TiO2 + K − 2 H]+ (calc. 534.8), 570.1 [Ru(1)(bpy) − 4 H]+ (calc. 569.9), 602.1 [Ru(bpy)2 + CHCA − H]+ (calc. 602.1), 728.9 [Ru(1)(bpy)2 − H]+ (calc. 729.0). (CHCA = α-cyano-4-hydroxycinnamic acid).
2.2.5. Ru@TiO2 Using [Ru(bpy)2Cl2]
1@TiO2 (45.9 mg) and [Ru(bpy)2Cl2] (3.05 mg, 5.0 µmol) were added to a vial. H2O (5 mL) and EtOH (3 mL) were added, and the mixture was thoroughly dispersed using sonication and stirring. The suspension was transferred to an autoclave PTFE liner with additional EtOH (2 mL). The autoclave was sealed and then heated in an oven at a rate of 320 °C/h to 160 °C. The autoclave was left at 160 °C for 1 h. After cooling down, the autoclave was opened and the suspension was centrifuged (20 min, 7000 rpm). The resulting NPs were washed with H2O (3 × 10 mL) and EtOH (1 × 10 mL). Ru@TiO2 was isolated as an orange powder. 1H-NMR spectroscopy, MALDI, TGA-MS, FTIR and solid absorption spectroscopy were performed on the NPs. TGA: weight loss/%, 0.6 (<380 °C), 3.3 (380–900 °C). TGA-MS: amu, 18 (<380 °C), 18, 44 (380–900 °C). FTIR spectroscopy: 1626, 1591, 1544, 1465, 1447, 1428, 1376 and 1155 cm–1. Solid-state absorption spectroscopy: 400–490 nm, 490–700 nm (weak). MALDI m/z: 414.0 [Ru(bpy)2]+ (calc. 414.0), 535.0 [Ru(1) + TiO2 + K – 2 H]+ (calc. 534.8), 570.1 [Ru(1)(bpy) – 4 H]+ (calc. 569.9), 602.0 [Ru(bpy)2 + CHCA – H]+ (calc. 602.1).
2.2.6. Rh@TiO2
The metal complex was formed directly on the NP surface. 1@TiO2 (200 mg), RhCl3·3H2O (4.51 mg, 17.1 µmol) and 2,2′-bipyridine (6.81 mg, 4.36 µmol) were added to a vial. H2O (5 mL) and EtOH (3 mL) were added, and the mixture was thoroughly dispersed using sonication and stirring. The suspension was transferred to an autoclave PTFE liner with additional EtOH (2 mL). The autoclave was sealed and then heated in an oven with 320 °C/h to 160 °C. The autoclave was left at 160 °C for 1 h. After cooling down the autoclave was opened and the suspension was centrifuged (20 min, 7000 rpm). The resulting NPs were washed with H2O (3 × 10 mL) and EtOH (1 × 10 mL). Rh@TiO2 was isolated as white powder. 1H-NMR spectroscopy, MALDI, TGA-MS, FTIR spectroscopy, ICP-MS, and solid absorption spectroscopy were performed on the NPs. TGA: weight loss/%, 1.3 (<380 °C), 3.8 (380–900 °C). TGA-MS: amu, 18 (<380 °C), 18, 44 (380–900 °C). FTIR spectroscopy: 1633, 1607, 1544, 1500, 1470, 1453 1401, 1378, and 1153 cm–1. ICP-MS: rhodium present. Solid-state absorption spectroscopy: 400–440 nm, 440–700 nm (weak). MALDI m/z: 415.0 [Rh(bpy)2]+ (calc. 415.0), 450.0 [Rh(bpy)2 + Cl]+ (calc. 450.0), 603.1 [Rh(bpy)2 + CHCA − H]+ (calc. 603.1) and 656.1 [(1)2 + H + Na]+ (calc. 656.0).
2.2.7. rR-TiO2
The metal complex was formed directly on the NP surface. Hence, 1@TiO2 (241 mg), RuCl3·3H2O (0.24 mg, 0.9 µmol), RhCl3.3H2O (5.16 mg, 19.6 µmol), and 2,2′-bipyridine (8.08 mg, 51.8 µmol) were added to a vial. H2O (5 mL) and EtOH (3 mL) were added, and the mixture was thoroughly dispersed using sonication and stirring. The suspension was transferred to an autoclave PTFE liner with additional EtOH (2 mL). The autoclave was sealed and then heated in an oven at a rate of 320 °C/h to 160 °C. The autoclave was left at 160 °C for 1 h. After cooling down the autoclave was opened and the suspension was centrifuged (20 min, 7000 rpm). The resulting NPs were washed with H2O (3 × 10 mL) and EtOH (1 × 10 mL). rR@TiO2 was isolated as an orange powder. 1H-NMR spectroscopy, MALDI, TGA-MS, FTIR spectroscopy, ICP-MS and solid absorption spectroscopy were performed on the NPs. TGA: weight loss/%, 1.1 (<380 °C), 3.7 (380–900 °C). TGA-MS: amu, 18 (<380 °C), 18, 44 (380–900 °C). FTIR spectroscopy: 1627, 1608, 1546, 1500, 1470, 1453, 1412, 1373 and 1149 cm–1. ICP-MS: ruthenium and rhodium present. Solid-state absorption spectroscopy: 400–490 nm, 490–700 nm (weak). MALDI m/z: 415.0 [Rh(bpy)2]+ (calc. 415.0), 450.0 [Rh(bpy)2 + Cl]+ (calc. 450.0) and 603.1 [Rh(bpy)2 + CHCA − H]+ (calc. 603.1).
2.2.8. RR-TiO2
The metal complex was formed directly on the NP surface. 1@TiO2 (340 mg), RuCl3.3H2O (2.39 mg, 9.1 µmol), RhCl3·3H2O (5.16 mg, 19.6 µmol) and 2,2′-bipyridine (11.3 mg, 72.3 µmol) were added to a vial. H2O (5 mL) and EtOH (3 mL) were added, and the mixture was thoroughly dispersed using sonication and stirring. The suspension was transferred to an autoclave PTFE liner with additional EtOH (2 mL). The autoclave was sealed and then heated in an oven with 320 °C/h to 160 °C. The autoclave was left at 160 °C for 1 h. After cooling down, the autoclave was opened and the suspension was centrifuged (20 min, 7000 rpm). The resulting NPs were washed with H2O (3 × 10 mL) and EtOH (1 × 10 mL). RR-TiO2 was isolated as a dark orange powder. 1H-NMR spectroscopy, MALDI, TGA-MS, FTIR spectroscopy, ICP-MS and solid absorption spectroscopy were performed on the NPs. TGA: weight loss/%, 1.5 (<380 °C), 3.5 (380–900 °C). TGA-MS: amu, 18 (<380 °C), 18, 44 (380–900 °C). FTIR spectroscopy: 1643, 1542, 1498, 1472, 1447, 1423, 1398, 1375 and 1149 cm–1. ICP-MS: ruthenium and rhodium present. Solid-state absorption spectroscopy: 400–490 nm, 490–700 nm (weak). MALDI m/z: 415.1 [Rh(bpy)2]+ (calc. 415.0), 450.1 [Rh(bpy)2 + Cl]+ (calc. 450.0), 603.1 [Rh(bpy)2 + CHCA − H]+ (calc. 603.1) and 656.1 [(1)2 + H + Na]+ (calc. 656.0), 729.1 [Ru(1)(bpy)2 − H]+ (calc. 729.0).
2.2.9. Preparation of 1@ZrO2
The functionalization was performed as previously reported [36,37] without the acid treatment activation step. The procedure was further adjusted for the anchoring ligand 4,4′-bis(phosphonato)-2,2′-bipyridine and a different NP surface as follows. (1) (20.0 mg, 0.063 mmol, 1 eq.) and milliQ water (18 mL) were added to a microwave vial and dispersed by sonication for 1 min. ZrO2 NPs (897 mg, 6.9 ZrO2 eq.) were added. The suspension was dispersed by sonication for 10 min. The microwave vial was sealed, and the reaction mixture heated for 3 h at 130 °C in the microwave reactor. The suspension was centrifuged (20 min, 7000 rpm) after cooling to room temperature. The NPs were separated from the solvent and washed with H2O (3 × 10 mL) and EtOH (1 × 10 mL). The white 1@ZrO2 NPs (856 mg) were stored in a sealed vial under N2 after drying under high vacuum. For NMR spectroscopic measurements, 1@ZrO2 NPs (5–10 mg) were dispersed in 500 µL D2O in an NMR tube. TGA: weight loss/%, 0.6 (<380 °C), 1.7 (380–900 °C). TGA-MS: amu, 18 (<380 °C), 18, 44 (380–900 °C). FTIR spectroscopy: 1625, 1590, 1542, 1496, 1473, 1432, 1376, 1223, 1152, 1038, 1000, 840, 744, 658, 562 and 480 cm–1.
2.2.10. Ru@ZrO2
The metal complex was formed directly on the NP surface. Hence, 1@ZrO2 (142 mg), RuCl3·3H2O (2.07 mg, 7.9 µmol), and 2,2′-bipyridine (2.50 mg, 16.0 µmol) were added to a vial. H2O (5 mL) and EtOH (3 mL) were added, and the mixture was thoroughly dispersed using sonication and stirring. The suspension was transferred to an autoclave PTFE liner with additional EtOH (2 mL). The autoclave was sealed and then heated in an oven with 320 °C/h to 160 °C. The autoclave was left at 160 °C for 1 h. After cooling down the autoclave was opened and the suspension was centrifuged (20 min, 7000 rpm). The resulting NPs were washed with H2O (3 × 10 mL) and EtOH (1 × 10 mL). Ru@ZrO2 was isolated as an ochre powder. 1H-NMR spectroscopy, MALDI, TGA-MS and FTIR spectroscopy were performed on the NPs. TGA: weight loss/%, 0.6 (<380 °C), 2.1 (380–900 °C). TGA-MS: amu, 18 (<380 °C), 18, 44 (380–900 °C). FTIR spectroscopy: 1644, 1604, 1544, 1465, 1447, 1422, 1398, 1223, 1160, 1122, 1057, 913, 744, 658, 562, and 480 cm–1.
2.2.11. rR-ZrO2
The metal complex was formed directly on the NP surface. Hence, 1@ZrO2 (366 mg), RuCl3·3H2O (0.24 mg, 0.9 µmol), RhCl3.3H2O (5.16 mg, 19.6 µmol) and 2,2′-bipyridine (6.45 mg, 41.3 µmol) were added to a vial. H2O (5 mL) and EtOH (3 mL) were added, and the mixture was thoroughly dispersed using sonication and stirring. The suspension was transferred to an autoclave PTFE liner with additional EtOH (2 mL). The autoclave was sealed and then heated in an oven with 320 °C/h to 160 °C. The autoclave was left at 160 °C for 1 h. After cooling down the autoclave was opened and the suspension was centrifuged (20 min, 7000 rpm). The resulting NPs were washed with H2O (3 × 10 mL) and EtOH (1 × 10 mL). rR@ZrO2 was isolated as light orange powder. 1H-NMR spectroscopy, MALDI, TGA-MS and FTIR spectroscopy were performed on the NPs. TGA: weight loss/%, 0.4 (<380 °C), 2.1 (380–900 °C). TGA-MS: amu, 18 (<380 °C), 18, 44 (380–900 °C). FTIR spectroscopy: 1633, 1606, 1589, 1541, 1498, 1468, 1452, 1429, 1398, 1375, 1215, 1156, 1042, 1000, 910, 839, 744, 658, 562, and 480 cm–1.
2.3. Dihydrogen Generation
2.3.1. General Procedure
The system for dihydrogen generation used metal complex functionalized NPs [38] as photo- and electrocatalysts, triethanolamine as a sacrificial electron donor, K2[PtCl4] as catalyst to facilitate dihydrogen formation (possibly by Pt NP formation), bpy as additive, aqueous H2SO4 for pH adjustment, and milliQ water as solvent. As [Ru(bpy)3]2+ and [Rh(bpy)3]3+ are somewhat photolabile under the operating conditions, the additional bpy was added to regenerate ruthenium and rhodium surface-bound complexes.
In a 5 mL microwave vial TEOA (2.52 mmol, 376 mg), K2[PtCl4] (1.7 µmol, 0.70 mg) and 2,2′-bipyridine (18.6 µmol, 2.91 mg) were added together with milliQ water and aqueous H2SO4 (1M) to modify the pH. Experiments performed at pH 10 used no aqueous H2SO4 (1M) and 6 mL milliQ water while experiments performed at pH 7.5 used 1 mL aqueous H2SO4 (1M) and 5 mL milliQ water. Metal complex-functionalized NPs were added (114.1 mg). The vial was flushed with nitrogen and then sealed. The suspension was sonicated (10 min) and thoroughly shaken. Nitrogen was bubbled through the suspension for 10 min. The vial was irradiated for 4–8 h at a slight angle (5°) with a sun simulator generating 1200 W m–2. The suspension was shaken hourly. Headspace samples for gas chromatography were collected using a syringe and transferred to a 10 mL GC vial for analysis. The measured GC integral was converted to mL of H2 with a calibration made by injecting several known volumes of dihydrogen.
2.3.2. Kinetic Measurements
Using the general procedure, a kinetic run was performed at pH 7.5 using rR@TiO2 as photocatalyst. Two vials were prepared and the H2 evolution was measured hourly by collecting the headspace by syringe and transferring it to a 10 mL GC vial for GC analysis. After each collection, the suspension was bubbled with N2 for 5 min and then irradiation was continued. The vials were irradiated in total for 8 h and 9 h respectively.
2.3.3. Recycle Measurements
Using the general procedure, a recycling experiment was performed preparing two vials at pH 7.5 using rR@TiO2 as photocatalyst with 4 h irradiation for each cycle. H2 evolution was recorded after each cycle by collecting the headspace by syringe and transferring it to a 10 mL GC vial for GC analysis. After each collection, the suspension was centrifuged, the supernatant was removed, the NPs were washed with water (4 × 10 mL). Subsequently, the NPs were dried under high vacuum. Following the general procedure, the recycled NPs were used instead for the next cycle.
3. Results and Discussion
3.1. Ligand Functionalization, Surface Complexation and Material Characterisation
3.1.1. Anchoring Ligand Functionalization
We commenced by establishing a reliable method for the preparation of 1@TiO2 and its subsequent metallation. Anchoring ligand 1 was prepared according to the literature [31,32,33,34,35] with the phosphonic acid being chosen for stable binding to TiO2 surfaces in neutral, slightly basic and slightly acidic conditions [36,37]. The bpy metal-binding domain in 1 is commensurate with the assembly of surface-bound {M(bpy)3}n+ (M = Ru, n = 2; M = Rh, n = 3) motifs. The previously developed method [36,37] for NP anchor functionalization with tpy metal-binding domains was adapted for anchoring ligand 1. In this case, 32.2 eq. of activated NPs [38,39] were dispersed with anchoring ligand 1 in water and heated to 130 °C for 3 h in a microwave reactor (see Experimental section for full details).
The purchased ZrO2 NPs were functionalized using similar techniques but without prior activation. The ZrO2 NPs had a diameter of 100 nm changing the surface area to volume ratio significantly (from 28% to 6%). The functionalization method was optimized using our previously established formula [38] to give an adjusted ratio of 6.9 ZrO2 eq. to 1 eq. anchoring ligand. The resulting NPs were carefully washed to avoid non-bound free ligand.
3.1.2. Ligand Functionalized NP Characterisation Methods
The 1@TiO2 NPs were analysed using TGA-MS (see Figure S1) and showed a small weight loss (<1%) in two steps (<120 °C, <380 °C) attributed to the loss of physisorbed and chemisorbed water. This was further seen in the coupled MS, which showed peaks with m/z of 17 and 18 for HO and H2O respectively. A further weight loss of 2.9% over the range of 380–900 °C was measured and attributed to the decomposition of the anchoring ligand on the surface. The MS in this range showed the decomposition product of the ligand to be CO2. In contrast, activated NPs (see Figure S2) showed almost no weight loss over the range of 380–900 °C. To verify that the organic weight loss within the 380–900 °C range was not caused by non-covalently bound free ligand, the 1H NMR spectrum of 1@TiO2 was measured in D2O (see Figure S3) and showed no significant amounts of free ligand in solution (ligand bound to the NPs is not observed) [36]. Further characterisation with FTIR spectroscopy (see Figure S4) and solid-state absorption spectroscopy (see Figure S5) revealed peaks at 1630, 1590, 1540, 1500, 1480, 1430, and 1160 cm–1 and 400–670 nm respectively which are not observed for pristine activated NPs. The additional peaks found for 1@TiO2 in FTIR spectroscopy did match to the pristine anchoring ligand. MALDI mass spectrometry showed peaks arising from species consistent with surface binding of the phosphonate ligand (See Figures S6–S8).
1@ZrO2 was characterized similarly to 1@TiO2: TGA-MS, 1H NMR spectroscopy, and FTIR spectroscopy (see Figures S9–S12) were measured. 1@ZrO2 showed a weight loss of 1.7% over the range of 380–900 °C, which was attributed to the decomposition of the anchoring ligand on the surface. The MS in this range showed the decomposition product of the ligand to be CO2. The commercial NPs did not show any weight loss other than H2O. 1H NMR spectroscopy in D2O was used to verify absence of non-covalently bound free ligand and no significant amounts of free ligand in solution were observed. FTIR spectroscopy showed several weak additional peaks compared to the commercial NPs within the 1600 and 800 cm–1 region (see ESI† Figure S12) originating from the anchoring ligand.
3.1.3. Nanoparticle Surface Complexation
Metal complexes were assembled directly on the NP surface using methods derived from literature procedures for heteroleptic ruthenium(II) complexes, replacing free ligand by 1@TiO2 (Table 2) [35]. Orange Ru@TiO2 was isolated from the reaction of 1@TiO2 NPs [38], RuCl3.3H2O, and bpy in 1:1 water-ethanol in an autoclave at 160 °C for 1 h (see Experimental section for full details). Ru@TiO2 can also be formed by replacing RuCl3.3H2O and bpy with [Ru(bpy)2Cl2], giving a similar product (TGA-MS, 1H NMR spectroscopy, FTIR and solid-state absorption spectroscopies, MALDI mass spectrometry see Figures S13–S27) differing only slightly in colour and small weight loss differences during the TGA measurement. All subsequent metal complex-functionalized NPs (Table 2) were prepared in the autoclave with H2O/EtOH as solvent using the one-pot (MCl3 + bpy) procedure described in the experimental. The abbreviation rR@TiO2 describes metal complex functionalized NPs with a small amount of ruthenium vs. rhodium (1:20) on the surface, while for RR@TiO2 ruthenium and rhodium surface concentrations are comparatively similar (1:2). The first letter in rR and RR always refers to ruthenium and the second to rhodium.
Table 2.
Different metal complex functionalized nanoparticles.
The metal complexes Ru@ZrO2 and rR@ZrO2 were prepared using 1@ZrO2 as starting material and followed the procedure described above with TiO2.
3.1.4. Complex Functionalized Characterisation Methods
All metal complex-functionalized NPs species were characterized using the same methods as 1@TiO2. For both Ru@TiO2 and Rh@TiO2, TGA-MS (Figures S13 and S28) confirmed a higher weight loss (380–900 °C) than 1@TiO2. 1H NMR spectroscopy (Figures S15 and S29) showed that no labile species were adsorbed on the NPs. In contrast to 1@TiO2, FTIR spectroscopy (Figures S16 and S30) showed absorptions between 1650 and 1590 cm−1 in addition to 1540, 1470, 1450, 1400, and 1150 cm–1 originating from the organic ligands. Solid-state absorption spectroscopy showed broad and weak absorptions between 400 and 670 nm. Additionally Rh@TiO2 showed a more pronounced absorption band at 420 nm (Figure S31), whilst any surface bound ruthenium complex gave dominant absorptions between 410 and 490 nm (Figure S17). The MALDI mass spectrum of Rh@TiO2 (see Figures S32–S35) showed masses with the correct isotope pattern at m/z: 415.0 [Rh(bpy)2]+ (calc. 415.0), 450.0 [Rh(bpy)2 + Cl]+ (calc. 450.0), 603.1 [Rh(bpy)2 + CHCA − H]+ (calc. 603.1) and 656.1 [(1)2 + H + Na]+ (calc. 656.0), while that of Ru@TiO2 (Figures S18–S27) showed masses with the correct isotope patterns at m/z: 414.1 [Ru(bpy)2]+ (calc. 414.0), 535.1 [Ru(1) + TiO2 + K − 2 H]+ (calc. 534.8), 570.1 [Ru(1)(bpy) − 4 H]+ (calc. 569.9), 602.1 [Ru(bpy)2 + CHCA − H]+ (calc. 602.1), 728.9 [Ru(1)(bpy)2 − H]+ (calc. 729.0). For NPs containing both ruthenium and rhodium, the observed isotope distribution in the MALDI mass spectrum confirmed that the rhodium complex was dominant (Figures S36–S44). For full characterisation details, see Section 2 or ESI† Figures S36–S49.
Emission spectra of the metal complex functionalized NPs dispersed in water were recorded (Figure 1). The suspension was excited at 450 nm. Ru@TiO2 showed a broad emission at 634 nm while RR@TiO2 showed a broad emission at 630 nm. Both Rh@TiO2 and rR@TiO2 were non-emissive.

Figure 1.
Emission spectra of complex-functionalized NPs after excitation at 450 nm. Excitation slit width 3 nm, emission slit width 10 nm.
The NPs were further investigated using ICP-MS (see Table 3). Ruthenium or rhodium functionalized NPs showed their respective elements. It was not possible to perform an exact surface concentration measurement of the elements with ICP-MS as even concentrated nitric acid did not remove all of the surface-bound species from the NP.
Table 3.
ICP-MS concentration and standard deviation of functionalized TiO2 NPs.
For Ru@ZrO2 and rR@ZrO2, characterization was performed using TGA-MS, 1H NMR spectroscopy, and FTIR spectroscopy (see Figure S12 and Figures S50–S52). TGA-MS of Ru@ZrO2 and rR@ZrO2 revealed a smaller weight loss of 2.1% (380–900 °C) compared to the TiO2 equivalents Ru@TiO2 (4.6%) and rR@TiO2 (3.7%). This was within expectations considering the weight loss seen for 1@ZrO2. Importantly, an increase from 1@ZrO2 to Ru@ZrO2 or rR@ZrO2 was still observed. 1H NMR spectroscopy was used to verify the absence of non-bound anchoring ligand while the FTIR spectra showed only minor differences to 1@ZrO2 within 1600–800 cm–1.
3.2. Dihydrogen Generation
3.2.1. Performance and Influence of Individual Components during Dihydrogen Generation
Experimental details are given in Section 2.3.1. The study revealed that 1@TiO2, Ru@TiO2, and Rh@TiO2 all produce H2 under irradiation (Table 4) but the gas generation is significantly higher when both ruthenium and rhodium are present on the surface. It is especially interesting that when a single batch of NPs was functionalized with both metal complexes (rR@TiO2 or RR@TiO2), the H2 production was more than double compared to that using an equivalent mixture of Ru@TiO2 and Rh@TiO2. We propose that the additional efficiency for rR@TiO2 and RR@TiO2 can be explained by an energy transfer from Ru to Rh which promotes the dihydrogen generation [27,40]. The recorded emission spectra of each species support this proposal as rR@TiO2 is not emissive. It has to be noted that the energy transfer must be relatively inefficient since with higher ruthenium concentrations on the surface (RR@TiO2 vs. rR@TiO2) the metal complex functionalized NPs are emissive again.
Table 4.
Performed dihydrogen generating experiments; see Table 2 for NP abbreviations.
Further experiments were performed to test the influence of each component in the system. In the absence of K2[PtCl4], there was a strong decrease in efficiency while K2[PtCl4] on its own gave no H2 generation. Removing bpy had a less significant influence on the H2 generation but slightly lowered the efficiency. In contrast, increasing the bpy concentration had no effect on the efficiency. TEOA was essential for dihydrogen formation. Another important parameter was the pH; at pH 10 the system generated dihydrogen at half the rate observed at pH 7.5. A pH dependence is expected as the formal driving force of the reaction (ΔG) will depend upon pH according to the Nernst equation (ΔG = −nFE) since the key step in the formation of H2 involves a proton. A significant improvement in H2 formation (17%, TOFRh = 3.4 × 10⁻³ s–1, TOFRu = 7.4 × 10⁻² s–1) could be observed by simple stirring of the suspension instead of periodic shaking. This shows when the metal complex functionalized NPs settle and block the light, they partially hinder a successful water reduction on covered NPs. For this observation to be possible, a successful surface functionalization must have happened. A further experiment was performed by using normal sunlight, resulting in respectable dihydrogen generation (see Table 4, Entry 15 g), especially since the weather conditions were not bright sunlight.
The dihydrogen generation experiment was expanded using ZrO2 NPs as the metal complex carrier material. Since ZrO2 is an insulator, the change from TiO2 (band gap = 3.2 eV) [28] to ZrO2 (band gap = 5.1 eV) [29] was expected to hinder the H2 generation during the experiment if the metal complex is surface-bound and interacting electronically with the NP. Hence, the experiment (see Table 4, Entry 16 f) yielding almost no H2 generation during the irradiation was interesting and strongly implies mediation by the semiconducting TiO2 nanoparticles.
3.2.2. Kinetics of rR@TiO2 during Light Irradiation
The kinetics of the H2 formation when using rR@TiO2 in the general setup was investigated and the experimental results are plotted in Figure 2a) and shown in Table 5. Experimental details are given in Section 2.3.2. Analysis of the data in Figure 2 when TEOA was considered as a reactant (see Figure 2b) indicated first order kinetics (R2 = 0.986) or second order kinetics (R2 = 0.995). This observation is consistent with the mechanism proposed by Kirch et al. [27]. Using these data, a minimal TON of 86 (TOF = 2.7 × 10⁻³ s–1) and TON 1844 (TOF = 5.7 × 10⁻² s–1) can be calculated for the rhodium and ruthenium surface-bound complexes respectively. Furthermore, the amount of H2 produced after 9 h irradiation corresponds to a depletion of 32% of TEOA.
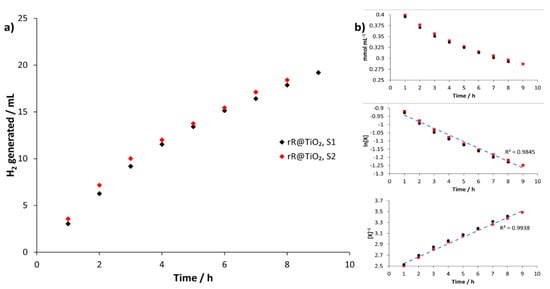
Figure 2.
(a) Graphical representation of H2 generated using rR@TiO2 in mL during light irradiation experiments versus time for two samples. (b) Zeroth order reaction graph (top), concentration (mmol per mL) starting material during kinetic irradiation measurements of two samples (red and black) against time (hours); 1st order reaction graph (middle), natural logarithm of starting material concentration [X] during kinetic irradiation measurements of two samples (red and black) against time (hours), linear trendline through datapoints (blue); 2nd order reaction graph (bottom), One over concentration [X] of starting material during kinetic irradiation measurements of two samples (red and black) against time (hours), linear trendline through data points (blue).
Table 5.
Performed hourly kinetic dihydrogen generating experiment of two sample vials.
3.2.3. Recyclability of rR@TiO2
Our motivation was to develop a system that could be recycled multiple times and still generate dihydrogen upon irradiation (see Video 1 in the ESI† for visual representation). After an initial run, the NPs were separated from the solution and washed several times with water to ensure the complete removal of the solution components. The NPs were then dried under high vacuum and redispersed in milliQ water at pH 7.5 with fresh TEOA, bpy and K2[PtCl4]. After each run, the headspace was collected and measured using GC analysis (see Table 6). Overall, rR@TiO2 NPs were most suitable for multiple cycles with only a slight decline in efficiency (see Figure 3). We believe that the decline in efficiency is due to the loss of NPs in the recycling processing (10 wt.% after 8 cycles) and defunctionalization of the NP surface. Using the data, a minimal TON of 300 (TOF = 1.9 × 10⁻³ s–1) and TON 6424 (TOF = 4.1 × 10⁻² s–1) can be calculated for the rhodium(III) and ruthenium(II) surface bound complexes, respectively.
Table 6.
Performed recycle dihydrogen generating experiments of two sample vials.
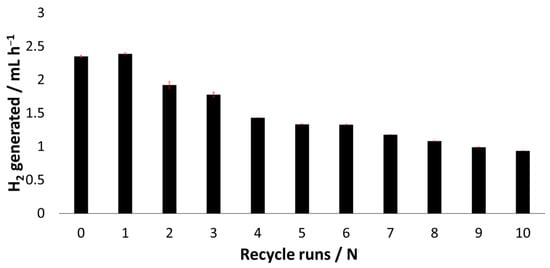
Figure 3.
Graphical representation of dihydrogen generated measured through GC analysis after each cycle using rR@TiO2 as photocatalyst, standard deviation indicated with red error bars.
4. Conclusions
We have demonstrated the immobilization of an established photochemical system for the solar generation of dihydrogen using sunlight by binding photo- and redox-active Rh and Ru complexes to TiO2 NP surfaces. We further show that binding both metal complexes to the same NP improves the photocatalytic efficiency. The kinetic rate order and recyclability were determined. The NPs could be recycled multiple times and retain dihydrogen generation capacity. TON and TOF of the system were determined and exceeded the previous reported similar homogenous system. The dihydrogen genera ration was monitored using GC while the NPs were characterized using various methods, including MALDI, FTIR spectroscopy, TGA-MS, solid-absorption spectroscopy, fluorescence emission spectroscopy, and ICP-MS.
Supplementary Materials
The following supporting information can be downloaded at: https://www.mdpi.com/article/10.3390/nano12050789/s1. Details of instrumentation and procedure, experimental to anchoring synthesis. Video S1: Visible H2 formation during irradiation. Scheme S1: Anchoring Ligand Synthesis route. Figures S1–S8: TGA-MS (activated NPs, 1@TiO2), 1H NMR spectroscopy (1@TiO2), solid state IR spectra (activated NPs, 1@TiO2, 1), solid state absorption spectra (1@TiO2) and MALDI mass spectra (1@TiO2). Figures S9–S12: TGA-MS (pristine ZrO2, 1@ZrO2), 1H NMR spectroscopy (1@ZrO2), solid state IR spectra (pristine ZrO2, 1@ZrO2, Ru@ZrO2 and rR@ZrO2). Figures S13–S27: TGA-MS, 1H NMR spectroscopy, solid state IR spectra, solid state absorption spectra and MALDI mass spectra for Ru@TiO2 made with RuCl3.3 H2O and cis-[Ru(bpy)2Cl2]. Figures S28–S35: TGA-MS, 1H NMR spectroscopy, solid state IR spectra, solid state absorption spectra and MALDI mass spectra for Rh@TiO2. Figures S36–S49: MALDI mass spectra (rR@TiO2, RR@TiO2) TGA-MS (rR@TiO2, RR@TiO2), 1H NMR spectroscopy (rR@TiO2, RR@TiO2), solid state IR spectra (activated NPs, 1@TiO2, rR@TiO2, RR@TiO2) and solid state absorption spectra (1@TiO2, Ru@TiO2, Rh@TiO2, rR@TiO2, RR@TiO2). Figures S50–S52: TGA-MS (Ru@ZrO2 and rR@ZrO2) and 1H NMR spectroscopy (Ru@ZrO2 and rR@ZrO2).
Author Contributions
Methodology, investigation, formal analysis, writing—original draft, S.A.F.; writing review and editing, C.E.H. and E.C.C.; supervision, project management, funding acquisition, C.E.H. and E.C.C. All authors have read and agreed to the published version of the manuscript.
Funding
This research was funded by Swiss National Science Foundation, grant number 200020_182000.
Data Availability Statement
Data are available from the authors on request.
Acknowledgments
We acknowledge support from the University of Basel. We would like to thank Markus Lenz (FHNW, Muttenz, Basel) for carrying out the ICP-MS measurements.
Conflicts of Interest
The authors declare no conflict of interest.
References
- Omer, A.M. Energy, environment and sustainable development. Renew. Sustain. Energy Rev. 2008, 12, 2265–2300. [Google Scholar] [CrossRef]
- Bölük, G.; Mert, M. Fossil & renewable energy consumption, GHGs (greenhouse gases) and economic growth: Evidence from a panel of EU (European Union) countries. Energy 2014, 74, 439–446. [Google Scholar] [CrossRef]
- Letcher, T.M. 1—Introduction With a Focus on Atmospheric Carbon Dioxide and Climate Change. In Future Energy: Improved, Sustainable and Clean Options for Our Planet, 3rd ed.; Letcher, T.M., Ed.; Elsevier: Amsterdam, The Netherlands, 2020; pp. 3–17. [Google Scholar]
- Metzger, J.O.; Hüttermann, A. Sustainable global energy supply based on lignocellulosic biomass from afforestation of degraded areas. Sci. Nat. 2009, 96, 279–288. [Google Scholar] [CrossRef] [PubMed]
- Kang, J.-N.; Wei, Y.-M.; Liu, L.-C.; Han, R.; Yu, B.-Y.; Wang, J.-W. Energy systems for climate change mitigation: A systematic review. Appl. Energy 2020, 263, 114602. [Google Scholar] [CrossRef]
- Rivard, E.; Trudeau, M.; Zaghib, K. Hydrogen Storage for Mobility: A Review. Materials 2019, 12, 1973. [Google Scholar] [CrossRef] [PubMed] [Green Version]
- Available online: https://www.rsc.org/periodic-table/element/1/hydrogen (accessed on 14 June 2021).
- Timmerberg, S.; Kaltschmitt, M.; Finkbeiner, M. Hydrogen and Hydrogen-Derived Fuels through Methane Decomposition of Natural Gas–GHG Emissions and Costs; Elsevier: Amsterdam, The Netherlands, 2020; Volume 7, p. 100043. [Google Scholar]
- Wang, S.; Lu, A.; Zhong, C.-J. Hydrogen production from water electrolysis: Role of catalysts. Nano Converg. 2021, 8, 4. [Google Scholar] [CrossRef]
- Chen, L.; Qi, Z.; Zhang, S.; Su, J.; Somorjai, G.A. Catalytic Hydrogen Production from Methane: A Review on Recent Progress and Prospect. Catalysts 2020, 10, 858. [Google Scholar] [CrossRef]
- Dovì, V.G.; Friedler, F.; Huisingh, D.; Klemeš, J.J. Cleaner energy for sustainable future. J. Clean. Prod. 2009, 17, 889–895. [Google Scholar] [CrossRef]
- Johnson, T.C.; Morris, D.J.; Wills, M. Hydrogen generation from formic acid and alcohols using homogeneous catalysts. Chem. Soc. Rev. 2010, 39, 81–88. [Google Scholar] [CrossRef]
- Sajjadi, S.; Khataee, A.; Darvishi Cheshmeh Soltani, R.; Hasanzadeh, A. N, S co-doped graphene quantum dot–decorated Fe3O4 nanostructures: Preparation, characterization and catalytic activity. J. Phys. Chem. 2019, 127, 140–150. [Google Scholar] [CrossRef]
- Hassan, A.F.; Elhadidy, H. Effect of Zr+4 doping on characteristics and sonocatalytic activity of TiO2/carbon nanotubes composite catalyst for degradation of chlorpyrifos. J. Phys. Chem. 2019, 129, 180–187. [Google Scholar] [CrossRef]
- Maleki, A.; Taheri-Ledari, R.; Ghalavand, R.; Firouzi-Haji, R. Palladium-decorated o-phenylenediamine-functionalized Fe3O4/SiO2 magnetic nanoparticles: A promising solid-state catalytic system used for Suzuki–Miyaura coupling reactions. J. Phys. Chem. 2020, 136, 109200. [Google Scholar] [CrossRef]
- Stevens, P.D.; Fan, J.; Gardimalla, H.M.R.; Yen, M.; Gao, Y. Superparamagnetic Nanoparticle-Supported Catalysis of Suzuki Cross-Coupling Reactions. Org. Lett. 2005, 7, 2085–2088. [Google Scholar] [CrossRef] [PubMed]
- Zecchina, A.; Bordiga, S.; Groppo, E. Selective Nanocatalysts and Nanoscience: Concepts for Heterogeneous and Homogeneous Catalysis; Wiley-VHC: Weinheim, Germany, 2011. [Google Scholar]
- Samira Bagheri, N.M.J. Nanocatalysts in Environmental Applications; Springer: Cham, Switzerland, 2018. [Google Scholar]
- Albonetti, S.; Mazzoni, R.; Cavani, F. CHAPTER 1 Homogeneous, Heterogeneous and Nanocatalysis. In Transition Metal Catalysis in Aerobic Alcohol Oxidation; Green Chemistry Series; Cardona, F., Parmeggiani, C., Eds.; RSC: London, UK, 2015; pp. 1–39. [Google Scholar]
- Kumaravel, V.; Imam, M.D.; Badreldin, A.; Chava, R.K.; Do, J.Y.; Kang, M.; Abdel-Wahab, A. Photocatalytic Hydrogen Production: Role of Sacrificial Reagents on the Activity of Oxide, Carbon, and Sulfide Catalysts. Catalysts 2019, 9, 276. [Google Scholar] [CrossRef] [Green Version]
- Yoong, L.S.; Chong, F.K.; Dutta, B.K. Development of copper-doped TiO2 photocatalyst for hydrogen production under visible light. Energy 2009, 34, 1652–1661. [Google Scholar] [CrossRef]
- Kanade, K.G.; Kale, B.B.; Baeg, J.-O.; Lee, S.M.; Lee, C.W.; Moon, S.-J.; Chang, H. Self-assembled aligned Cu doped ZnO nanoparticles for photocatalytic hydrogen production under visible light irradiation. Mater. Chem. Phys. 2007, 102, 98–104. [Google Scholar] [CrossRef]
- Chowdhury, P.; Gomaa, H.; Ray, A.K. Sacrificial hydrogen generation from aqueous triethanolamine with Eosin Y-sensitized Pt/TiO2 photocatalyst in UV, visible and solar light irradiation. Chemosphere 2015, 121, 54–61. [Google Scholar] [CrossRef]
- Popugaeva, D.; Tian, T.; Ray, A.K. Hydrogen production from aqueous triethanolamine solution using Eosin Y-sensitized ZnO photocatalyst doped with platinum. Int. J. Hydrog. Energy 2020, 45, 11097–11107. [Google Scholar] [CrossRef]
- Zuo, F.; Wang, L.; Wu, T.; Zhang, Z.; Borchardt, D.; Feng, P. Self-Doped Ti3+ Enhanced Photocatalyst for Hydrogen Production under Visible Light. J. Am. Chem. Soc. 2010, 132, 11856–11857. [Google Scholar] [CrossRef]
- Romero, N.; Guerra, R.B.; Gil, L.; Drouet, S.; Salmeron-Sànchez, I.; Illa, O.; Philippot, K.; Natali, M.; García-Antón, J.; Sala, X. TiO2-mediated visible-light-driven hydrogen evolution by ligand-capped Ru nanoparticles. Sustain. Energy Fuels 2020, 4, 4170–4178. [Google Scholar] [CrossRef]
- Kirch, M.; Lehn, J.-M.; Sauvage, J.-P. Hydrogen Generation by Visible Light Irradiation of Aqueous Solutions of Metal Complexes. An approach to the photochemical conversion and storage of solar energy. Helv. Chim. Acta 1979, 62, 1345–1384. [Google Scholar] [CrossRef]
- Ansari, S.A.; Cho, M.H. Highly Visible Light Responsive, Narrow Band gap TiO2 Nanoparticles Modified by Elemental Red Phosphorus for Photocatalysis and Photoelectrochemical Applications. Sci. Rep. 2016, 6, 25405. [Google Scholar] [CrossRef] [PubMed]
- Singh, H.; Sunaina; Yadav, K.K.; Bajpai, V.K.; Jha, M. Tuning the bandgap of m-ZrO2 by incorporation of copper nanoparticles into visible region for the treatment of organic pollutants. Mater. Res. Bull. 2020, 123, 110698. [Google Scholar] [CrossRef]
- Lenis-Rojas, O.A.; Fernandes, A.R.; Roma-Rodrigues, C.; Baptista, P.V.; Marques, F.; Pérez-Fernández, D.; Guerra-Varela, J.; Sánchez, L.; Vázquez-García, D.; Torres, M.L.; et al. Heteroleptic mononuclear compounds of ruthenium(ii): Synthesis, structural analyses, in vitro antitumor activity and in vivo toxicity on zebrafish embryos. Dalton Trans. 2016, 45, 19127–19140. [Google Scholar] [CrossRef] [PubMed]
- Zhang, D.; Telo, J.P.; Liao, C.; Hightower, S.E.; Clennan, E.L. Experimental and Computational Studies of Nuclear Substituted 1,1‘-Dimethyl-2,2‘-Bipyridinium Tetrafluoroborates. J. Phys. Chem. A 2007, 111, 13567–13574. [Google Scholar] [CrossRef] [PubMed]
- Maerker, G.; Case, F.H. The Synthesis of Some 4,4’-Disubstituted 2,2’-Bipyridines1. J. Am. Chem. Soc. 1958, 80, 2745–2748. [Google Scholar] [CrossRef]
- Han, W.-S.; Han, J.-K.; Kim, H.-Y.; Choi, M.J.; Kang, Y.-S.; Pac, C.; Kang, S.O. Electronic Optimization of Heteroleptic Ru(II) Bipyridine Complexes by Remote Substituents: Synthesis, Characterization, and Application to Dye-Sensitized Solar Cells. Inorg. Chem. 2011, 50, 3271–3280. [Google Scholar] [CrossRef] [PubMed]
- Montalti, M.; Wadhwa, S.; Kim, W.Y.; Kipp, R.A.; Schmehl, R.H. Luminescent Ruthenium(II) Bipyridyl−Phosphonic Acid Complexes: pH Dependent Photophysical Behavior and Quenching with Divalent Metal Ions. Inorg. Chem. 2000, 39, 76–84. [Google Scholar] [CrossRef]
- Norris, M.R.; Concepcion, J.J.; Glasson, C.R.K.; Fang, Z.; Lapides, A.M.; Ashford, D.L.; Templeton, J.L.; Meyer, T.J. Synthesis of Phosphonic Acid Derivatized Bipyridine Ligands and Their Ruthenium Complexes. Inorg. Chem. 2013, 52, 12492–12501. [Google Scholar] [CrossRef]
- Freimann, S.A.; Zare, D.; Housecroft, C.E.; Constable, E.C. The SALSAC approach: Comparing the reactivity of solvent-dispersed nanoparticles with nanoparticulate surfaces. Nanoscale Adv. 2020, 2, 679–690. [Google Scholar] [CrossRef] [Green Version]
- Freimann, S.A.; Prescimone, A.; Housecroft, C.E.; Constable, E.C. Turning over on sticky balls: Preparation and catalytic studies of surface-functionalized TiO2 nanoparticles. RSC Adv. 2021, 11, 5537–5547. [Google Scholar] [CrossRef]
- The surface area-to-volume ratio of NPs with an average radius of 10.5 nm is 28%. Surface concentrations were calculated as 0.28 times the number of TiO2 formula equivalents. When describing experiments using functionalized NPs, the number of equivalents or moles refer to the estimated amount of anchoring ligand or complex bound to the surface using the above formula.
- Available online: https://www.aerosil.com/sites/lists/RE/DocumentsSI/TI-1243-Titanium-Dioxide-as-Photocatalyst-EN.pdf. (accessed on 5 April 2020).
- Cooke, M.W.; Santoni, M.-P.; Loiseau, F.; Hasenknopf, B.; Hanan, G.S. Energy transfer in rhodium–ruthenium dimer-of-dimer assemblies. Inorg. Chim. Acta 2017, 454, 208–215. [Google Scholar] [CrossRef]
Publisher’s Note: MDPI stays neutral with regard to jurisdictional claims in published maps and institutional affiliations. |
© 2022 by the authors. Licensee MDPI, Basel, Switzerland. This article is an open access article distributed under the terms and conditions of the Creative Commons Attribution (CC BY) license (https://creativecommons.org/licenses/by/4.0/).