Article

Influence of Pre-Dispersion Media on the Batch Reactor Dissolution Behavior of Al2O3 Coated TiO2 (NM-104) and Two ZnO (NM-110 and NM-111) Nanomaterials in Biologically Relevant Test Media

1
National Research Center for the Working Environment, 2100 Copenhagen, Denmark
2
Research Group for Analytical Food Chemistry, Division of Food Technology, National Food Institute, Technical University of Denmark, 2800 Kongens Lyngby, Denmark
*
Authors to whom correspondence should be addressed.
Nanomaterials 2022, 12(3), 566; https://doi.org/10.3390/nano12030566
Submission received: 9 October 2021 / Revised: 27 October 2021 / Accepted: 30 January 2022 / Published: 7 February 2022

Abstract

:
Dissolution plays an important role on pulmonary toxicity of nanomaterials (NMs). The influence of contextual parameters on the results from dissolution testing needs to be identified to improve the generation of relevant and comparable data. This study investigated how pre-dispersions made in water, low-calcium Gamble’s solution, phagolysosomal simulant fluid (PSF), and 0.05% bovine serum albumin (BSA) affected the dissolution of the Al2O3 coating on poorly soluble TiO2 also coated with glycerine (NM-104) and rapidly dissolving uncoated (NM-110) and triethoxycaprylsilane-coated ZnO (NM-111) NMs. Dissolution tests were undertaken and controlled in a stirred batch reactor using low-calcium Gamble’s solution and phagolysosomal simulant fluid a surrogate for the lung-lining and macrophage phagolysosomal fluid, respectively. Pre-dispersion in 0.05% BSA-water showed a significant delay or decrease in the dissolution of Al2O3 after testing in both low-calcium Gamble’s solution and PSF. Furthermore, use of the 0.05% BSA pre-dispersion medium influenced the dissolution of ZnO (NM-110) in PSF and ZnO (NM-111) in low-calcium Gamble’s solution and PSF. We hypothesize that BSA forms a protective coating on the particles, which delays or lowers the short-term dissolution of the materials used in this study. Consequently, the type of pre-dispersion medium can affect the results in short-term dissolution testing.

1. Introduction

Data on the solubility and dissolution rates of manufactured nanomaterials (NMs) and their potential phase transformation in biological systems have received increasing interest during the last few years. The increased interest is not least due to recent demands for this type of information for regulatory read-across and grouping in chemicals registration and risk assessment and for assessing the potential uptake and accumulation in the human body [1,2]. The solubility and dissolution rates of NMs are important parameters controlling their potential toxicological reaction paths [3,4]. Consequently, dissolution testing in biosimulant fluids can be an important measure for understanding the dissolution behavior to estimate potential harmful effects.
Solubility and dissolution testing can be made using several different procedures and test media. Conceptually, however, there are three approaches (static, dynamic, and sequential dissolution) that each have their strengths and weaknesses. To understand and apply the results well and allow mutual acceptance of data, it is necessary to harmonize key conceptual parameters and procedures in the specific test methods as much as possible to allow the generation of comparable and reliable data. Therefore, it is necessary to identify the critical steps and parameters in the protocols applied and understand to what extent they should be defined or controlled.
In this work, we investigate the potential need to harmonize the pre-dispersion step in a protocol for short-term ( 24 h) stirred batch reactor dissolution testing. NMs are often supplied as powders, and creating liquid suspension of NMs is a step required for several analyses and tests, including size analysis (e.g., Verleysen et al. [5]), dissolution testing in batch systems (Holmfred et al., [6]), and many (eco-)toxicological studies (intratracheal installation, pharyngeal aspiration, and injection) [7,8,9]. In most cases, such NM dispersions are prepared in stock suspensions [7,10]. Preparation of a stock suspension has the advantage of creating a dispersion with potentially well-controlled and measurable particle sizes and zeta potential (depending on the dispersion medium and NM) allowing adequate dosing precision. A potential drawback of working from an NM stock suspension is that it may cause artifacts in the test due to changes in material characteristics and properties or reactions or interactions in or with the liquid media before analysis or testing is started [7]. Hadrup et al. investigated the influence of a pre-dispersion medium on pulmonary inflammation induced by NMs in rats [11]. Carbon black, TiO2, and carbon nanotubes were used as model NMs, and the materials were dispersed in water, 2% serum, 0.05% serum albumin in water, 10% bronchoalveolar lavage fluid (in 0.9% NaCl or water), or 0.1% Tween-80 in water [11]. The acute inflammation was shown to be media-dependent for carbon black as DNA damage was only observed after dispersion with water, 2% serum, and 10% bronchoalveolar lavage fluid in 0.9% NaCl, whereas for TiO2, no genotoxicity effects were dependent on the dispersion medium used. Conclusively, Hadrup et al. suggested to consider the type of dispersion medium when using intratracheal instillation exposure [11]. In addition, Sauer et al. [12] investigated the NM agglomeration and biological effects of different dispersion media. In their study, 16 different NMs, including ZnO, Ag, TiO2, CeO2, SiO2, and carbon nanotubes, were investigated. The NM dispersions were prepared in porcine lung surfactant and bovine serum albumin and shown to influence the effective dosage after 12 and 24 h. Overall, using bovine serum albumin as a dispersant created stable and narrow size-distribution dispersions; however, porcine lung surfactant resembles more closely the proteins in the lung-lining fluid [12].
The quality of the pre-dispersion is critical for achieving reproducible size-analysis (within sub- to micron meter size reflecting the approximate minimum aggregates size) and dosing as well as for enhancement of surface-area-related processes, size-related uptake, and translocation. Relevant for dissolution testing of particles, size and accessible surface area are considered critical physicochemical parameters affecting the dissolution kinetics of NMs [4,13]. To create a reproducible liquid NM dispersion, considerations of several parameters such as choice of the dispersion medium, need for adjustment of pH and ionic strength, and de-agglomerating energy (ultrasonication, stirring, and shaking) must be made as these parameters influence the final degree of the dispersion [7,8,14,15]. The role of accessible surface area in the dissolution of particle agglomerates has been described by David et al. [16].
A study of the dissolution rates in different test media used for simulating a pulmonary compartment using a continuous flow-through membrane method has clearly shown important differences in the rates and dissolved amounts depending on the media [15]. Consequently, the properties of the dispersion medium might play a role in the possible dissolution of the NM prior to the actual dissolution test, e.g., during sampling. Finally, it is also important to investigate the extent to which specific protocol steps in dissolution testing, for example, the use of dispersion agents such as proteins, affect the NM solubility and dissolution rates. Protein adsorption is verified to occur on many NMs when present in dispersion and in vitro test media and are thought to be important determinants in NM interaction with biological compartments [17,18]. Understanding the potential effects of these factors is relevant as new test methods aim to become more biologically relevant and biomolecules such as proteins and enzymes are naturally present in biological systems.
In this study, we studied the role of different pre-dispersion media on dispersibility and dissolution rates using three well-characterized and industrially representative nanomaterials (organically uncoated and coated ZnO (NM-110 and NM-111) and organic-inorganic coated TiO2 (NM-104)). These materials have different surface properties and aggregate structures and known differences in solubilities and dissolution rates [17,19,20]. We hypothesize that the type of dispersion medium and presence of protein as dispersant will influence the short-term dissolution kinetics of NMs. This knowledge may be important for further protocol development and interpretation of dissolution tests and toxicological studies if differences occur. Consequently, this study aims at investigating the dissolution behavior of ZnO (NM-110 and NM-111) and Al2O3-coated TiO2 (NM-104) in two biosimulants as test media using water, test media, and 0.05% w/v bovine serum albumin (BSA) water as pre-dispersion media. The test media were low-calcium Gamble’s solution, a surrogate for the lung-lining fluid [21], and Phagolysosomal Simulant Fluid (PSF), a surrogate for the lung alveolar macrophage phagolysosomal fluid [22].

2. Materials and Methods

2.1. Test Materials

TiO2 (NM-104) and ZnO (NM-110 and NM-111) originated from the OECD Working Party on Manufactured Nanomaterials Sponsorship Programme and were all obtained from the Fraunhofer Institute for Molecular Biology and Applied Ecology (Schmallenberg, Germany). The two ZnO materials represent a group of relatively rapid dissolving materials of which ZnO (NM-111) is organically coated with hydrophobic triethoxycaprylsilane, and NM-104 represents a poorly soluble NM coated with Al2O3 and glycerine [20]. The key physicochemical characteristics of the test materials are summarized in Table 1. Samples were stored under argon until subsampling for testing.

2.2. Pre-Dispersion of Nanomaterials

The nanomaterials were pre-dispersed at the same acoustic power of 7.35 ± 0.05 Watt following the so-called NANOGENOTOX batch dispersion protocol validated as part of the FP7 NANoREG project [10]. The pre-dispersion media were either 0.05% BSA (standard protocol medium), ultrapure water (resistivity 18 MΩ·cm) (Nanopure® system, Thermo Fisher Scientific, Waltham, MA, USA), or test media (PSF and low-calcium Gamble’s solution). The 0.05% BSA was prepared using ultrapure water. PSF and low-calcium Gamble’s solution was prepared as described below.
Dispersions were prepared by weighing 37.5 mg of NM into a 15 mL glass vial. Powders were pre-wetted with 0.5% w/v 96% ethanol and dispersed with 14.57 mL of solution (0.05% BSA, water, or test media) to a final concentration of 2.56 mg/mL. A 400 W Branson Sonifier S-450D (Branson Ultrasonics Corp., Danbury, CT, USA) equipped with a 13 mm disruptor horn was used to sonicate the particle dispersion for 16 min with a 10% amplitude (approx. 42 W) under constant cooling in an ice-water bath, adding the required acoustic delivered power. Ethanol pre-wetting and the same sonication conditions were applied for all pre-dispersion media to allow dispersion of both hydrophilic (NM-104 and NM-110) and hydrophobic (NM-111) test materials. It should be noted that all results concerning pre-dispersion in 0.05% BSA water as dispersion medium were obtained from Holmfred et al. [6].

2.3. Evaluation of the Dispersion Quality and Stability

The quality and stability of the particle dispersions were evaluated using a Malvern Zetasizer Nano ZS (Malvern Panalytics Ltd., Malvern, UK) measuring the hydrodynamic size distribution (Zave), zeta potential (Zpot), and polydispersity index (PDI). The instrument was equipped with a 633 nm laser measuring at 173° (non-invasive backscattering). Immediately after preparation of the dispersion, 700 µL was transferred to a disposable folded capillary cell (DTS1070, Malvern). Prior to analysis, the instrument was equilibrated for 5 min. All samples were analyzed using automatic optimization mode of measurement of configuration, at 25 °C using the viscosity of water (0.8872 cP), and optical parameters of water. Zave and PDI were reported as an average of ten repeated measurements. The Zpot was measured using the Smoluchowski model calculated in automatic mode based on ten repeated measurements. The obtained average Zave values were compared with scanning electron microscopy aggregate sizes and Zave benchmark sizes generated by DLS to qualify dispersions made using the NANOGENOTOX dispersion protocol [10].

2.4. Albumin Adsorption

The amount of adsorbed BSA to the TiO2 (NM-104) and ZnO (NM-110 and NM-111) was quantified from ELISA reader analysis of total protein concentration in the 0.05% BSA batch dispersion medium after sonication with each of the three test materials using the PierceTM BCA Protein Assay Kit (Thermo Scientific, Rockford, IL, USA, catalog no. 23227). A total of 1 mL dispersion medium was sampled and added to an Eppendorf tube and centrifuged for 30 min at 20,000 RCF to settle the particles and avoid interference in the ELISA reader. The particle-free supernatant was then sampled, allowed to react with the reagent from the kit in 96-well plates, and analyzed against a BSA calibration curve in the ELISA fluorimeter. All ELISA determinations were based on double tests, and concentrations were derived from BSA calibration curves. Concentrations measured in samples of particle-free dispersion medium were used for reference. The amount of adsorbed BSA was calculated by ascribing the difference between the BSA concentrations in the dispersions with and without sample to adsorption by the particles. Data are given as the BSA-load on the particles (µg BSA/mg particle) by dividing the measured BSA concentration difference by the batch particle concentration of 2.56 mg/mL and the percent adsorbed of added BSA.

2.5. Physiological Simulant Test Fluids

Phagolysosomal simulant fluid (PSF) and low-calcium Gamble’s solution were prepared by dissolving the components listed in Table 2 in 2 L ultrapure water (<18 MΩ·cm) (Thermo Fisher Scientific, Waltham, MA, USA), respectively. The solutions were left overnight and filtered the following day through a polyvinylidene fluoride membrane 0.45 µm filter (Merck Millipore Ltd., Tullagreen, Ireland). PSF and low-calcium Gamble’ solution have a shelf-life of approx. 1–1.5 months when stored at 5 °C protected from light. The pH of the PSF and low-calcium Gamble’s solution were approximately 4.5 and 7.4 after preparation, respectively. All chemicals were purchased from Merck (Darmstadt, Germany).

2.6. Dissolution Testing in Stirred Batch Reactors

Dissolution testing was completed in an atmosphere–temperature–pH-controlled (ATempH) stirred batch reactor (SBR) system described and validated in Holmfred et al. [6]. In brief, the system consists of four reactors, each coupled to an OMNIS titration system (Metrohm, Herisau, Switzerland); one batch reactor was used as a reference containing pure test medium (low-calcium Gamble’s solution or PSF), and three batch reactors were used for a test of NMs (n = 3). To all reactors, 96 mL of test medium was added before testing. Throughout testing, pH, temperature, and gas flows are kept constant. To mimic physiological lung conditions, the temperature is set to 37 °C, and O2 and CO2 flow are set to 144 and 5.62 mL/min, respectively. Before testing, low-calcium Gamble’s solution and PSF were adjusted with 0.1 M NaOH or HCl to exactly pH 7.4 and 4.5, respectively, and kept constant throughout testing. The particle suspension was transported gently from the probe sonicator, and 4 mL of suspension was added to each of the test reactors at the start of the test resulting in a nominal NM concentration of 102.4 mg/L. To the reference reactor, 4 mL of the respective pre-dispersion medium was added. At t0, t1, t2, t4, and t24 hours, 4 mL sample was collected using a 5 mL plastic syringe with a steel needle and transferred to 3 kDa Amicon Ultra-4 centrifugal filters (Merck, Darmstadt, Germany) and immediately centrifuged for 30 min at 4000× g, 4400 rpm using an RF+ Sorvall centrifuge (Thermo Fisher Scientific, Waltham, MA, USA). The time from finalising the pre-dispersion and to the t0 h samples were in the centrifuge was approximately 2 min. After centrifugation, the filters were removed, and 0.5 mL of 2% nitric acid was added for stabilization of the dissolved ionic fraction.

2.7. Dissolved Ionic Fraction

The dissolved ionic fraction was diluted 4–1000 times with 2% HNO3 and measured using inductively coupled plasma-mass spectrometry (ICP-MS), as specified in Table 3. The total concentrations of dissolved Zn (NM-110 and NM-111) as well as Ti and Al (NM-104) were measured at the sampling time points t0, t1, t2, t4, and t24 using a Thermo iCAP SQ ICP-MS (Thermo Fisher Scientific, Waltham, MA, USA) equipped with an ASX-560 autosampler (Teledyne Cetac Technologies, Omaha, NE, USA). The ICP-MS was further equipped with a Thermo Fisher Scientific quarts cyclonic spray chamber and a PFA-ST MicroFlow nebulizer. During analyses, the plasma power was 1550 W, the plasma gas flow was 14.00 L/min, and the dwell time was set to 100 ms. ICP-MS parameters can be found in Table 3.
The 3 kDa filtrates were diluted to an acidic concentration of 2% nitric acid and were quantified against an external calibration curve prepared in 2% nitric acid. Considering the dissolution of TiO2 (NM-104) in PSF, the total ionic fraction was quantified against an external calibration curve prepared in 10 times diluted PSF having the same dilution factor as the analyzed samples. ICP-MS certified stock standard solutions 1000 mg/L (SCP SCIENCE, Quebec, Canada) with trace elements ≤ 1 µg/L were used to prepare all external calibration curves. The internal standards were likewise prepared in 2% nitric acid from ICP-MS standards (100 mg/L) and diluted to a final concentration of 20 µg/L and added on-line to the sample flow using a T-piece. Blanks and spiked samples were included in all analyzes for quality control of the ICP-MS. The concentrations determined in the reference reactor were subtracted from the measured concentrations of the samples. To avoid carry-over, a rinsing procedure with 2% nitric acid was performed between all sample injections. The limit of detection (LOD) of the measured element in the filtrated sample was calculated using Equation (1)
L O D = 3 · S D · D F ,
where SD is the standard deviation of the concentration of a minimum of five blank samples, and DF is the dilution factor.

2.8. Determination of Initial Dissolution Rates

At each sampling time point (t0, t1, t2, t4, and t24 hours), the measured dissolved ionic fractions were multiplied with the total dilution factor, corrected for moisture content, coating, and impurities (Table 1), and stoichiometrically adjusted to obtain the dissolved concentrations and remaining fractions of ZnO and TiO2, respectively. The total dilution factor includes the dilution volume from acid/base titration during 24 h of testing and dilution with 0.5 mL 2% nitric acid to stabilize the sample filtrates.
Previous studies have described that the dissolution of most NMs follow first-order kinetics [13,28,29]. However, in our data, it was impossible to identify any clear 0., 1., and 2. order kinetics using the integral method for determining the dissolution rates [30,31]. Dissolution rates were therefore estimated using the numerical differential method [30,31]. In short, a non-linear regression function was established for the obtained elemental concentrations as a function of time following Equation (2):
C ( t * ) = θ 1 θ 2 · exp ( θ 3 · t * ) ,
where C(t*) is the concentration as the function of time, t* is the adjusted time, and θ 1 ,   θ 2 , and θ 3 are constant fitting parameters of the non-linear equation obtained by the plot of concentration and time. Equidistant real time-points were calculated by taking the 16 min of sonication, sampling, and filtration into account, Equation (3)
t * = t s a m p l i n g + 25   min ,
The 25 min time adjustment was made as an approximation of the total effective delay related to sonication, dosing, sampling, and effective filtration time. The tsampling was slightly different for each sample (few seconds) as the samples were collected manually. The centrifuge is kept running for 30 min to ensure that all possible liquid is removed from the filter membrane. However, >75% of the liquid is filtered through within <10 min, according to technical information from Amicon. Using the adjusted time-points, initial, intermediate, and last points were determined according to Fogler (1999) [30]
I n i t i a l :   ( d C A d t ) t 0 = 3 C ( t = 0 ) + 4 C ( t = 1 ) C ( t = 2 ) 2 t
where CA is the concentration
I n t e r m e d i a t e :   ( d C A d t ) t = ( 1 2 t ) [ C ( t = t + 1 ) C ( t = t 1 ) ]
L a s t :   ( d C A d t ) t e n d = ( 1 2 t ) [ C ( t = t e n d 2 ) 4 C ( t = t e n d 1 ) 3 C ( t = t e n d ) ]
The plot of the numerical points as a function of t* were used to determine the initial dissolution rate projected at t = 0, ( d C A d t ) t = 0 . The surface area dissolution rate was determined by Equation (7):
( d C ( S S A ) d t ) t = 0 = ( d C A d t ) t = 0 · S S A
where ( d C A d t ) t = 0 is the initial dissolution rate and SSA is the specific surface area measured by the Brunauer–Emmett–Teller method.

2.9. Statistics

Two-way repeated measures ANOVA (analysis of variance) was used to test for independence between dissolution rates and type of pre-dispersion medium. The independence was tested across all measured concentrations (at time points t0, t1, t2, t4, and t24 hours). p-value ≤ 0.05 was considered significant. Measurements at different time points within a replication were treated as repeated measurements with a first-order autoregressive correlation structure and a model-based covariance matrix. The analyses were conducted by use of the mixed procedure in SAS version 9.4 statistical software (SAS Institute Inc., Cary, NC, USA).

3. Results and Discussion

3.1. Albumin Adsorption

The results from analysis of BSA adsorption onto TiO2 (NM-104) and ZnO (NM-110 and NM-111) are listed in Table 4. Two rounds of tests are shown, for all of which a second set of data on ZnO (NM-110 and NM-111) was obtained from Da Silva et al. (2019a) [17]. The results show that a high amount of BSA adsorbs onto all three materials, yielding a theoretical mass-based coverage ranging between 40% and 78% of the BSA present in the 0.05% BSA pre-dispersion medium. The highest amounts of adsorption were observed on ZnO (NM-110) and TiO2 (NM-104). Slightly lower levels of adsorption were found for the triethoxycaprylsilane coated ZnO (NM-111), probably as the organic coating reduces the binding to BSA. The difference in BSA-adsorption observed for ZnO (NM-110 and NM-111) is in agreement with the listed results obtained for the NANOGENOTOX dispersion protocol in Da Silva et al. (2019a) [17]. Previous work has also documented BSA adsorption onto TiO2 (NM-104) and other TiO2 nanomaterials using a tailored BSA-enhanced dispersion protocol [19].

3.2. Dispersion Quality

Table 5 lists the results from DLS and Zpot measurements on the pre-dispersions of TiO2 (NM-104) and ZnO (NM-110 and NM-111) prepared in water, 0.05% BSA, PSF, or low-calcium Gamble’s solution made with the three test materials in water, 0.05% BSA, PSF, and low-calcium Gamble’s solution before dissolution testing in either PSF or low-calcium Gamble’s solution. The individual DLS size distribution spectra are given in the supplemental material (Figures S1–S3). Overall, the results show that pre-dispersion in water and 0.05% BSA provides the smallest Z-average (Zave), while dispersion directly in test media generally results in larger Zave values. Only TiO2 (NM-104) disperses better in water than in 0.05% BSA, which is known to be an effect of increased agglomeration in the presence of BSA [19]. In general, water and test media formed unstable dispersions (30 mV > Zpot > −30 mV) [8], and the 0.05% BSA dispersions were considered stabilized by the protein [7]. However, the highly positive Zpot of ZnO (NM-110) after pre-dispersion in water (24.6 ± 0.6 and 30.7 mV ± 0.6) indicates that a stable suspension is formed. Water could be considered a dispersion medium for this material in a case-to-case based dispersion medium decision.
The level of agglomeration in the different pre-dispersion media was evident when the measured Zave values were compared to particle average agglomeration sizes (Daggr) determined by scanning electron microscopy and benchmark DLS sizes (Zave,benchmark) for the NANOGENOTOX dispersion protocol (Jensen et al. [10]; Mejia et al. [32] and available from the eNanoMapper database [33]) (Table 5). In this comparison, the agglomeration in the test media resulted in 16.0 (ZnO (NM-110) in low-calcium Gamble’s solution) to 58.9 (TiO2 (NM-104) in PSF) times larger Zave sizes than observed in the benchmark DLS data. Good comparability of the dispersion quality parameters listed in Table 5 was observed between the pre-dispersions made in this study using the 0.05%BSA (the standard medium of the NANOGENOTOX disperson protocol) and the benchmark values for the NANOGENOTOX dispersion protocol. Only, the 0.05% BSA dispersion of TiO2 (NM-104) used for dissolution testing with low-calcium Gamble’s solution was coarser (ratio = 3.1) compared to all other 0.05% BSA dispersions (ratio 1.1 to 1.6).

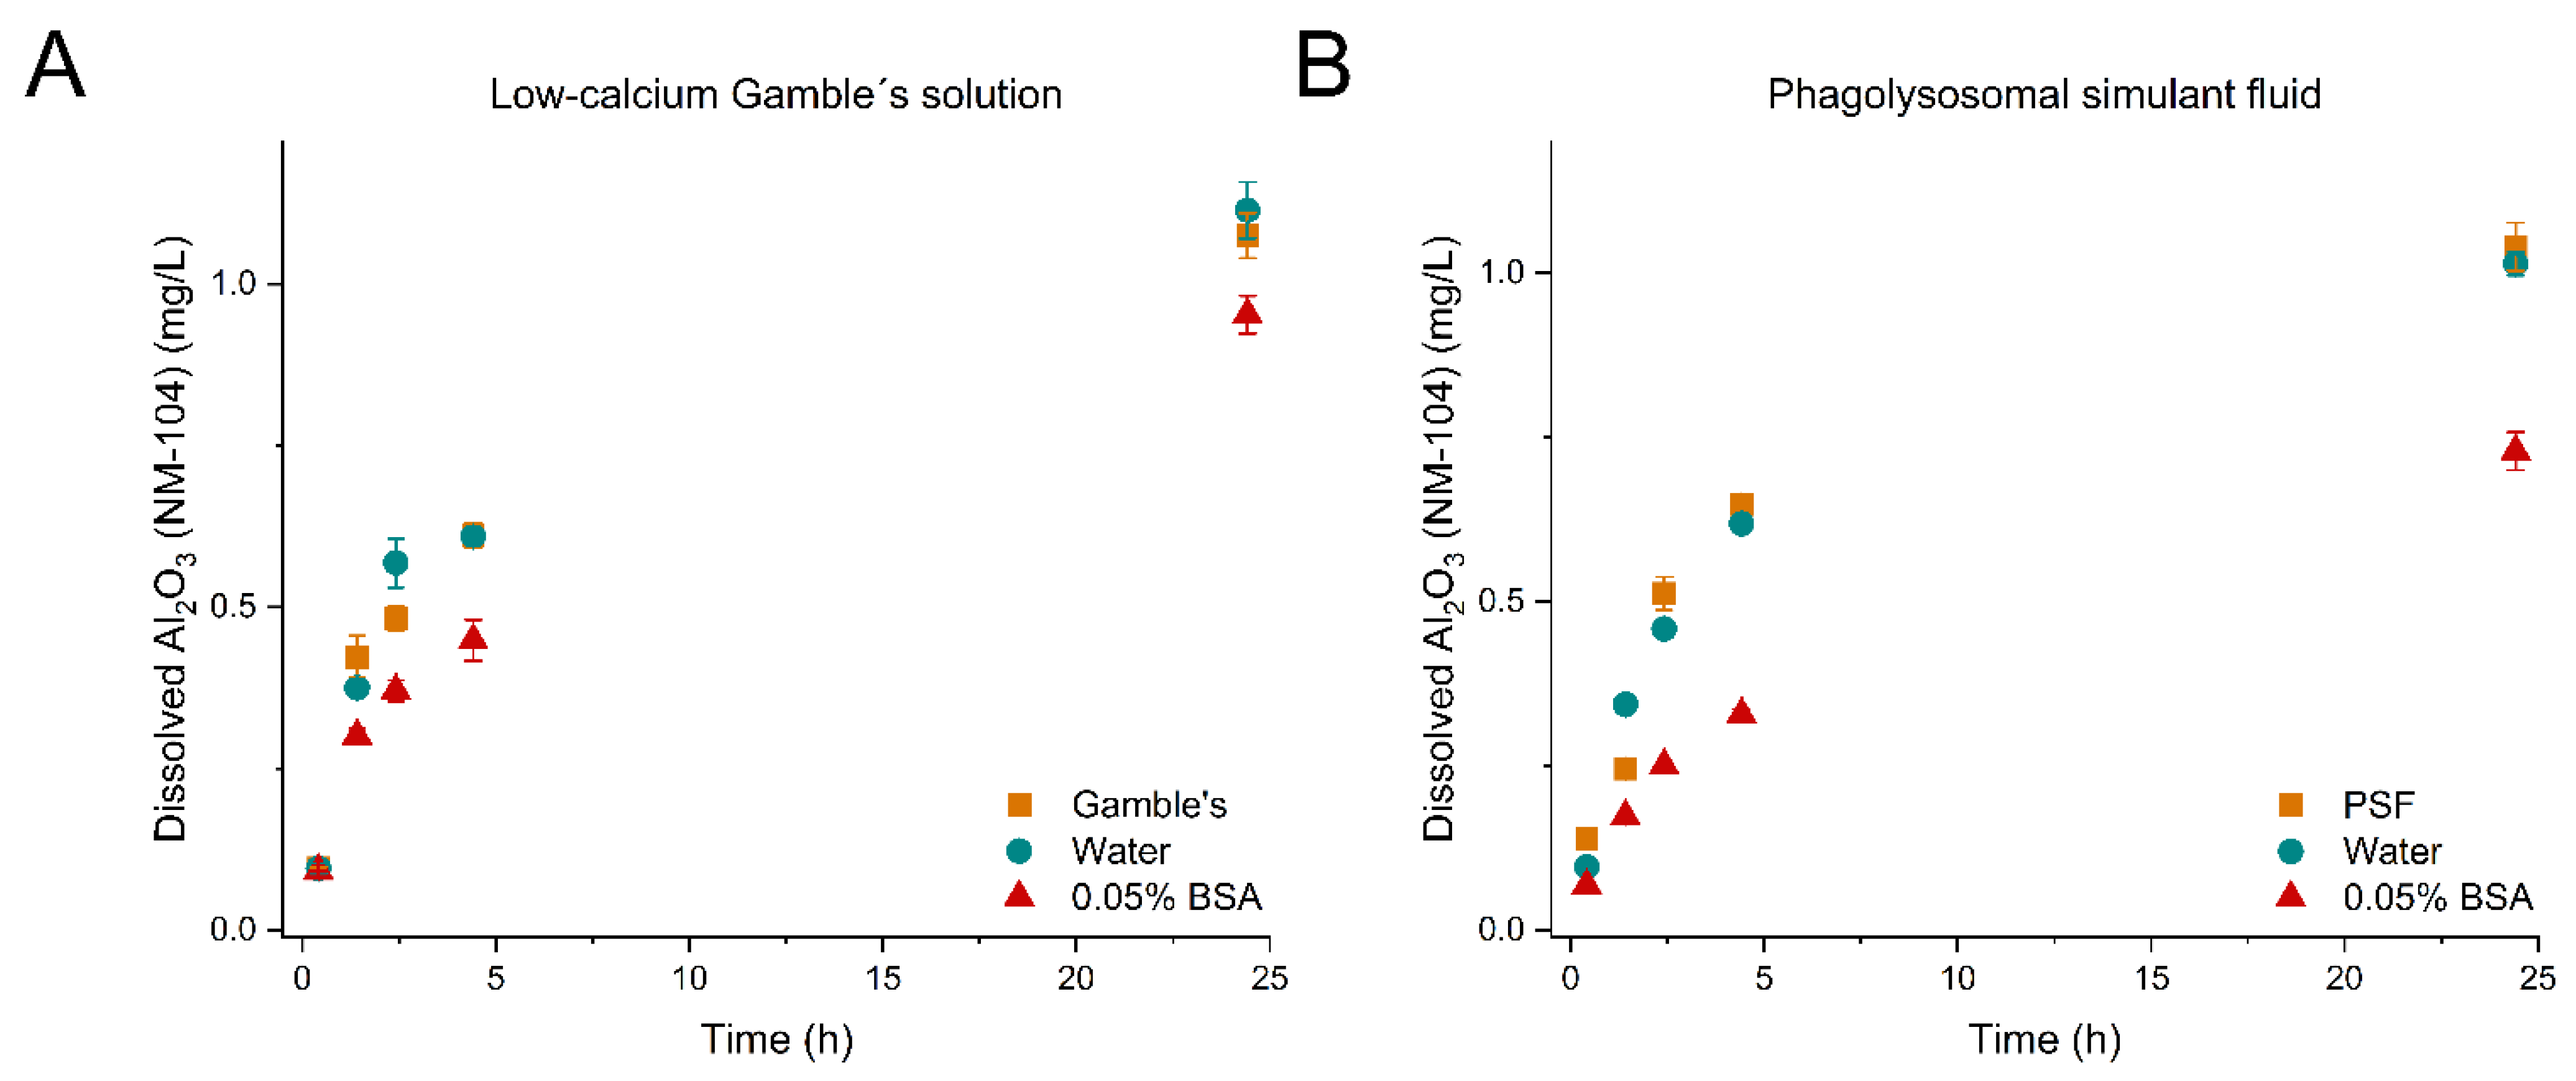
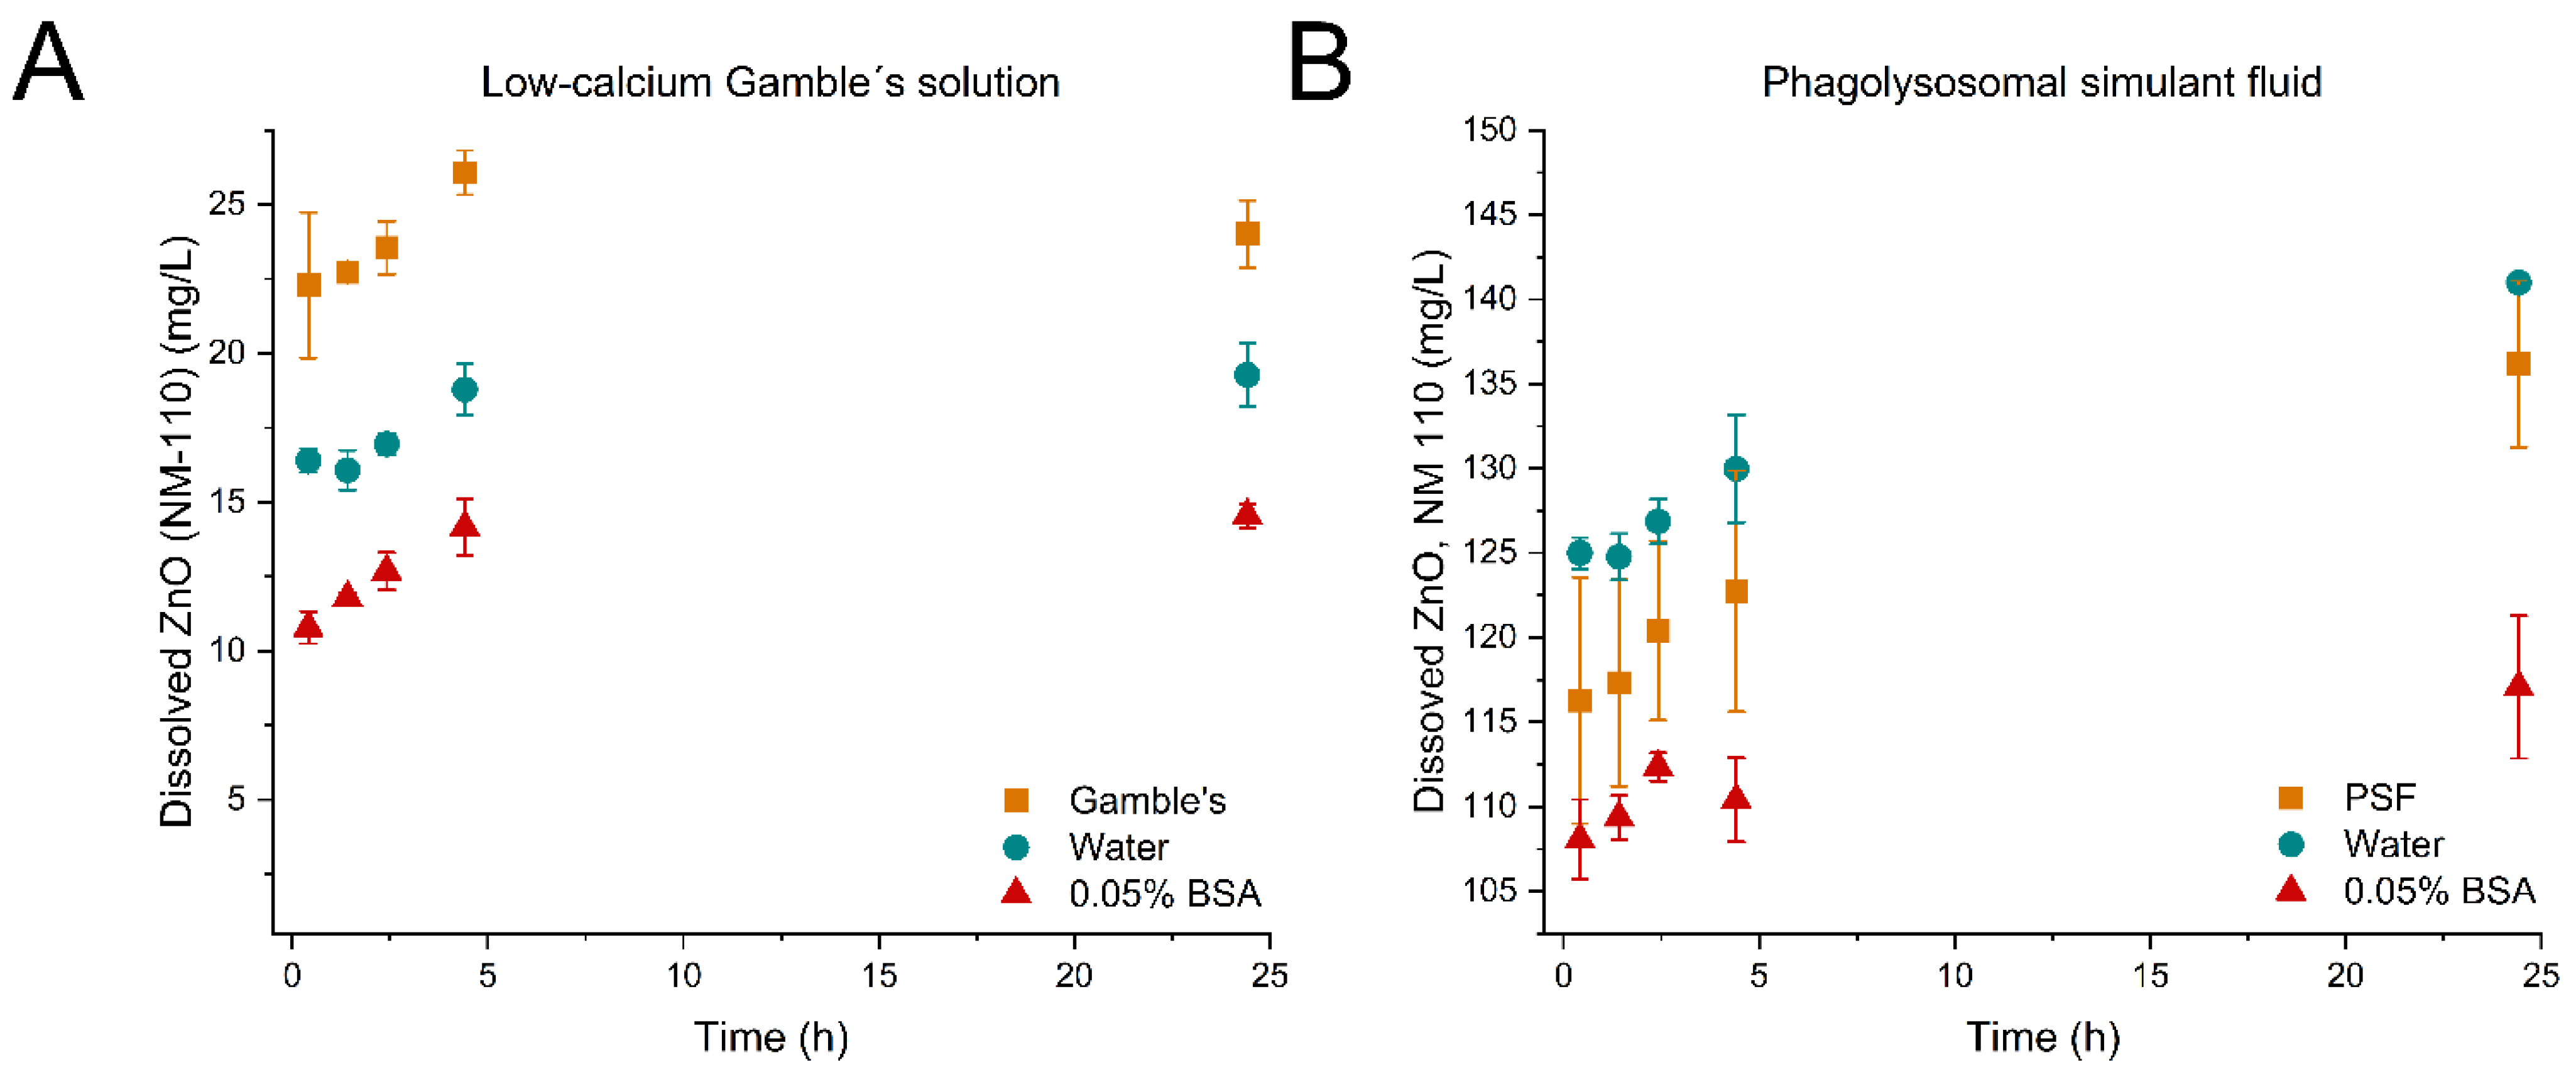
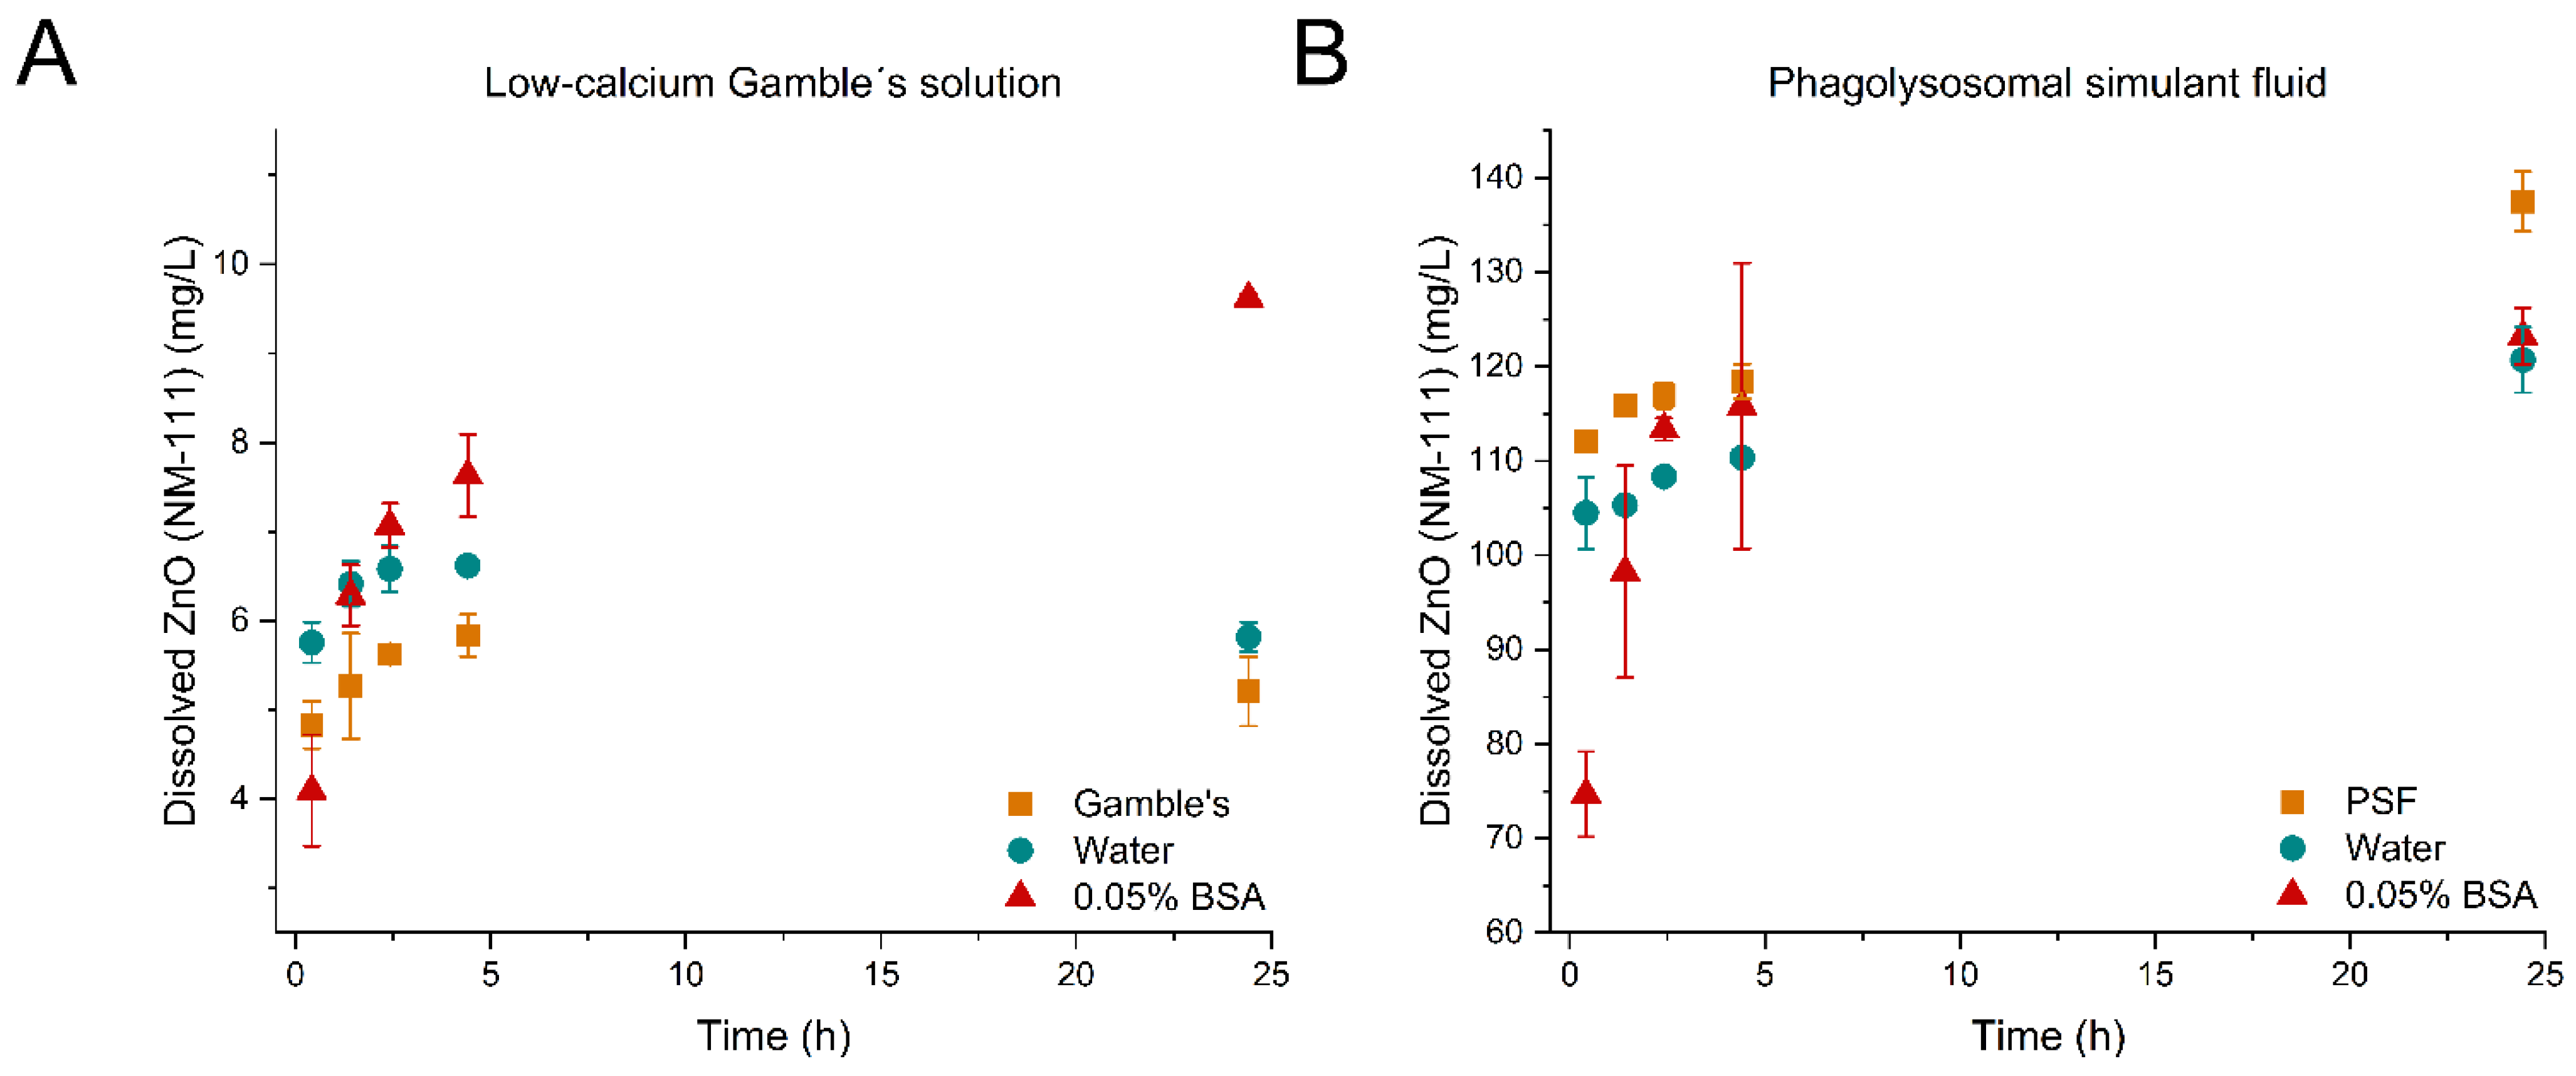
3.3. Effect of Pre-Dispersion Medium and Quality on Dissolution Behavior

Figure 1, Figure 2 and Figure 3 show the evolution of dissolved material over time from the dissolution tests with TiO2 (NM-104), ZnO (NM-110), and ZnO (NM-111) in low-calcium Gamble’s solution (A) and PSF (B) for the three pre-dispersion media, respectively. p-values of the statistical analyses are presented in Table 6.
For TiO2 (NM-104), the Al2O3 coating dissolved gradually over the 24 h test period, while TiO2 was not dissolved to concentrations above LOD in any of the tests performed in low-calcium Gamble’s solution and PSF (Figure 1A,B, Table 7). The dissolved Al concentrations reached between 0.036 ± 0.0040 and 0.56 ± 0.051 mg/L in the different tests (0–24 h), corresponding to 0.069 ± 0.0040 – 1.1 ± 0.45 mg/L Al2O3, and were found to be in the same overall range for testing in both low-calcium Gamble’s solution and PSF (Figure 1 and Table 7). TiO2 is known to be practically insoluble in low-calcium Gamble’s solution from a previous static batch dissolution 24 h screening study of the OECD WPMN industrially representative NM of TiO2 (NM-100, NM-101, NM-102, NM-103, NM-104, and NM-105) pre-dispersed following the NANOGENOTOX protocol [26]. In the previous study, the Al2O3 coating on TiO2 (NM-103 and NM-104) was observed to dissolve in low-calcium Gamble’s solution and for TiO2 (NM-104) reaching 413 µg/L of Al after 24 h (corresponding to 0.780 mg/L Al2O3 dissolved), comparable to the findings in this study.
We observed that the hydrodynamic size of TiO2 (NM-104) was highly affected by the pre-dispersion medium, where water and 0.05% BSA formed dispersions with the lowest Zave while the particles agglomerated heavily when dispersed in the test media. However, the samples pre-dispersed in water and test media (low-calcium Gamble’s solution or PSF) showed comparable dissolution profiles (p-value: 0.5233 or p-value: 0.6167, respectively) with a significantly 1.2–1.3 fold higher amount of total dissolved Al2O3 after 24 h than after pre-dispersion in 0.05% BSA (Figure 1A,B). The dissolution profiles after dispersion with 0.05% BSA were significantly different from the water and test media dispersions (p-values in Table 6); however, the initial dissolution rates were not affected by the choice of pre-dispersion medium (Table 7). Therefore, a direct agglomerate size effect on dissolution was not observed in the dissolution of Al2O3 (NM-104). A total of 131.8 ± 22.0 µg BSA/mg was found to adsorb to TiO2 (NM-104) (Table 4); the protein adsorption appeared to affect the dissolution of Al2O3 at neutral (low-calcium Gamble’s solution) and acidic pH (PSF).
Testing of ZnO (NM-110) dissolution in low-calcium Gamble’s did not show a significant influence of the pre-dispersion medium (p-values in Table 6) on the dissolution kinetics as the dissolution profiles over 24 h were only found to be shifted parallel (Figure 2A). However, the pre-dispersion medium seems to affect the starting concentrations, i.e., the amount of material dissolved during sonication, sampling, and filtration and/or the NM dose, but the initial dissolution rates were comparable.
The pre-dispersion medium affected the dissolution of ZnO (NM-110) in PSF (Figure 2B). No significant difference was observed between water and PSF as a pre-dispersion medium (p-value: 0.5987), and the initial dissolution rates were comparable (Table 7). However, the dissolution of ZnO in PSF was affected by using 0.05% BSA compared to water (p-value: 0.0141) and PSF (p-value: 0.0267) as a pre-dispersion medium. The ZnO (NM-110) concentrations after pre-dispersion in PSF showed large standard deviations throughout the testing. The measured concentrations exceeded the nominal dose of 102.4 mg/mL for all three pre-dispersion media. Inhomogeneous particle dispersions and/or variability in the dosing could explain this observation. Homogeneous suspensions and pre-dispersion stability are critical for accurate dosing [7], as the factors can directly affect the dissolution behavior and the batch-to-batch variation of dissolved material. Generally, the solubility of ZnO (NM-110) increased approximately 10-fold in PSF compared to low-calcium Gamble’s solution. Despite the minor differences in the compositions of the complex lung simulants (Table 2), the solubility of Zn2+ ions increases with lower pH [2]. Rapid dissolution of ZnO has also been demonstrated previously by Keller et al. [15]. The extremely rapid dissolution in PSF occurs within seconds from addition to the ATempH SBR system. The protein adsorption of BSA (138.3 ± 18.4 µg BSA/mg ZnO) to ZnO (NM-110) may slow this extreme dissolution rate, but with the current setup of the ATempH SBR system, it was impossible to determine the initial rates of ZnO (NM-110) in PSF.
The coated ZnO (NM-111) demonstrated an expected lower solubility in low-calcium Gamble’s solution than in PSF (Figure 3A,B) due to the pH difference [2]. The variation across the three batch reactors resulted in large standard deviations of the 0.05% BSA dispersion of ZnO (NM-111) (Figure 3B). Reasonably, the variation could be assigned to dosing and sampling differences. Compared to results from testing ZnO (NM-110), ZnO (NM-111) in low-calcium Gamble’s solution unexpectedly showed lower solubility after 24 h despite similar initial dissolution rates when pre-dispersed in the 0.05% BSA Table 7, Figure 3A). The different dissolution behavior of ZnO (NM-110) and ZnO (NM-111) in the presence of 0.05% BSA might be related to the additional presence of an organic coating on ZnO (NM-111). The dissolution using 0.05% BSA was significantly different from the dispersions in low-calcium Gamble’s solution (p-value: <0.0001) and water (p-value: 0.0711), while there was no difference between low-calcium Gamble’s solution and the water dispersion (p-value: 0.2858).
Despite the organic coating on ZnO (NM-111), the dissolution in PSF occurred immediately (pre-dispersion in water or PSF) or within the first hour (pre-dispersion with 0.05% BSA) (Figure 3B); therefore, it was impossible to determine the initial dissolution rates. Statistically, the dissolution was affected by all three pre-dispersion media (p-values in Table 6); there was a difference between using water and PSF as a dispersion medium. However, this might be a size effect, as the PSF dispersion formed extremely large agglomerates. A lower initial dissolved concentration (t0 + 25 min) of the 0.05% BSA dispersion was potentially influenced by particle–protein interaction as 88.3 ± 27.1 µg BSA/mg ZnO (NM-111) was found adsorbing to the surface (Table 4). In all cases, the dissolved amount of ZnO (NM-111) reached more than 100% dissolved material (i.e., dissolved concentrations > nominal concentration of 102.4 mg/L), likely resulting from inhomogeneous particle dispersion and the important, though critical, addition of particles to the test batch reactors.
The observed initial suppression of Al-oxide and Zn dissolution using 0.05% BSA may be due to different mechanisms. We identified that a large amount of the BSA in the 0.05% BSA adsorb to the test materials (Table 4). However, dissolved Al3+ and Zn2+ may also adsorb or bind to BSA [34], suppressing the concentration of free ions [35]. We describe two scenarios for the suppressed release of Al3+ and Zn2+ after dispersion with 0.05% BSA.
Scenario 1: Studies have reported that albumin can form mono and polynuclear complexes with metal ions as Zn2+, Cu2+, Pt2+, Cu2+, Ni2+, and Co2+ [34]. Complexation of Al3+ or Zn2+ to BSA could potentially happen on the surface of the particles as well as with ions released from the surface, forming complexes in the solution. In the case of TiO2 (NM-104), based on the assumption that all 6 wt.% Al2O3 coating is completely released from the material, aluminum will be in great excess (105 fold by molarity) compared to the BSA. One could expect that complexation could lower the concentration of free and measurable ions. The size of BSA has been reported as 66 kDa [36], whereas the used filters are a 3 kDa membrane. In the case of ion–BSA complexation, the complexes will be trapped and cleared by the filtration, thereby decreasing the determined dissolution output. However, the initial dissolution concentrations were comparable in all cases of dissolving Al2O3 (Table 7), indicating that potential Al–protein complexation has negligible importance in these tests. As ZnO (NM-110 and NM-111) fully dissolves in PSF, the hypothesis of Zn-BSA complexation was also not found plausible for Zn2+ ions.
Scenario 2: An alternative hypothesis to the observed suppressed release of ions after dispersion with 0.05% BSA is capping or “surface coating” of the NM. Dispersion in water, low-calcium Gamble’s solution, and PSF all demonstrate a higher release of aluminum (despite the differences in pH) compared to 0.05% BSA dispersions, which supports the assumption of the BSA binding to the surface of the TiO2 (NM-104) particles. Vergaro et al. investigated the interaction between nanosized TiO2 and human serum albumin and found that serum albumin interacts with TiO2 nanocrystals [37].
A complete understanding of the relative role of BSA as a protective capping or ion scavenger requires further in-depth studies to make clear conclusions. However, at the state of writing, we consider Scenario 2 the most likely explanation for why the Al3+ and Zn2+ dissolution is suppressed after dispersion with 0.05% BSA (Figure 1, Figure 2 and Figure 3).

3.4. Pro et Con Analysis Regarding the Selection of Pre-Dispersion Media for Dissolution Testing

The purpose of creating homogeneous liquid pre-dispersions of test materials as an initial step in batch reactor dissolution testing is to allow more precise dosing [8] and at least reasonable suspension of dispersed particles during dissolution testing. Direct dosing of dry powders to batch reactors cannot be applied due to high differences in, e.g., agglomeration and hydrophobicity of NMs. However, the liquid pre-dispersion also has drawbacks as dissolution starts as soon as the particles are added to the dispersion media. As seen in the case for both TiO2 (NM-104) in low-calcium Gamble’s solution and PSF (Figure 1A,B), ZnO (NM-110) in PSF (Figure 2B) and ZnO (NM-111) in low-calcium Gamble’s solution and PSF (Figure 3A,B), the dissolution over 24 h was affected by the type of pre-dispersion medium.
Overall, the most pronounced effect on dissolution behavior was seen by using the 0.05% BSA as a dispersion medium, which resulted in generic good dispersions but delayed the dissolution, as discussed earlier. A total of 0.05% BSA was initially chosen in NANOGENOTOX as a biologically acceptable dispersion medium, providing reasonable dispersability and ability to stabilize particles through different mechanisms (electric, steric, and depletion stabilization) [10]. Pre-dispersion by use of protein dispersants satisfy the needs to perform harmonized in vitro and in vivo toxicological testing as applied in several EU projects [7]. The stock dispersions require a high enough concentration to depict the potential toxic effect and meet the detection limits. As seen in this study, 0.05% BSA suppressed the dissolution signal potentially driven by a complex or capping effect by the protein.
In general, the use of proteins as a stabilization agent of the particle dispersion reflects the conditions in biological systems better. Further, it is an advantage of the observed delayed dissolution that it actually allows better measurement of the initial dissolution rate. While BSA is a relevant biological protein, the observation raises a question about whether a generic dispersion protocol with proteins is the best option to perform dissolution studies or dispersion should be based on a case-by-case decision. The advantage of a generic protocol is comparability between materials, repetitions, and laboratories. The choice of pre-dispersion medium may be steered by relevance for whether a biological or non-biological compartment is tested. However, a generic protocol can reach a limit, as not all NMs may be adequately dispersed using the same liquid dispersion medium. As seen in this study, the choice of dispersion medium potentially can affect the starting concentration and dissolution rates. Therefore, harmonization is required to reach good comparability between experiments and laboratories. Well-justified modifications could be accepted case-by-case. The protocol can also be improved in the future by adding measurements of initial particle concentrations, which would enhance the ability for quality control and increase the comparability of individual experiments.

4. Conclusions

This study demonstrated that pre-dispersion is an important parameter to consider in batch reactor dissolution testing of NMs. We showed that the choice of the pre-dispersion medium could significantly affect the dissolution profiles of TiO2 (NM-104) and ZnO (NM-111) in low-calcium Gamble’s solution and PFS and ZnO (NM-110) in low-calcium Gamble’s solution over 24 h of testing. The effect of using different pre-dispersion media shows that the choice of pre-dispersion media should be harmonized to allow the generation of comparable results between tests and across laboratories.

Supplementary Materials

The following are available online at https://www.mdpi.com/article/10.3390/nano12030566/s1, Figure S1: Hydrodynamic size distribution of TiO2 (NM-104), Figure S2: Hydrodynamic size distribution of ZnO (NM-110), Figure S3: Hydrodynamic size distribution of ZnO (NM-111).

Author Contributions

Conceptualization, E.H., J.J.S., K.L. and K.A.J.; methodology, E.H; software, E.H.; formal analysis, E.H.; investigation, E.H.; resources: E.H., J.J.S., K.L. and K.A.J.; data curation, E.H.; writing—original draft preparation, E.H.; writing—review and editing, E.H., J.J.S., K.L. and K.A.J.; visualization, E.H; supervision, J.J.S., K.L. and K.A.J.; project administration, K.L. and K.A.J.; funding acquisition, K.L. and K.A.J. All authors have read and agreed to the published version of the manuscript.

Funding

This research was funded by Europeans Union’s Horizon 2020 Research and Innovation Programme under grant agreement number 760813 (PATROLS) and grant agreement number 814401 (GOV4NANO).

Data Availability Statement

The data are available from the eNanoMapper database when the embargo of the EU project PATROLS is lifted in October 2023; http://www.enanomapper.net/data (accessed on 9 October 2021).

Acknowledgments

Thanks to Harald Hannerz from the National Research Center for the Working Environment for help with the statistical analysis.

Conflicts of Interest

The authors declare no conflict of interest.

References

  1. Fröhlich, E.; Salar-Behzadi, S. Toxicological assessment of inhaled nanoparticles: Role of in vivo, ex vivo, in vitro, and in Silico Studies. Int. J. Mol. Sci. 2014, 15, 4795–4822. [Google Scholar] [CrossRef] [PubMed]
  2. Avramescu, M.L.; Rasmussen, P.E.; Chénier, M.; Gardner, H.D. Influence of pH, particle size and crystal form on dissolution behaviour of engineered nanomaterials. Environ. Sci. Pollut. Res. 2017, 24, 1553–1564. [Google Scholar] [CrossRef] [PubMed] [Green Version]
  3. Vandebriel, R.J.; De Jong, W.H. A review of mammalian toxicity of ZnO nanoparticles. Nanotechnol. Sci. Appl. 2012, 5, 61–71. [Google Scholar] [CrossRef] [PubMed] [Green Version]
  4. Misra, S.K.; Dybowska, A.; Berhanu, D.; Luoma, S.N.; Valsami-Jones, E. The complexity of nanoparticle dissolution and its importance in nanotoxicological studies. Sci. Total Environ. 2012, 438, 225–232. [Google Scholar] [CrossRef] [PubMed]
  5. Verleysen, E.; Wagner, T.; Lipinski, H.G.; Kägi, R.; Koeber, R.; Boix-Sanfeliu, A.; De Temmerman, P.J.; Mast, J. Evaluation of a TEM based Approach for Size Measurement of Particulate (Nano)materials. Materials 2019, 12, 2274. [Google Scholar] [CrossRef] [Green Version]
  6. Holmfred, E.; Loeschner, K.; Sloth, J.J.; Jensen, K.A. Validation and demonstration of an Atmosphere-Temperature-pH-controlled stirred batch reactor system for determination of (nano)material solubility and dissolution kinetics in physiological simulant lung fluids. Nanomaterials 2022, 12, 517. [Google Scholar] [CrossRef]
  7. Hartmann, N.B.; Jensen, K.A.; Baun, A.; Rasmussen, K.; Rauscher, H.; Tantra, R.; Cupi, D.; Gilliland, D.; Pianella, F.; Riego Sintes, J.M. Techniques and Protocols for Dispersing Nanoparticle Powders in Aqueous Media—Is there a Rationale for Harmonization? J. Toxicol. Environ. Health Part B 2015, 18, 299–326. [Google Scholar] [CrossRef] [Green Version]
  8. Jensen, K.A.; Pojana, G.; Bilanicova, D. Characterization of Manufactured Nanomaterials, Dispersion, and Exposure for Toxicological Testing, 2nd ed.; CRC Press Taylor and Francis Group: Boca Raton, FL, USA, 2014; pp. 44–73. [Google Scholar]
  9. Wu, F.; Harper, B.J.; Harper, S.L. Comparative dissolution, uptake, and toxicity of zinc oxide particles in individual aquatic species and mixed populations. Environ. Toxicol. Chem. 2019, 38, 591–602. [Google Scholar] [CrossRef] [Green Version]
  10. Jensen, K.A.; Kembouche, Y.; Christiansen, E.; Jacobsen, N.R.; Wallin, H.; Guiot, C.; Spalla, O.; Witschger, O. Towards a Method for Detecting the Potential Genotoxicity of Nanomaterials. Deliverable 3. Final Protocol for Producing Suitable Manufactured Nanomaterial Exposure Media. The Generic NANOGENOTOX Dispersion Protocol. Standard Operating Procedure (SOP) and Background Documentation. 2011, pp. 1–33. Available online: https://www.anses.fr/en/system/files/nanogenotox_deliverable_5.pdf (accessed on 6 September 2021).
  11. Hadrup, N.; Bengtson, S.; Jacobsen, N.R.; Jackson, P.; Nocun, M.; Saber, A.T.; Jensen, K.A.; Wallin, H.; Vogel, U. Influence of dispersion medium on nanomaterial-induced pulmonary inflammation and DNA strand breaks: Investigation of carbon black, carbon nanotubes and three titanium dioxide nanoparticles. Mutagenesis 2017, 32, 581–597. [Google Scholar] [CrossRef] [Green Version]
  12. Sauer, U.G.; Aumann, A.; Ma-Hock, L.; Landsiedel, R.; Wohlleben, W. Influence of dispersive agent on nanomaterial agglomeration and implications for biological effects in vivo or in vitro. Toxicol. In Vitro 2015, 29, 182–186. [Google Scholar] [CrossRef]
  13. Utembe, W.; Potgieter, K.; Stefaniak, A.B.; Gulumian, M. Dissolution and biodurability: Important parameters needed for risk assessment of nanomaterials. Part. Fibre Toxicol. 2015, 12, 1–12. [Google Scholar] [CrossRef] [PubMed] [Green Version]
  14. OECD—Organisation for Economic Co-Operation and Development Guidance on Sample Preparation and Dosimetry for the Safety Testing of Manufactured Nanomaterials. Available online: http://www.oecd.org/officialdocuments/publicdisplaydocumentpdf/?cote=ENV/JM/MONO(2012)40&docLanguage=En (accessed on 6 September 2021).
  15. Keller, J.G.; Peijnenburg, W.; Werle, K.; Landsiedel, R.; Wohlleben, W. Understanding dissolution rates via continuous flow systems with physiologically relevant metal ion saturation in lysosome. Nanomaterials 2020, 10, 311. [Google Scholar] [CrossRef] [PubMed] [Green Version]
  16. David, C.A.; Galceran, J.; Rey-Castro, C.; Puy, J.; Companys, E.; Salvador, J.; Monné, J.; Wallace, R.; Vakourov, A. Dissolution kinetics and solubility of ZnO nanoparticles followed by AGNES. J. Phys. Chem. C 2012, 116, 11758–11767. [Google Scholar] [CrossRef]
  17. Da Silva, E.; Kembouche, Y.; Tegner, U.; Baun, A.; Jensen, K.A. Interaction of biologically relevant proteins with ZnO nanomaterials: A confounding factor for in vitro toxicity endpoints. Toxicol. In Vitro 2019, 56, 41–51. [Google Scholar] [CrossRef]
  18. Da Silva, E.; Kembouche, Y.; Tegner, U.; Baun, A.; Jensen, K.A. Data supporting the investigation of interaction of biologically relevant proteins with ZnO nanomaterials: A confounding factor for in vitro toxicity endpoints. Data Br. 2019, 23, 103795. [Google Scholar] [CrossRef]
  19. Guiot, C.; Spalla, O. Stabilization of TiO2 nanoparticles in complex medium through a pH adjustment protocol. Environ. Sci. Technol. 2013, 47, 1057–1064. [Google Scholar] [CrossRef] [PubMed]
  20. Clausen, P.A.; Kofoed-Sørensen, V.; Nørgaard, A.W.; Sahlgren, N.M.; Jensen, K.A. Thermogravimetry and mass spectrometry of extractable organics from manufactured nanomaterials for identification of potential coating components. Materials 2019, 12, 3657. [Google Scholar] [CrossRef] [Green Version]
  21. Guldberg, M.; Madsen, A.L.; Sebastian, K.; Fellmann, J.; Potter, R.; Bauer, J.; Searl, A.; Maquin, B.; Jubb, G. In-vitro dissolution of vitreous silicate fibres according to EURIMA test guideline—Results of two Round Robins. Glass Sci. Technol. 2003, 76, 199–205. [Google Scholar]
  22. Stefaniak, A.B.; Guilmette, R.A.; Day, G.A.; Hoover, M.D.; Breysse, P.N.; Scripsick, R.C. Characterization of phagolysosomal simulant fluid for study of beryllium aerosol particle dissolution. Toxicol. In Vitro 2005, 19, 123–134. [Google Scholar] [CrossRef]
  23. De Temmerman, P.-J.; Mast, J.; Guiot, C.; Spalla, O.; Rousset, D.; Shivachev, B.; Tarassov, M.; Jensen, K.A. Towards A Method for Detecting the Potential Genotoxicity of Nanomaterials. Nanogenotox Deliverable 4.2: Transmission Electron Microscopic Characterization of NANOGENOTOX Nanomaterials. Available online: http://www.nanogenotox.eu/index.php?option=com_content&view=article&id=136&Itemid=158 (accessed on 6 September 2021).
  24. OECD—Organisation for Economic Co-operation and Development Dossier on Zinc Oxide. Series on the Safety of Manufactured Nanomaterials. No. 52. Available online: http://www.oecd.org/officialdocuments/displaydocumentpdf?cote=env/jm/mono(2010)46&doclanguage=en (accessed on 6 September 2021).
  25. Llewellyn, S.V.; Conway, G.E.; Zanoni, I.; Jørgensen, A.K.; Shah, U.K.; Seleci, D.A.; Keller, J.G.; Kim, J.W.; Wohlleben, W.; Jensen, K.A.; et al. Understanding the impact of more realistic low-dose, prolonged engineered nanomaterial exposure on genotoxicity using 3D models of the human liver. J. Nanobiotechnol. 2021, 19, 1–24. [Google Scholar] [CrossRef]
  26. Rasmussen, K.; Mast, J.; De Temmerman, P.-J.; Verleysen, E.; Waegeneers, N.; Van Steen, F.; Pizzolon, J.C.; De Temmerman, L.; Van Doren, E.; Jensen, K.A.; et al. Titanium Dioxide, NM-100, NM-101, NM-102, NM-103, NM-104, NM-105: CharacterisaCtion and Physico- Chemical Properties. Available online: https://publications.jrc.ec.europa.eu/repository/handle/JRC86291 (accessed on 6 September 2021).
  27. Singh, C.; Friedrichs, S.; Levin, M.; Birkedal, R.; Jensen, K.A.; Pojana, G.; Wohlleben, W.; Schulte, S.; Wiench, K.; Turney, T.; et al. Zinc Oxide NM-110, NM-111, NM-112, NM-113 Characterisation and Test Item Preparation, NM-Series of Representative Manufactured Nanomaterials. Eur. Sci. Tech. Res. Rep. 2011, 1–141. Available online: https://publications.jrc.ec.europa.eu/repository/handle/JRC64075 (accessed on 1 February 2022).
  28. Oberdörster, G.; Kuhlbusch, T.A.J. In vivo effects: Methodologies and biokinetics of inhaled nanomaterials. NanoImpact 2018, 10, 38–60. [Google Scholar] [CrossRef]
  29. Keller, J.G.; Graham, U.M.; Koltermann-jülly, J.; Gelein, R.; Lan, M.; Landsiedel, R.; Wiemann, M.; Oberdörster, G.; Elder, A. Predicting dissolution and transformation of inhaled nanoparticles in the lung using abiotic flow cells: The case of barium sulfate. Sci. Rep. 2020, 10, 1–15. [Google Scholar] [CrossRef] [PubMed]
  30. Fogler, H.S. Elements of Chemical Reaction Engineering, 3rd ed.; Pearson Education Limited: Hongkong, China, 1999; ISBN 9780135317167. [Google Scholar]
  31. Levenspiel, O. Chemical Reaction Engineering, 2nd ed.; John Wiley & Sons: Hoboken, NJ, USA, 2004; ISBN 9781420039870. [Google Scholar]
  32. Mejia, J.; Unamur, S.L.; Booth, A.; Sintef, J.F.; Sabella, S.; Bove, P.; Iit, M.M.; Jensen, K.A.; Kembouche, Y.; Da Silva, E.; et al. NANoREG—Deliverable 2.08: Protocols for Exposure-Fate Characterization in Ecotoxicity and In Vitro Studies. 2016, pp. 1–82. Available online: https://www.rivm.nl/en/documenten/nanoreg-d208-fs-protocols-for-exposure-fate-characterization-in-ecotoxicity-and-in-vitro (accessed on 3 February 2022).
  33. European Union Observatory for Nanomaterials ENM eNanomapper. Available online: http://www.enanomapper.net/ (accessed on 8 September 2021).
  34. Shahnawaz Khan, M.; Bodoki, A.; Oprean, L.; Oprean, R. Bovine serum albumin interactions with metal complexes. Clujul Med. 2014, 87, 5. [Google Scholar] [CrossRef] [Green Version]
  35. Khan, M.S.; Tabrez, S.; Rehman, M.T.; Alokail, M.S. Al (III) metal augment thermal aggregation and fibrillation in protein: Role of metal toxicity in neurological diseases. Saudi J. Biol. Sci. 2020, 27, 2221–2226. [Google Scholar] [CrossRef] [PubMed]
  36. Petersen, T. All About Albumin: Biochemistry, Genetics, and Medical Applications; Academic Press an Imprint of Elsevier: Amsterdam, The Netherlands, 1995; ISBN 9780125521109. [Google Scholar]
  37. Vergaro, V.; Carlucci, C.; Cascione, M.; Lorusso, C.; Conciauro, F.; Scremin, B.F.; Congedo, P.M.; Cannazza, G.; Citti, C.; Ciccarella, G. Interaction between human serum albumin and different anatase TiO2 nanoparticles: A nano-bio interface study. Nanomater. Nanotechnol. 2015, 5, 30. [Google Scholar] [CrossRef] [Green Version]
Figure 1. Dissolution profiles of the Al2O3 coating of TiO2 (NM-104) using the ATempH SBR system. (A) TiO2 (NM-104) dispersed in low-calcium Gamble’s solution (■), water (●), and 0.05% BSA (). (B) TiO2 (NM-104) dispersed in phagolysosomal simulant fluid (PSF) (■), water (●), and 0.05% BSA (). The dissolution tests were conducted for 24 h.
Nanomaterials 12 00566 g001
Figure 2. Dissolution profiles of ZnO (NM-110). (A) ZnO (NM-110) dispersed in low-calcium Gamble’s solution (■), water (●), and 0.05% BSA (). (B) ZnO (NM-110) dispersed in phagolysosomal simulant fluid (PSF) (■), water (●), and 0.05% BSA (). The dissolution tests were conducted for 24 h. Note the differences in the y-axis scale.
Nanomaterials 12 00566 g002
Figure 3. Dissolution profiles of ZnO (NM-111). (A) ZnO (NM-111) dispersed in low-calcium Gamble’s solution (■), water (●), and 0.05% BSA (). All dispersions were tested in low-calcium Gamble’s solution for 24 h. (B) ZnO (NM-111) dispersed in phagolysosomal simulant fluid (PSF) (■), water (●), and 0.05% BSA (). All dispersions were tested in PSF for 24 h. Note the differences in the y-axis scale.
Nanomaterials 12 00566 g003
Table 1. Physicochemical characteristics of the test materials.
CharacteristicsNM-104NM-110NM-111
Primary particle size ECD * (nm)25.0 ± 1.7 a75.4 ± 58.4 b40.6 c
Average aggregate size ECD * (nm)58.5 ± 46.3 a114 ± 97 d106 ± 69 d
Crystallite size by XRD (nm)27 e 42 f 24–42 f
Specific surface area (m2/g)56.8 ± 0.5 e12.4 ± 0.6 d15.1 ± 0.6 d
MaterialTiO2—Rutile eZnO—Zincite fZnO—Zincite e
Inorganic coating (wt.%)6.08 Al2O3 gNone fNone e
Organic coating (wt.%)3.17 ± 0.07 h glycerine hND f2.1 ± 0.31 g triethoxycaprylsilane h
Moisture content (wt.%)1.50 ± 0.10 g0.28 ± 0.11 gND g
* ECD: Equivalent Circular Diameter, obtained by EDS on sample pellet; ND: not detected. a De Temmerman et al. (2012), NANOGENOTOX Deliverable 4.2 [23]. b OECD—Dossier on Zink Oxide (2015) [24]. c Llewellyn et al. (2021) [25]. d Da Silva et al. (2019) [17]. e Rasmussen et al. (2014) [26]. f Singh et al. (2011) [27]. g Holmfred et al. (2022) [6]. h Clausen et al. 2019 [20].
Table 2. Composition of phagolysosomal simulant fluid (PSF). Adapted from Ref. [22], and low-calcium Gamble’s solution. Adapted from Ref. [21].
Simulated Lung FluidComponentChemical FormulaConcentration [mg/L]
Phagolysosomal simulant fluid (PSF)Sodium phosphate dibasic anhydrousNa2HPO4142
Sodium chlorideNaCl6650
Sodium sulphate anhydrousNa2SO471
Calcium chloride dihydrateCaCl2·2H2O29
GlycineH2NCH2CO2H450
Potassium hydrogen phthalate(1-(HO2C)-2-(CO2K)-C6H4)4085
Alkylbenzyldimethylammonium chloride-50
Low-calcium Gamble’s solutionSodium chlorideNaCl6600
Sodium bicarbonateNaHCO32703
Calcium chlorideCaCl222
Sodium phosphate dibasic dodecahydrateNa2HPO4·12H2O358
Sodium sulphate anhydrousNa2SO479
Magnesium chloride hexahydrateMgCl·6H2O212
GlycineH2NCH2CO2H118
Sodium citrate dihydrateNa3C6H5O7 ·2H2O153
Sodium tartrate dihydrateNa2C4H4O6 ·2H2O180
Sodium pyruvateC3H3NaO3172
Sodium lactateC3H5NaO3175
Table 3. The following ICP-MS parameters were used to analyze the dissolved fractions of the TiO2 (NM-104) and ZnO (NM-110 and NM-111) in phagolysosomal fluid simulant (PSF) and low-calcium Gamble’s solution. The table presents the monitored isotopes related to the nanomaterial, the choice of internal standard, and the limit of detection.
Parameters (Unit)TiO2
(NM-104)
Dissolution in PSF
TiO2
(NM-104)
Dissolution in Gamble’s
ZnO
(NM-110 and NM-111)
Dissolution in PSF
ZnO
(NM-110 and NM-111)
Dissolution Gamble’s
Nebulizer gas flow rate (L/min)0.891.061.021.04
Auxiliary gas flow rate (L/min)0.800.800.800.80
Helium cell gas flow rate (L/min)4.354.58No cell gasNo cell gas
Monitored isotopes (m/z)27Al and 48Ti27Al and 48Ti64Zn64Zn
Internal standard (m/z)103Rh103Rh103Rh103Rh
Limit of detectionAl: 19 µg/L,
Ti: 3.2 µg/L
Al: 22 µg/L,
Ti: 1.2 µg/L
10 µg/L5.4 µg/L
Dilution factor for ICP-MS analysis×10×4×1000×200
Table 4. Bovine serum albumin adsorption to TiO2 (NM-104) (n = 4) and ZnO (NM-110 and NM-111) (n = 2).
Particle Concentration
(mg/mL)
Sampleµg BSA/mg NMPercent Adsorbed of the BSA AddedLiterature Values
µg BSA/mg NM
Literature Values
Percent Adsorbed of the BSA Added
2.56TiO2 (NM-104)131.8 ± 22.069143.7 ± 12.9 #66 #
2.56ZnO (NM-110)138.3 ± 18.467151.8 ± 27.0 69
2.56ZnO (NM-111)88.3 ± 27.143292.8 ± 41.5 40
# Guiot and Spalla (2013) [19]. From Da Silva et al. (2019a) [17].
Table 5. Z-average (Zave), zeta potential (Zpot), and polydispersity index (PDI) of ZnO (NM-110 and NM-111) and TiO2 (NM-104) in pre-dispersions made in water, phagolysosomal fluid simulant (PSF), and low-calcium Gamble’s solution. The values were compared to the literature average agglomeration size (Daggr) listed in Table 1 and benchmark Z-averages (Zave, benchmark). See supplementary (Figures S1–S3) for hydrodynamic size number distribution spectra (TiO2 (NM-104, S1, A-F), ZnO (NM-110, S2, A-F), and ZnO (NM-111, S3, A-F). The relative color range shown was made using the lowest (green) and highest (red) size ratio when compared with the Daggr and Zave,benchmark data.
Test MediumNanomaterialDispersion
Medium
Zave [nm]PDIZpot [mV]Zave,benchmarkZave/DaggrZave/Zave,benchmark
Low-calcium
Gamble’s solution
TiO2 (NM-104)Water157.8 ± 2.30.24 ± 0.0114.9 ± 0.7234 ± 4 a2.70.7
GS2827 ± 1895 0.88 ± 0.314.9 + 0.748.312.1
0.05% BSA724.0 ± 160.20.74 ± 0.1−0.8 ± 1.012.43.1
ZnO (NM-110)Water225.3 ± 2.20.15 ± 0.02 30.7 ± 0.6233.1 ± 7.3 b2.01.0
GS1824 ± 343 1.0 ± 0.0−16.2 ± 0.616.07.8
0.05% BSA250.6 ± 1.10.14 ± 0.02−13.4 ± 0.32.21.1
ZnO (NM-111)Water735.1 ± 97.0 0.37 ± 0.0712.5 ± 0.5247.4 ± 4.9 b6.93.0
GS3578 ± 3030.31 ± 0.1−13.1 ± 1.033.814.5
0.05% BSA278.9 ± 2.90.16 ± 0.02−14.5 ± 0.52.61.1
PSFTiO2 (NM-104)Water162.9 ± 1.90.24 ± 0.0113.4 ± 0.5234 ± 4 a2.80.7
PSF3448 ± 2283 0.93 ± 0.20.6 ± 0.858.914.7
0.05% BSA366.7 ± 153.70.30 ± 0.09−1.3 ± 0.46.31.6
ZnO (NM-110)Water257.0 ± 1.60.16 ± 0.0224.6 ± 0.6233.1 ± 7.3 b2.31.1
PSF3989 ± 8201.0 ± 0.0−15.0 ± 2.6 35.017.1
0.05% BSA 247.1 ± 2.50.30 ± 0.09−14.6 ± 0.62.21.1
ZnO (NM-111)Water868.1 ± 118.50.35 ± 0.0712.0 ± 0.3247.4 ± 4.9 b8.23.5
PSF5410 ± 6800.61 ± 0.06−13.4 ± 2.351.021.9
0.05% BSA275.9 ± 2.60.15 ± 0.02-16.7 ± 0.82.61.1
a From Jensen et al. [10]. b From Meija et al. [32].
Table 6. p-values for interaction between type of dispersion medium and time (t0, t1, t2, t4, and t24) for dissolution testing conducted in low-calcium Gamble’s solution and PSF. A = 0.05 was used as level of significance (highlighted in bold).
InteractionTiO2 (NM-104)ZnO (NM-110)ZnO (NM-111)
Gamble’s solution vs. water0.52330.37920.2858
Gamble’s solution vs. 0.05% BSA0.01680.3534<0.0001
Water vs. 0.05% BSA0.00400.39090.0711
PSF vs. Water0.61670.59870.0081
PSF vs. 0.05% BSA<0.00010.02670.0023
Water vs. 0.05% BSA<0.00010.01410.0011
Table 7. Overview of the initial concentrations (S@ti) measured at t0 + 25 min (t=0.4 h), the initial dissolutions rate, ( d C A d t ) t = 0 and surface area dissolution rates, ( d C ( S S A ) d t ) t = 0 , determined from the batch reactor setup ND: not determined, quick dissolution. The results are presented as average values ± standard deviation (n = 3 batch reactors).
Test Medium: Gamble’s SolutionTest Medium: PSF
Dispersion MediumDispersion Medium
NanomaterialInitial Concentration
and Dissolution Rates
Gamble’s SolutionWater0.05% BSAPSFWater0.05% BSA
TiO2
(NM-104),
Al2O3 coating
S@ti (mg/L)0.097 ± 2.04 × 10−30.096 ± 7.94 × 10−30.092 ± 1.65 × 10−30.139 ± 2.39 × 10−30.0965 ± 2.91 × 10−30.069 ± 4.0 × 10⁻³
( d C A d t ) t = 0 , (mg/L/h)0.171 ± 0.0640.126 ± 0.0180.160 ± 0.0380.230 ± 0.0310.220 ± 0.0140.096 ± 0.002
( d C ( S S A ) d t ) t = 0 , (cm2/L/sec)0.027 ± 0.0100.020 ± 2.8 × 10−30.025 ± 5.92 × 10−30.036 ± 4.8 × 10−30.034 ± 2.26 × 10−30.015 ± 2.73 × 10⁻⁴
ZnO
(NM-110)
S@ti (mg/L)22.3 ± 2.516.4 ± 0.410.7 ± 0.5116.3 ± 7.3125.0 ± 0.9108.1 ± 2.3
( d C A d t ) t = 0 , (mg/L/h)2.72 ± 2.590.720 ± 0.1912.04 ± 0.22NDNDND
( d C ( S S A ) d t ) t = 0 , (cm2/L/sec)0.094 ± 0.0890.025± 6.6 × 10−30.070 ± 7.74 × 10⁻³NDNDND
ZnO
(NM-111)
S@ti (mg/L)4.83 ± 0.275.76 ± 0.234.10 ± 0.61112.1 ± 0.8104.5 ± 3.874.67 ± 4.52
( d C A d t ) t = 0 , (mg/L/h)0.604 ± 0.5822.09 ± 1.711.95 ± 0.26NDNDND
( d C ( S S A ) d t ) t = 0 (cm2/L/sec)0.025 ± 0.0240.088± 0.0720.082 ± 0.011NDNDND
Publisher’s Note: MDPI stays neutral with regard to jurisdictional claims in published maps and institutional affiliations.

