
Effect of the Aspect Ratio and Tilt Angle on the Free Convection Heat Transfer Coefficient Inside Al2O3–Water-Filled Square Cuboid Enclosures


Abstract
:1. Introduction
2. Material and Methods
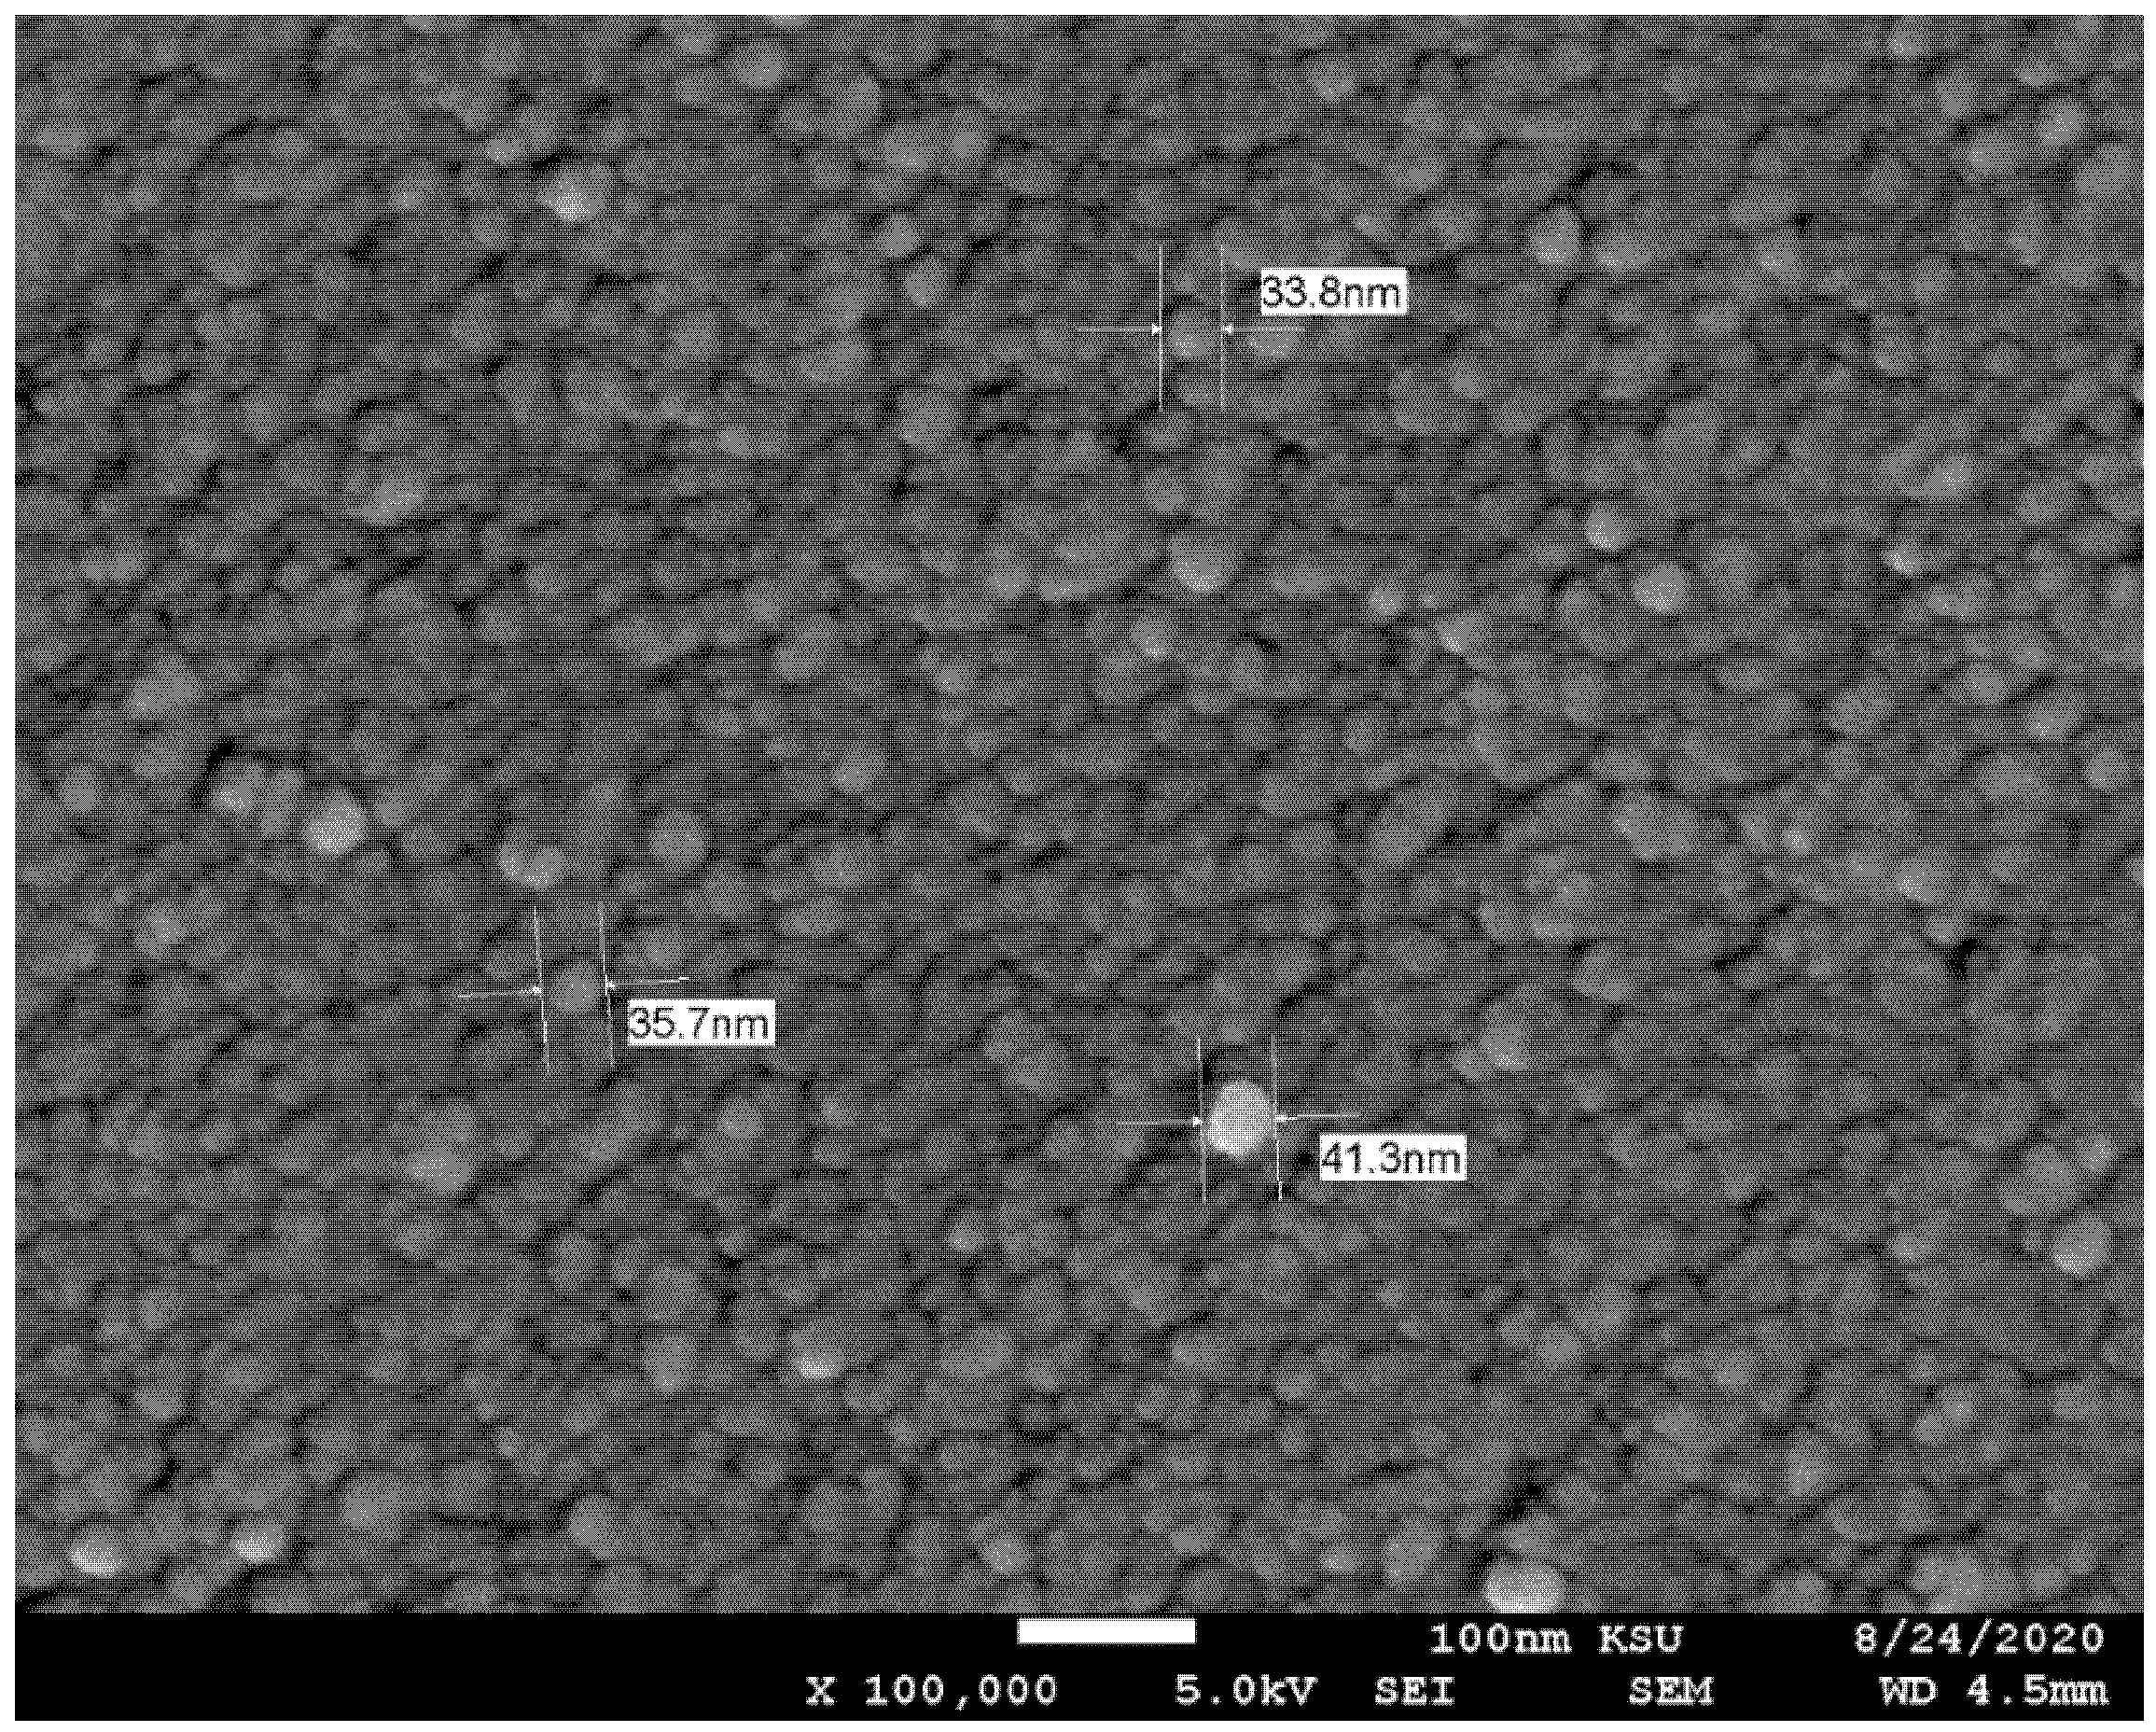
2.1. Nanofluid Formulation
2.2. Thermophysical Properties of the Nanofluids
2.2.1. Thermal Conductivity
2.2.2. Dynamic Viscosity and Density
2.2.3. Specific Heat and Thermal Expansion
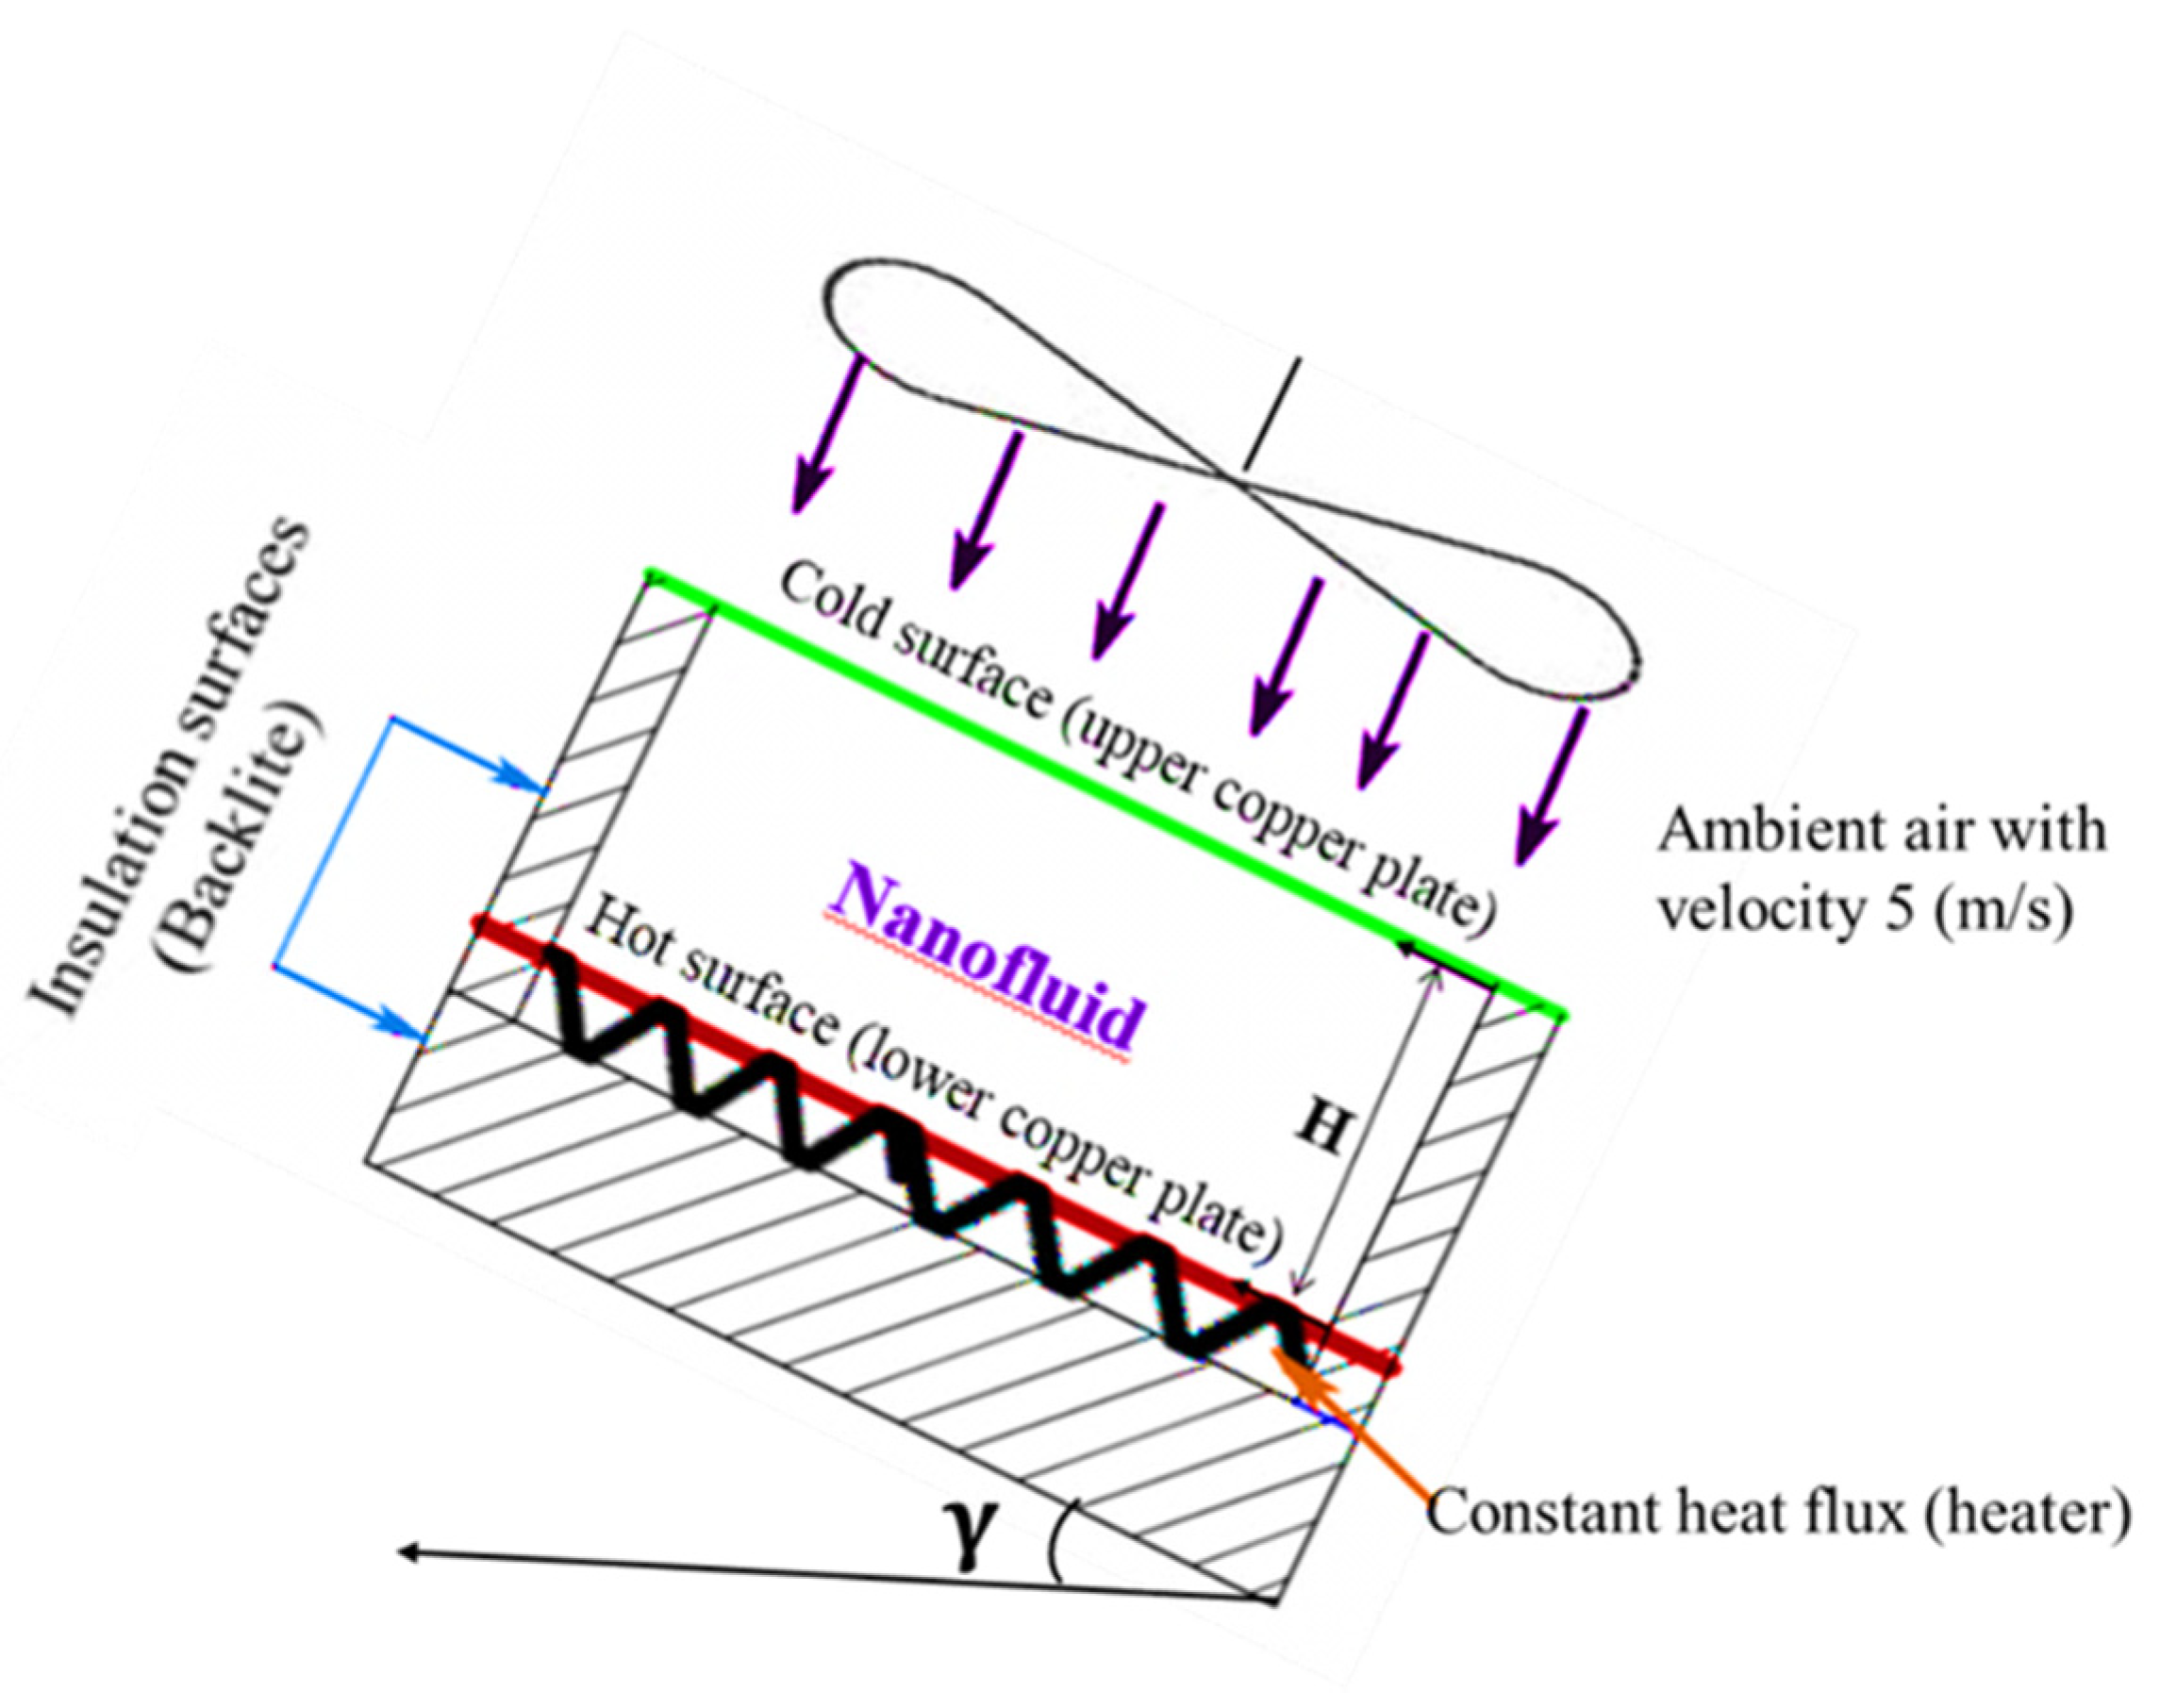
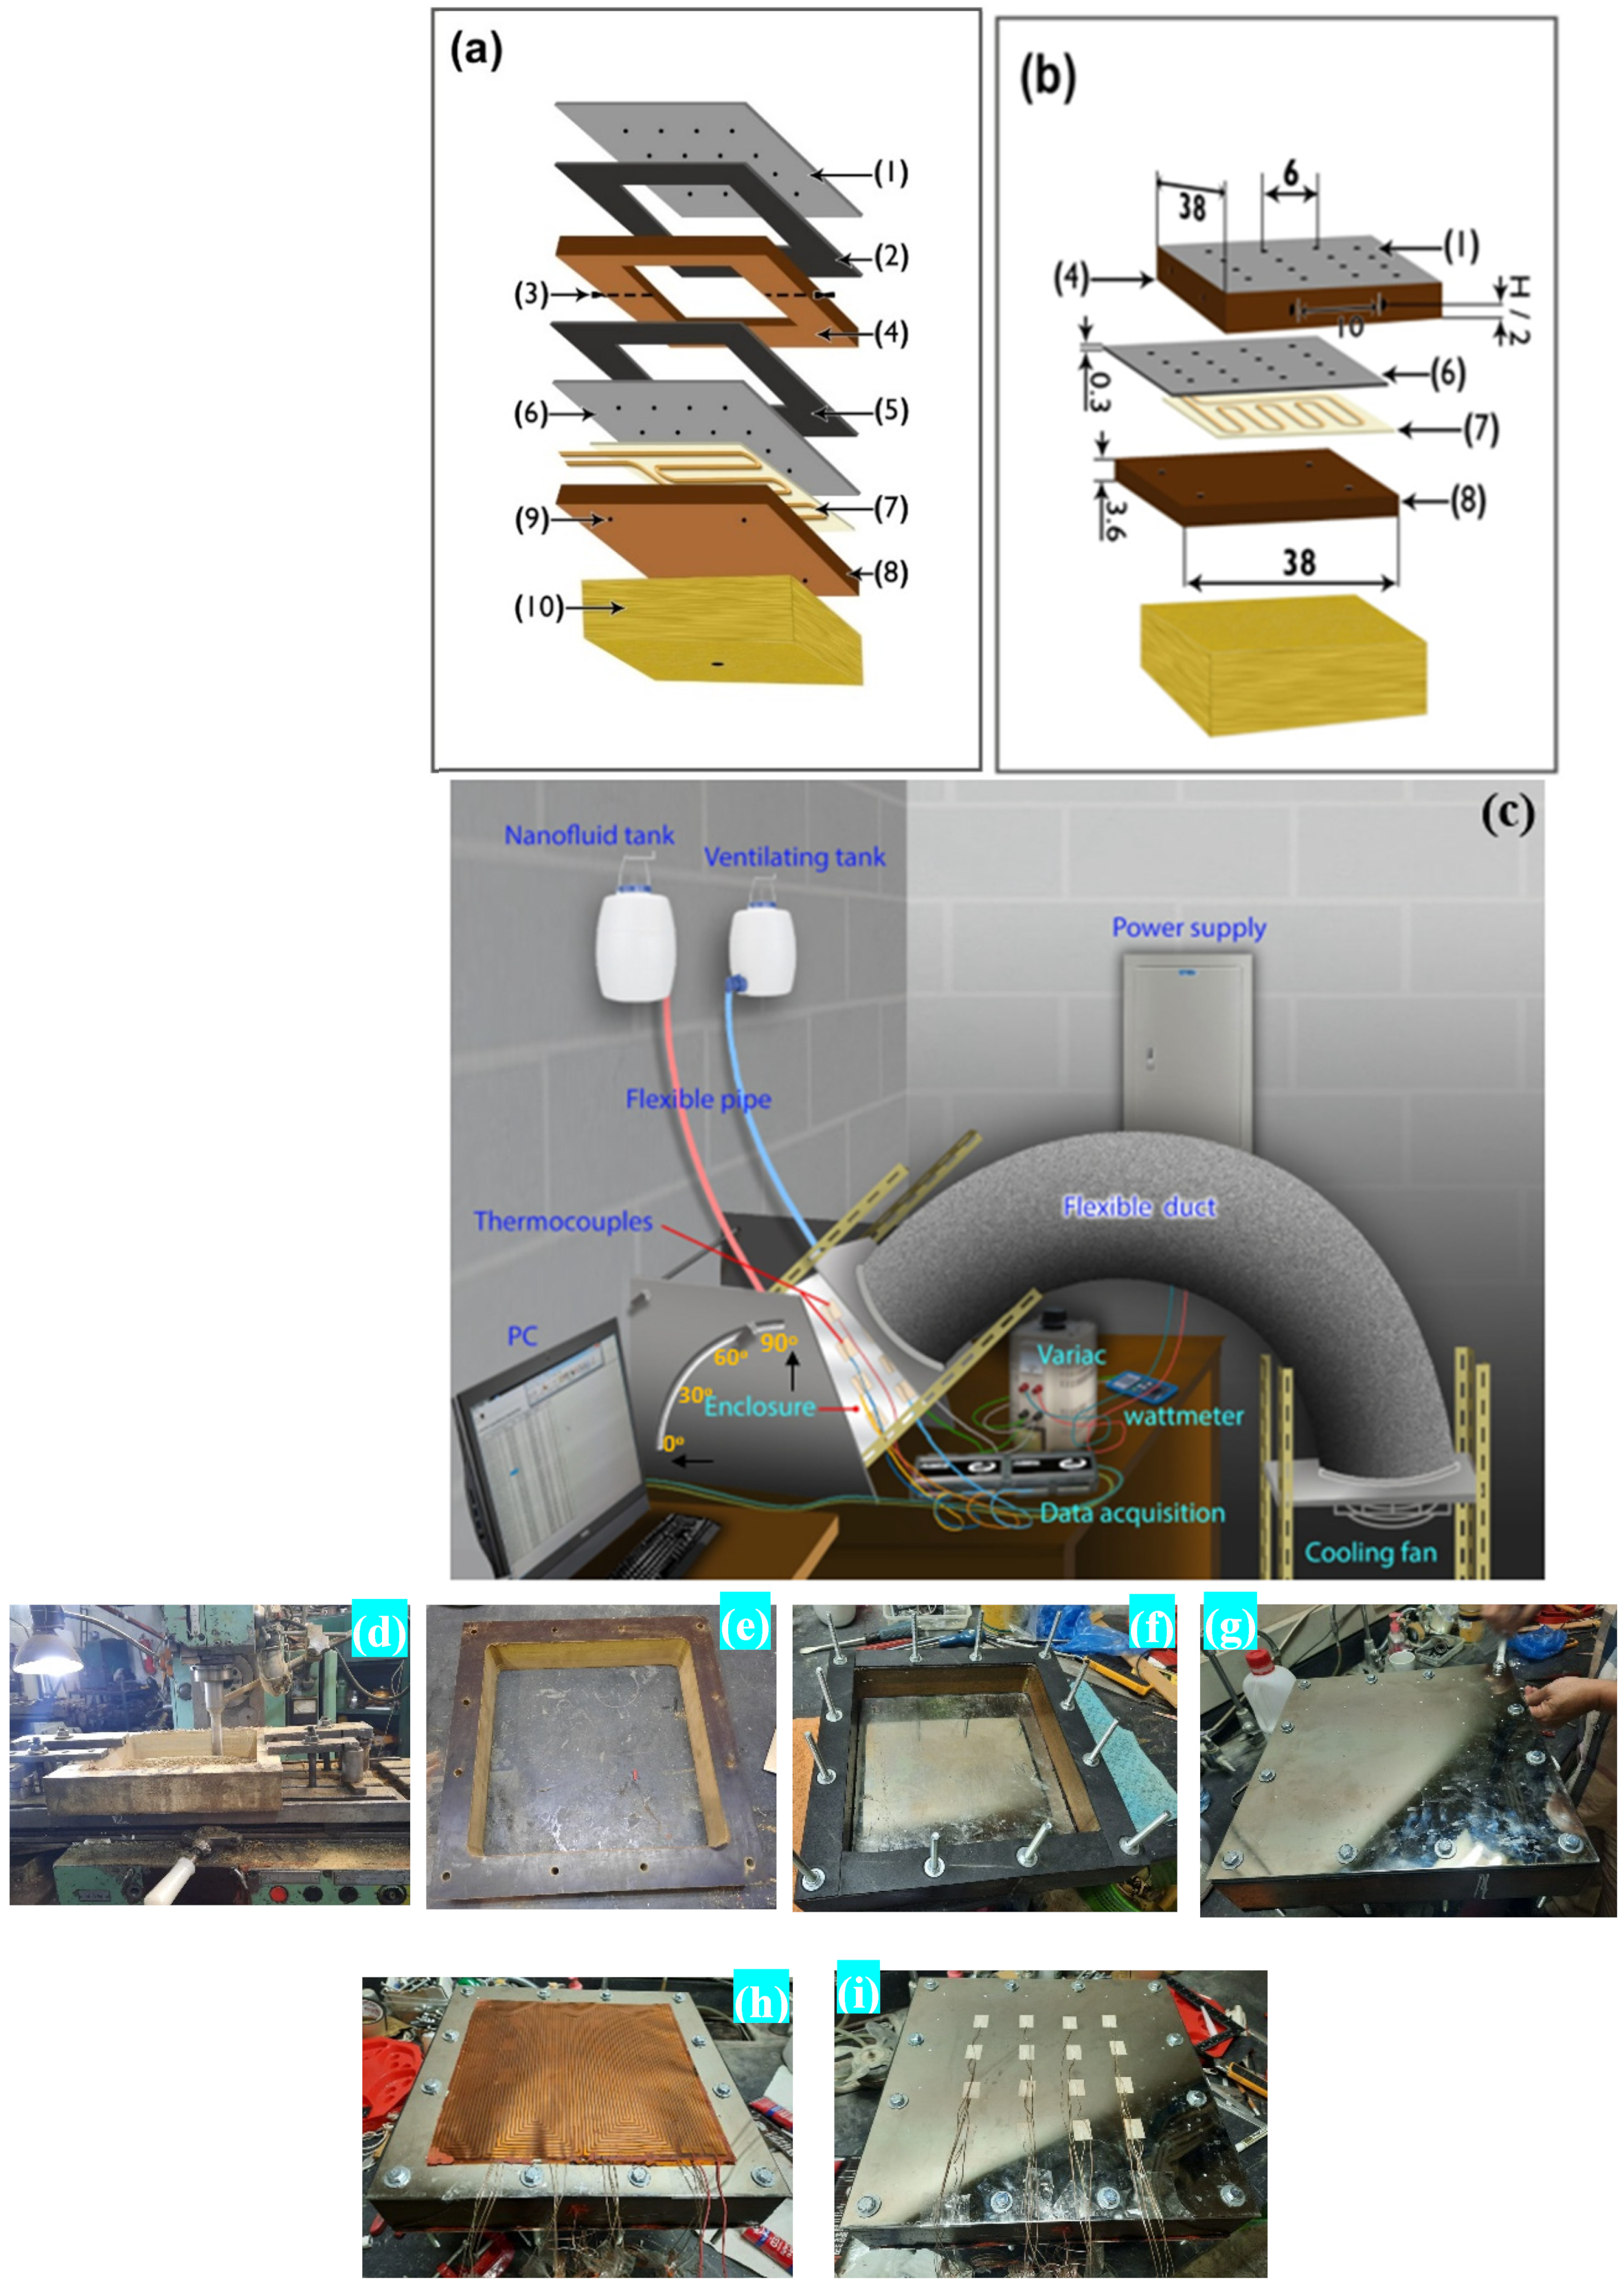
2.3. Experimental Setup
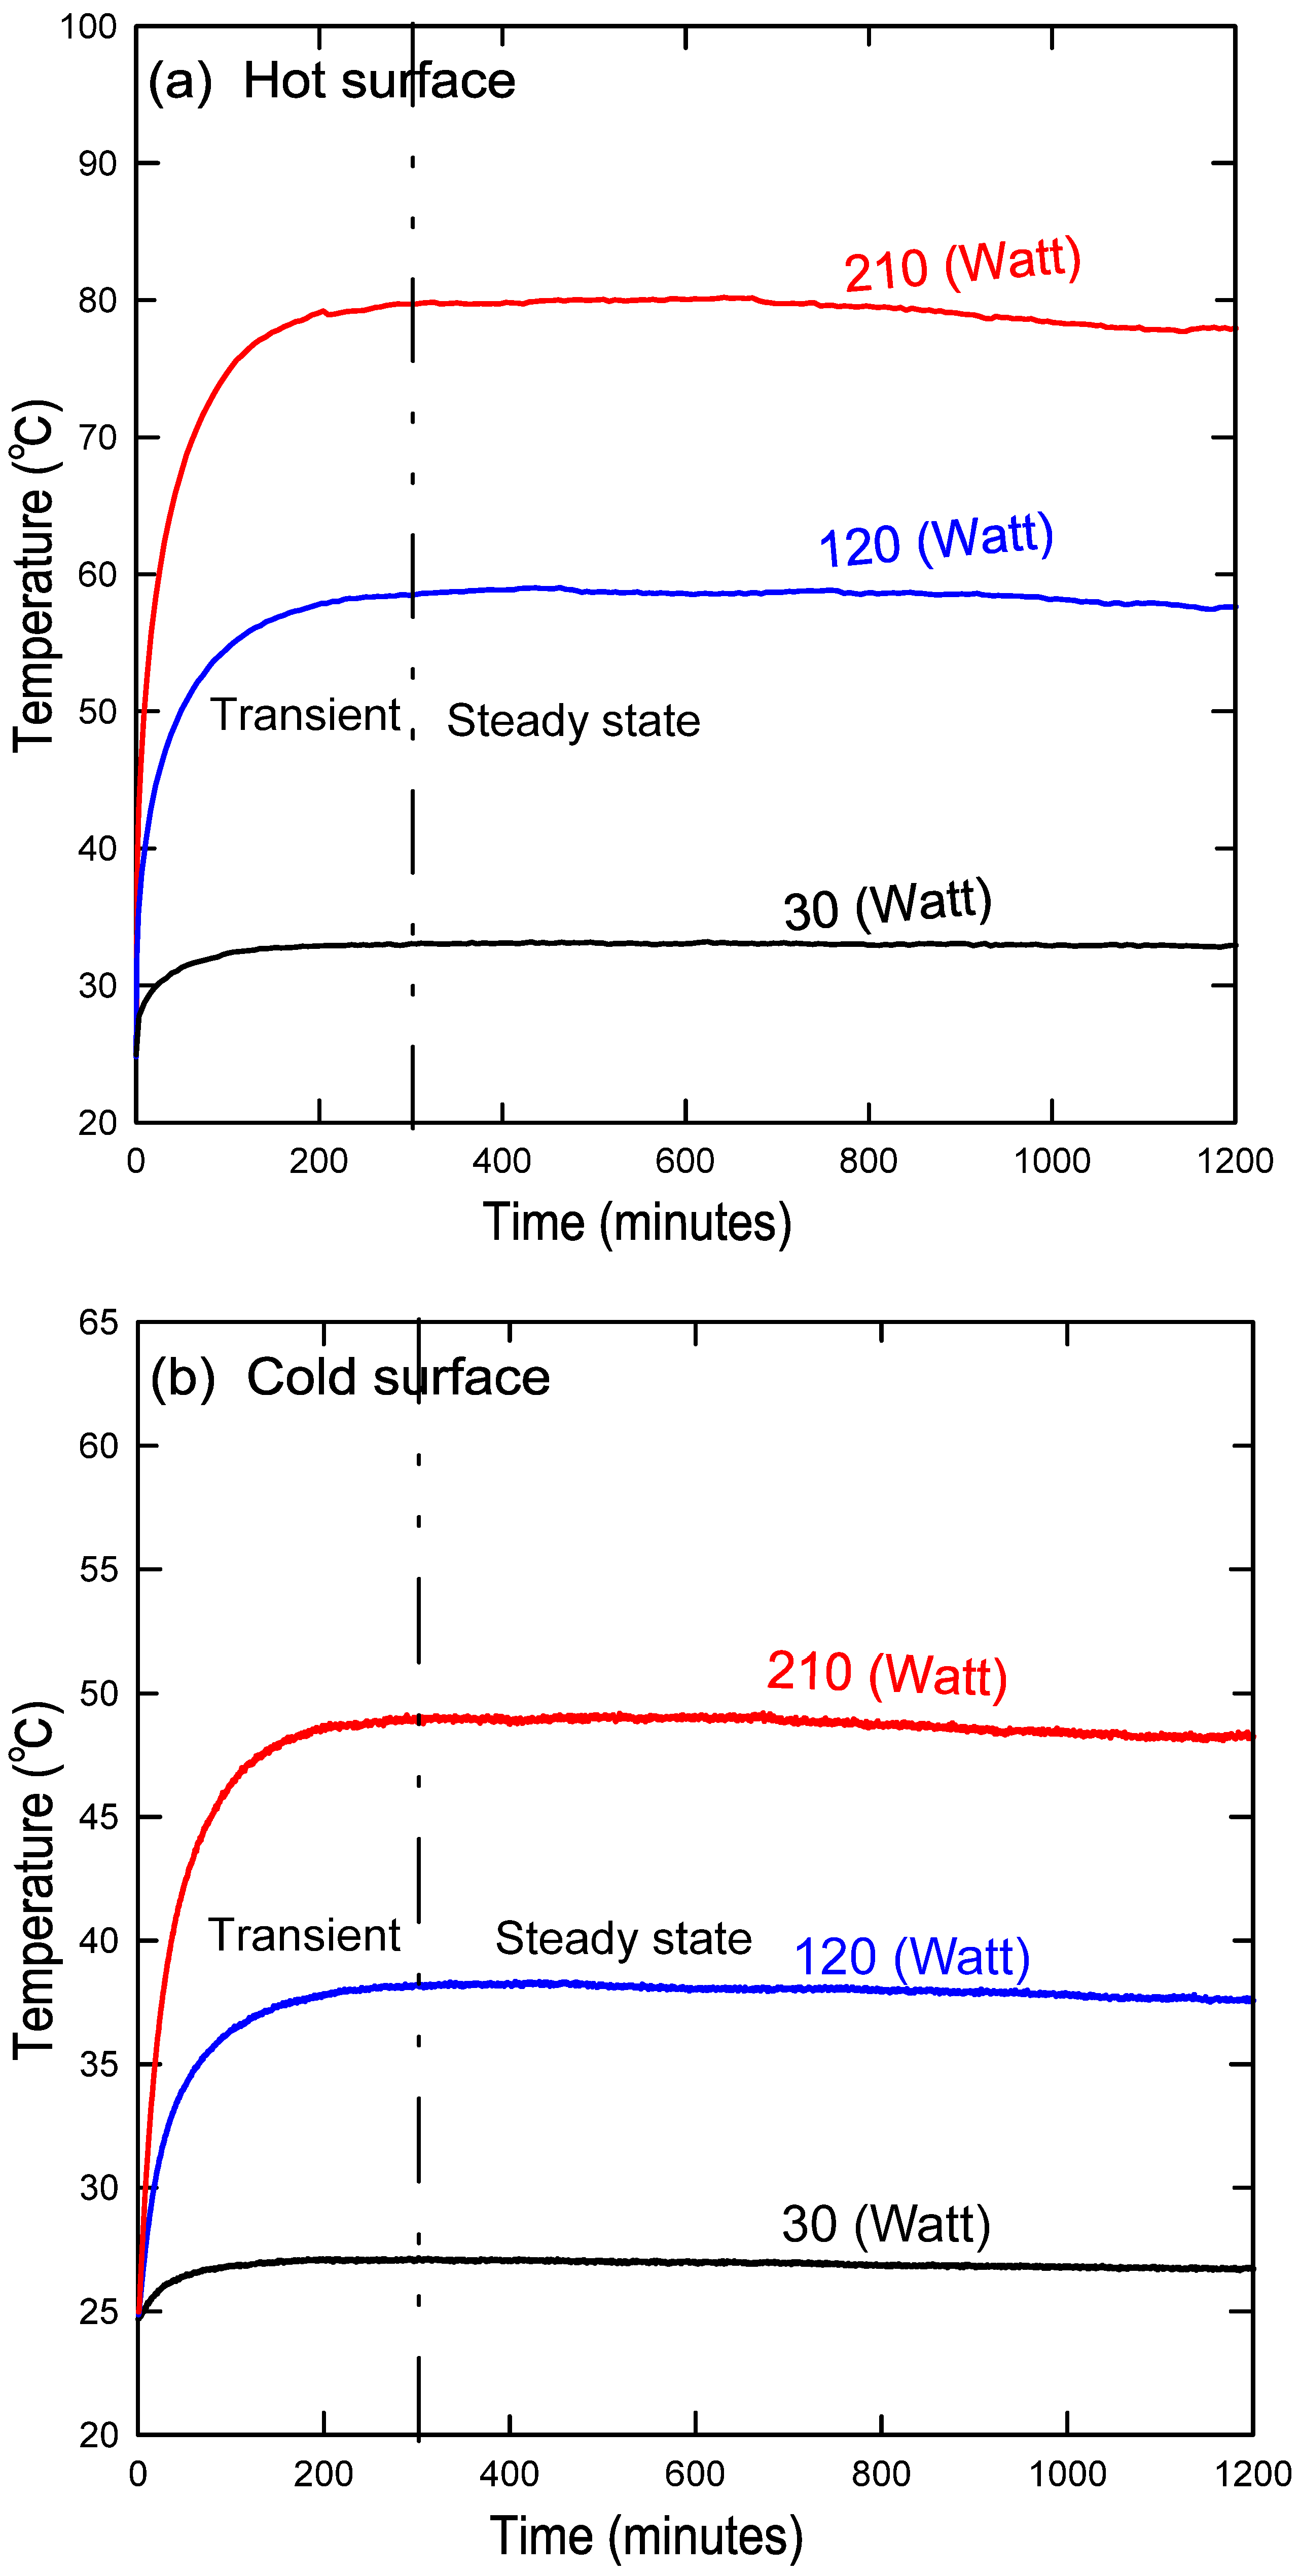
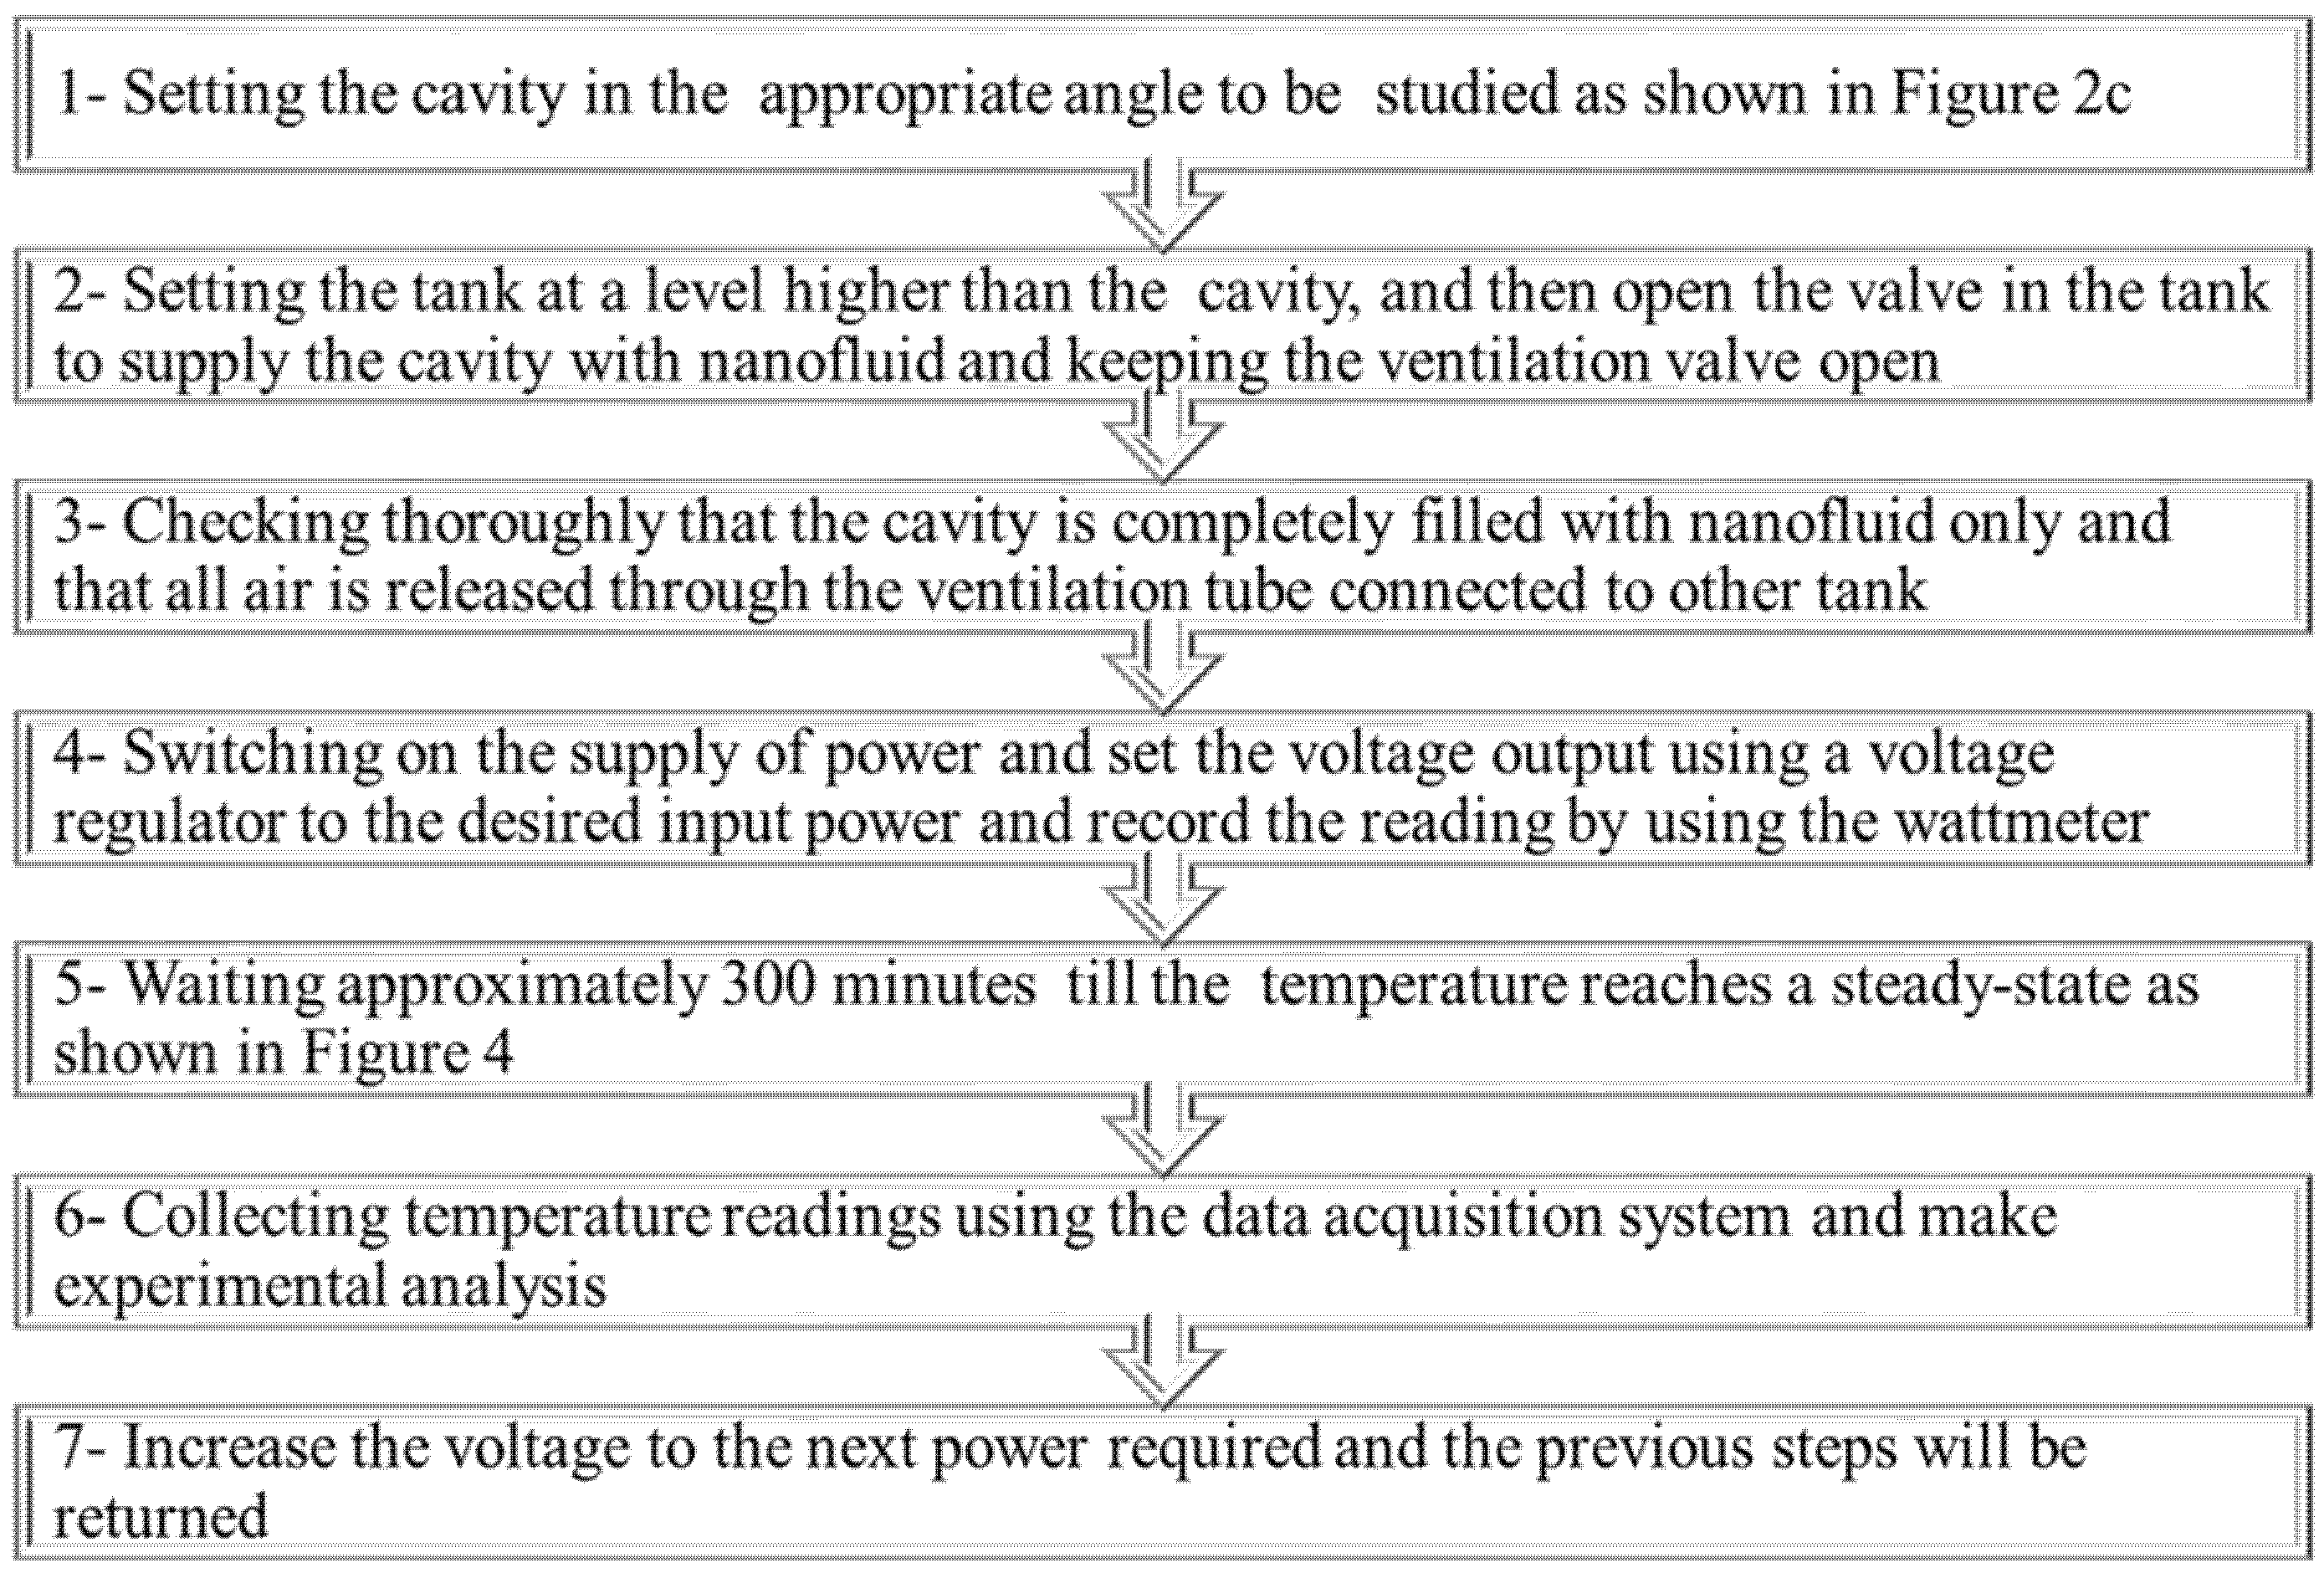
2.4. Experimental Procedure
2.5. Experimental Analysis
2.5.1. Average Heat Transfer Coefficient
2.5.2. Uncertainty Calculations
3. Results and Discussion
3.1. Thermophysical Properties Analysis
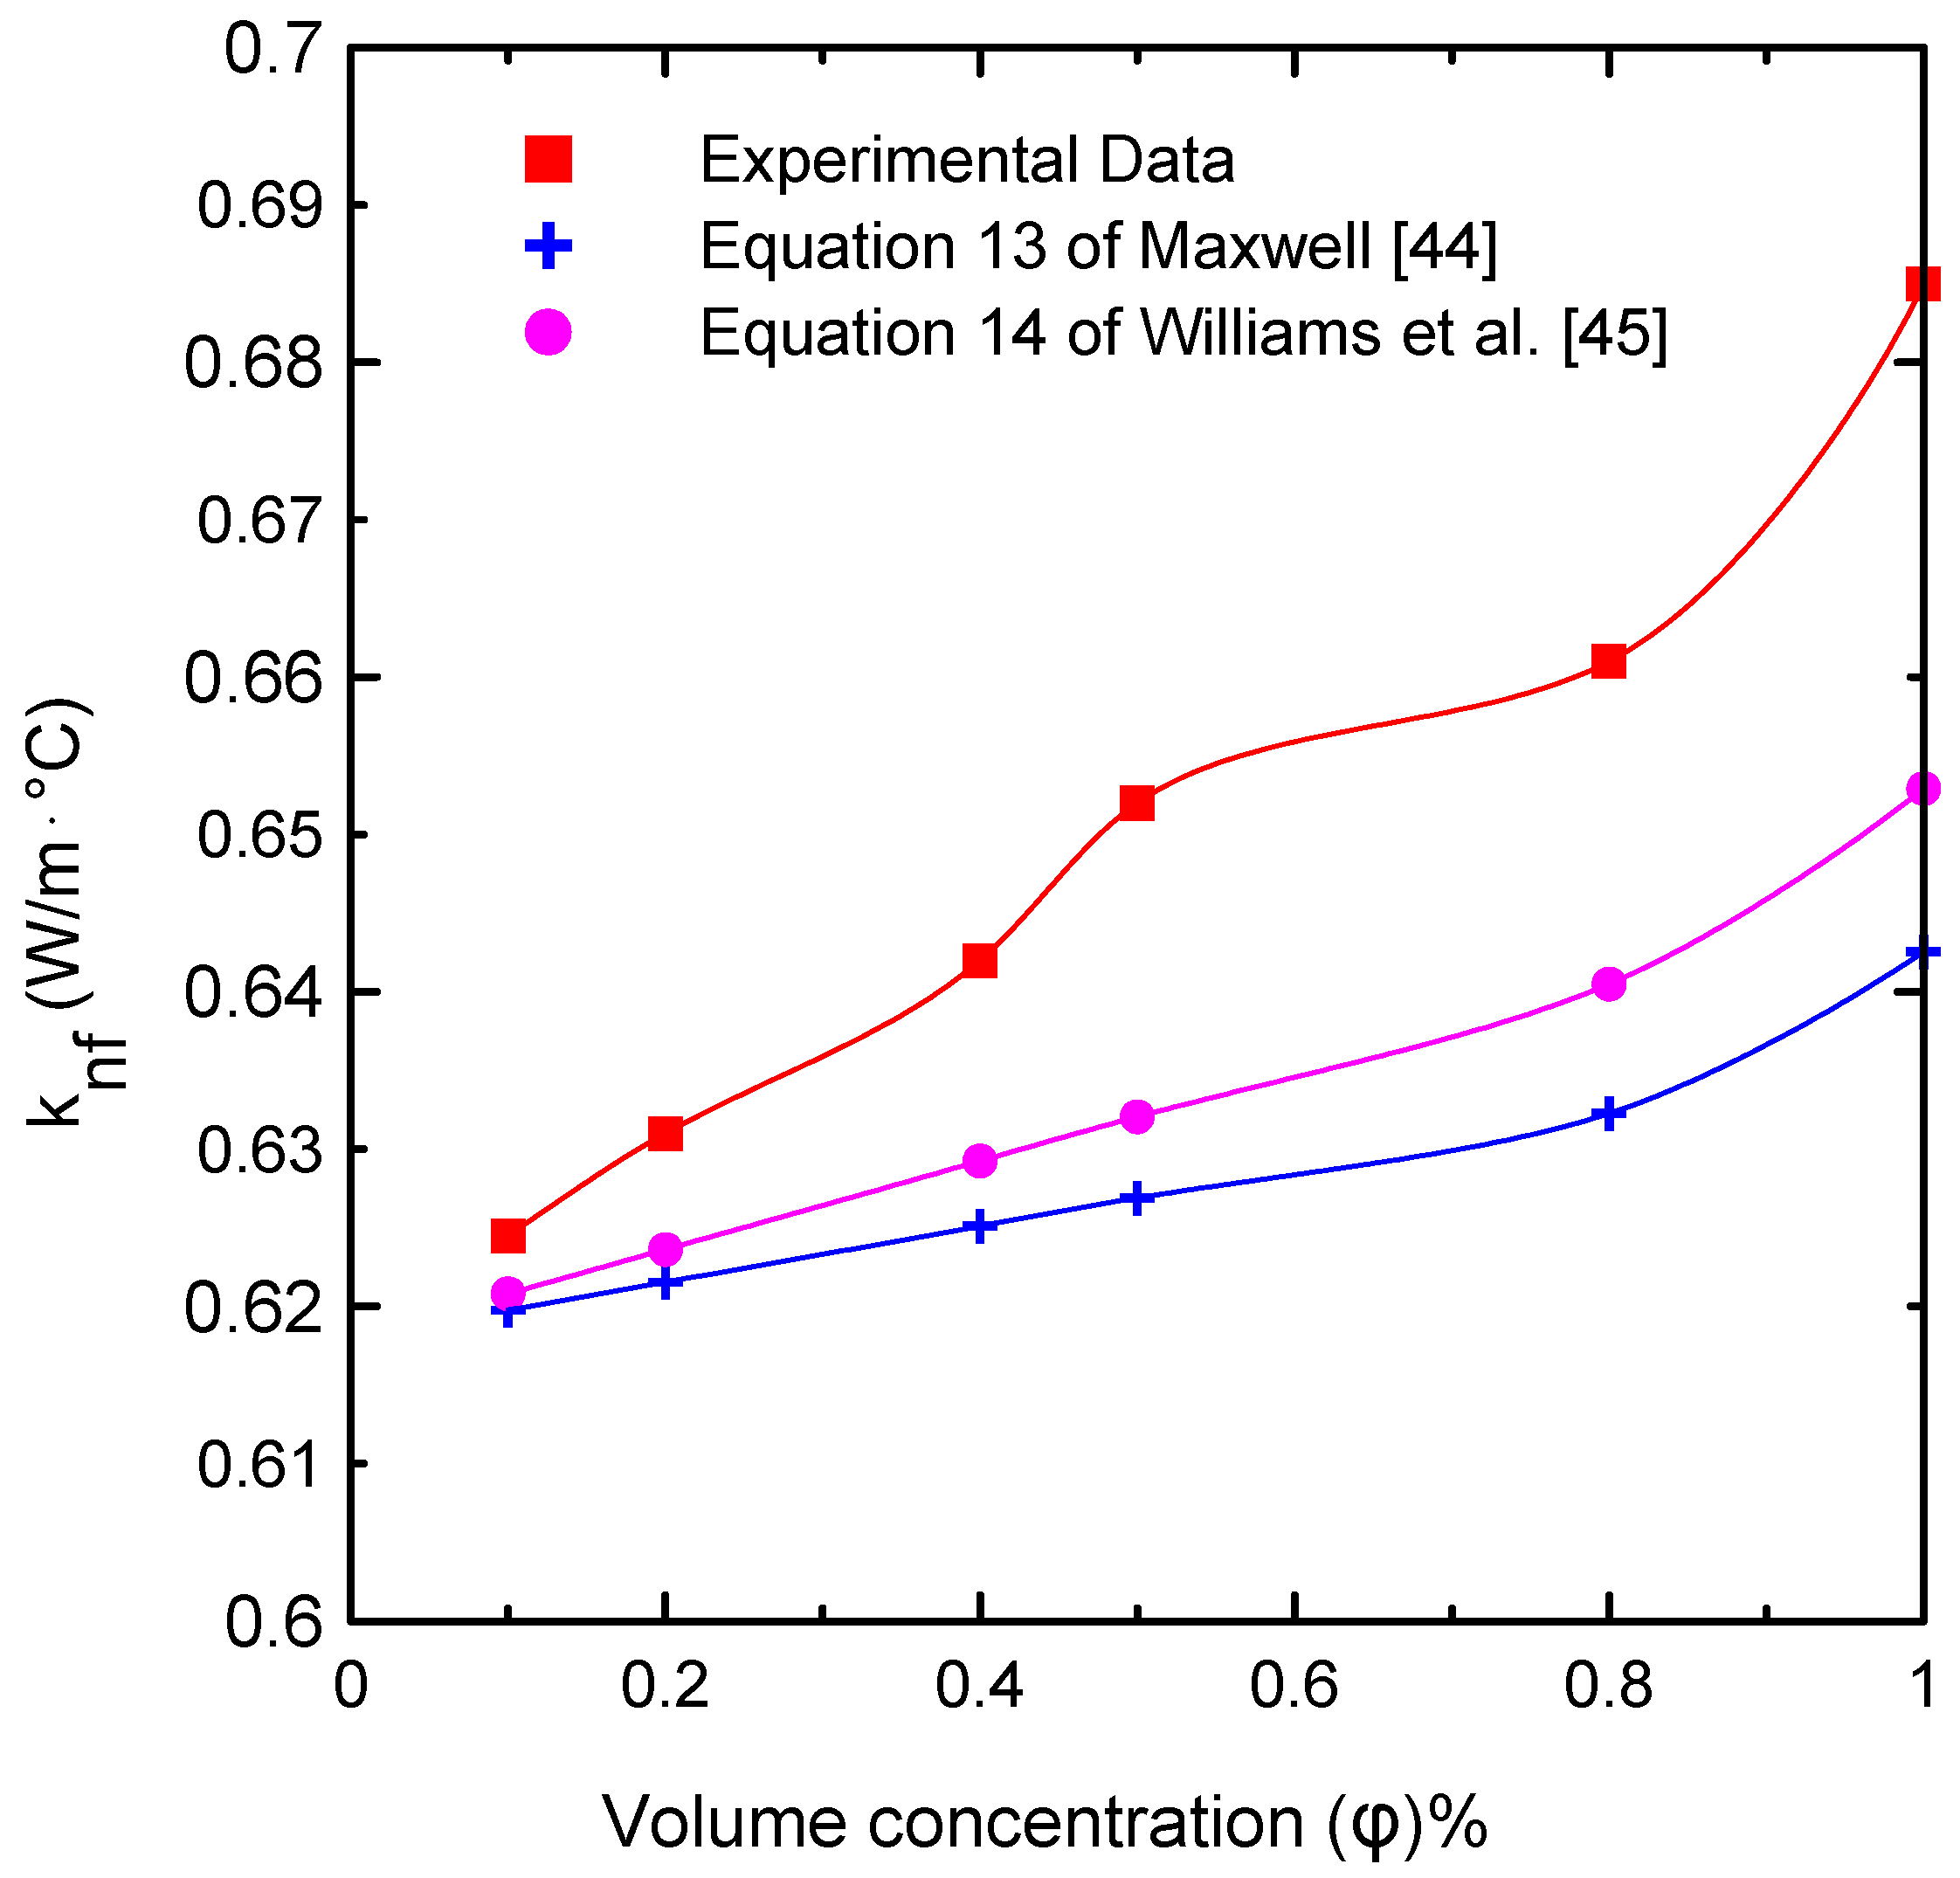
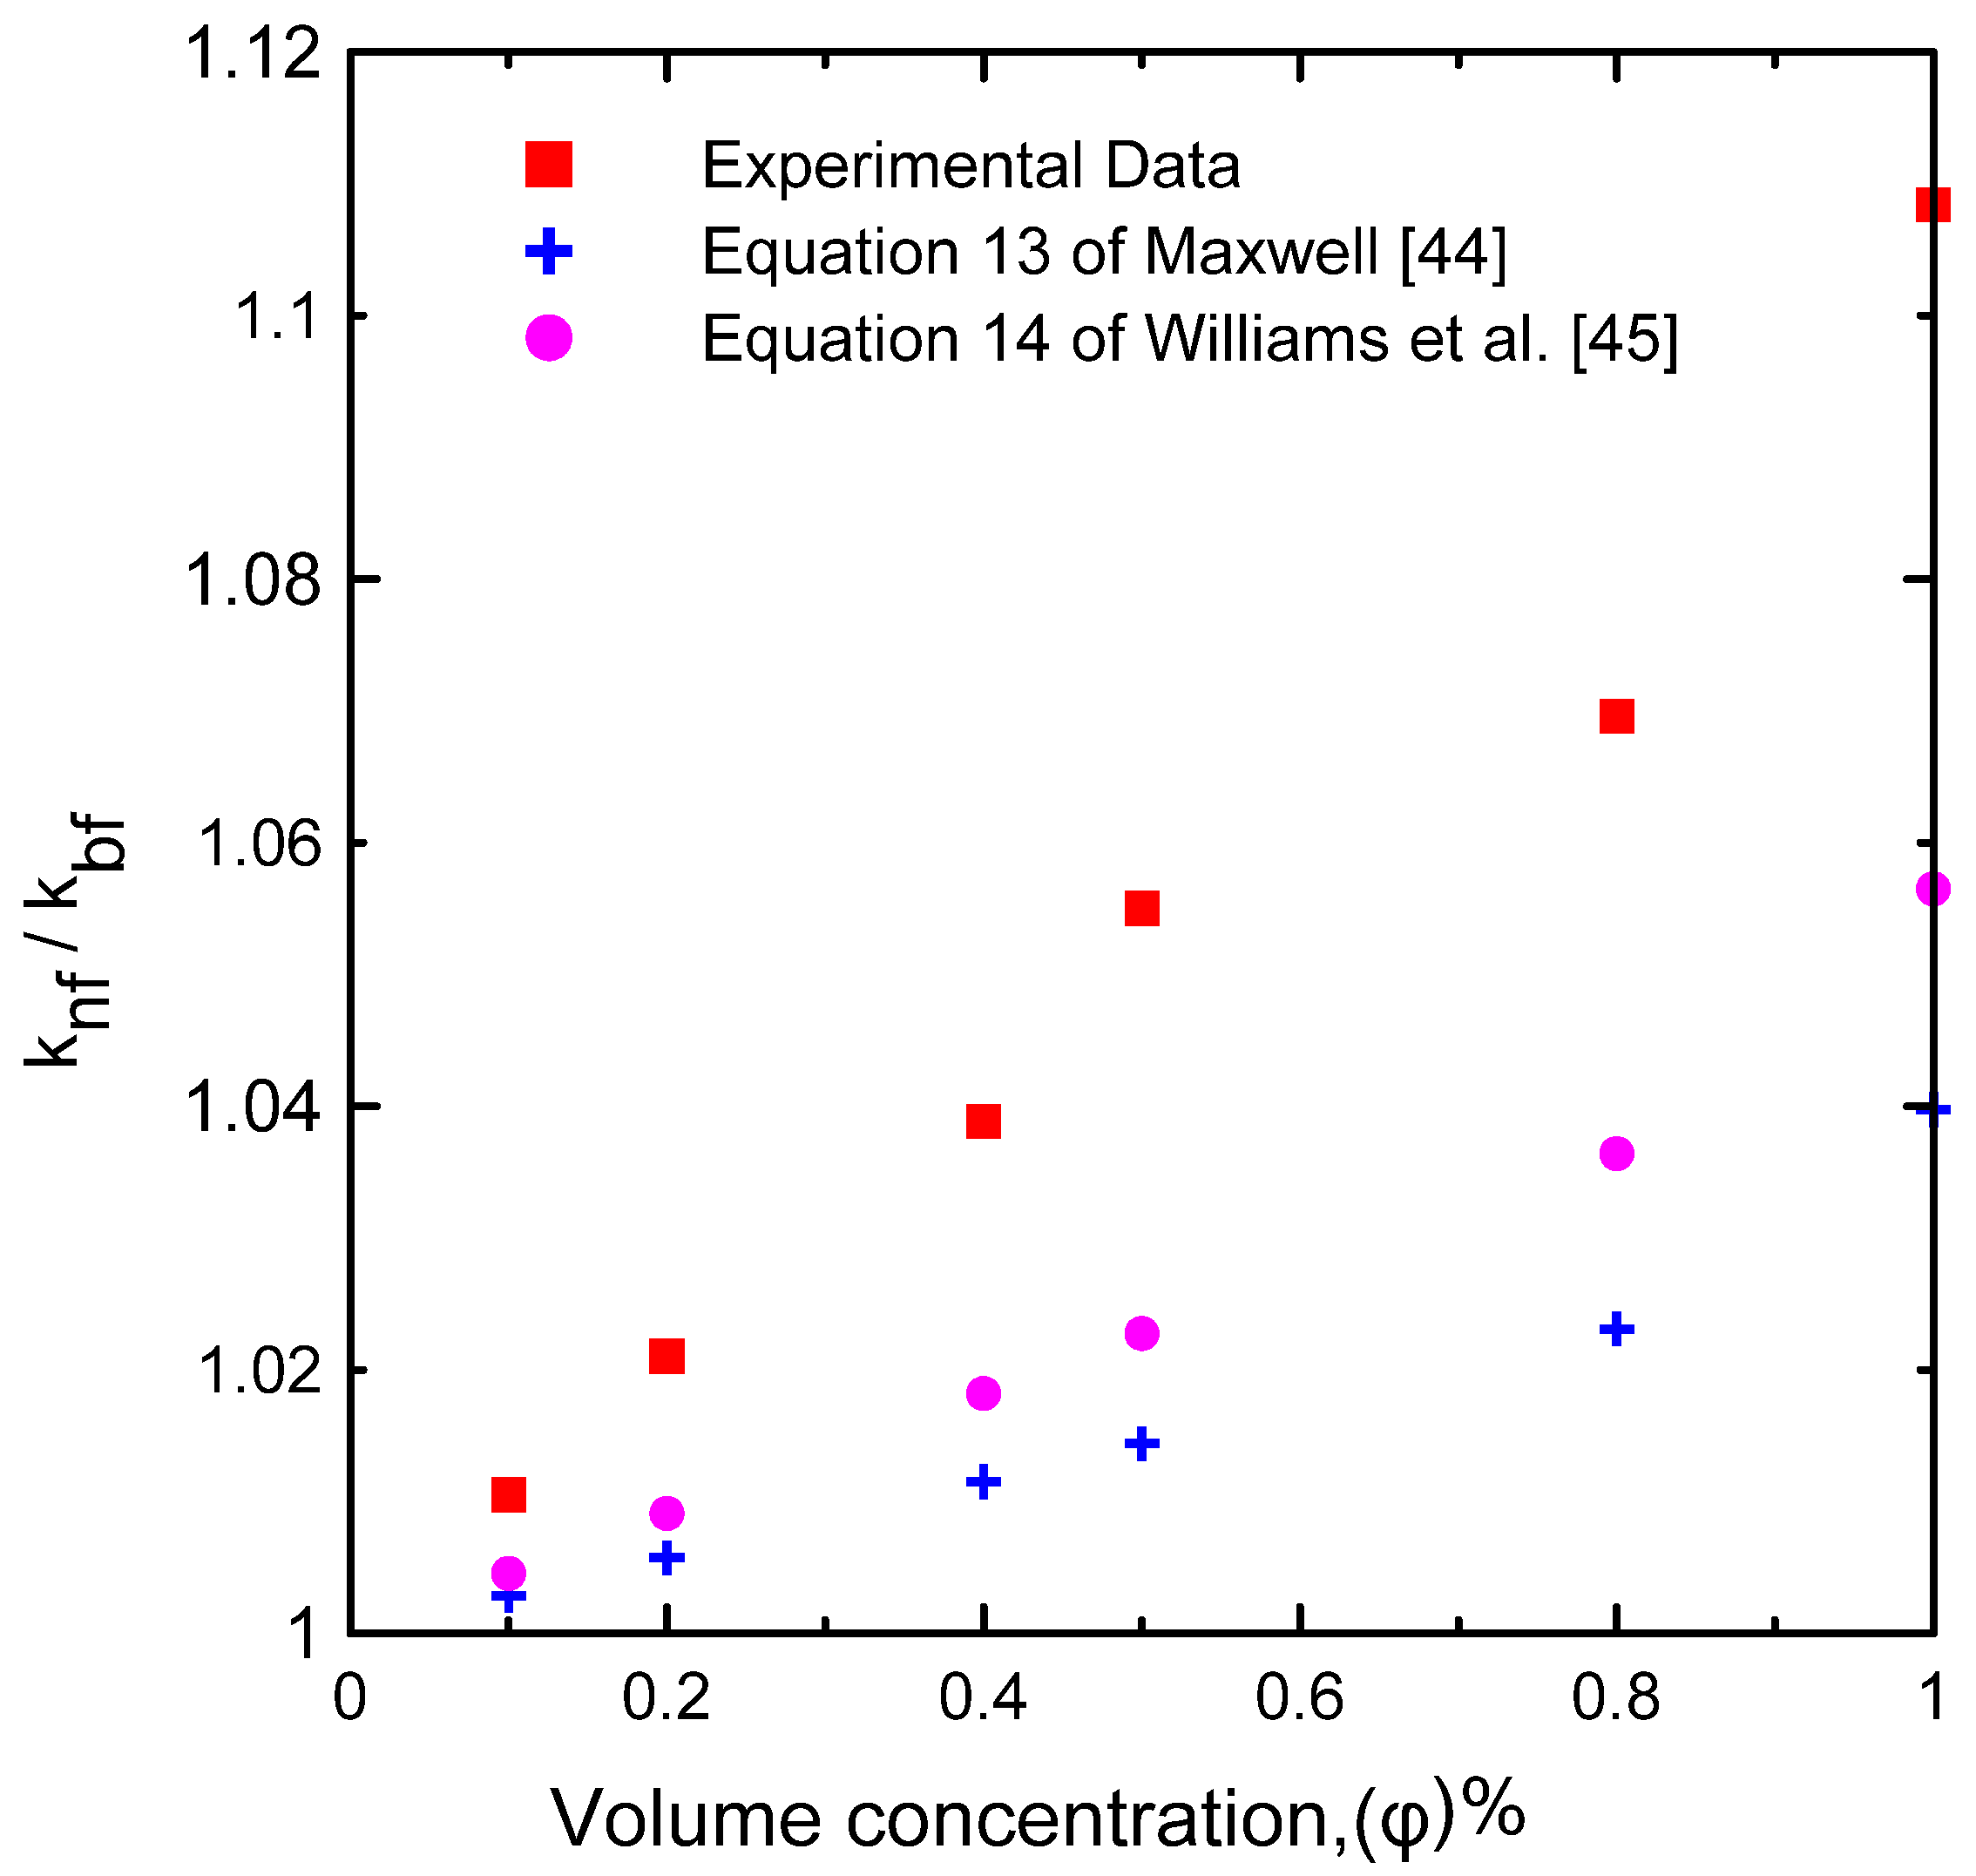
3.1.1. Thermal Conductivity Analysis
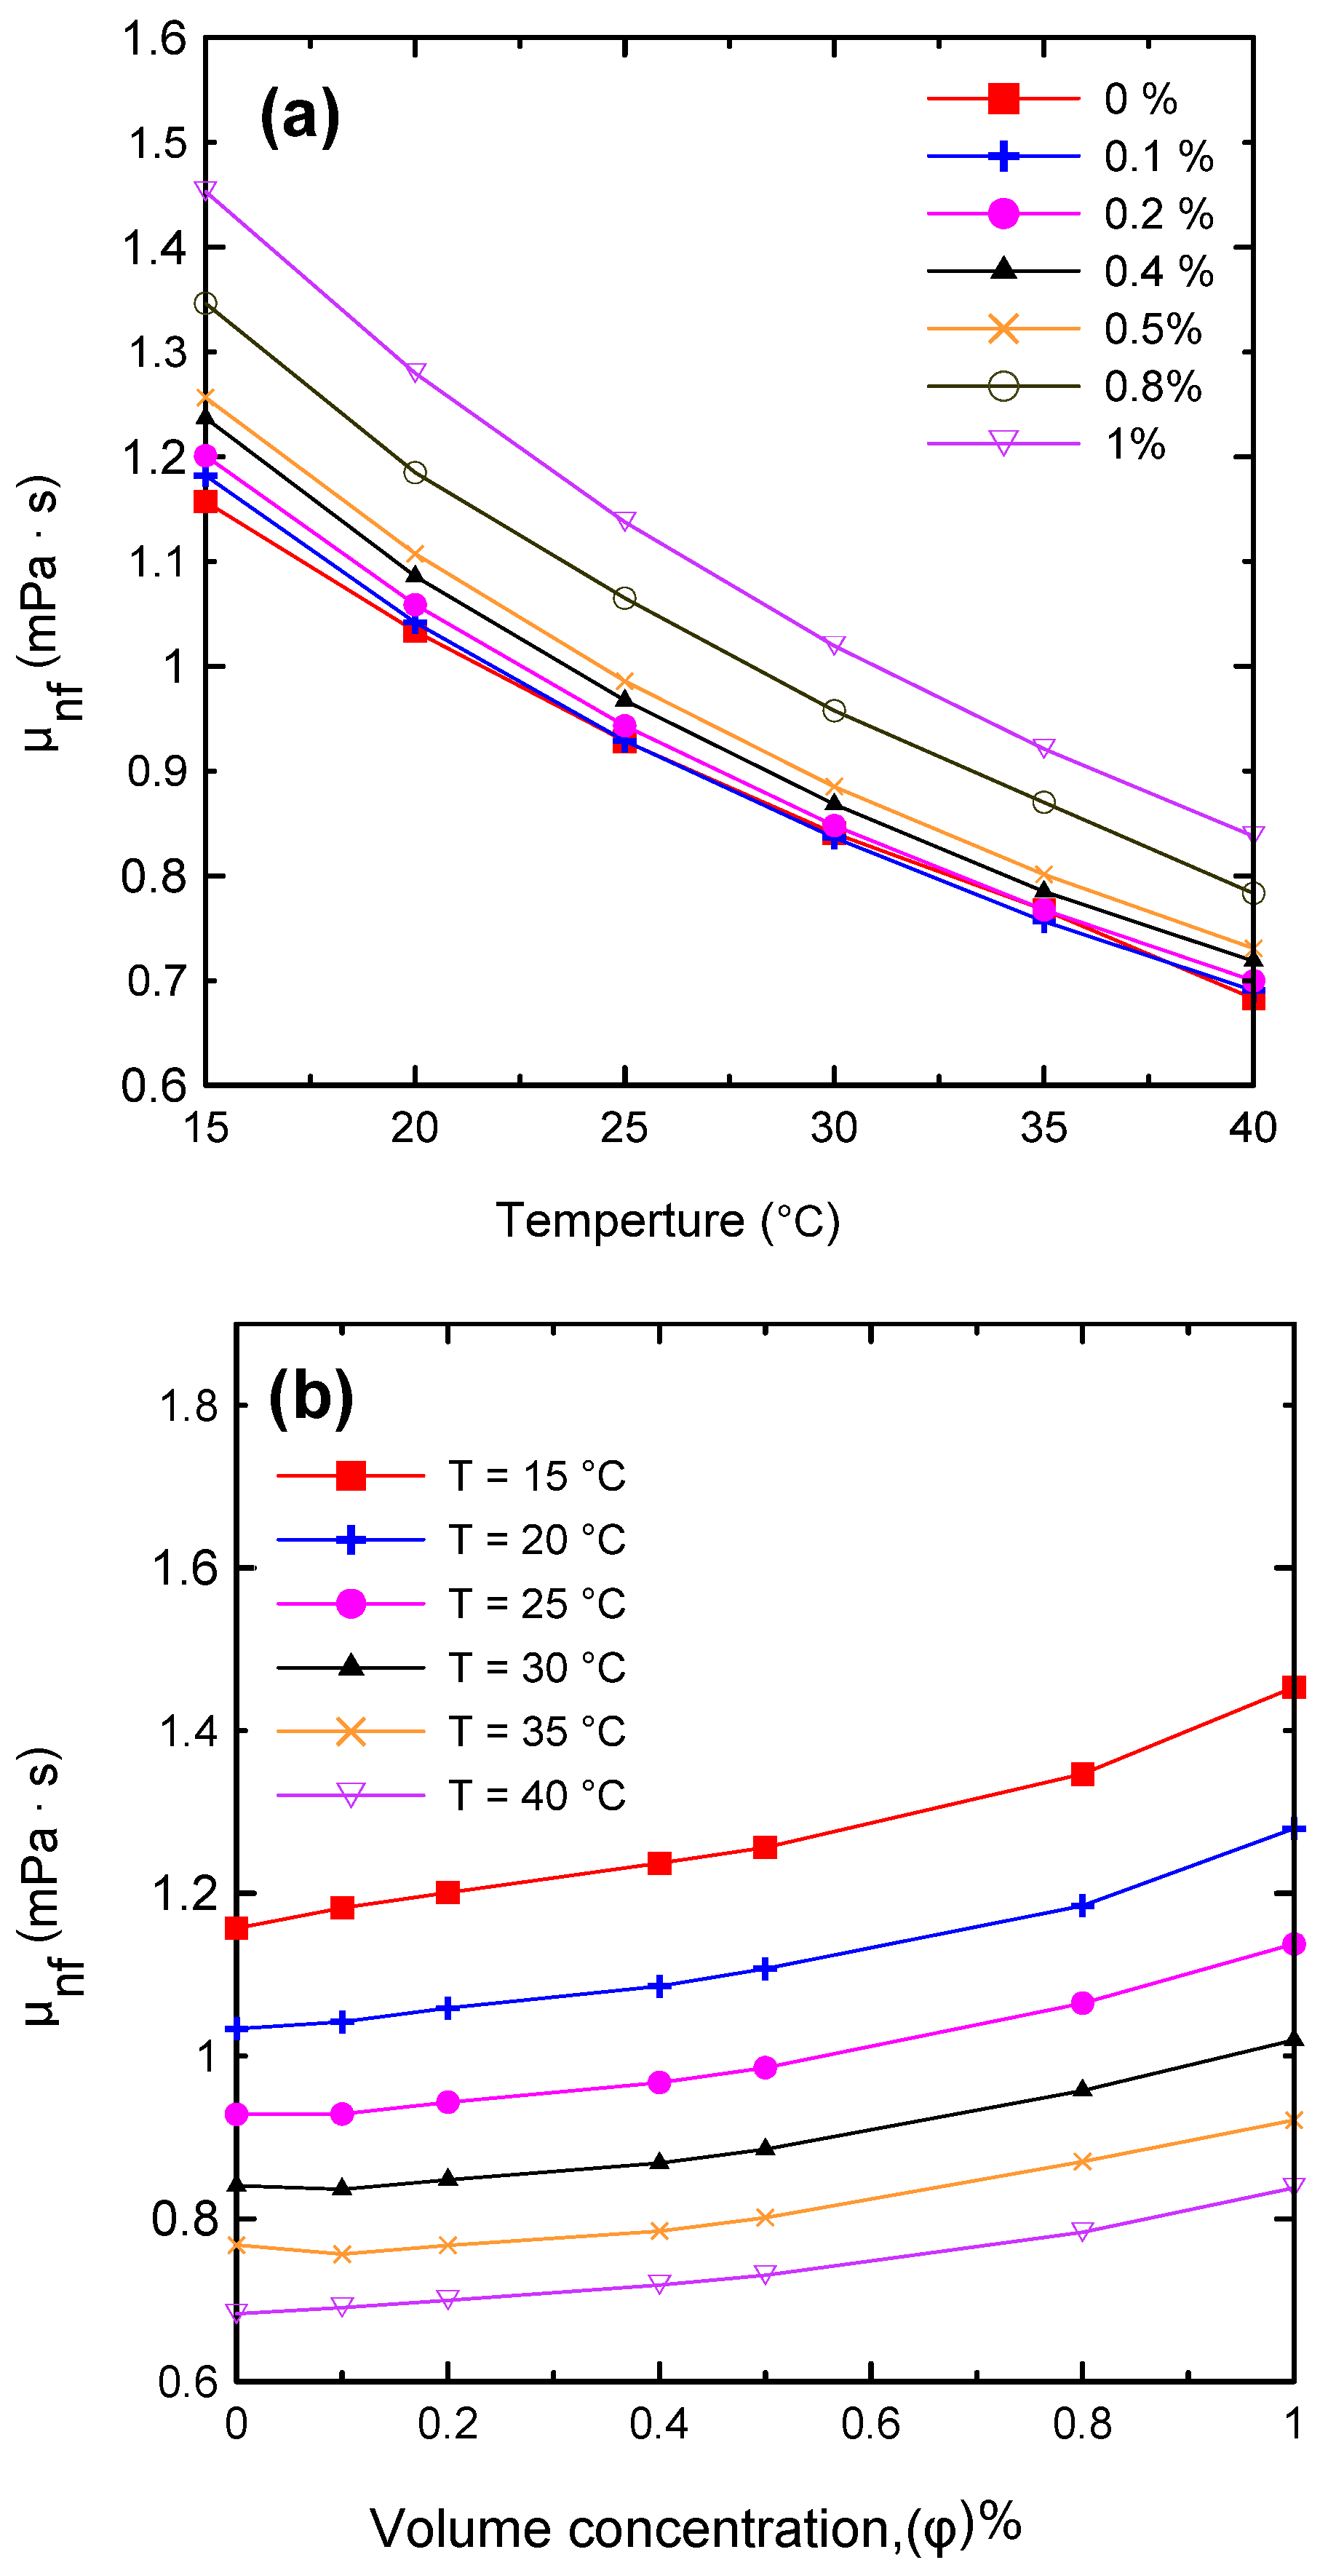
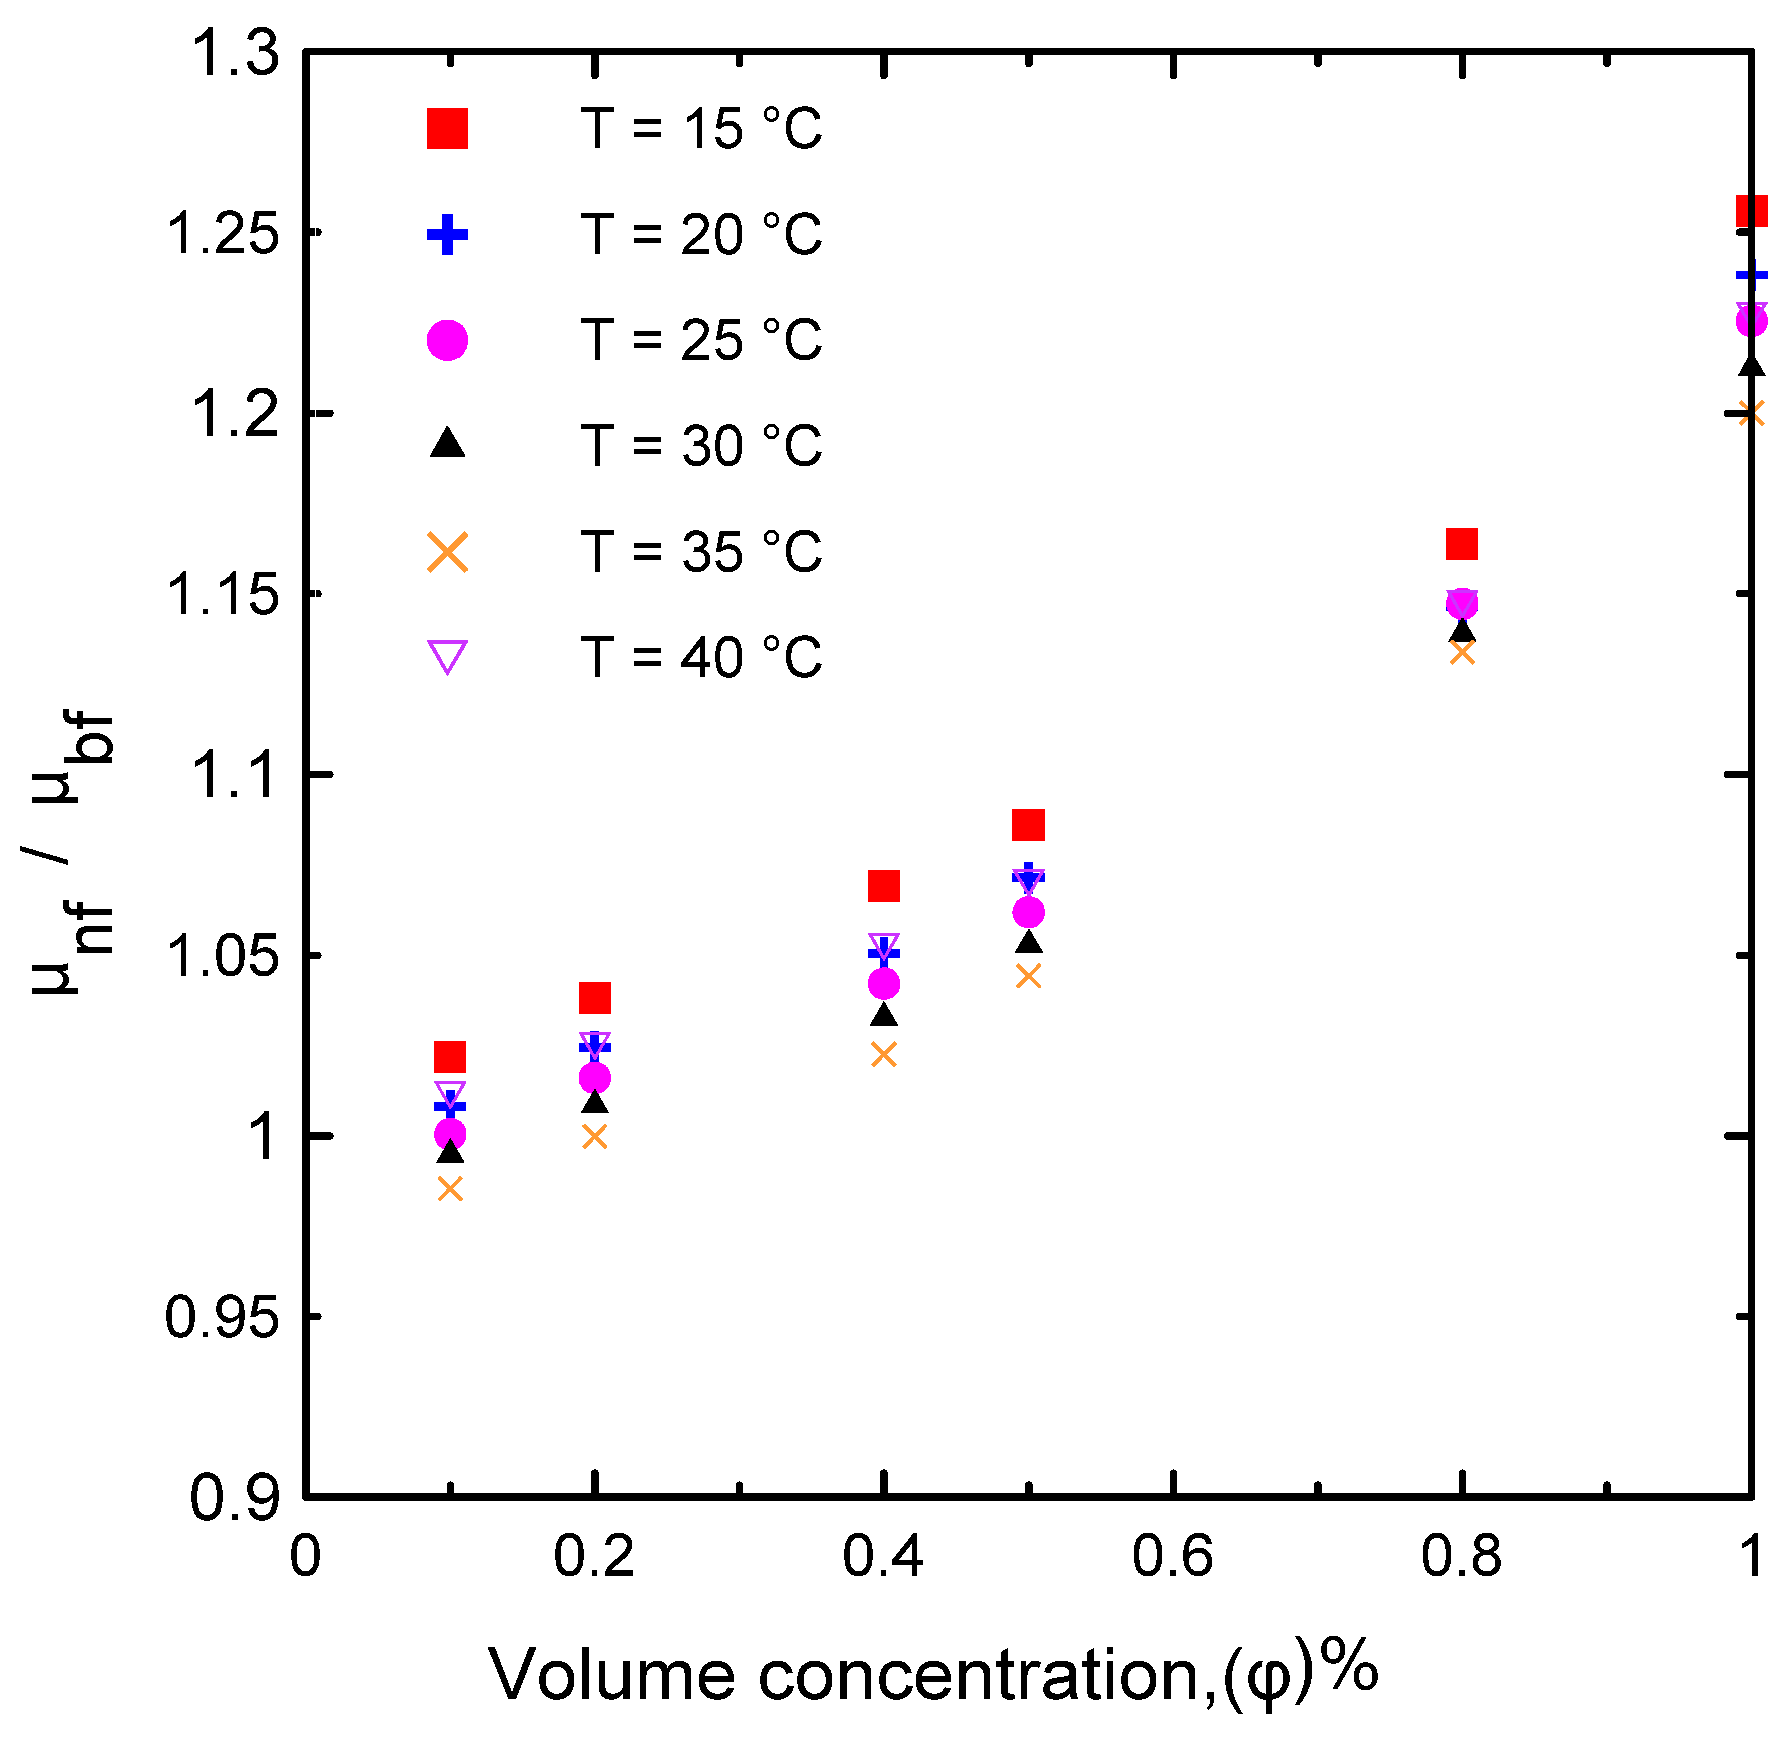
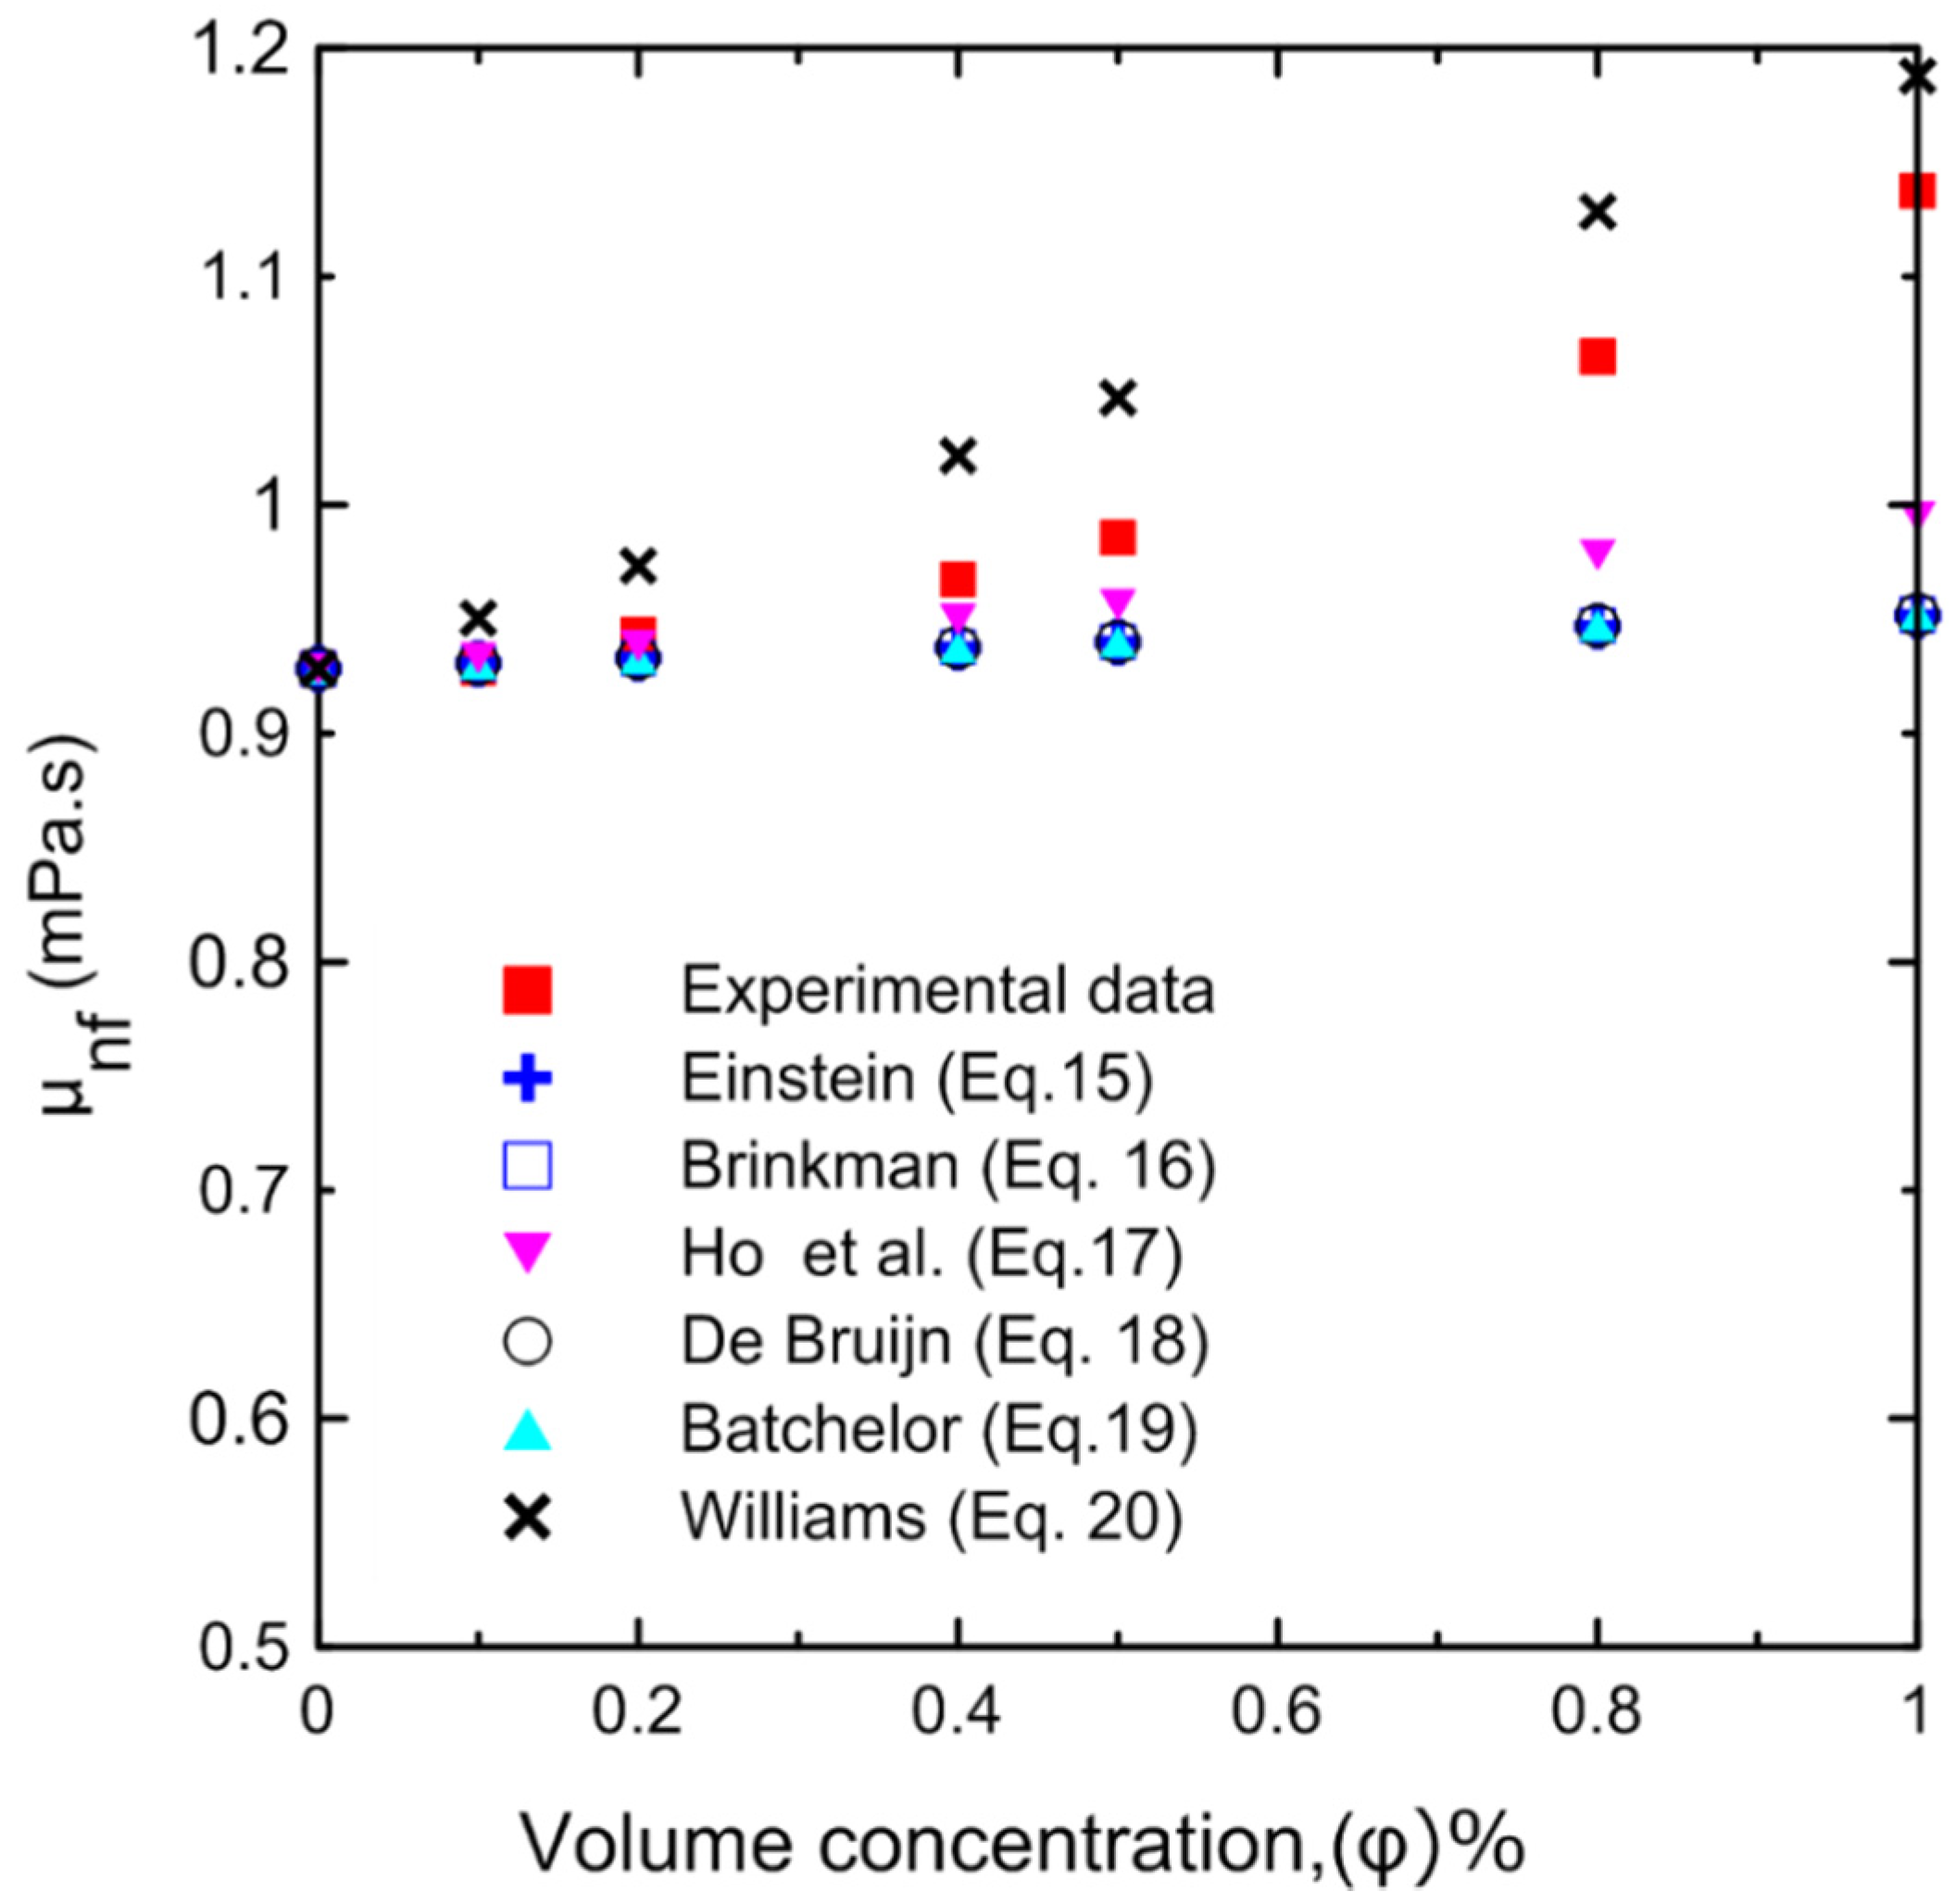
3.1.2. Dynamic Viscosity
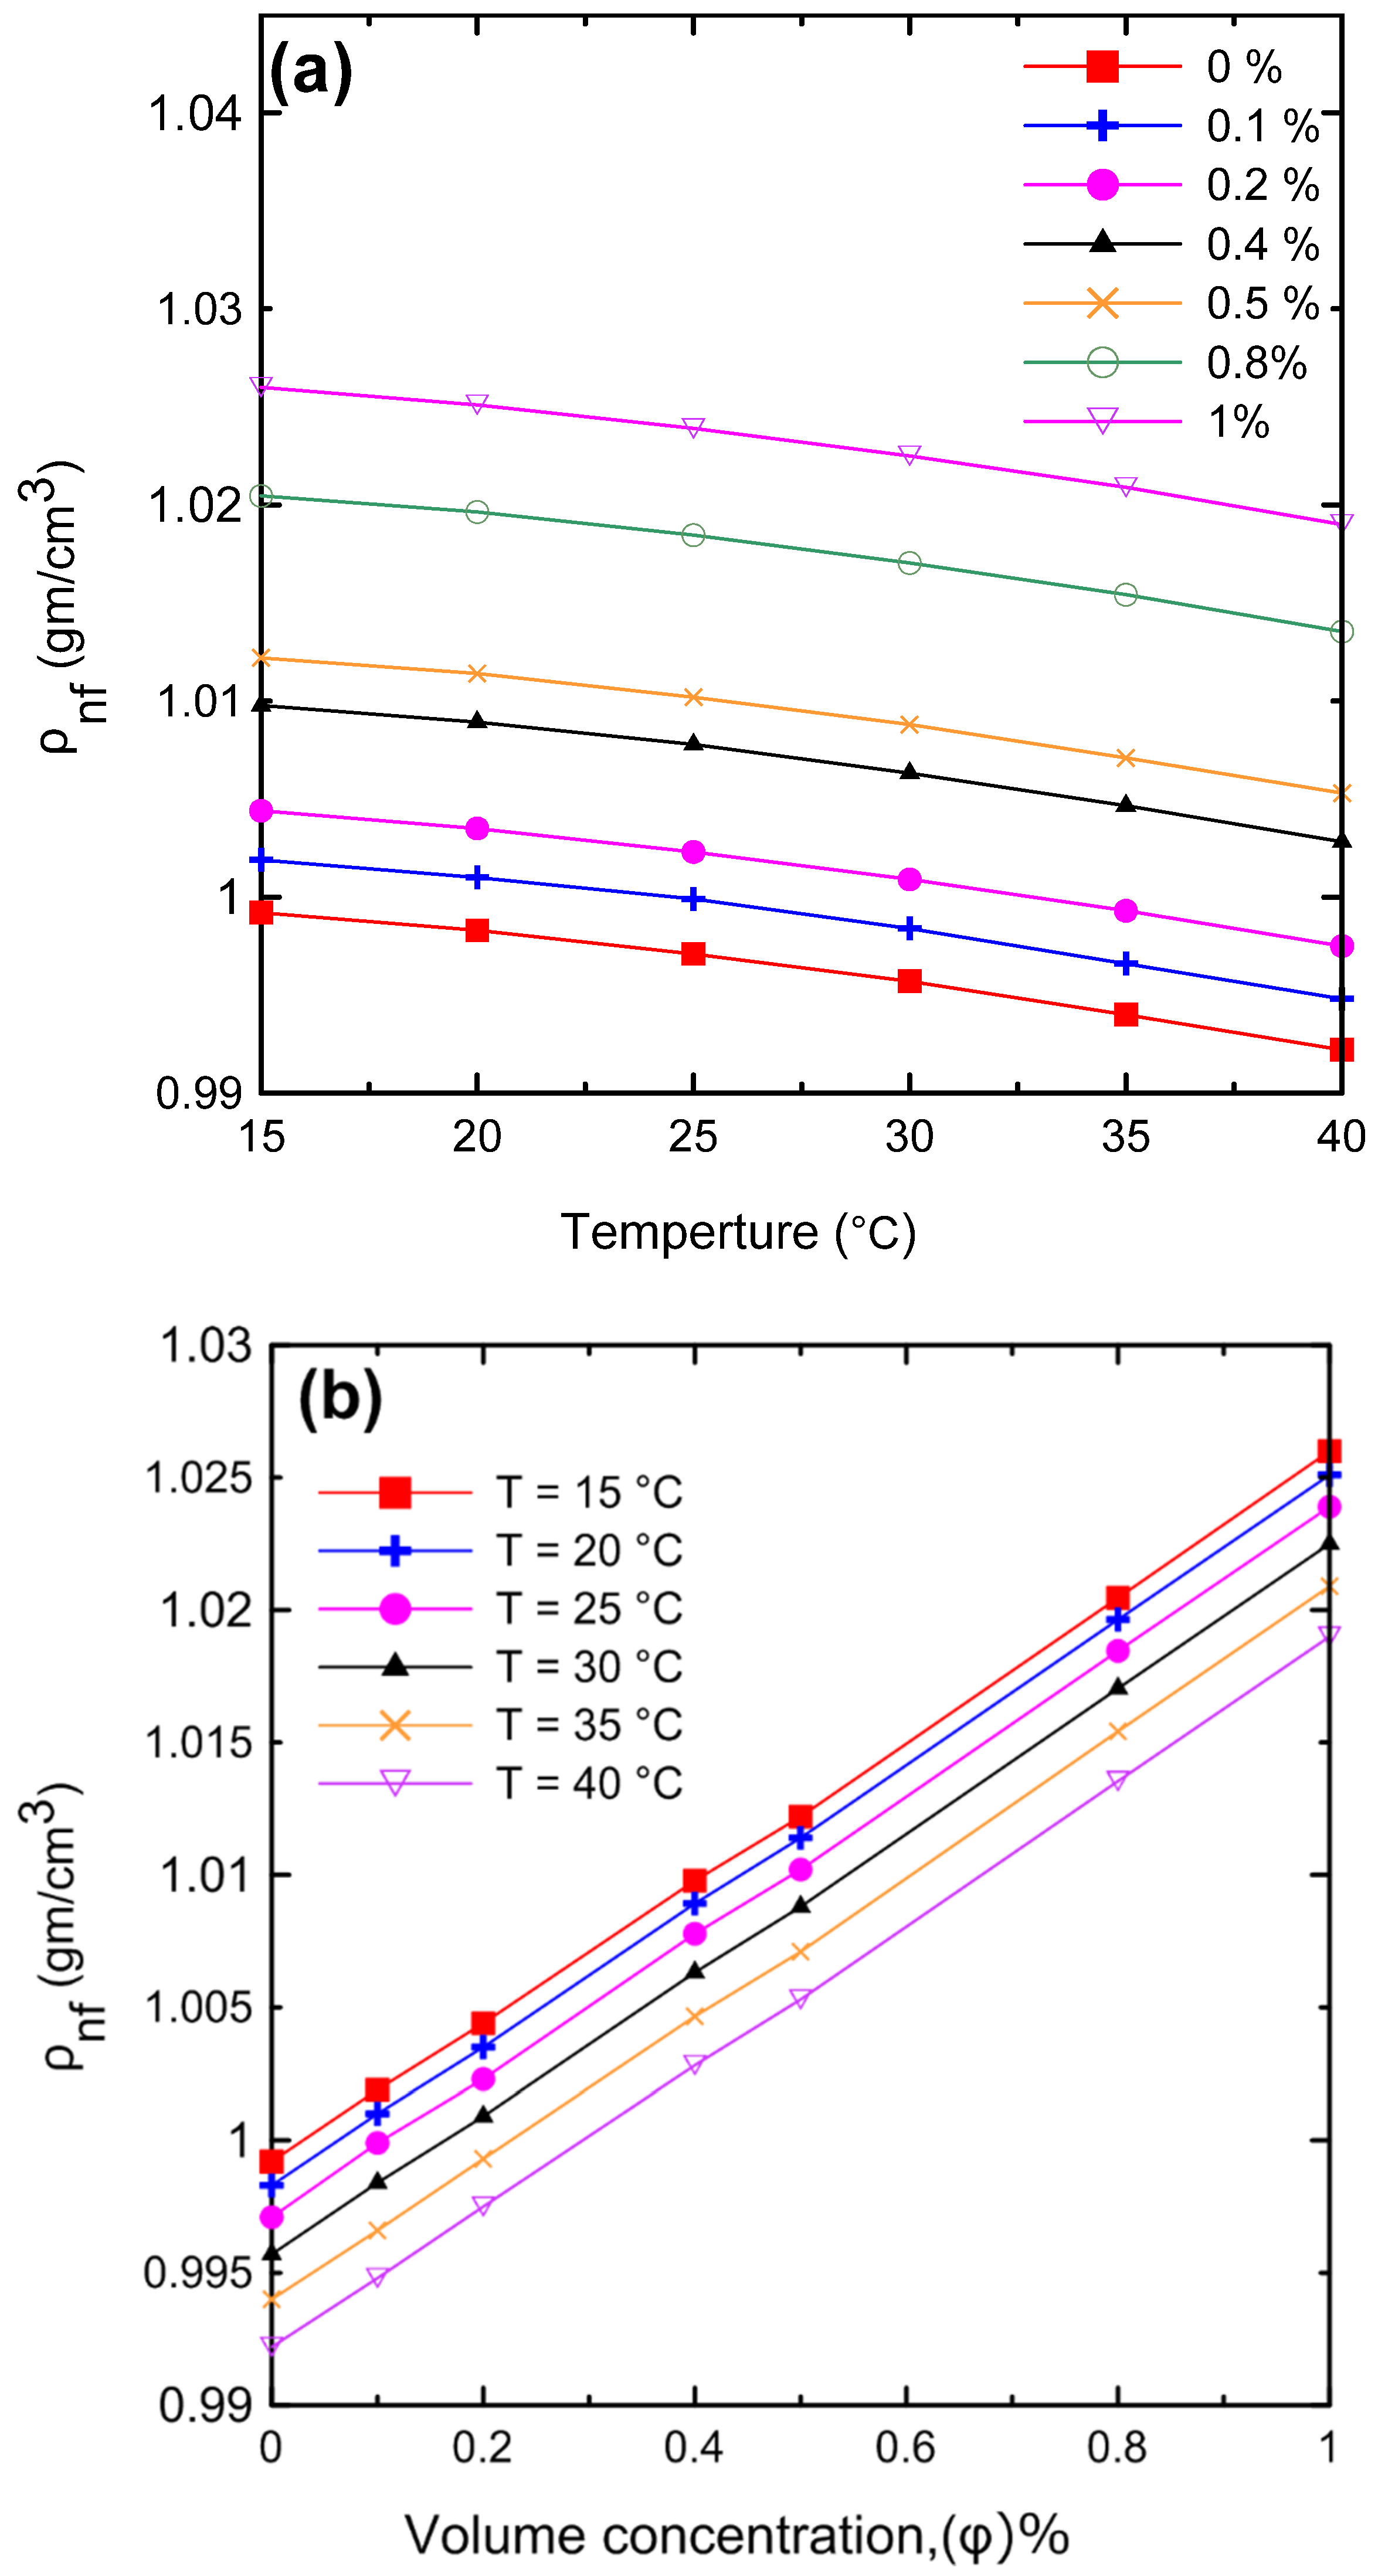
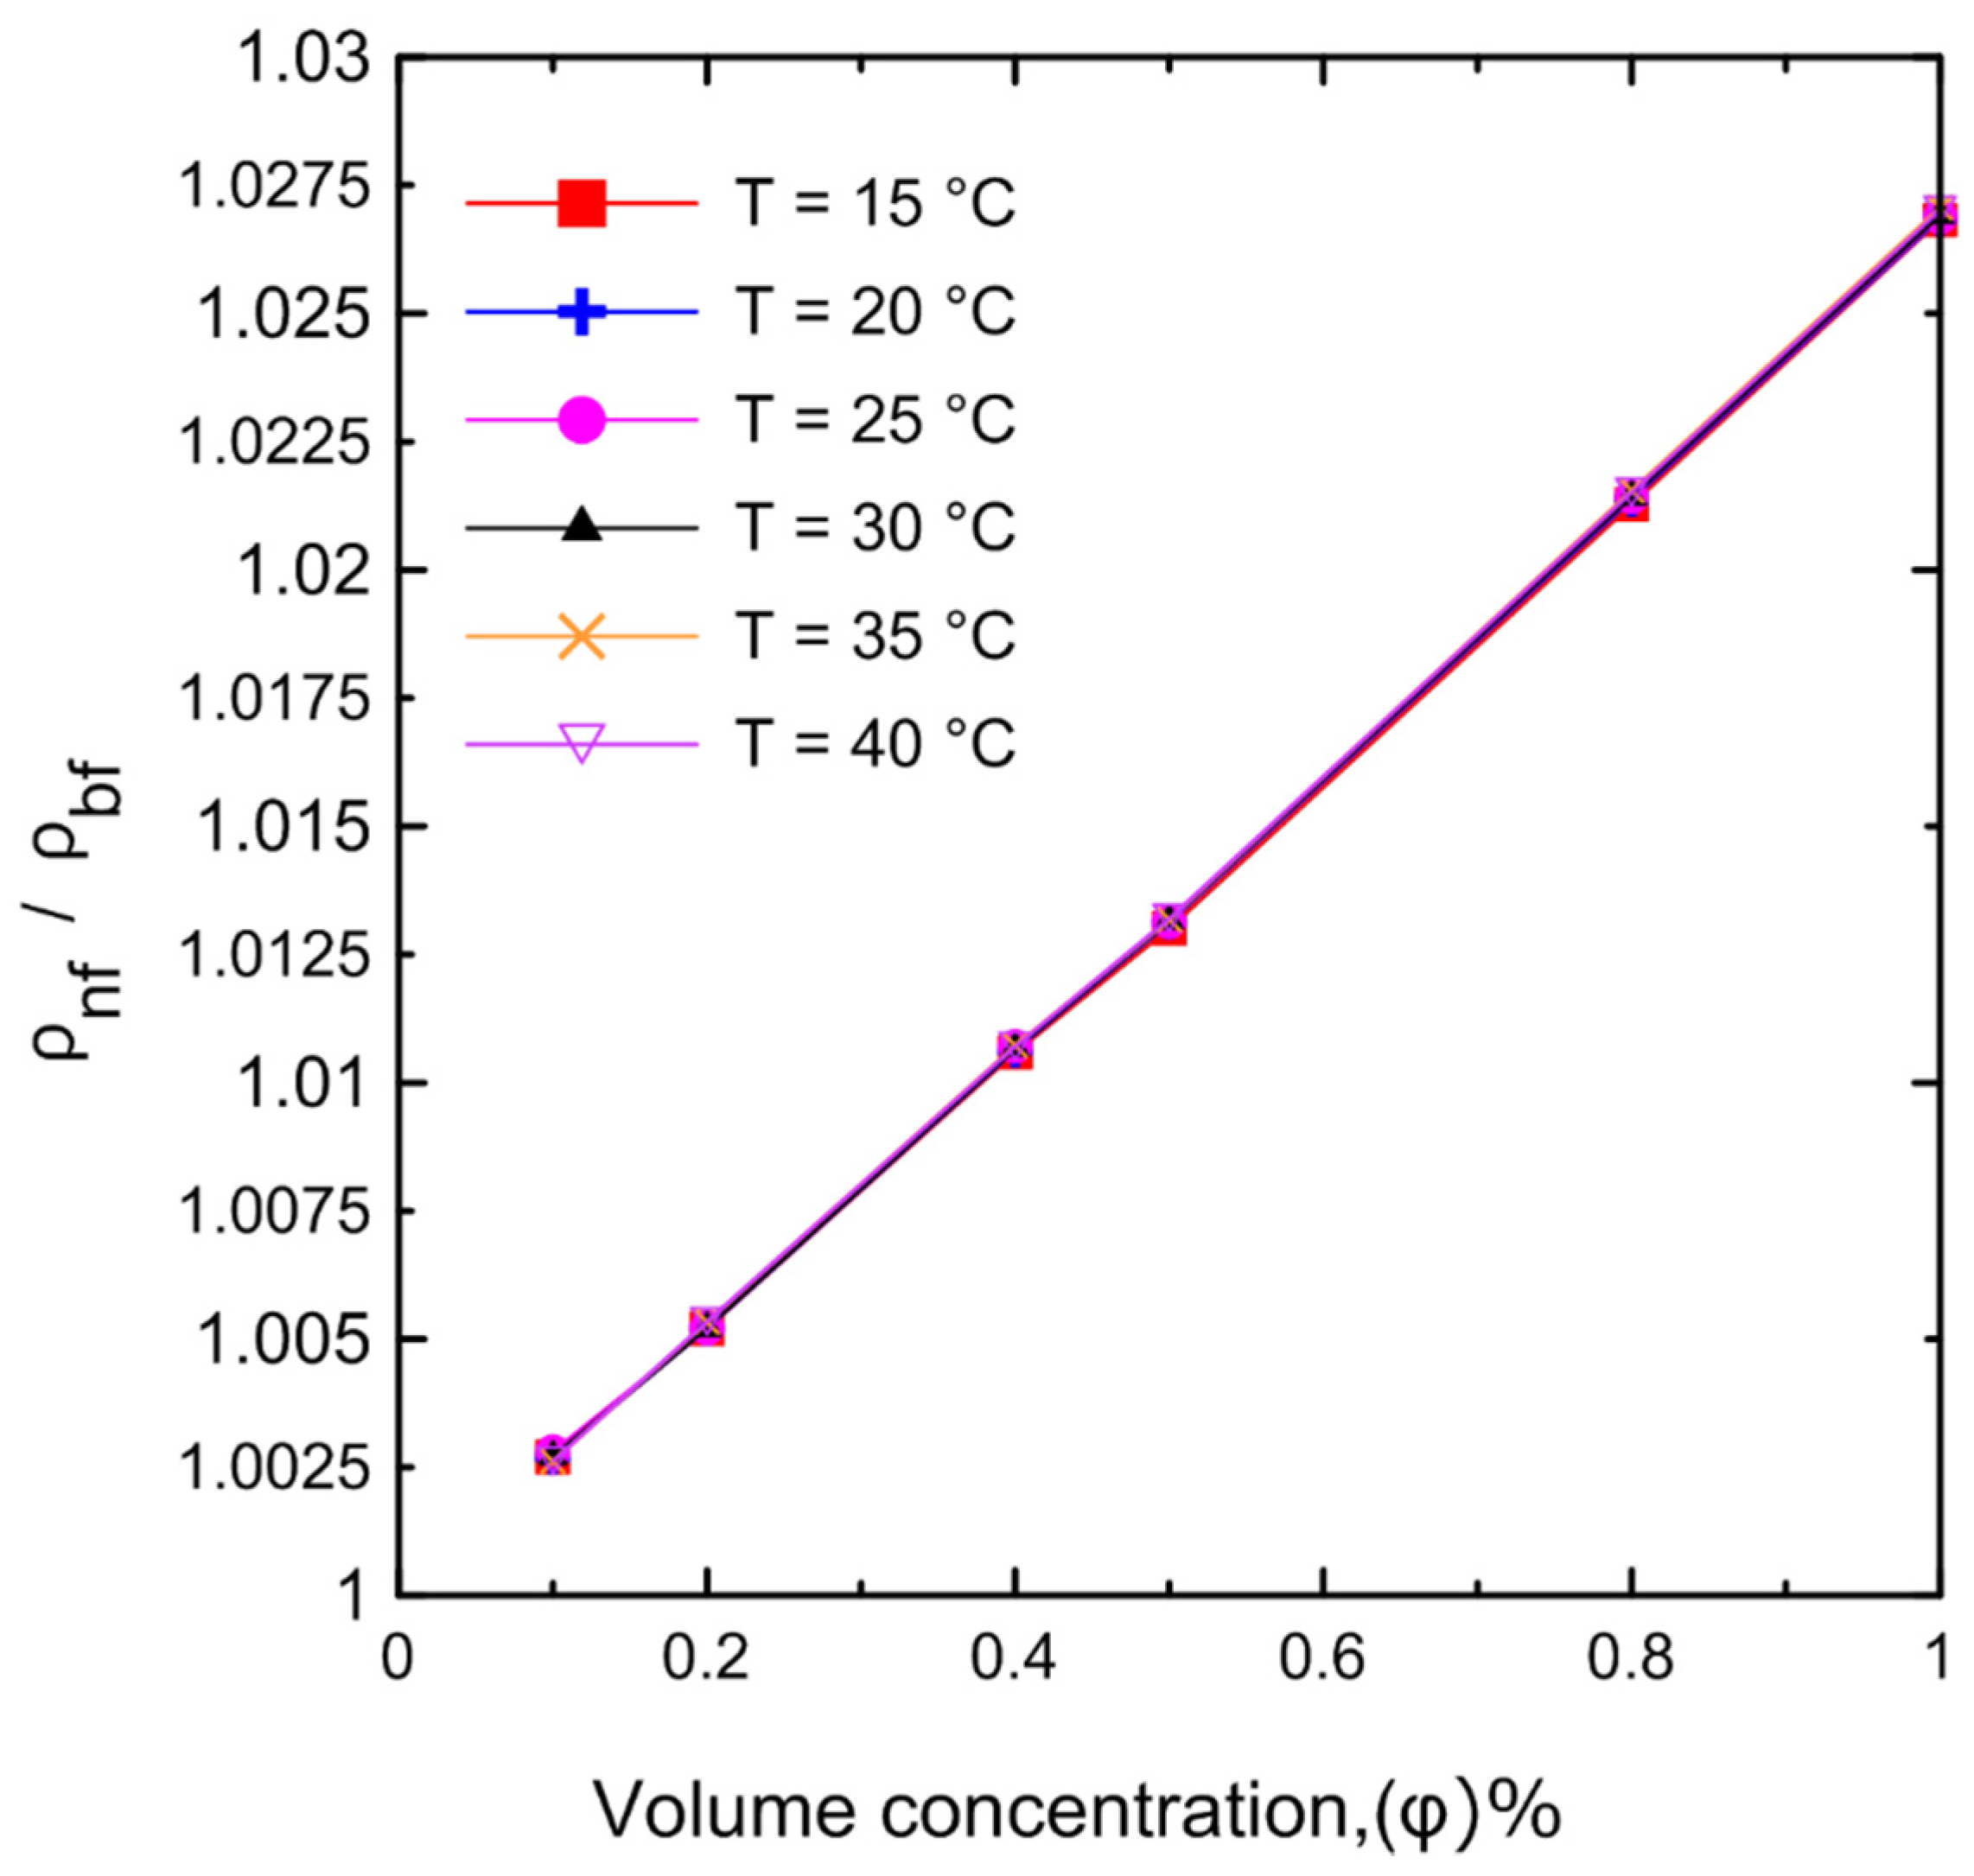
3.1.3. Density
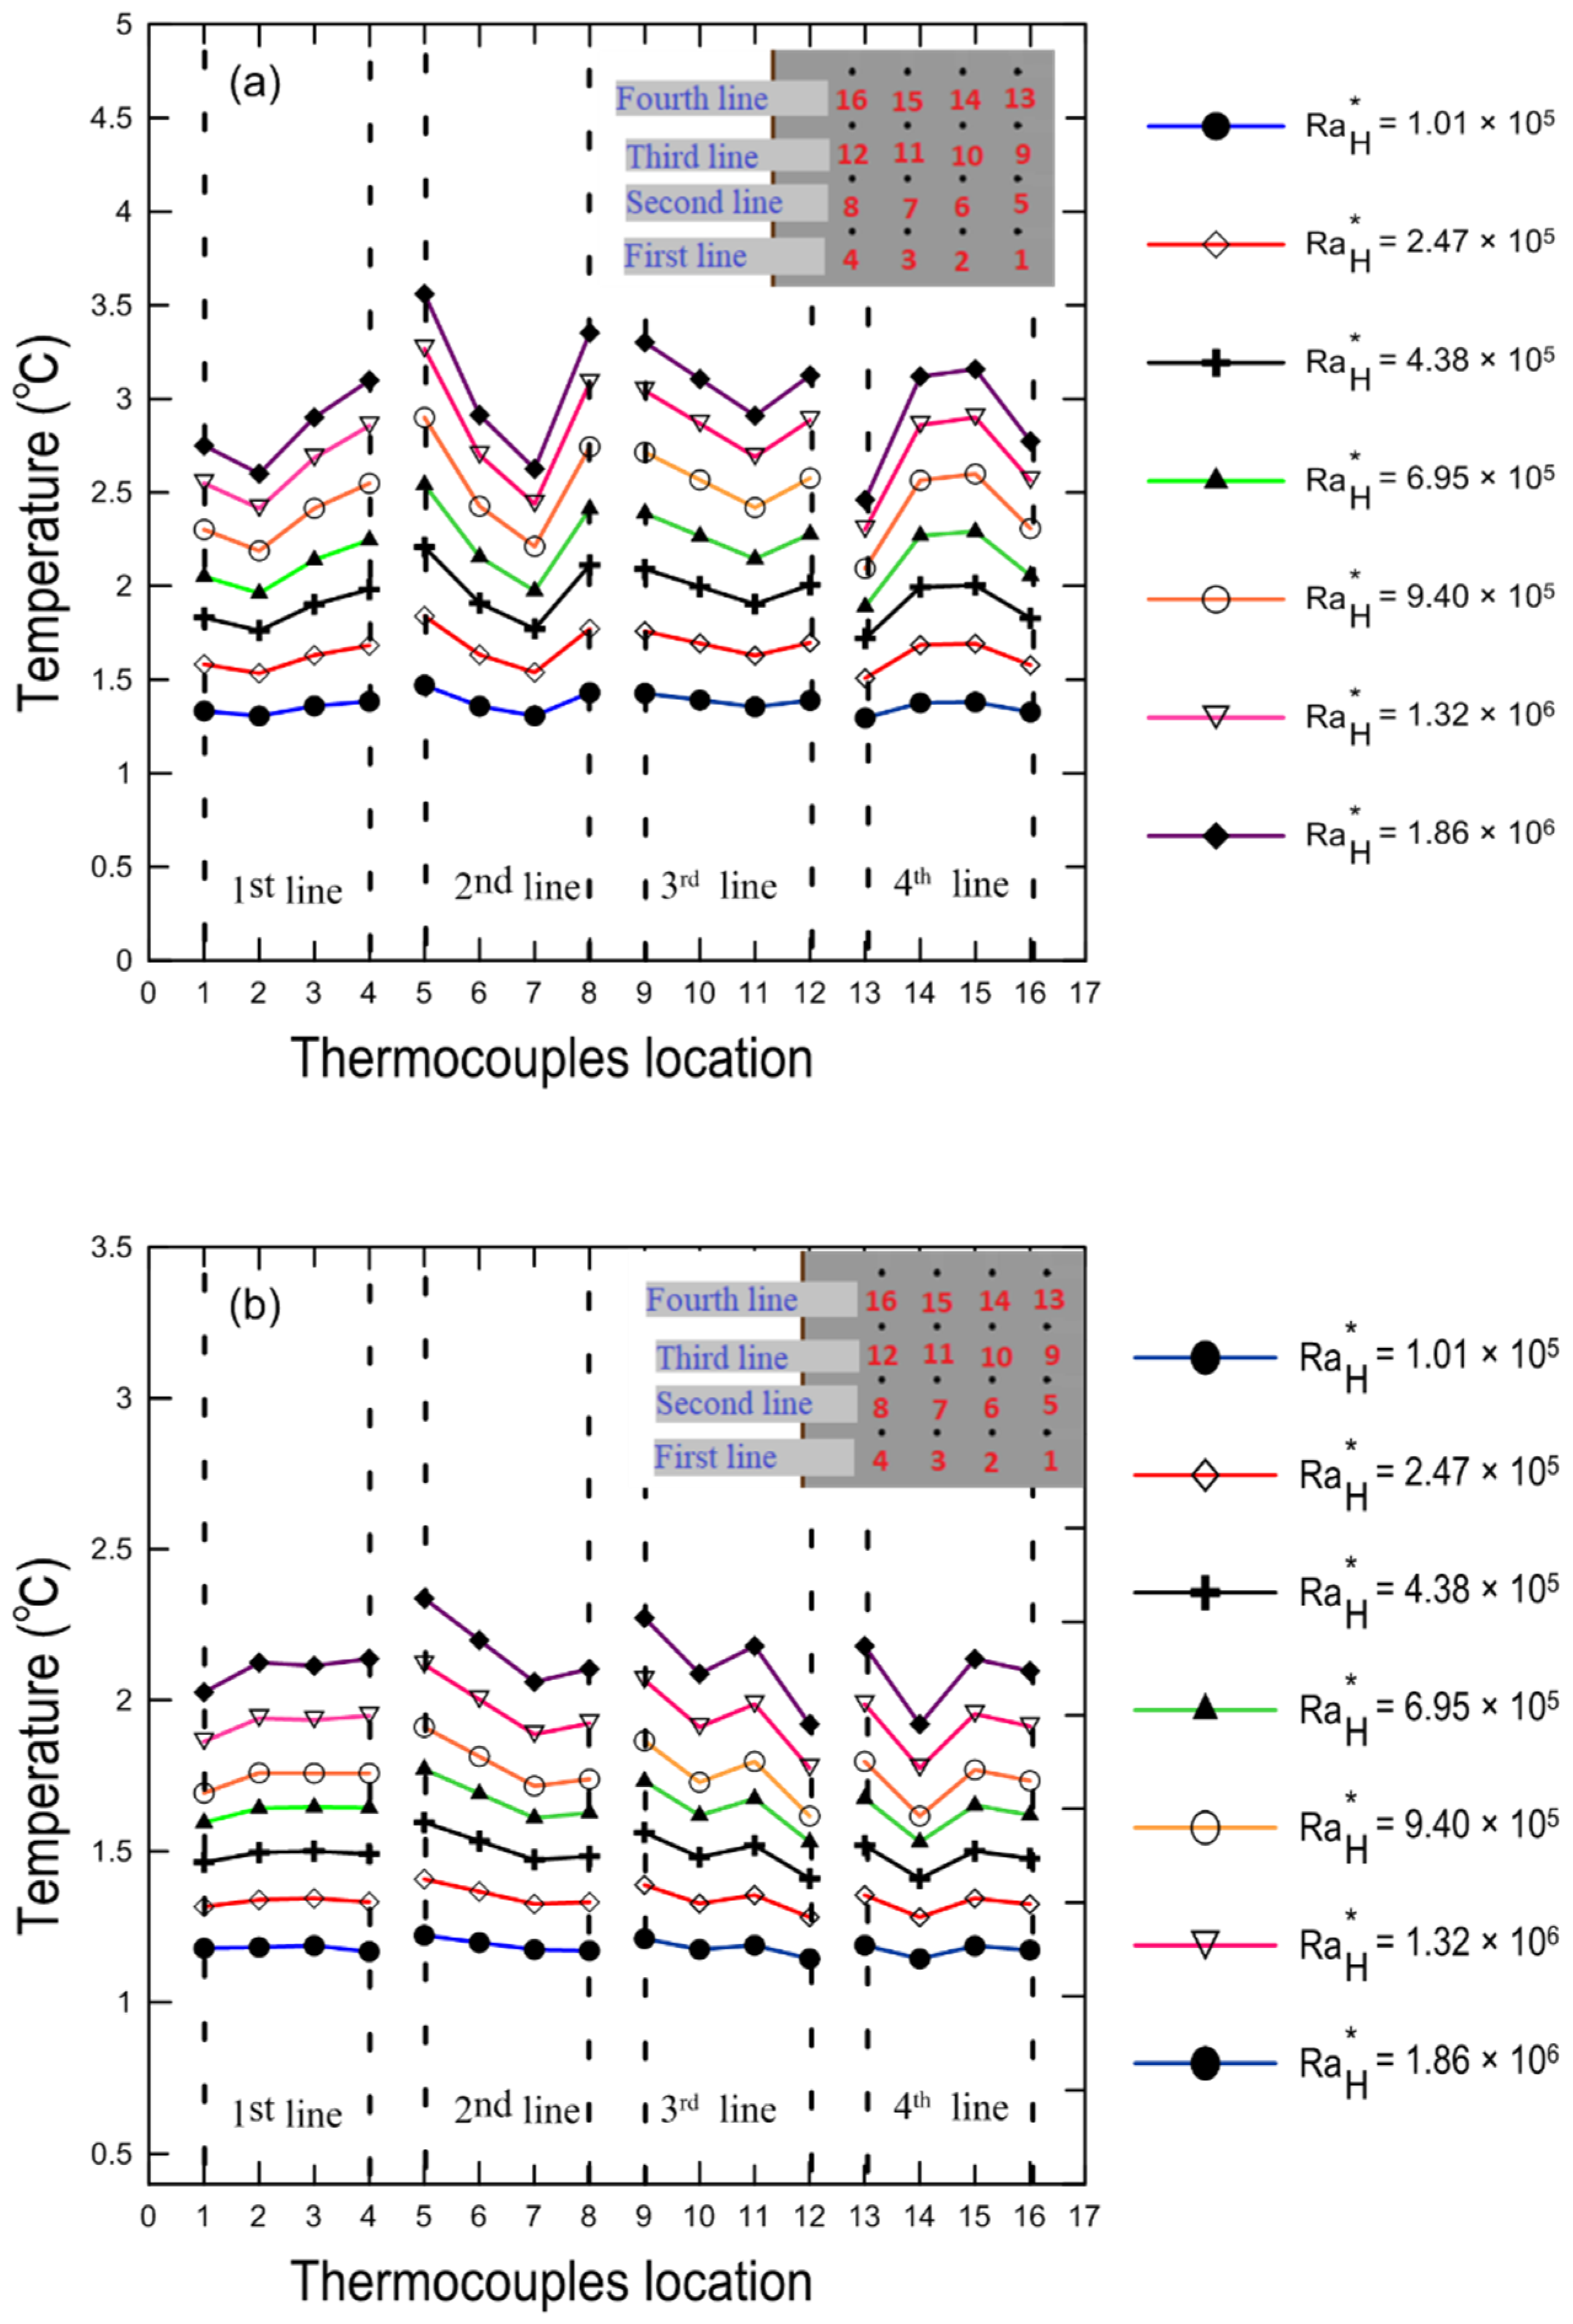
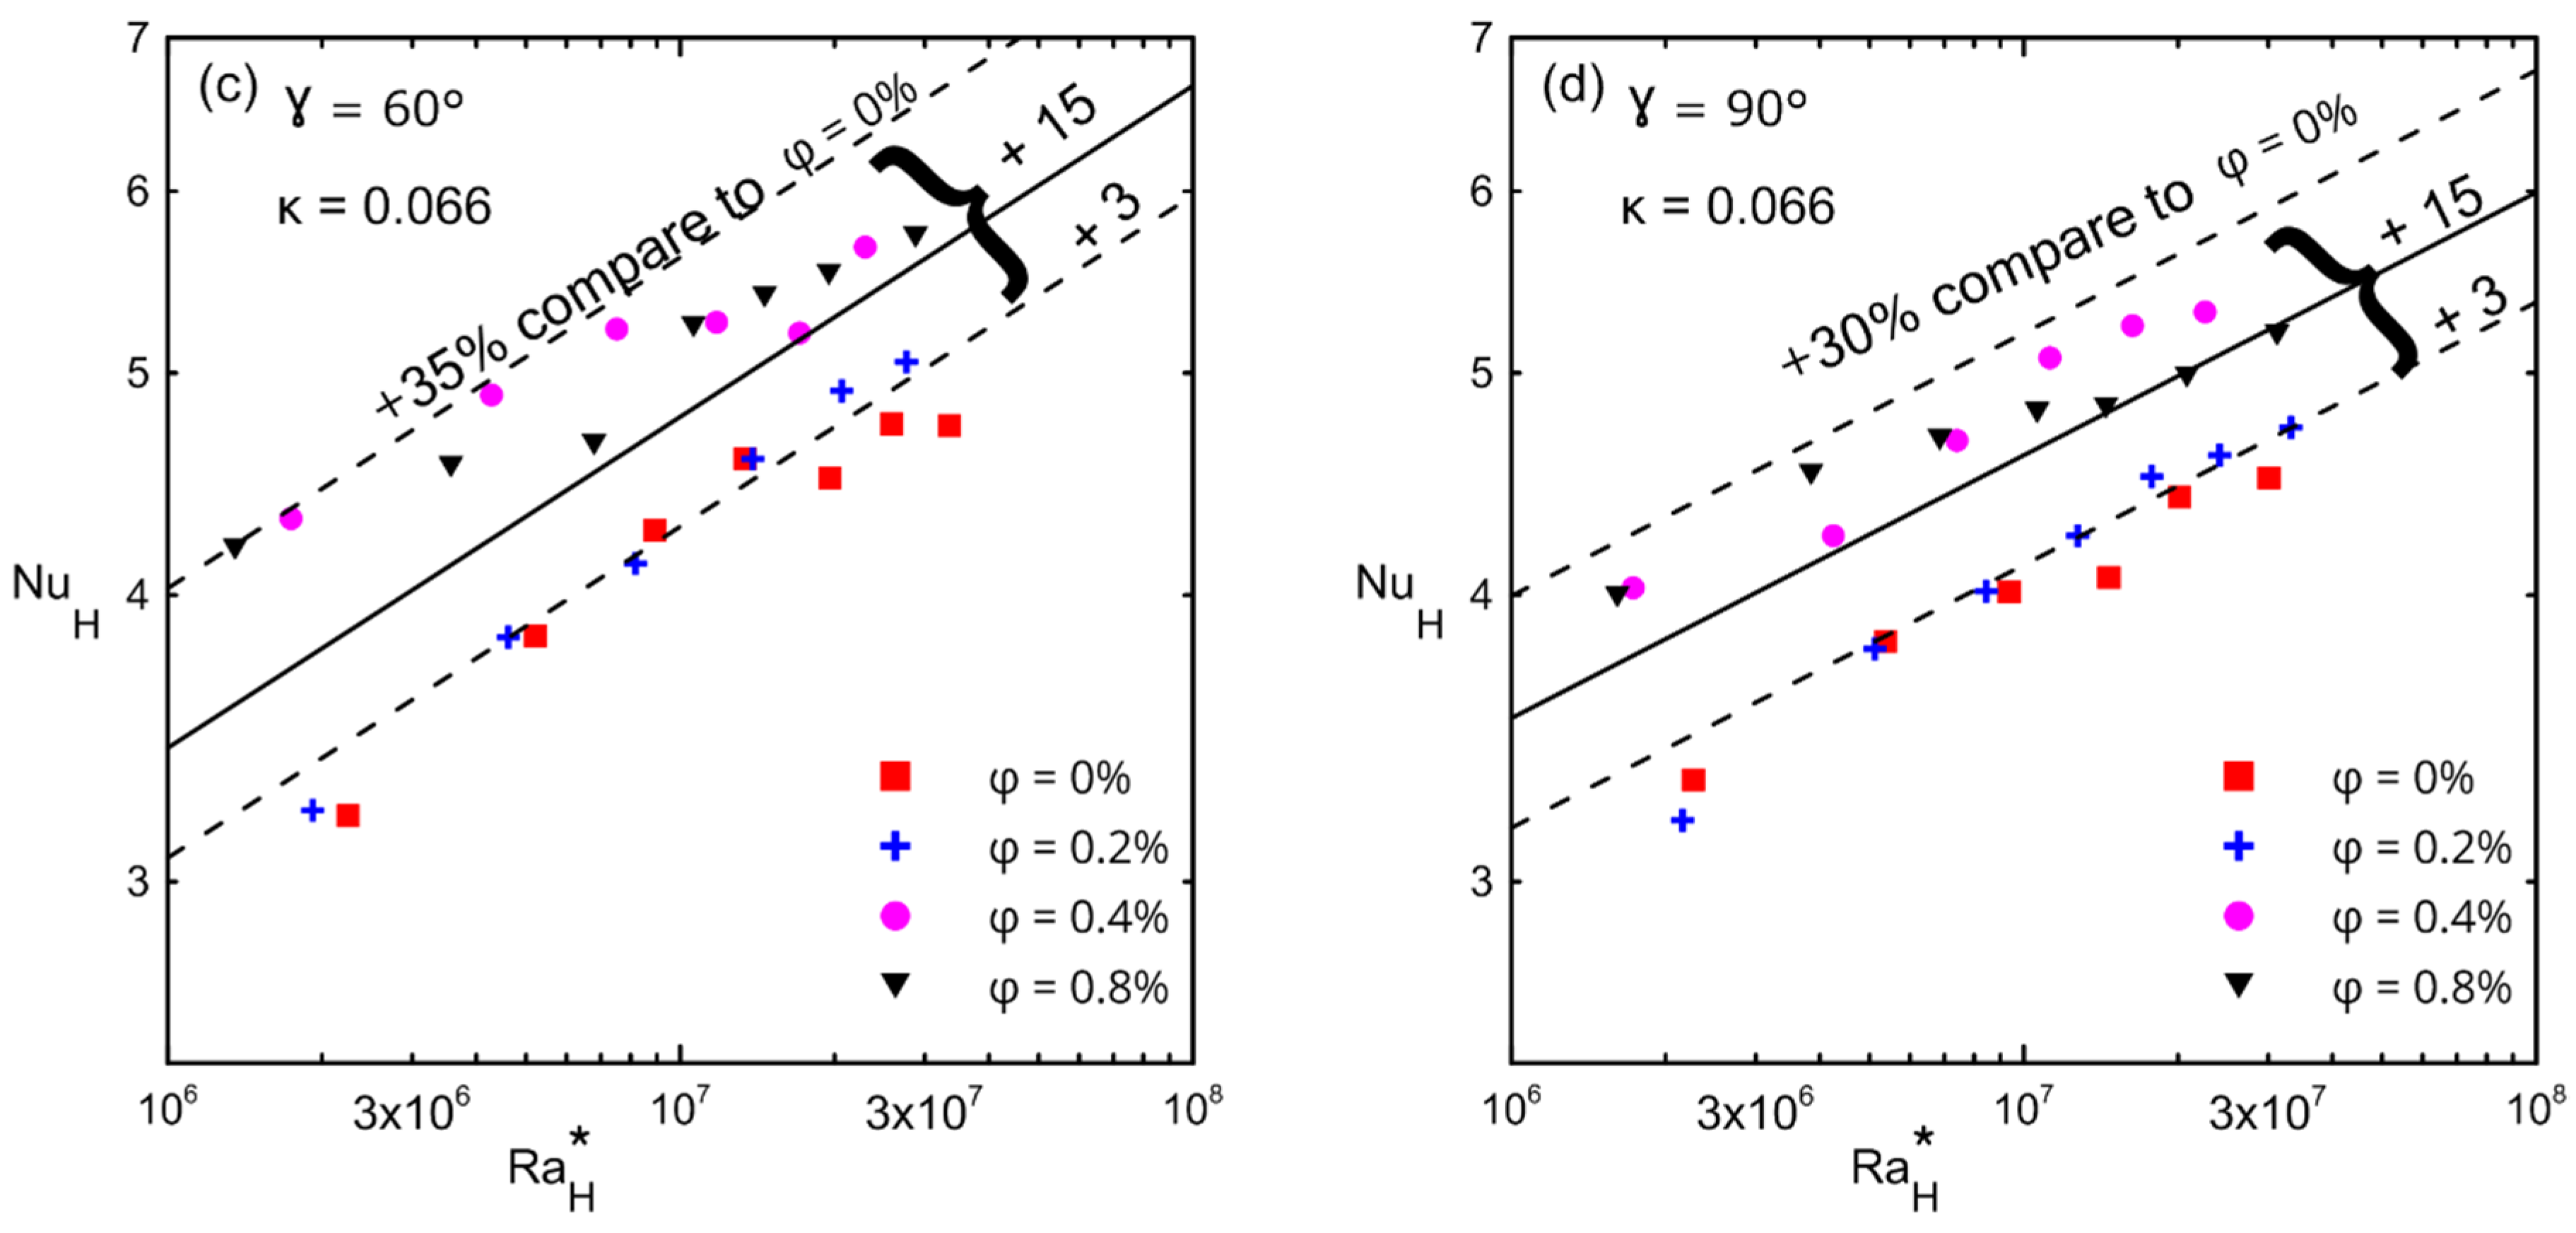
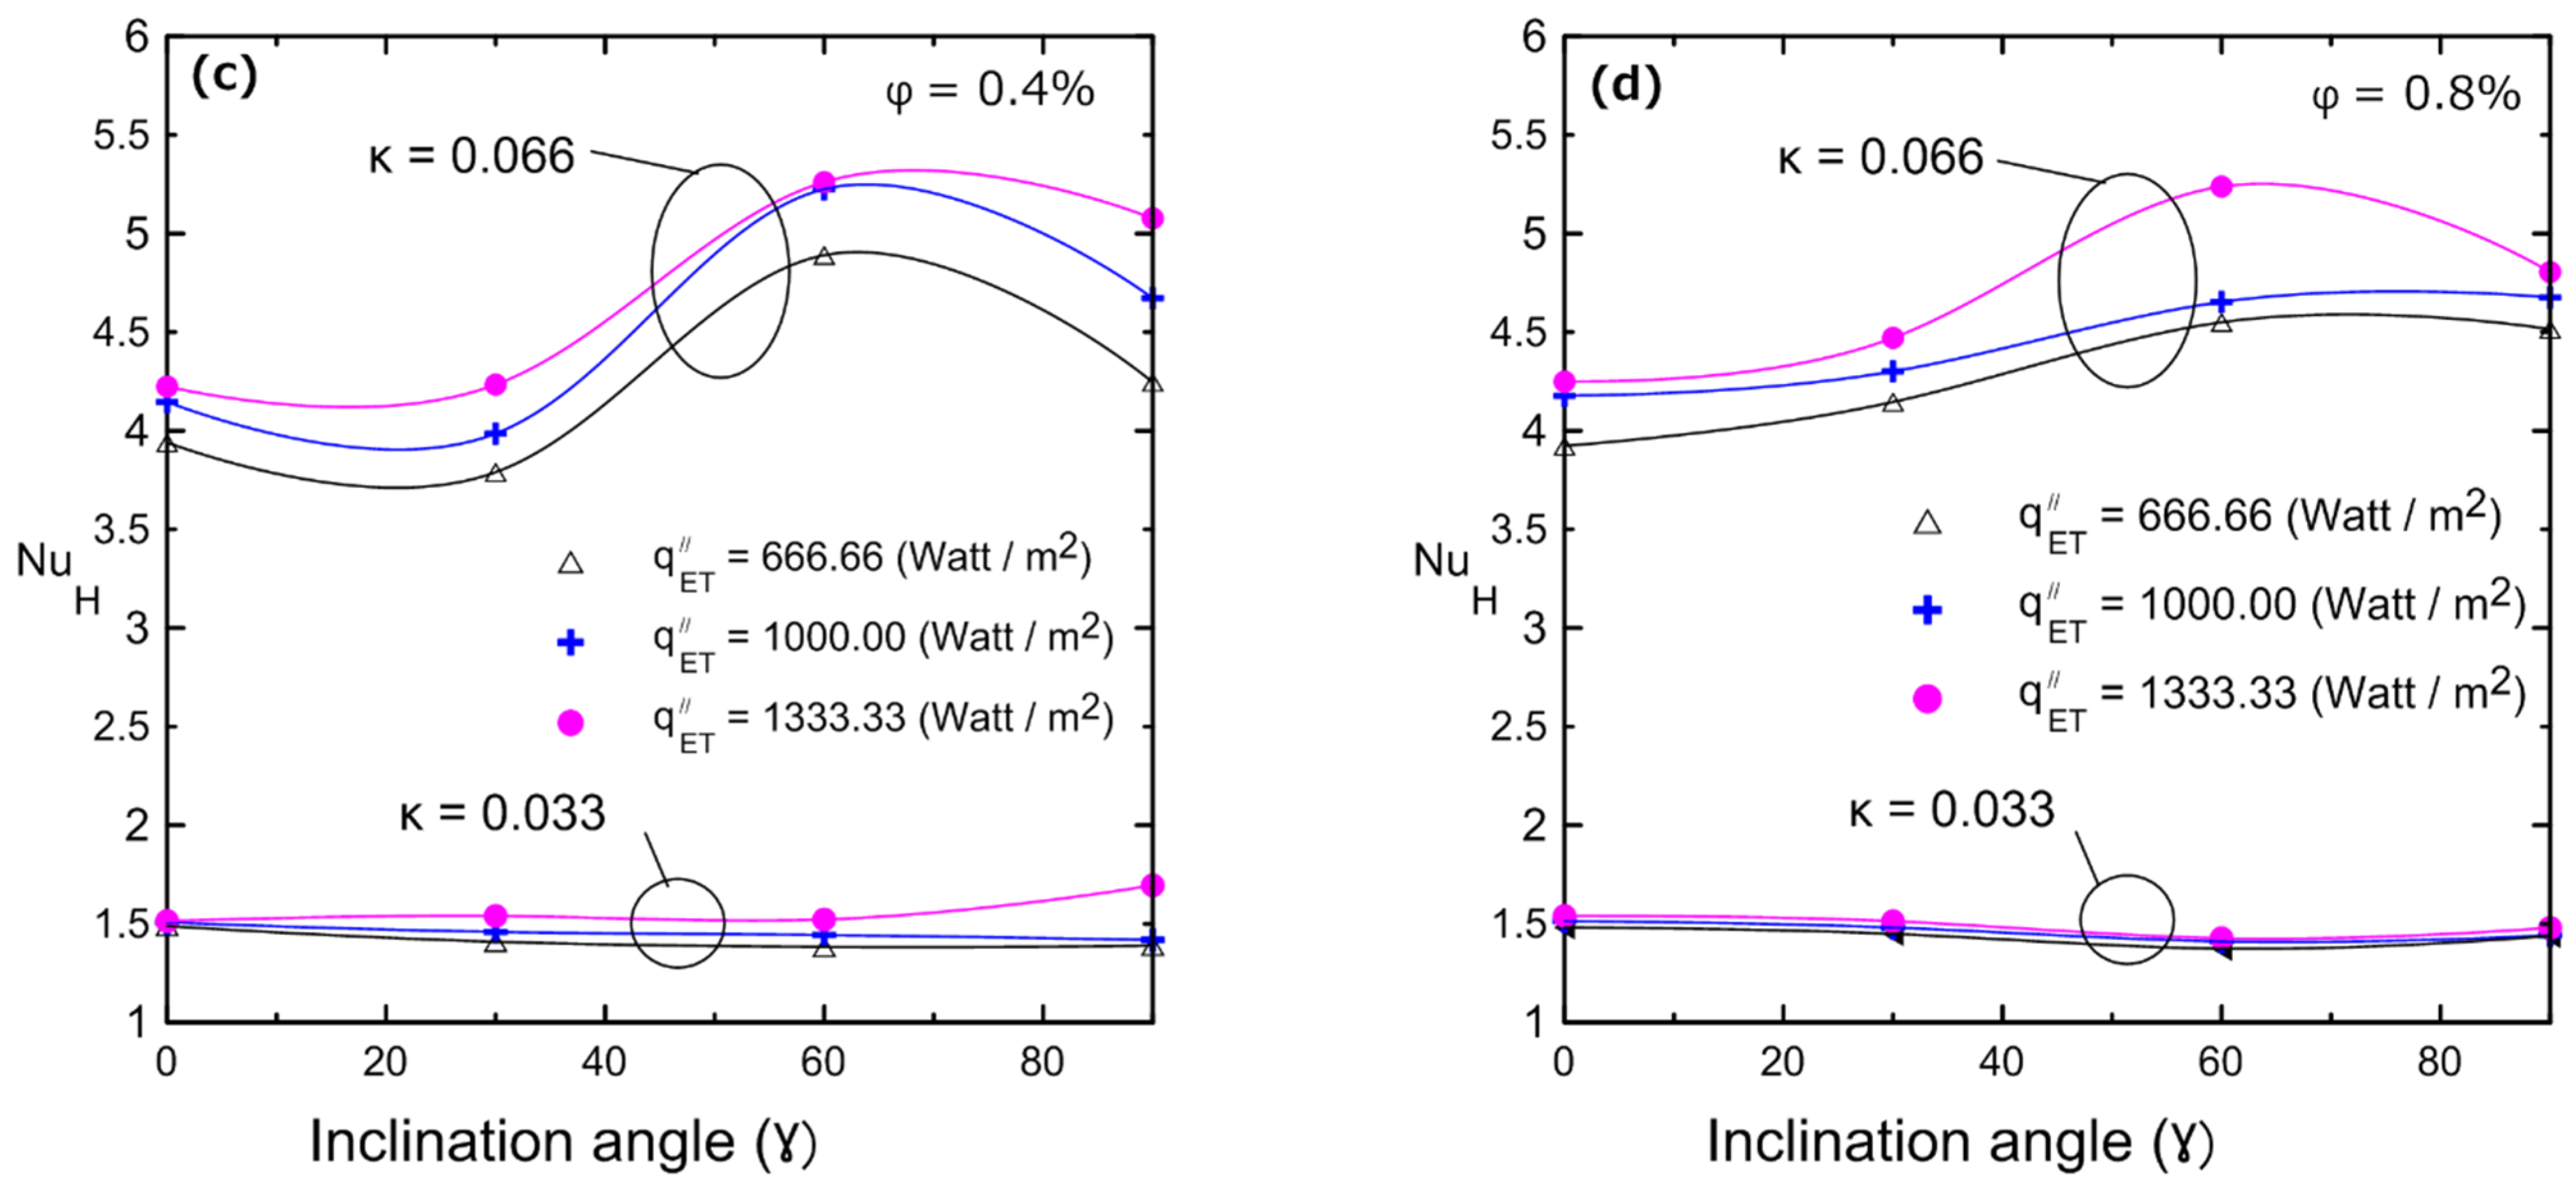
3.2. Heat Transfer Analysis
4. Conclusions
Author Contributions
Funding
Data Availability Statement
Conflicts of Interest
Nomenclature
| A | Enclosure surface area, m2 |
| Surface area of the Bakelite plate above the heater, m2 | |
| Surface area of the Bakelite sides, m2 | |
| H | Inside height of the cavity, m |
| h | Heat transfer coefficient, W m−2 k−1 |
| I | Electrical current, ampere |
| K | Thermal conductivity, W m−2 k−1 |
| Nu | Nusselt number, h H/k |
| Qtotal | Input power electrical, W |
| Heat lost by conduction through the lower Bakelite plate, W | |
| Heat lost by conduction through the Bakelite sides, W | |
| Heat transfer by convection through the fluid, W | |
| Heat flux transfer by convection through the fluid, W/m2 | |
| R | Overall enclosure of the thermal resistances, K/W |
| RCppper | Copper thermal resistances, K/W |
| Fluid thermal resistances, K/W | |
| The modified Rayleigh number, | |
| Ra → | Rayleigh number, |
| T | Temperature, °C |
| ∆T | , °C |
| V | Voltage, volt |
| Greek symbols | |
| α | Thermal diffusivity, m−2 s−1 |
| β | Coefficient for thermal expansion, K−1 |
| δ | Bakelite thickness |
| ν | Kinematics viscosity, m−2 s−1 |
| Δx | Thickness of copper, m |
| γ | Tilt angle of the cavity |
| κ | Aspect ratio |
| φ | Volume concentration |
| Subscripts | |
| Cold surface | |
| Hot surface | |
| bf | Base fluid |
| Bakelite plate | |
| Bks | Bakelite side |
| eff | Effective |
| exp | Experimental data |
| ET | Enclosure through |
| H | Characteristic length |
| nf | Nanofluid |
| p | Particle |
| Superscripts | |
| ـــ | Averaged quantity |
References
- Catton, I. Natural convection in enclosures. In Proceedings of the International Heat Transfer Conference Digital Library, Toronto, ON, Canada, 7–11 August 1978. [Google Scholar]
- Jeng, D.Z.; Yang, C.S.; Gau, C. Experimental and numerical study of transient natural convection due to mass transfer in inclined enclosures. Int. J. Heat Mass Transf. 2009, 52, 181–192. [Google Scholar] [CrossRef]
- Ostrach, S. Natural convection in enclosures. J. Heat Transf. 1988, 110, 1175–1190. [Google Scholar] [CrossRef]
- Sivashanmugam, P. Application of nanofluids in heat transfer. In An. Overview of Heat Transfer Phenomena; Kazi, S.N., Ed.; INTECH Publications: Rijeka, Croatia, 2012; Chapter 14; pp. 411–440. [Google Scholar] [CrossRef] [Green Version]
- Corcione, M. Effects of the thermal boundary conditions at the sidewalls upon natural convection in rectangular enclosures heated from below and cooled from above. Int. J. Therm. Sci. 2003, 42, 199–208. [Google Scholar] [CrossRef]
- Ganzarolli, M.M.; Milanez, L.F. Natural convection in rectangular enclosures heated from below and symmetrically cooled from the sides. Int. J. Heat Mass Transf. 1995, 38, 1063–1073. [Google Scholar] [CrossRef]
- Deng, Q.-H. Fluid flow and heat transfer characteristics of natural convection in square cavities due to discrete source–sink pairs. Int. J. Heat Mass Transf. 2008, 51, 5949–5957. [Google Scholar] [CrossRef]
- Ghodsinezhad, H.; Sharifpur, M.; Meyer, J.P. Experimental investigation on cavity flow natural convection of Al2O3–water nanofluids. Int. Commun. Heat Mass Transf. 2016, 76, 316–324. [Google Scholar] [CrossRef]
- Ilyas, S.U.; Pendyala, R.; Marneni, N. Preparation, sedimentation, and agglomeration of nanofluids. Chem. Eng. Technol. 2014, 37, 2011–2021. [Google Scholar] [CrossRef]
- Rashidi, M.M.; Nazari, M.A.; Mahariq, I.; Assad, M.E.H.; Ali, M.E.; Almuzaiqer, R.; Nuhait, A.; Murshid, N. Thermophysical Properties of Hybrid Nanofluids and the Proposed Models: An Updated Comprehensive Study. Nanomaterials 2021, 11, 3084. [Google Scholar] [CrossRef]
- Ghasemi, B.; Aminossadati, S. Natural convection heat transfer in an inclined enclosure filled with a water-CuO nanofluid. Numer. Heat Transf. Part A Appl. 2009, 55, 807–823. [Google Scholar] [CrossRef]
- Esfandiary, M.; Mehmandoust, B.; Karimipour, A.; Pakravan, H.A. Natural convection of Al2O3–water nanofluid in an inclined enclosure with the effects of slip velocity mechanisms: Brownian motion and thermophoresis phenomenon. Int. J. Therm. Sci. 2016, 105, 137–158. [Google Scholar] [CrossRef]
- Ahmed, M.; Eslamian, M. Numerical simulation of natural convection of a nanofluid in an inclined heated enclosure using two-phase lattice Boltzmann method: Accurate effects of thermophoresis and Brownian forces. Nanoscale Res. Lett. 2015, 10, 1–12. [Google Scholar] [CrossRef] [Green Version]
- Pandey, S.; Park, Y.G.; Ha, M.Y. An exhaustive review of studies on natural convection in enclosures with and without internal bodies of various shapes. Int. J. Heat Mass Transf. 2019, 138, 762–795. [Google Scholar] [CrossRef]
- Ali, M.E.-S.; Nuhait, A.O.; Alabdulkarem, A.; Almuzaiqer, R. Free convection heat transfer inside square water-filled shallow enclosures. PLoS ONE 2018, 13, e0204251. [Google Scholar] [CrossRef] [Green Version]
- Almuzaiqer, R.; Ali, M.E.-S.; Al-Salem, K. Tilt angle’s effects on free convection heat transfer coefficient inside a water filled square enclosure. Process 2021. Submitted. [Google Scholar]
- Hussain, S.H.; Hussein, A.K.; Mahdi, M.M. Natural convection in a square inclined enclosure with vee-corrugated sidewalls subjected to constant flux heating from below. Nonlinear Anal. Model. Control. 2011, 16, 152–169. [Google Scholar] [CrossRef] [Green Version]
- Inam, M.I. Direct Numerical Simulation of Laminar Natural Convection in a Square Cavity at Different Inclination Angle. J. Eng. Adv. 2020, 1, 23–27. [Google Scholar] [CrossRef]
- Rahman, M.; Sharif, M. Numerical study of laminar natural convection in inclined rectangular enclosures of various aspect ratios. Numer. Heat Transf. Part A Appl. 2003, 44, 355–373. [Google Scholar] [CrossRef]
- Ma, Y.; Liu, C.; Jiaqiang, E.; Mao, X.; Yu, Z. Research on modeling and parameter sensitivity of flow and heat transfer process in typical rectangular microchannels: From a data-driven perspective. Int. J. Therm. Sci. 2022, 172, 107356. [Google Scholar] [CrossRef]
- Zhao, X.; Jiaqiang, E.; Wu, G.; Deng, Y.; Han, D.; Zhang, B.; Zhang, Z. A review of studies using graphenes in energy conversion, energy storage and heat transfer development. Energy Convers. Manag. 2019, 184, 581–599. [Google Scholar] [CrossRef]
- Hu, Y.; He, Y.; Qi, C.; Jiang, B.; Schlaberg, H.I. Experimental and numerical study of natural convection in a square enclosure filled with nanofluid. Int. J. Heat Mass Transf. 2014, 78, 380–392. [Google Scholar] [CrossRef]
- Ali, M.; Zeitoun, O.; Almotairi, S. Natural convection heat transfer inside vertical circular enclosure filled with water-based Al2O3 nanofluids. Int. J. Therm. Sci. 2013, 63, 115–124. [Google Scholar] [CrossRef]
- Ali, M.; Zeitoun, O.; Almotairi, S.; Al-Ansary, H. The effect of alumina–water nanofluid on natural convection heat transfer inside vertical circular enclosures heated from above. Heat Transf. Eng. 2013, 34, 1289–1299. [Google Scholar] [CrossRef]
- Solomon, A.B.; van Rooyen, J.; Rencken, M.; Sharifpur, M.; Meyer, J.P. Experimental study on the influence of the aspect ratio of square cavity on natural convection heat transfer with Al2O3/Water nanofluids. Int. Commun. Heat Mass Transf. 2017, 88, 254–261. [Google Scholar] [CrossRef]
- Choudhary, R.; Subudhi, S. Aspect ratio dependence of turbulent natural convection in Al2O3/water nanofluids. Appl. Therm. Eng. 2016, 108, 1095–1104. [Google Scholar] [CrossRef]
- Abu-Nada, E.; Oztop, H.F. Effects of inclination angle on natural convection in enclosures filled with Cu–water nanofluid. Int. J. Heat Fluid Flow 2009, 30, 669–678. [Google Scholar] [CrossRef]
- Heris, S.Z.; Pour, M.B.; Mahian, O.; Wongwises, S. A comparative experimental study on the natural convection heat transfer of different metal oxide nanopowders suspended in turbine oil inside an inclined cavity. Int. J. Heat Mass Transf. 2014, 73, 231–238. [Google Scholar] [CrossRef]
- Rahimi, A.; Kasaeipoor, A.; Malekshah, E.H.; Kolsi, L. Experimental and numerical study on heat transfer performance of three-dimensional natural convection in an enclosure filled with DWCNTs-water nanofluid. Powder Technol. 2017, 322, 340–352. [Google Scholar] [CrossRef]
- Torki, M.; Etesami, N. Experimental investigation of natural convection heat transfer of SiO 2/water nanofluid inside inclined enclosure. J. Therm. Anal. Calorim. 2020, 139, 1565–1574. [Google Scholar] [CrossRef]
- Bouhalleb, M.; Abbassi, H. Natural convection of nanofluids in enclosures with low aspect ratios. Int. J. Hydrogen Energy 2014, 39, 15275–15286. [Google Scholar] [CrossRef] [Green Version]
- Chakraborty, S.; Panigrahi, P.K. Stability of nanofluid: A review. Appl. Therm. Eng. 2020, 174, 115259. [Google Scholar] [CrossRef]
- Zainon, S.; Azmi, W. Recent Progress on Stability and Thermo-Physical Properties of Mono and Hybrid towards Green Nanofluids. Micromachines 2021, 12, 176. [Google Scholar] [CrossRef]
- Aravind, S.J.; Baskar, P.; Baby, T.T.; Sabareesh, R.K.; Das, S.; Ramaprabhu, S. Investigation of structural stability, dispersion, viscosity, and conductive heat transfer properties of functionalized carbon nanotube based nanofluids. J. Phys. Chem. C 2011, 115, 16737–16744. [Google Scholar] [CrossRef]
- Babar, H.; Ali, H.M. Towards hybrid nanofluids: Preparation, thermophysical properties, applications, and challenges. J. Mol. Liq. 2019, 281, 598–633. [Google Scholar] [CrossRef]
- Pavía, M.; Alajami, K.; Estellé, P.; Desforges, A.; Vigolo, B. A critical review on thermal conductivity enhancement of graphene-based nanofluids. Adv. Colloid Interface Sci. 2021, 294, 102452. [Google Scholar] [CrossRef]
- Karimipour, A. New correlation for Nusselt number of nanofluid with Ag/Al2O3/Cu nanoparticles in a microchannel considering slip velocity and temperature jump by using lattice Boltzmann method. Int. J. Therm. Sci. 2015, 91, 146–156. [Google Scholar] [CrossRef]
- Usri, N.; Azmi, W.; Mamat, R.; Hamid, K.A.; Najafi, G. Thermal conductivity enhancement of Al2O3 nanofluid in ethylene glycol and water mixture. Energy Procedia 2015, 79, 397–402. [Google Scholar] [CrossRef] [Green Version]
- Callister, W.D.; Rethwisch, D. The Structure of Crystalline Solids. Materials Science and Engineering: An Introduction; John Wiley and Sons Inc: New York, NY, USA, 2007; pp. 38–79. [Google Scholar]
- Howell, J.R.; Siegel, R. Thermal Radiation Heat Transfer; CRC Press: Boca Raton, FL, USA, 1980. [Google Scholar]
- Bejan, A. Convection Heat Transfer; John Wiley and Sons Inc: New York, NY, USA, 2013. [Google Scholar]
- Klein, S.A.; Alvarado, F. Engineering Equation Solver (EES), FChart Software: Madison, WI, USA, 2010.
- Taylor, B.N.; Kuyatt, C.E. NIST technical note 1297. In Guidelines for Evaluating and Expressing the Uncertainty of NIST Measurement Results; National Institute of Standards and Technology: Gaithersburg, MD, USA, 1994; Volume 1, pp. 14571–14577. [Google Scholar]
- Maxwell, J.C. Electricity, A.T.O. Magnetism. In A Treatise on Electricity and Magnetism; Oxford University Press: London, UK, 1892. [Google Scholar]
- Williams, W.; Buongiorno, J.; Hu, L.-W. Experimental investigation of turbulent convective heat transfer and pressure loss of alumina/water and zirconia/water nanoparticle colloids (nanofluids) in horizontal tubes. J. Heat Transf. 2008, 130, 042412. [Google Scholar] [CrossRef]
- Rashmi, W.; Khalid, M.; Ong, S.; Saidur, R. Preparation, thermo-physical properties and heat transfer enhancement of nanofluids. Mater. Res. Express 2014, 1, 032001. [Google Scholar] [CrossRef]
- Einstein, A. Investigations on the Theory of the Brownian Movement; Dover Publications Inc.: Dover, DE, USA, 1956. [Google Scholar]
- Brinkman, H.C. The viscosity of concentrated suspensions and solutions. J. Chem. Phys. 1952, 20, 571. [Google Scholar] [CrossRef]
- Ho, C.; Liu, W.; Chang, Y.; Lin, C. Natural convection heat transfer of alumina-water nanofluid in vertical square enclosures: An experimental study. Int. J. Therm. Sci. 2010, 49, 1345–1353. [Google Scholar] [CrossRef]
- De Bruijn, H. The viscosity of suspensions of spherical particles. (The fundamental η-c and φ relations). Recl. Des Trav. Chim. Des Pays-Bas 1942, 61, 863–874. [Google Scholar] [CrossRef]
- Batchelor, G. The effect of Brownian motion on the bulk stress in a suspension of spherical particles. J. Fluid Mech. 1977, 83, 97–117. [Google Scholar] [CrossRef]
- Fernández-Prini, R.; Dooley, R. Release on the IAPWS Industrial Formulation; IAPWS: Eflangen, Germany, 1997. [Google Scholar]
- Pak, B.C.; Cho, Y.I. Hydrodynamic and heat transfer study of dispersed fluids with submicron metallic oxide particles. Exp. Heat Transf. Int. J. 1998, 11, 151–170. [Google Scholar] [CrossRef]
- Ravnik, J.; Škerget, L.; Žunič, Z. Velocity–vorticity formulation for 3D natural convection in an inclined enclosure by BEM. Int. J. Heat Mass Transf. 2008, 51, 4517–4527. [Google Scholar] [CrossRef]


| Appearance | Translucent Liquid–White |
| Crystal structure and type | Gamma |
| PH value | >7 |
| Original particle size | 10 nm |
| Al2O3 | 20% |
| Solvent | 80% water |
| Al2O3 Purity | 99.99% |
| Cp (J/Kg ∙ K) | ρ (kg/m3) | k (W/m ∙ K) | β × 10− 4 (K−1) | |
|---|---|---|---|---|
| Water (base fluid) | 4179 | 997 | 0.6 | 2.3 |
| Al2O3 (nano particles) | 765 | 3970 | 40 | 0.85 |
| Output | 4 Litres per Hour |
| Heaters | 3 × 1.5 Kw Silica Heater/ 1 × 1.25 Kw Silica Heater |
| Power | 220/240 v |
| Fuse | 13 AMP |
| Minimum pressure supply | 5 Psi |
| Ph | 5.5–6.5 |
| Electrical conductivity, µs/cm | <2.5 |
| Resistivity, megohm-cm | 0.66 |
| Temperature | <35 °C |
| Thermostatic cut out | YES |
| Water supply cut out | NO |
| Wall or bench mountable | BOTH |
| Net weight | 12 Kg |
| Number | Equipment | Photo of the Instrument | Company | Manufacturer | Model |
|---|---|---|---|---|---|
| 1 | Thermal properties analyzer |  | Decagon Devices | Pullman, WA, USA | KD2 pro |
| 2 | Kinematic viscometer |  | Anton Paar | Graz,Austria | SVM 2001 |
| 3 | Ultrasonic prob |  | Qsonica | Newtown, CT,USA | Q-700 |
| 4 | Electronic balance | 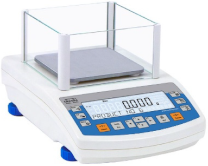 | RADWAG | Radom,Poland | PS 600.R2 |
| 5 | Magnetic Stirrer | 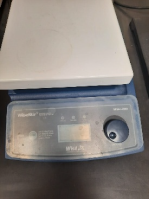 | WiseStir | Wertheim, Germany | MSH-20D Set |
| 6 | Distilled water machine | 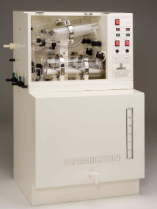 | HAMILTON | Kent, United Kingdom | WSC/4D,Twice distilled water machine |
| Part Number | Part Description | Material | Dimensions (cm) |
|---|---|---|---|
| 1 | Enclosure cover (cold surface) | Copper | |
| 2 | Gasket | Polyurethane | |
| 3 | Two-way valve | Steel | Diameter = 0.635 |
| 4 | Enclosure | Bakelite | |
| 5 | Gasket | Polyurethane | |
| 6 | Enclosure cover (hot surface) | Copper | |
| 7 | Electrical heater | Polyimide | |
| 8 | Insulation cover | Bakelite | |
| 9 | Thermocouple | Type-K, self-adhesive | |
| 10 | Insulation cover | Fiber glass |
| Quantity | Uncertainty (%) |
|---|---|
| 3.00 | |
| QBkp | 8.07 |
| QBks | 12.11 |
| QET | 3.53 |
| havg | 3.90 |
| 3.91 | |
| 3.55 |
| Volume Concentrations (φ)% | Thermal Conductivity, Experimental Data (W/m ∙ °C) | Equation (13) of Maxwell [44](W/m ∙ °C) | Percent of Deviation | Equation (14) of Williams [45](W/m ∙ °C) | Percent of Deviation |
|---|---|---|---|---|---|
| 0.10% | 0.6245 | 0.6198 | 0.76% | 0.6208 | 0.59% |
| 0.20% | 0.631 | 0.6215 | 1.52% | 0.6236 | 1.18% |
| 0.40% | 0.642 | 0.6251 | 2.70% | 0.6292 | 2.03% |
| 0.50% | 0.652 | 0.6269 | 4.00% | 0.6321 | 3.15% |
| 0.80% | 0.661 | 0.6323 | 4.54% | 0.6405 | 3.20% |
| 1.00% | 0.685 | 0.6426 | 6.61% | 0.6529 | 4.91% |
| Author | Type of Model | Model Equation | |
|---|---|---|---|
| Einstein [47] | Theoretical | (15) | |
| Brinkman [48] | Theoretical | (16) | |
| Ho et al. [49] | Experimental | (17) | |
| De Bruijn [50] | Theoretical | (18) | |
| Batchelor [51] | Theoretical | (19) | |
| Williams [45] | Experimental | (20) |
| Volume Concentrations (φ)% | Viscosity, Experimental Data (mPa ∙ s) | Einstein [47] (Equation (15)) (mPa ∙ s) | Percent of Deviation (% Change) | Brinkman [48] (Equation (16)) (mPa ∙ s) | Percent of Deviation (% Change) | De Bruijn [50] (Equation (18)) (mPa ∙ s) | Percent of Deviation (% Change) |
|---|---|---|---|---|---|---|---|
| 0.10% | 0.92871 | 0.93062 | 0.21% | 0.93062 | 0.21% | 0.93063 | 0.21% |
| 0.20% | 0.94319 | 0.93294 | 1.09% | 0.93296 | 1.08% | 0.93296 | 1.08% |
| 0.40% | 0.96740 | 0.93758 | 3.08% | 0.93765 | 3.08% | 0.93765 | 3.07% |
| 0.50% | 0.98572 | 0.93990 | 4.65% | 0.94001 | 4.64% | 0.94001 | 4.64% |
| 0.80% | 1.06496 | 0.94687 | 11.09% | 0.94713 | 11.06% | 0.94714 | 11.06% |
| 1.00% | 1.13760 | 0.95151 | 16.36% | 0.95192 | 16.32% | 0.95194 | 16.32% |
| Volume Concentrations (φ)% | Viscosity, Experimental Data (mPa ∙ s) | Batchelor [51] (Equation (19))(mPa ∙ s) | Percent of Deviation (% Change) | Ho et al. [49] (Equation (17))(mPa ∙ s) | Percent of Deviation (% Change) | Williams [45] (Equation (20))(mPa ∙ s) | Percent of Deviation (% Change) |
| 0.10% | 0.92871 | 0.93063 | 0.21% | 0.93308 | 0.47% | 0.95045 | 2.34% |
| 0.20% | 0.94319 | 0.93297 | 1.08% | 0.93828 | 0.52% | 0.97335 | 3.20% |
| 0.40% | 0.96740 | 0.93768 | 3.07% | 0.94991 | 1.81% | 1.02154 | 5.60% |
| 0.50% | 0.98572 | 0.94005 | 4.63% | 0.95634 | 2.98% | 1.04689 | 6.21% |
| 0.80% | 1.06496 | 0.94725 | 11.05% | 0.97813 | 8.15% | 1.12843 | 5.96% |
| 1.00% | 1.13760 | 0.95211 | 16.31% | 0.99471 | 12.56% | 1.18778 | 4.41% |
| Density of 1% (Vol.) Al2O3 (g/cm3) | Density of 0.8% (Vol.) Al2O3 (g/cm3) | |||||
|---|---|---|---|---|---|---|
| Temperature (°C) | Experiment | Equation (21) of Pak and Cho [53] | Percent of Deviation (%Change) | Experiment | Equation (21) of Pak and Cho [53] | Percent of Deviation (%Change) |
| 15 | 1.026 | 1.0289 | 0.28% | 1.0205 | 1.023 | 0.25% |
| 20 | 1.0251 | 1.028 | 0.28% | 1.0196 | 1.0221 | 0.24% |
| 25 | 1.0239 | 1.0268 | 0.29% | 1.0185 | 1.0209 | 0.24% |
| 30 | 1.0225 | 1.0254 | 0.29% | 1.017 | 1.0195 | 0.24% |
| 35 | 1.0209 | 1.0238 | 0.28% | 1.0154 | 1.0178 | 0.24% |
| 40 | 1.019 | 1.022 | 0.29% | 1.0135 | 1.016 | 0.24% |
| Density of 0.5% (Vol.) Al2O3 (g/cm3) | Density of 0.4% (Vol.) Al2O3 (g/cm3) | |||||
| Temperature (°C) | Experiment | Equation (21) of Pak and Cho [53] | Percent of Deviation (%Change) | Experiment | Equation (21) of Pak and Cho [53] | Percent of Deviation (%Change) |
| 15 | 1.0122 | 1.0141 | 0.18% | 1.0098 | 1.0111 | 0.13% |
| 20 | 1.0114 | 1.0132 | 0.17% | 1.0089 | 1.0102 | 0.13% |
| 25 | 1.0102 | 1.0120 | 0.17% | 1.0078 | 1.0090 | 0.12% |
| 30 | 1.0088 | 1.0106 | 0.18% | 1.0063 | 1.0076 | 0.13% |
| 35 | 1.0071 | 1.0089 | 0.18% | 1.0047 | 1.0059 | 0.12% |
| 40 | 1.0053 | 1.0071 | 0.18% | 1.0028 | 1.0041 | 0.13% |
| Density of 0.2% (Vol.) Al2O3 (g/cm3) | Density of 0.1% (Vol.) Al2O3 (g/cm3) | |||||
| Temperature (°C) | Experiment | Equation (21) of Pak and Cho [53] | Percent of Deviation (%Change) | Experiment | Equation (21) of Pak and Cho [53] | Percent of Deviation (%Change) |
| 15 | 1.0044 | 1.0051 | 0.07% | 1.0019 | 1.0022 | 0.03% |
| 20 | 1.0035 | 1.0042 | 0.07% | 1.0010 | 1.0013 | 0.03% |
| 25 | 1.0023 | 1.0030 | 0.07% | 0.9999 | 1.0001 | 0.02% |
| 30 | 1.0009 | 1.0016 | 0.07% | 0.9984 | 0.9987 | 0.03% |
| 35 | 0.9993 | 1.0000 | 0.07% | 0.9966 | 0.9970 | 0.04% |
| 40 | 0.9975 | 0.9982 | 0.07% | 0.9948 | 0.9952 | 0.04% |
| Angle | Minimum Enhancement in Nu for All Concentration | Average Enhancement in Nu for All Concentration | Maximum Enhancement for Nu in All Concentration | Concentration (Vol.%) | Average Enhancement for Nu% in Each Concentration |
|---|---|---|---|---|---|
| 0° | 9% | 20% | 32% | 0.2% | 17% |
| 0.4% | 22% | ||||
| 0.8% | 23% | ||||
| 30° | 5% | 15% | 32% | 0.2% | 10% |
| 0.4% | 13% | ||||
| 0.8% | 24% | ||||
| 60° | 3% | 15% | 35% | 0.2% | 3% |
| 0.4% | 27% | ||||
| 0.8% | 24% | ||||
| 90° | 3% | 15% | 30% | 0.2% | 3% |
| 0.4% | 22% | ||||
| 0.8% | 20% |
Publisher’s Note: MDPI stays neutral with regard to jurisdictional claims in published maps and institutional affiliations. |
© 2022 by the authors. Licensee MDPI, Basel, Switzerland. This article is an open access article distributed under the terms and conditions of the Creative Commons Attribution (CC BY) license (https://creativecommons.org/licenses/by/4.0/).
Share and Cite
Almuzaiqer, R.; Ali, M.E.; Al-Salem, K. Effect of the Aspect Ratio and Tilt Angle on the Free Convection Heat Transfer Coefficient Inside Al2O3–Water-Filled Square Cuboid Enclosures. Nanomaterials 2022, 12, 500. https://doi.org/10.3390/nano12030500
Almuzaiqer R, Ali ME, Al-Salem K. Effect of the Aspect Ratio and Tilt Angle on the Free Convection Heat Transfer Coefficient Inside Al2O3–Water-Filled Square Cuboid Enclosures. Nanomaterials. 2022; 12(3):500. https://doi.org/10.3390/nano12030500
Chicago/Turabian StyleAlmuzaiqer, Redhwan, Mohamed ElSayed Ali, and Khaled Al-Salem. 2022. "Effect of the Aspect Ratio and Tilt Angle on the Free Convection Heat Transfer Coefficient Inside Al2O3–Water-Filled Square Cuboid Enclosures" Nanomaterials 12, no. 3: 500. https://doi.org/10.3390/nano12030500
APA StyleAlmuzaiqer, R., Ali, M. E., & Al-Salem, K. (2022). Effect of the Aspect Ratio and Tilt Angle on the Free Convection Heat Transfer Coefficient Inside Al2O3–Water-Filled Square Cuboid Enclosures. Nanomaterials, 12(3), 500. https://doi.org/10.3390/nano12030500