
Influence of Surface Properties of Nanostructured Ceria-Based Catalysts on Their Stability Performance


Abstract
:1. Introduction
2. Materials and Methods
2.1. Catalysts’ Preparation
2.2. Catalysts’ Activity and Stability Tests
2.3. Characterization of the Catalysts
3. Results and Discussion
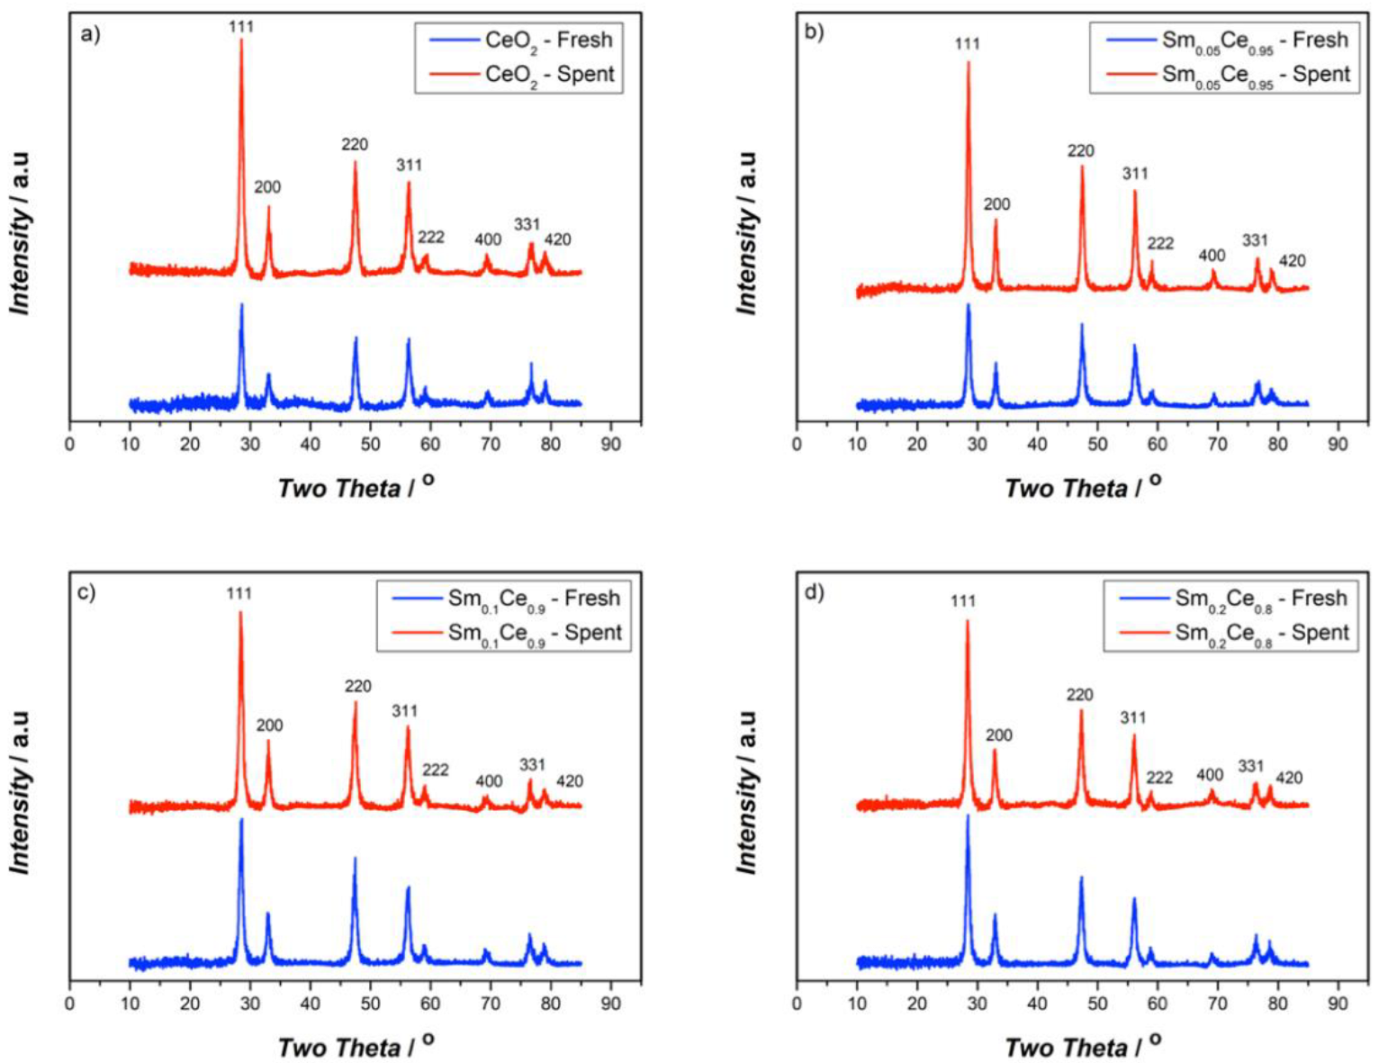
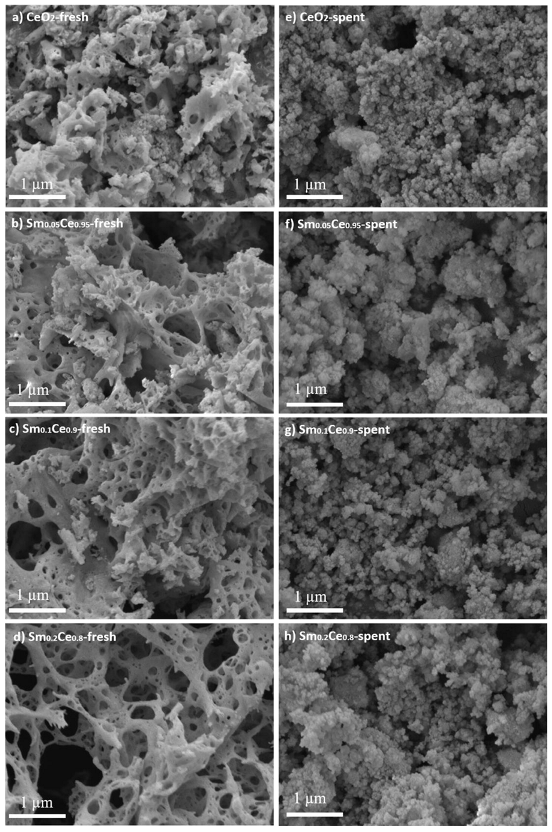
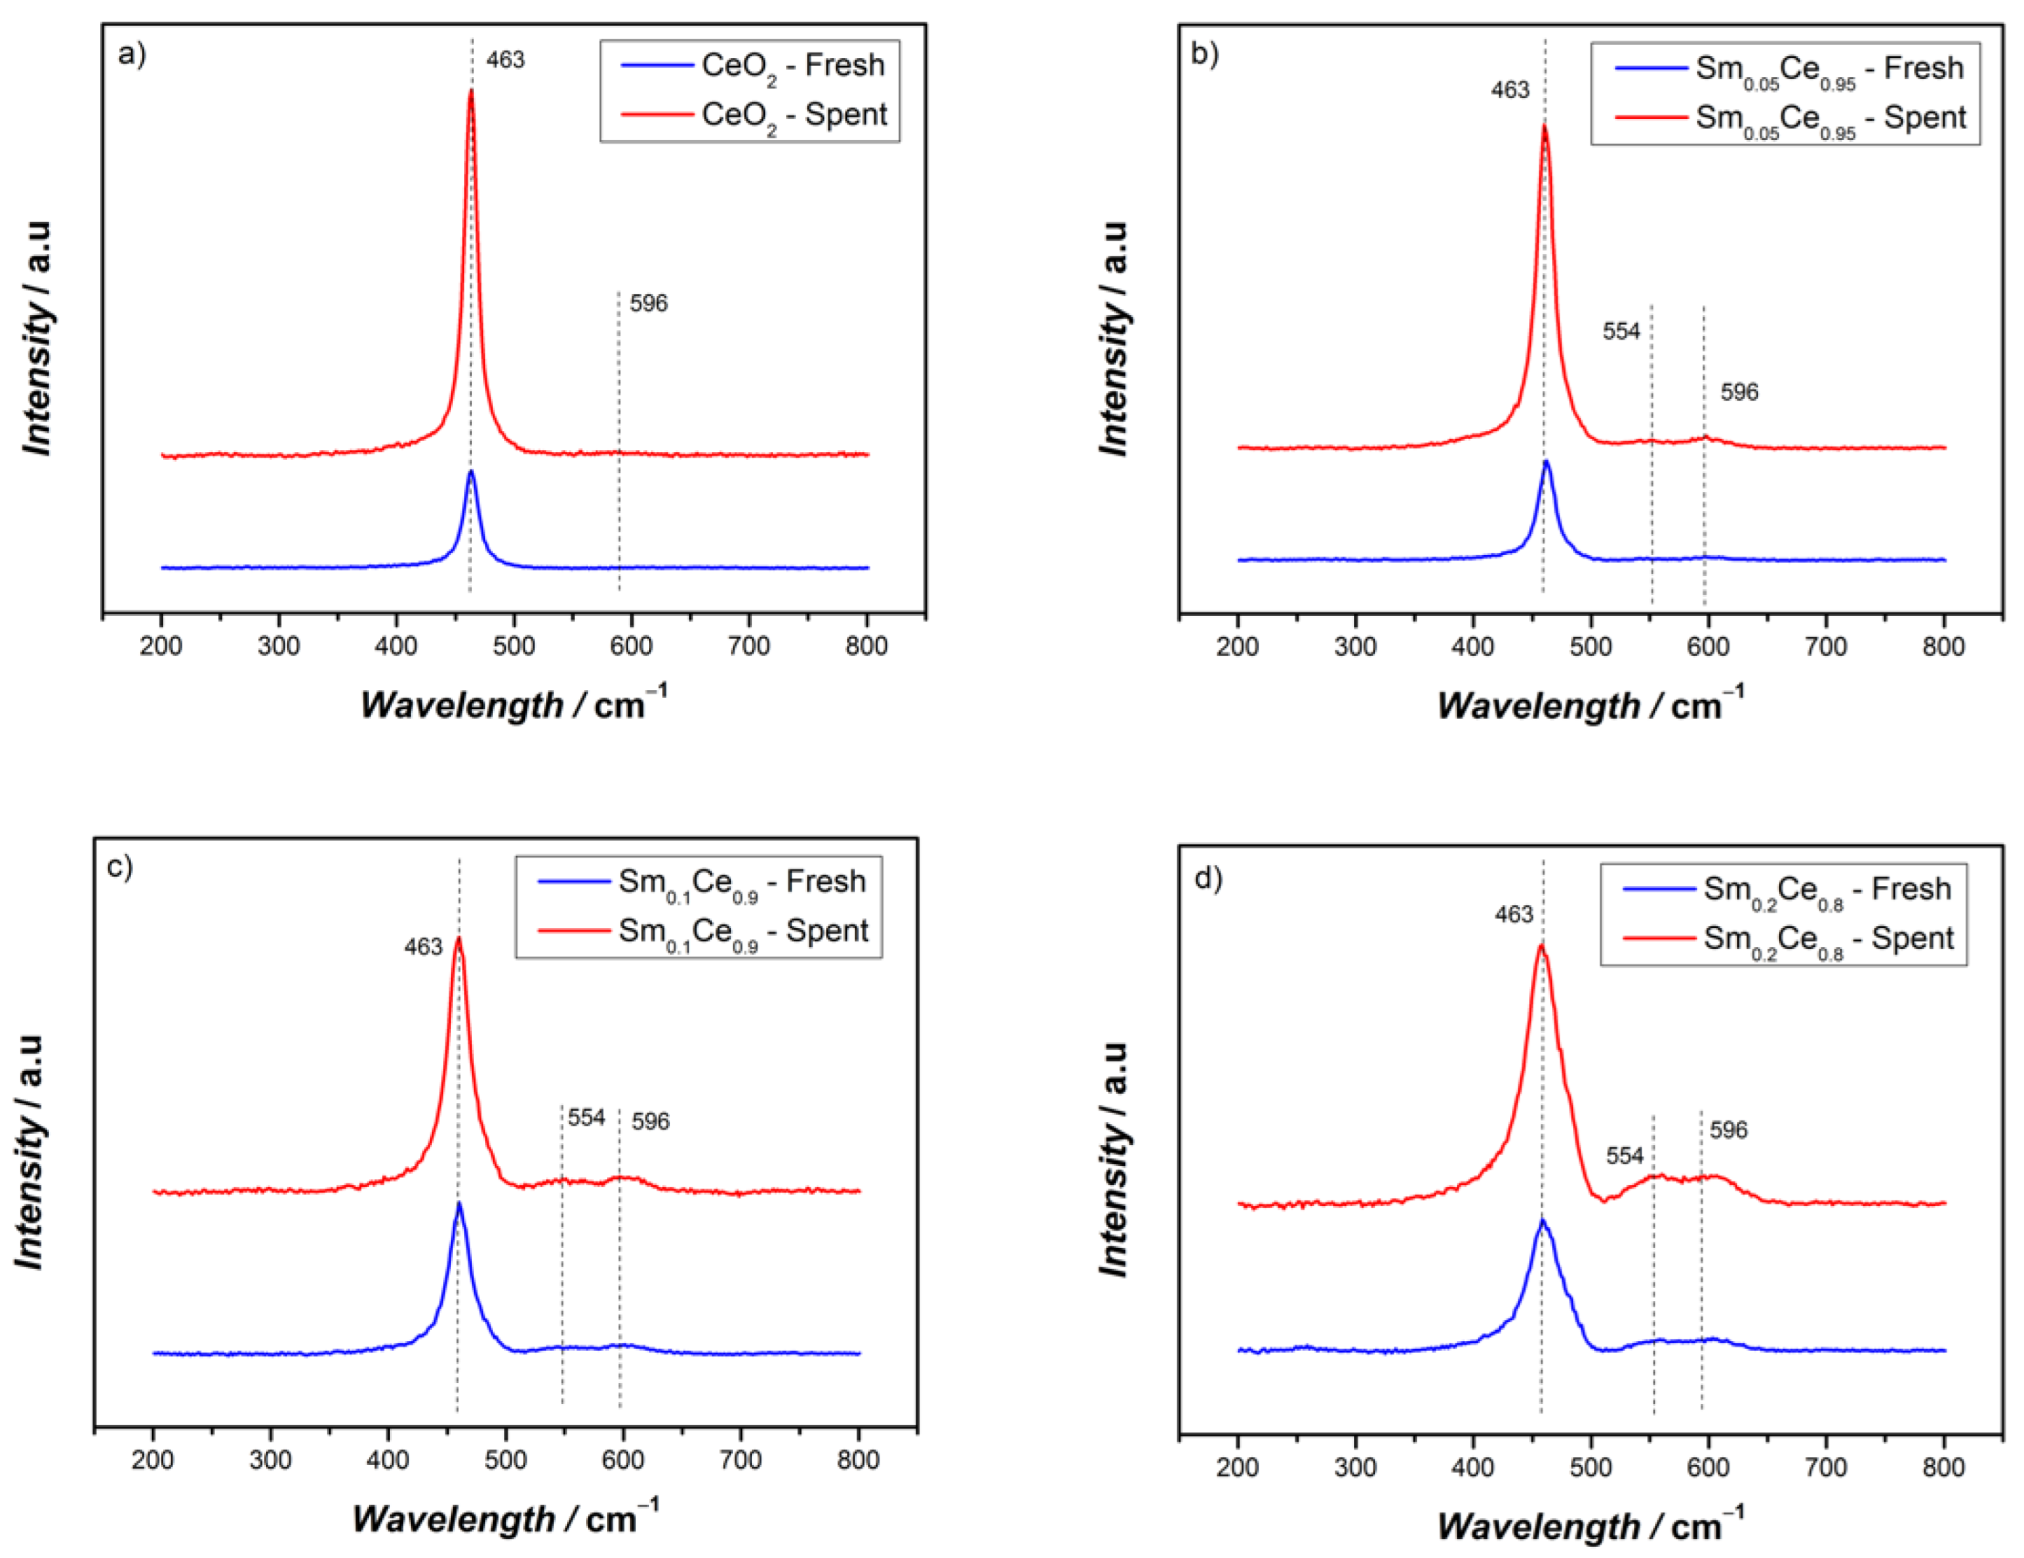
3.1. Fresh and Spent Catalysts’ Characterizations
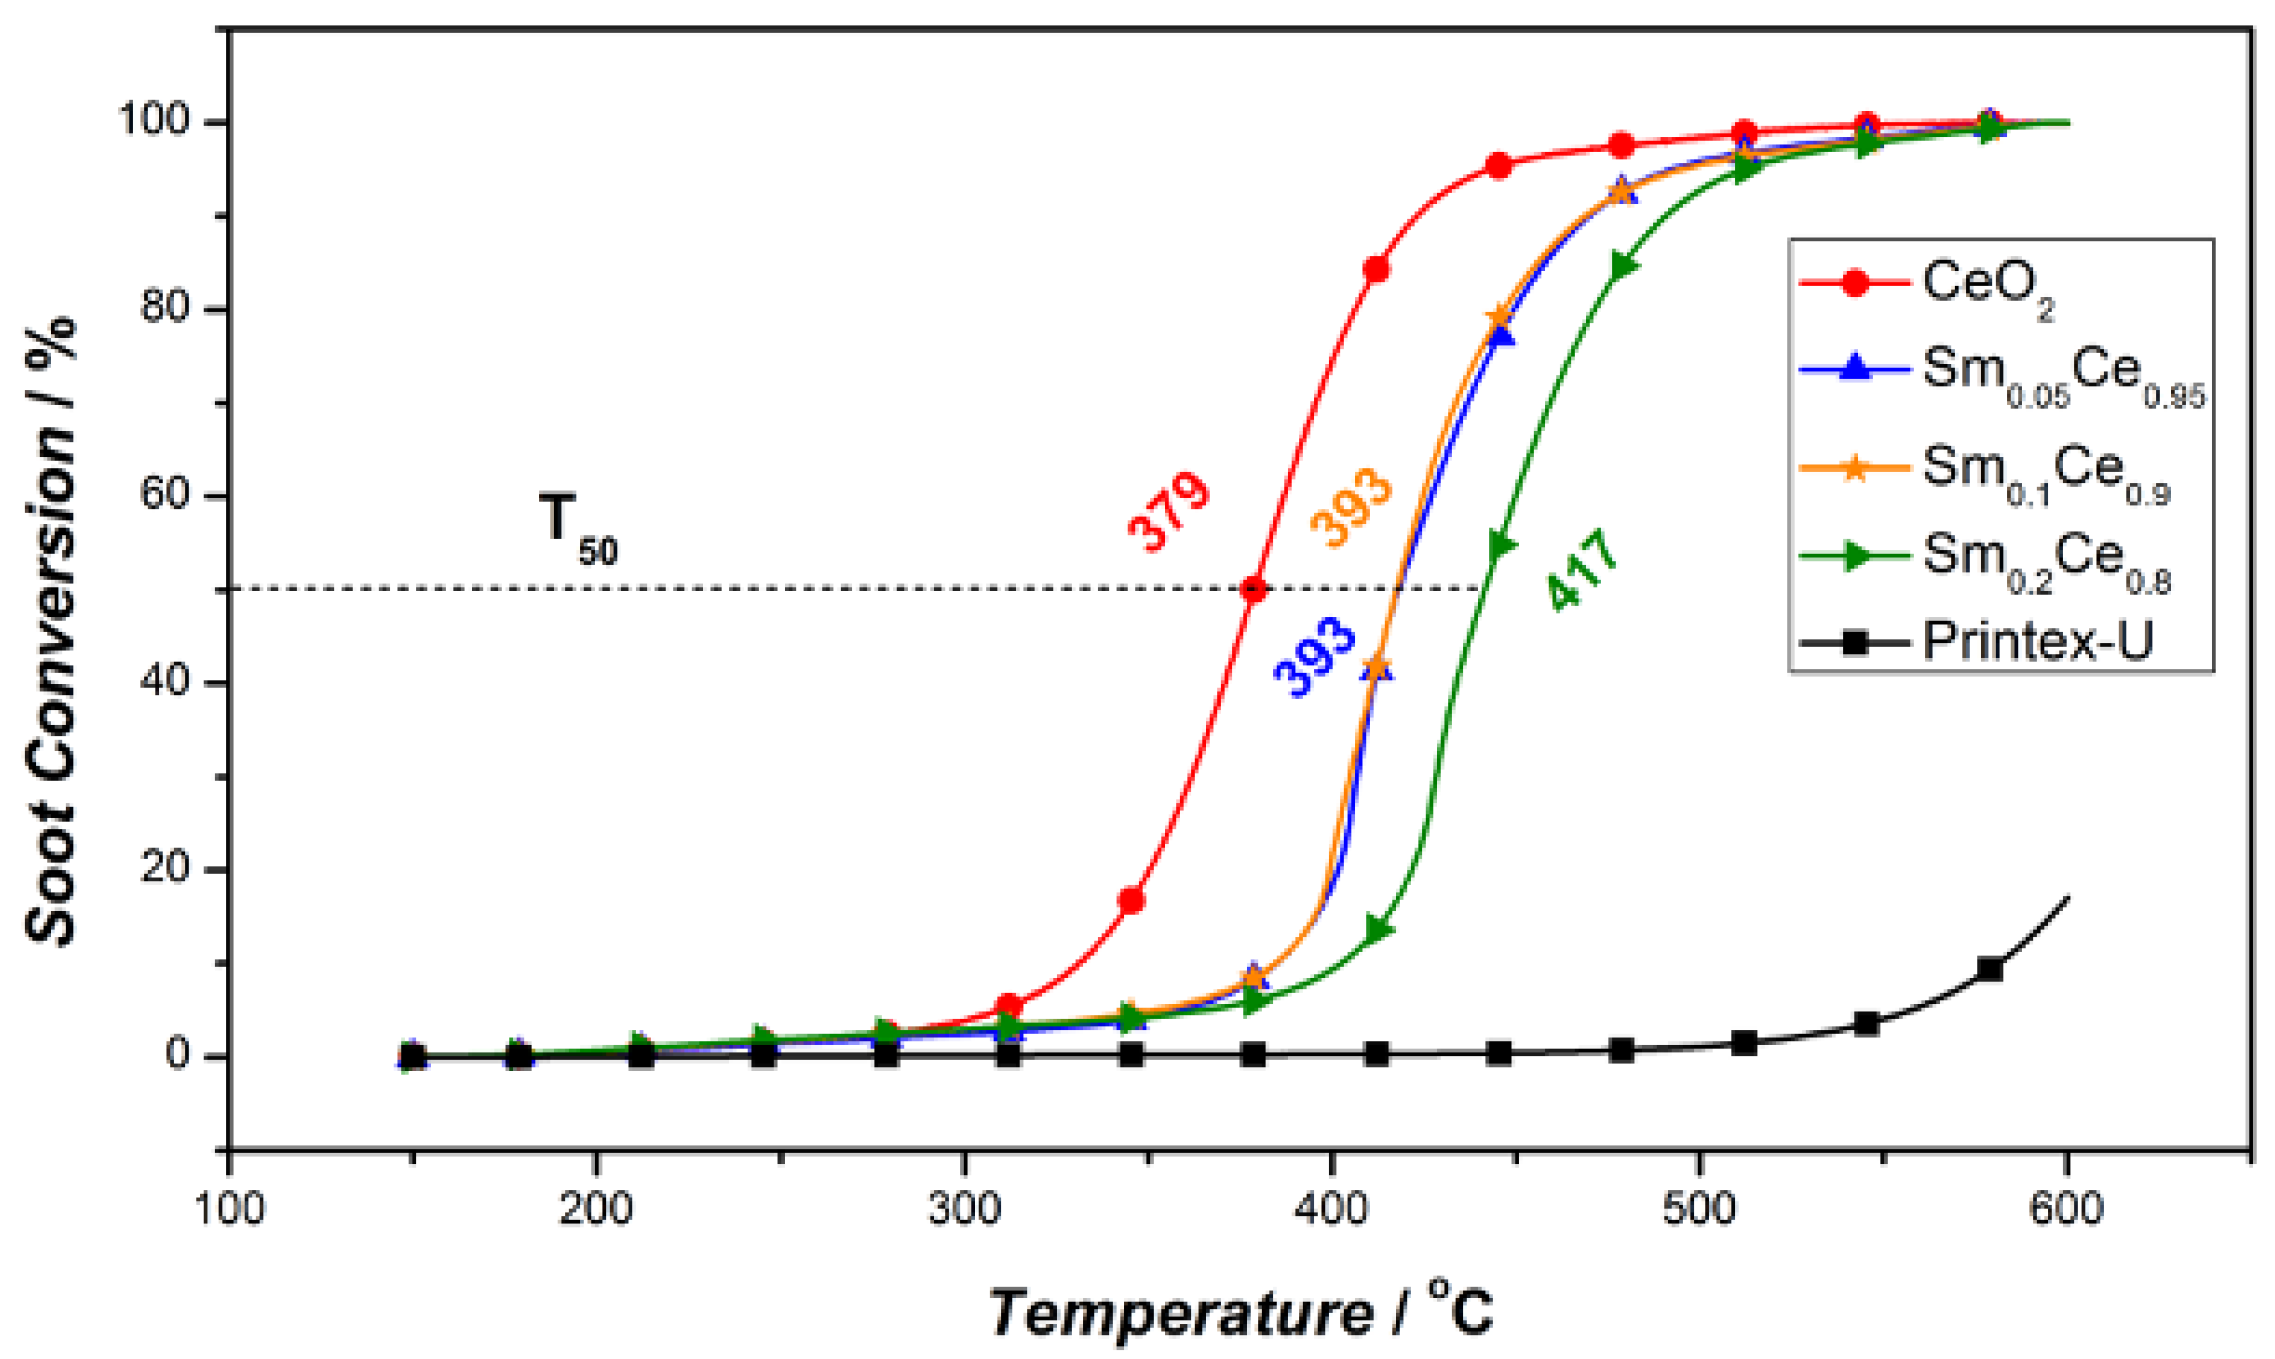
3.2. Activity Test
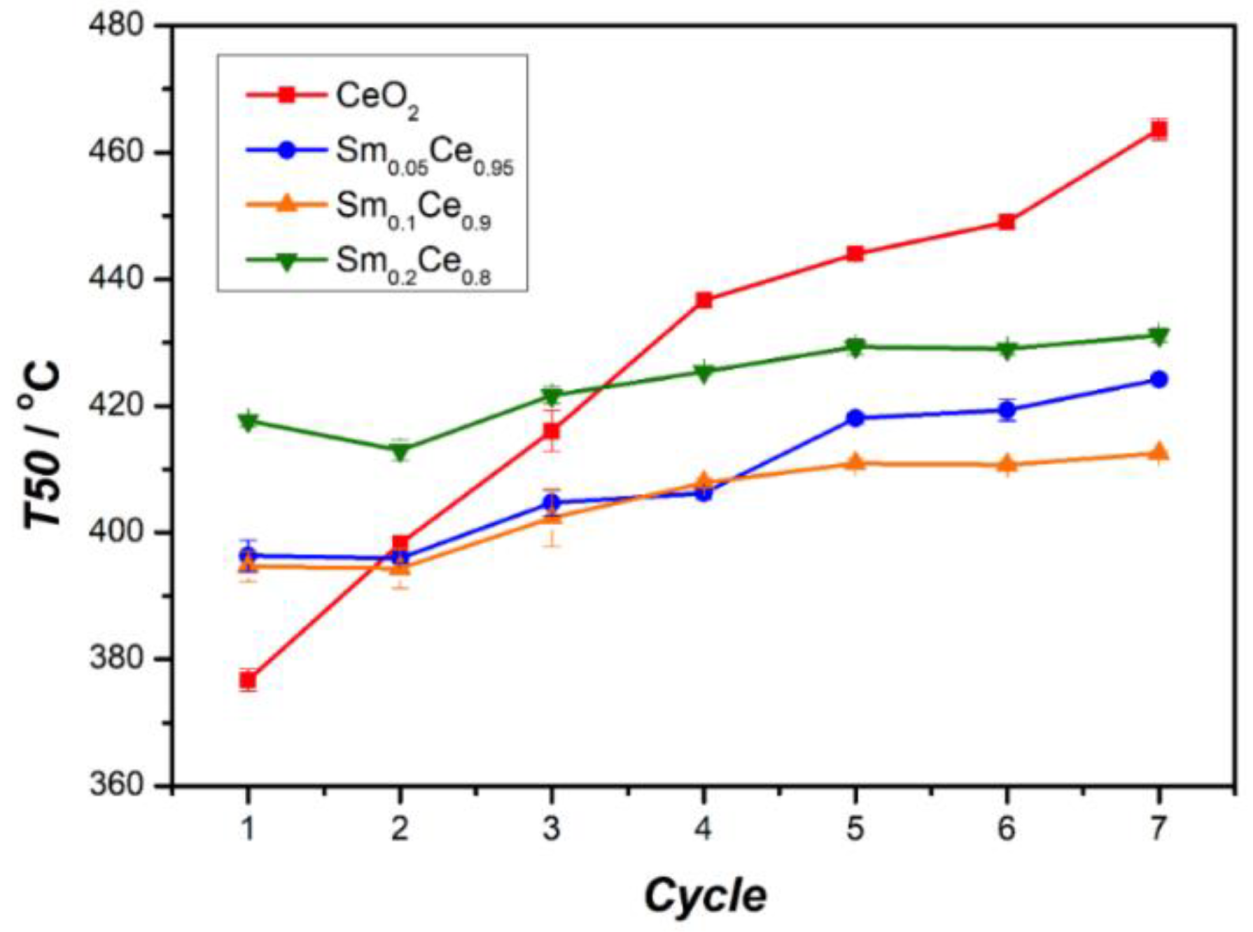
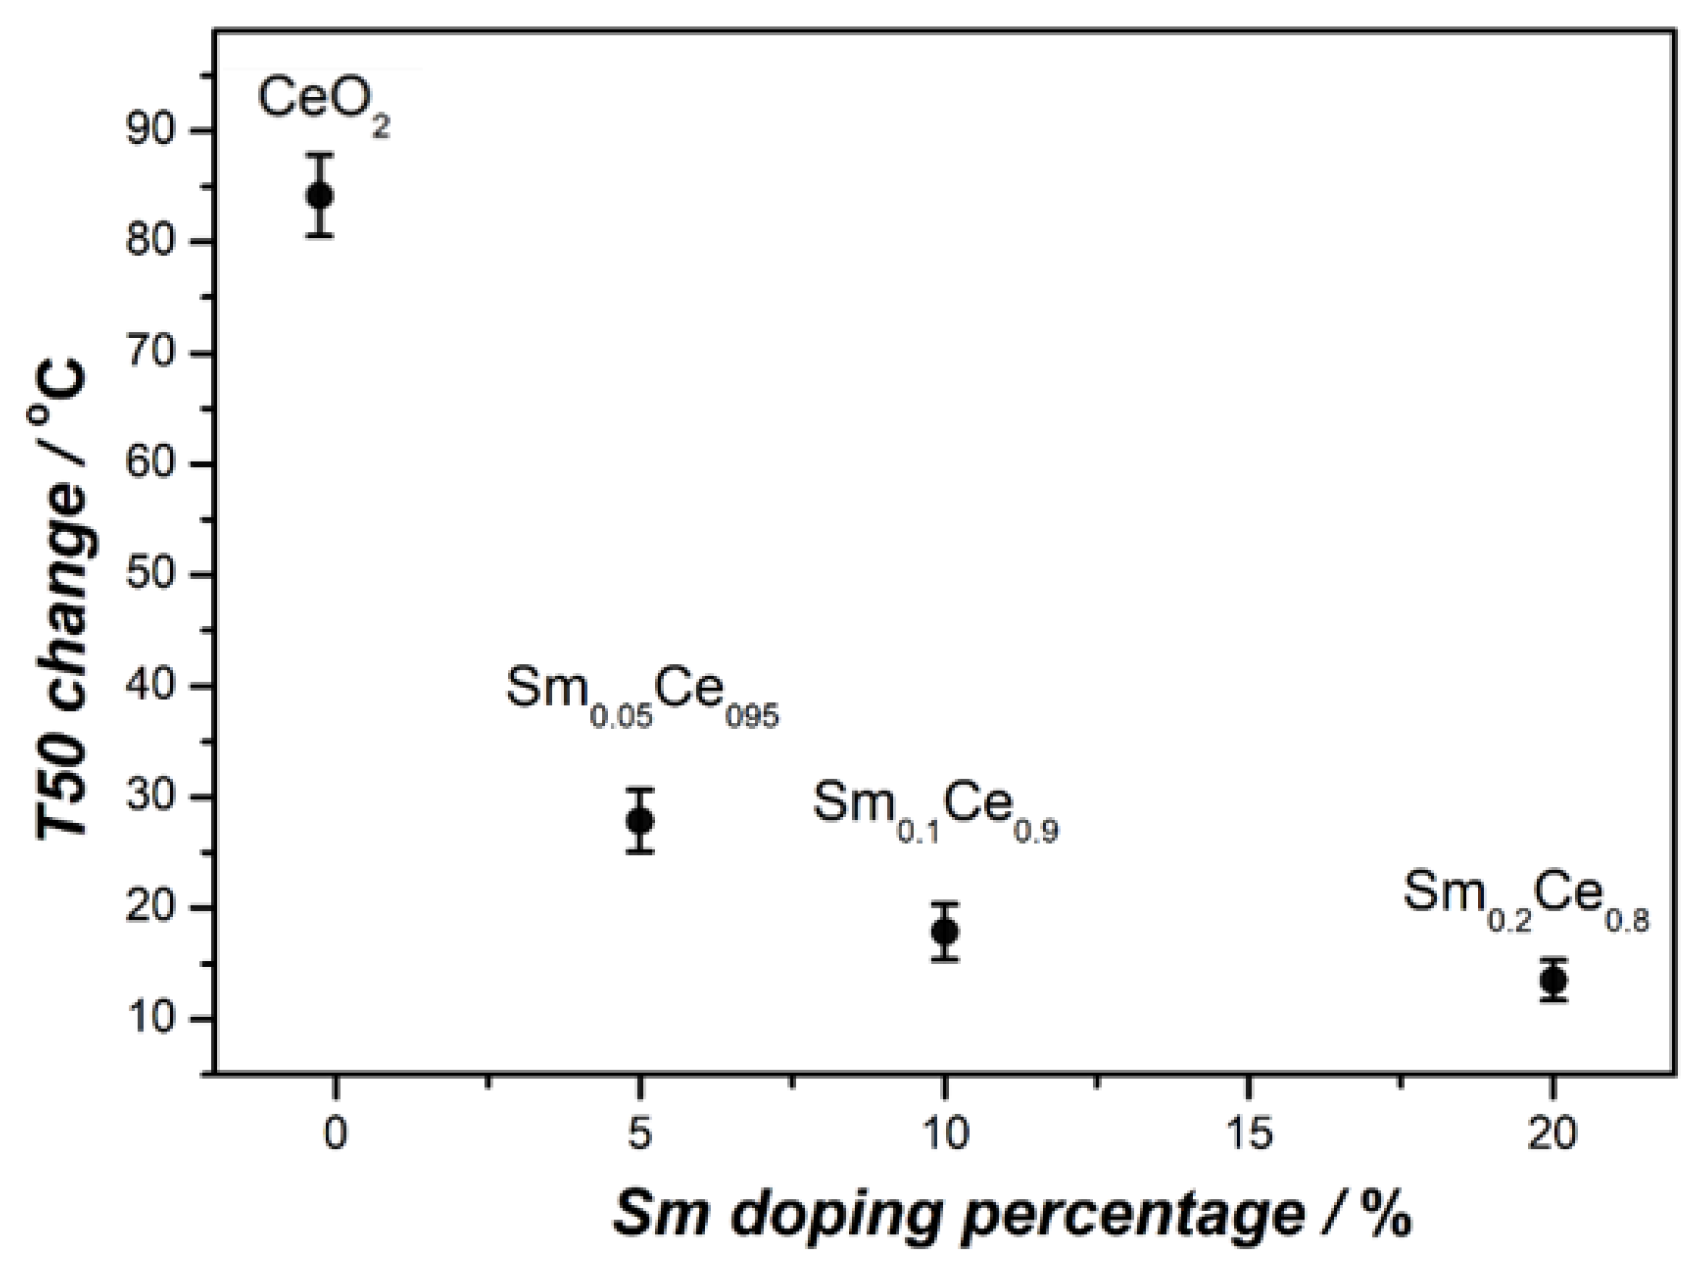
3.3. Stability Tests for Sm-Doped CeO2 Catalysts
4. Conclusions
Supplementary Materials
Author Contributions
Funding
Acknowledgments
Conflicts of Interest
References
- Liu, S.; Wu, X.; Weng, D.; Ran, R. Ceria-based catalysts for soot oxidation: A review. J. Rare Earths 2015, 33, 567–590. [Google Scholar] [CrossRef]
- Li, B.; Raj, A.; Croiset, E.; Wen, J.Z. Reactive Fe-O-Ce Sites in Ceria Catalysts for Soot Oxidation. Catalysts 2019, 9, 815. [Google Scholar] [CrossRef] [Green Version]
- Liang, Q.; Wu, X.; Weng, D.; Lu, Z. Selective oxidation of soot over Cu doped ceria/ceria–zirconia catalysts. Catal. Commun. 2008, 9, 202–206. [Google Scholar] [CrossRef]
- Aneggi, E.; de Leitenburg, C.; Dolcetti, G.; Trovarelli, A. Promotional effect of rare earths and transition metals in the combustion of diesel soot over CeO2 and CeO2–ZrO2. Catal. Today 2006, 114, 40–47. [Google Scholar] [CrossRef]
- Liu, S.; Wu, X.; Liu, W.; Chen, W.; Ran, R.; Li, M.; Weng, D. Soot oxidation over CeO2 and Ag/CeO2: Factors determining the catalyst activity and stability during reaction. J. Catal. 2016, 337, 188–198. [Google Scholar] [CrossRef]
- Corro, G.; Flores, A.; Pacheco-Aguirre, F.; Pal, U.; Bañuelos, F.; Ramirez, A.; Zehe, A. Biodiesel and fossil-fuel diesel soot oxidation activities of Ag/CeO2 catalyst. Fuel 2019, 250, 17–26. [Google Scholar] [CrossRef]
- Bueno-López, A. Diesel soot combustion ceria catalysts. Appl. Catal. B Environ. 2014, 146, 1–11. [Google Scholar] [CrossRef] [Green Version]
- Palmisano, P.; Russo, N.; Fino, P.; Fino, D.; Badini, C. High catalytic activity of SCS-synthesized ceria towards diesel soot combustion. Appl. Catal. B Environ. 2006, 69, 85–92. [Google Scholar] [CrossRef]
- Liu, W.; Flytzanistephanopoulos, M. Total oxidation of carbon monoxide and methane over transition metal fluorite oxide composite catalysts: I. Catalyst composition and activity. J. Catal. 1995, 153, 304–316. [Google Scholar] [CrossRef]
- Małecka, M.A.; Kępiński, L.; Miśta, W. Structure evolution of nanocrystalline CeO2 and CeLnOx mixed oxides (Ln = Pr, Tb, Lu) in O2 and H2 atmosphere and their catalytic activity in soot combustion. Appl. Catal. B Environ. 2007, 74, 290–298. [Google Scholar] [CrossRef]
- Gao, Y.; Duan, A.; Liu, S.; Wu, X.; Liu, W.; Li, M.; Chen, S.; Wang, X.; Weng, D. Study of Ag/CexNd1-xO2 nanocubes as soot oxidation catalysts for gasoline particulate filters: Balancing catalyst activity and stability by Nd doping. Appl. Catal. B Environ. 2017, 203, 116–126. [Google Scholar] [CrossRef]
- Xiong, L.; Yao, P.; Liu, S.; Li, S.; Deng, J.; Jiao, Y.; Chen, Y.; Wang, J. Soot oxidation over CeO2-ZrO2 based catalysts: The influence of external surface and low-temperature reducibility. Mol. Catal. 2019, 467, 16–23. [Google Scholar] [CrossRef]
- Zhang, H.; Wang, J.; Cao, Y.; Wang, Y.; Gong, M.; Chen, Y. Effect of Y on improving the thermal stability of MnOx-CeO2 catalysts for diesel soot oxidation. Chin. J. Catal. 2015, 36, 1333–1341. [Google Scholar] [CrossRef]
- Zhang, H.; Yuan, S.; Wang, J.; Gong, M.; Chen, Y. Effects of contact model and NOx on soot oxidation activity over Pt/MnOx-CeO2 and the reaction mechanisms. Chem. Eng. J. 2017, 327, 1066–1076. [Google Scholar] [CrossRef]
- Peralta, M.; Milt, V.; Cornaglia, L.; Querini, C. Stability of Ba, K/CeO2 catalyst during diesel soot combustion: Effect of temperature, water, and sulfur dioxide. J. Catal. 2006, 242, 118–130. [Google Scholar] [CrossRef]
- Peralta, M.A.; Zanuttini, M.S.; Querini, C.A. Activity and stability of BaKCo/CeO2 catalysts for diesel soot oxidation. Appl. Catal. B Environ. 2011, 110, 90–98. [Google Scholar] [CrossRef]
- Kurnatowska, M.; Mista, W.; Mazur, P.; Kepinski, L. Nanocrystalline Ce1−xRuxO2–Microstructure, stability and activity in CO and soot oxidation. Appl. Catal. B Environ. 2014, 148, 123–135. [Google Scholar] [CrossRef]
- Wenjuan, S.; Lihua, Y.; Na, M.; Jiali, Y. Catalytic activity and stability of K/CeO2 catalysts for diesel soot oxidation. Chin. J. Catal. 2012, 33, 970–976. [Google Scholar]
- Li, S.; Yan, S.; Xia, Y.; Cui, B.; Pu, Y.; Ye, Y.; Wang, D.; Liu, Y.-Q.; Chen, B. Oxidative reactivity enhancement for soot combustion catalysts by co-doping silver and manganese in ceria. Appl. Catal. A Gen. 2019, 570, 299–307. [Google Scholar] [CrossRef]
- Wei, Y.; Zhao, Z.; Li, T.; Liu, J.; Duan, A.; Jiang, G. The novel catalysts of truncated polyhedron Pt nanoparticles supported on three-dimensionally ordered macroporous oxides (Mn, Fe, Co, Ni, Cu) with nanoporous walls for soot combustion. Appl. Catal. B Environ. 2014, 146, 57–70. [Google Scholar] [CrossRef]
- Nascimento, L.F.; Lima, J.F.; Filho, P.C.D.S.; Serra, O.A. Effect of lanthanum loading on nanosized CeO2-ZnO solid catalysts supported on cordierite for diesel soot oxidation. J. Environ. Sci. 2018, 73, 58–68. [Google Scholar] [CrossRef] [PubMed]
- Kim, S.J.; Kim, S.W.; Park, Y.M.; Kim, K.J.; Choi, G.M. Effect of Gd-doped ceria interlayer on the stability of solid oxide electrolysis cell. Solid State Ion. 2016, 295, 25–31. [Google Scholar] [CrossRef]
- Lu, H.-F.; Zhou, Y.; Han, W.-F.; Huang, H.-F.; Chen, Y.-F. High thermal stability of ceria-based mixed oxide catalysts supported on ZrO2 for toluene combustion. Catal. Sci. Technol. 2013, 3, 1480–1484. [Google Scholar] [CrossRef]
- Dai, Q.; Wang, X.; Lu, G. Low-temperature catalytic combustion of trichloroethylene over cerium oxide and catalyst deactivation. Appl. Catal. B Environ. 2008, 81, 192–202. [Google Scholar] [CrossRef]
- Zhang, H.-L.; Zhu, Y.; Wang, S.-D.; Zhao, M.; Gong, M.-C.; Chen, Y.-Q. Activity and thermal stability of Pt/Ce0.64Mn0.16R0.2Ox (R = Al, Zr, La, or Y) for soot and NO oxidation. Fuel Process. Technol. 2015, 137, 38–47. [Google Scholar] [CrossRef]
- Polychronopoulou, K.; Zedan, A.F.; Katsiotis, M.; Baker, M.; AlKhoori, A.; AlQaradawi, S.Y.; Hinder, S.; AlHassan, S. Rapid microwave assisted sol-gel synthesis of CeO2 and CexSm1-xO2 nanoparticle catalysts for CO oxidation. Mol. Catal. 2017, 428, 41–55. [Google Scholar] [CrossRef]
- Mandal, S.; Bando, K.K.; Santra, C.; Maity, S.; James, O.O.; Mehta, D.; Chowdhury, B. Sm-CeO2 supported gold nanoparticle catalyst for benzyl alcohol oxidation using molecular O2. Appl. Catal. A Gen. 2013, 452, 94–104. [Google Scholar] [CrossRef]
- Wattanathana, W.; Veranitisagul, C.; Wannapaiboon, S.; Klysubun, W.; Koonsaeng, N.; Laobuthee, A. Samarium doped ceria (SDC) synthesized by a metal triethanolamine complex decomposition method: Characterization and an ionic conductivity study. Ceram. Int. 2017, 43, 9823–9830. [Google Scholar] [CrossRef]
- Stambouli, A.B.; Traversa, E. Solid oxide fuel cells (SOFCs): A review of an environmentally clean and efficient source of energy. Renew. Sustain. Energy Rev. 2002, 6, 433–455. [Google Scholar] [CrossRef]
- Nechache, A.; Cassir, M.; Ringuedé, A. Solid oxide electrolysis cell analysis by means of electrochemical impedance spectroscopy: A review. J. Power Sources 2014, 258, 164–181. [Google Scholar] [CrossRef]
- Gardini, D.; Christensen, J.M.; Damsgaard, C.D.; Jensen, A.D.; Wagner, J.B. Visualizing the mobility of silver during catalytic soot oxidation. Appl. Catal. B Environ. 2016, 183, 28–36. [Google Scholar] [CrossRef] [Green Version]
- Liu, J.; Zhao, Z.; Chen, Y.; Xu, C.; Duan, A.; Jiang, G. Different valent ions-doped cerium oxides and their catalytic performances for soot oxidation. Catal. Today 2011, 175, 117–123. [Google Scholar] [CrossRef]
- Sudarsanam, P.; Kuntaiah, K.; Reddy, B.M. Promising ceria–samaria-based nano-oxides for low temperature soot oxidation: A combined study of structure–activity properties. New J. Chem. 2014, 38, 5991–6001. [Google Scholar] [CrossRef]
- Anantharaman, A.P.; Geethu, J.; Dasari, H.P.; Lee, J.-H.; Dasari, H.; Babu, G.U.B. Ceria-samarium binary metal oxides: A comparative approach towards structural properties and soot oxidation activity. Mol. Catal. 2018, 451, 247–254. [Google Scholar] [CrossRef]
- Zhang, Z.; Han, D.; Wei, S.; Zhang, Y. Determination of active site densities and mechanisms for soot combustion with O2 on Fe-doped CeO2 mixed oxides. J. Catal. 2010, 276, 16–23. [Google Scholar] [CrossRef]
- Andana, T.; Piumetti, M.; Bensaid, S.; Russo, N.; Fino, D.; Pirone, R. Nanostructured ceria-praseodymia catalysts for diesel soot combustion. Appl. Catal. B Environ. 2016, 197, 125–137. [Google Scholar] [CrossRef]
- Venkataswamy, P.; Jampaiah, D.; Rao, K.N.; Reddy, B.M. Nanostructured Ce0.7Mn0.3O2−δ and Ce0.7Fe0.3O2−δ solid solutions for diesel soot oxidation. Appl. Catal. A Gen. 2014, 488, 1–10. [Google Scholar] [CrossRef]
- Miceli, P.; Bensaid, S.; Russo, N.; Fino, D. Effect of the morphological and surface properties of CeO2-based catalysts on the soot oxidation activity. Chem. Eng. J. 2015, 278, 190–198. [Google Scholar] [CrossRef]
- Piumetti, M.; Bensaid, S.; Russo, N.; Fino, D. Investigations into nanostructured ceria–zirconia catalysts for soot combustion. Appl. Catal. B Environ. 2016, 180, 271–282. [Google Scholar] [CrossRef]
- Tang, Y.; Qiao, H.; Wang, H.; Tao, P. Nanoparticulate Mn0.3Ce0.7O2: A novel electrocatalyst with improved power performance for metal/air batteries. J. Mater. Chem. A 2013, 1, 12512–12518. [Google Scholar] [CrossRef]
- Shannon, R.D. Revised effective ionic radii and systematic studies of interatomic distances in halides and chalcogenides. Acta Crystallogr. Sect. A Cryst. Phys. Diffr. Theor. Gen. Crystallogr. 1976, 32, 751–767. [Google Scholar] [CrossRef]
- Piumetti, M.; Bensaid, S.; Russo, N.; Fino, D. Nanostructured ceria-based catalysts for soot combustion: Investigations on the surface sensitivity. Appl. Catal. B Environ. 2015, 165, 742–751. [Google Scholar] [CrossRef]
- Larachi, F.; Pierre, J.; Adnot, A.; Bernis, A. Ce 3d XPS study of composite CexMn1−xO2−y wet oxidation catalysts. Appl. Surf. Sci. 2002, 195, 236–250. [Google Scholar] [CrossRef]
- Trudeau, M.; Tschöpe, A.; Ying, J. XPS investigation of surface oxidation and reduction in nanocrystalline CexLa1−xO2−y. Surf. Interface Anal. 1995, 23, 219–226. [Google Scholar] [CrossRef]
- Liu, B.; Li, C.; Zhang, G.; Yao, X.; Chuang, S.S.; Li, Z. Oxygen vacancy promoting dimethyl carbonate synthesis from CO2 and methanol over Zr-doped CeO2 nanorods. ACS Catal. 2018, 8, 10446–10456. [Google Scholar] [CrossRef]
- Li, H.; Li, K.; Wang, H.; Zhu, X.; Wei, Y.; Yan, D.; Cheng, X.; Zhai, K. Soot combustion over Ce1−xFexO2−δ and CeO2/Fe2O3 catalysts: Roles of solid solution and interfacial interactions in the mixed oxides. Appl. Surf. Sci. 2016, 390, 513–525. [Google Scholar] [CrossRef]
- Wei, Y.; Liu, J.; Zhao, Z.; Duan, A.; Jiang, G. The catalysts of three-dimensionally ordered macroporous Ce1−xZrxO2−supported gold nanoparticles for soot combustion: The metal–support interaction. J. Catal. 2012, 287, 13–29. [Google Scholar] [CrossRef]
- Jaoude, M.A.; Polychronopoulou, K.; Hinder, S.; Katsiotis, M.; Baker, M.; Greish, Y.; Alhassan, S. Synthesis and properties of 1D Sm-doped CeO2 composite nanofibers fabricated using a coupled electrospinning and sol–gel methodology. Ceram. Int. 2016, 42, 10734–10744. [Google Scholar] [CrossRef]
- Raaen, S. Adsorption of Carbon Dioxide on Mono-Layer Thick Oxidized Samarium Films on Ni(100). Nanomaterials 2021, 11, 2064. [Google Scholar] [CrossRef]
- Filtschew, A.; Hofmann, K.; Hess, C. Ceria and its defect structure: New insights from a combined spectroscopic approach. J. Phys. Chem. C 2016, 120, 6694–6703. [Google Scholar] [CrossRef]
- Li, B.; Sediako, A.D.; Zhao, P.; Li, J.; Croiset, E.; Thomson, M.J.; Wen, J.Z. Real-time observation of Carbon oxidation by Driven Motion of Catalytic Ceria Nanoparticles within Low pressure oxygen. Sci. Rep. 2019, 9, 8082. [Google Scholar] [CrossRef] [PubMed] [Green Version]


| Catalyst | Crystallite Size/nm | Lattice Parameter/Å | SBET/m2g−1 |
|---|---|---|---|
| CeO2-fresh | 12.33 (±0.09) | 5.405 (±0.0018) | 45.5 (±1.57) |
| Sm0.05Ce0.95-fresh | 12.43 (±0.19) | 5.424 (±0.0075) | 42.2 (±0.99) |
| Sm0.1Ce0.9-fresh | 11.89 (±0.17) | 5.432 (±0.0028) | 48.3 (±0.78) |
| Sm0.2Ce0.8-fresh | 13.61 (±0.06) | 5.442 (±0.0014) | 40.9 (±1.94) |
| CeO2-spent | 14.52 (±0.13)/+17.8% | 5.418 (±0.0015) | 40.9 (±1.43)/−10.1% |
| Sm0.05Ce0.95-spent | 14.71 (±0.07)/+18.3% | 5.430 (±0.0015) | 40.5 (±0.75)/−4.0% |
| Sm0.1Ce0.9-spent | 13.33 (±0.11)/+12.1% | 5.436 (±0.0032) | 46.2 (±2.36)/−4.3% |
| Sm0.2Ce0.8-spent | 14.26 (±0.12)/+4.8% | 5.445 (±0.0087) | 40.2 (±1.52)/−1.7% |
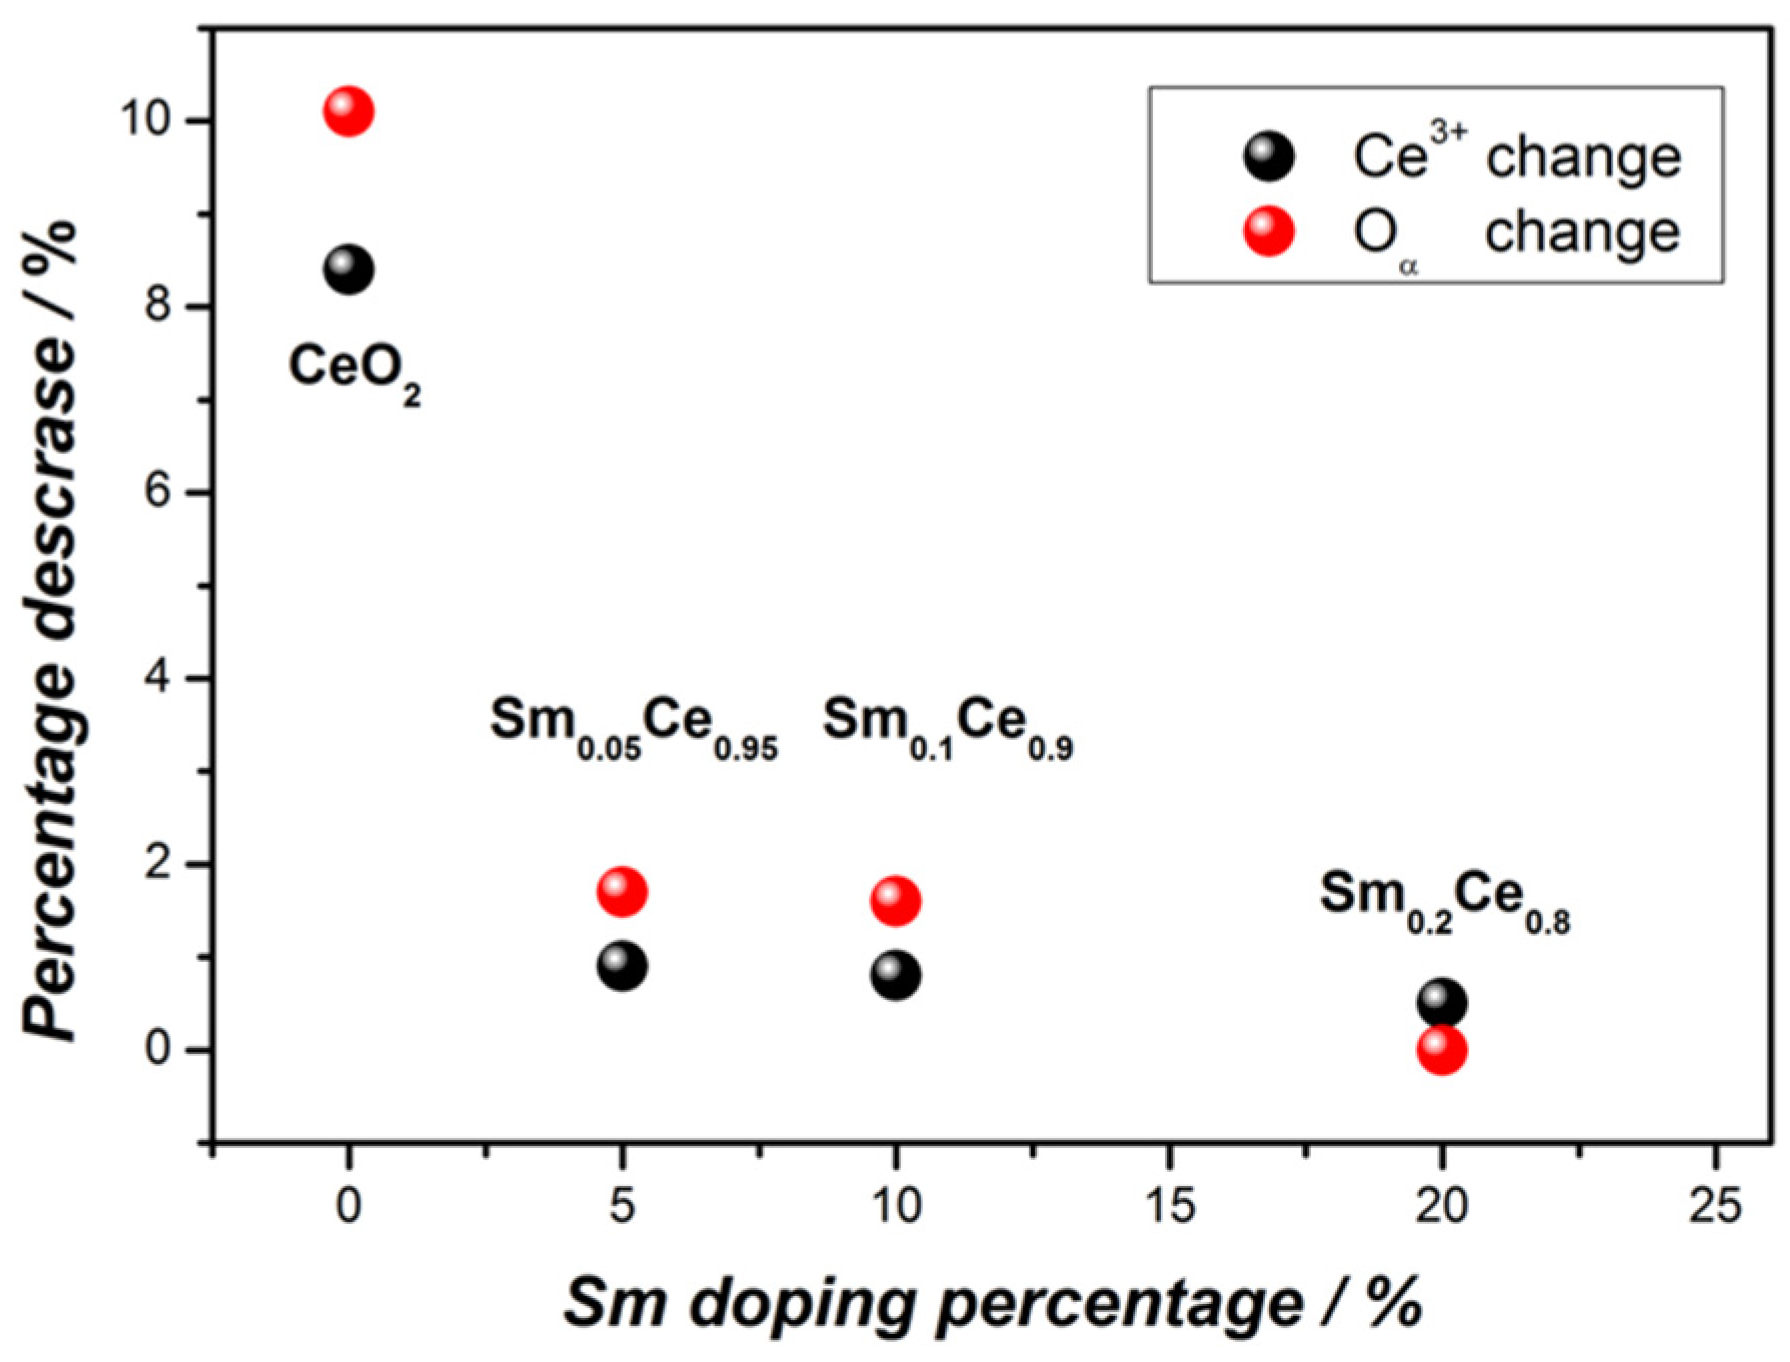
| Catalyst | CeO2 | Sm0.05Ce0.95 | Sm0.1Ce0.9 | Sm0.2Ce0.8 |
|---|---|---|---|---|
| Ce3+ (%)-fresh | 24.2 | 18.8 | 19.3 | 17.3 |
| Ce3+ (%)-spent | 15.8 | 17.9 | 18.5 | 16.8 |
| Oα (%)-fresh | 39.6 | 39.1 | 39.2 | 34.2 |
| Oα (%)-spent | 29.5 | 37.4 | 37.6 | 34.2 |
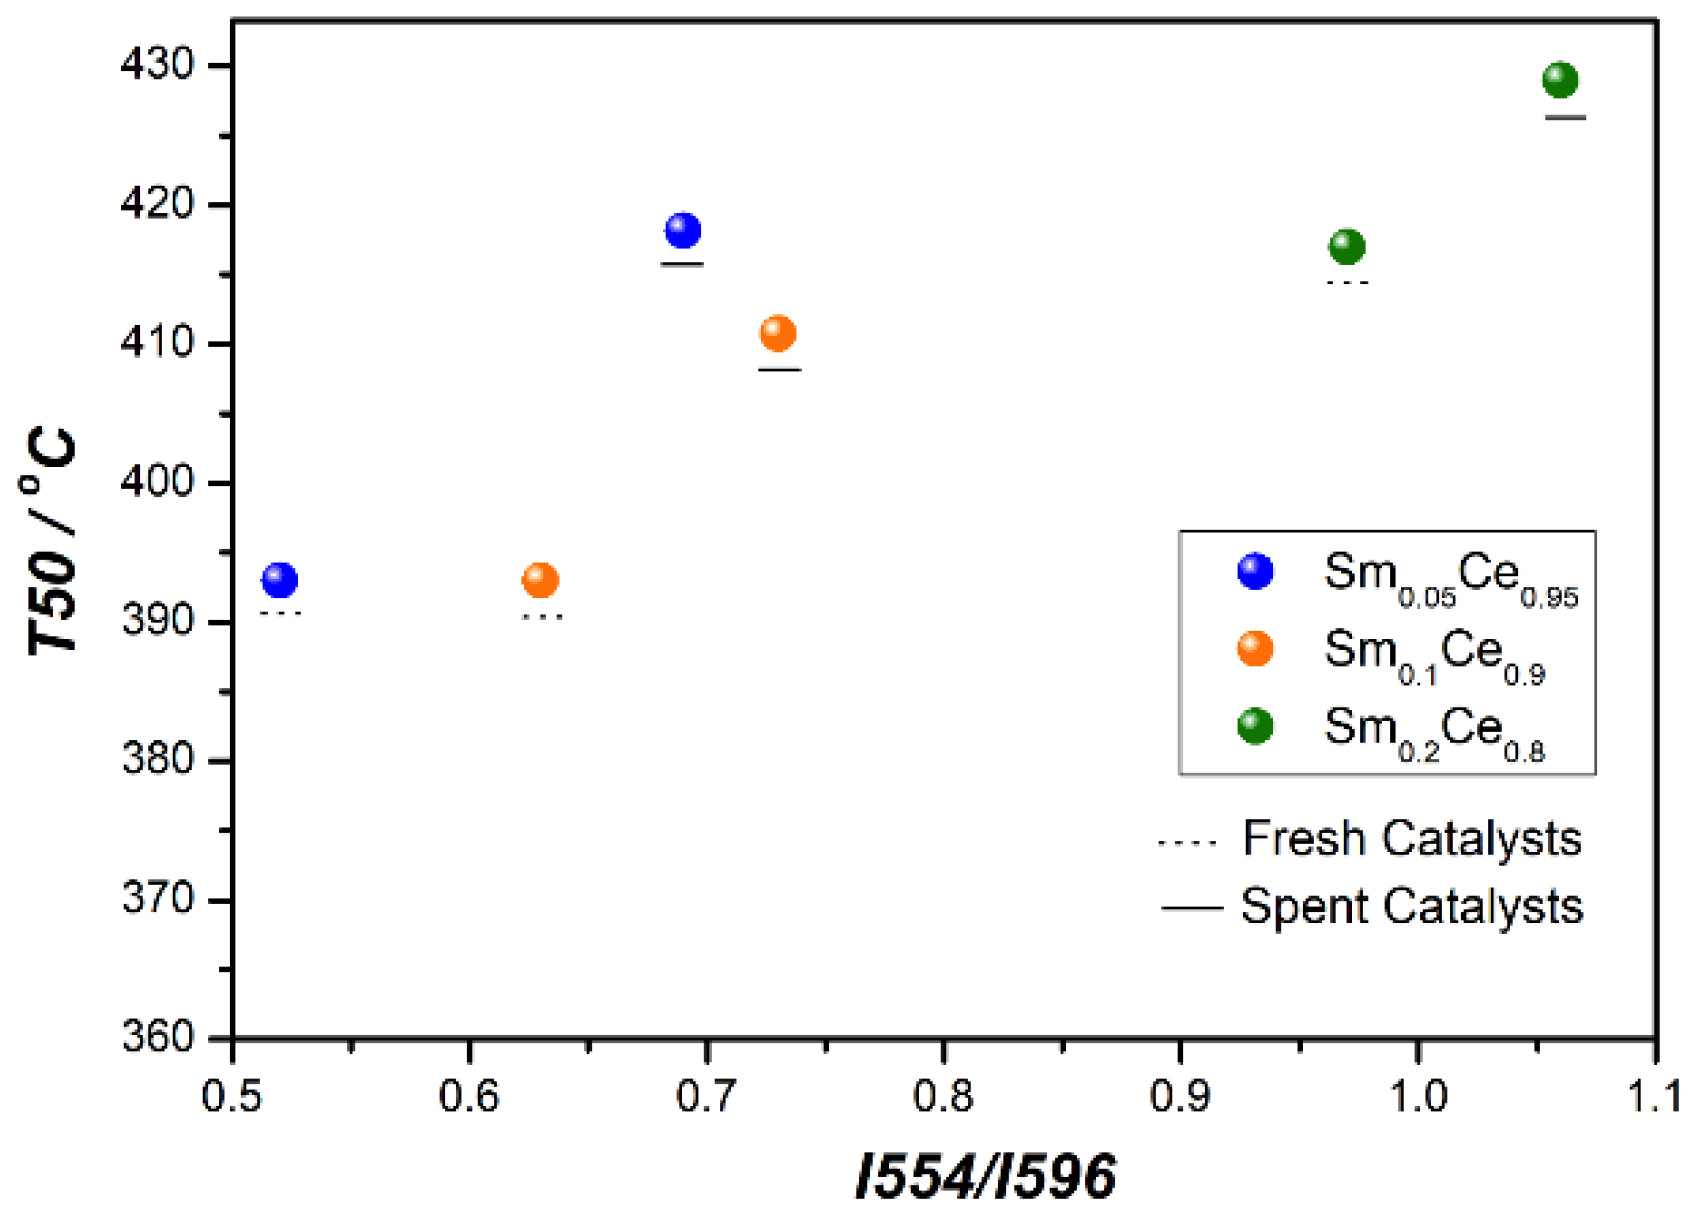
| Sm0.05Ce0.95 | Sm0.1Ce0.9 | Sm0.2Ce0.8 | |
|---|---|---|---|
| I554/I596 fresh | 0.52 | 0.63 | 0.97 |
| I554/I596 spent | 0.69 | 0.73 | 1.06 |
Publisher’s Note: MDPI stays neutral with regard to jurisdictional claims in published maps and institutional affiliations. |
© 2022 by the authors. Licensee MDPI, Basel, Switzerland. This article is an open access article distributed under the terms and conditions of the Creative Commons Attribution (CC BY) license (https://creativecommons.org/licenses/by/4.0/).
Share and Cite
Li, B.; Croiset, E.; Wen, J.Z. Influence of Surface Properties of Nanostructured Ceria-Based Catalysts on Their Stability Performance. Nanomaterials 2022, 12, 392. https://doi.org/10.3390/nano12030392
Li B, Croiset E, Wen JZ. Influence of Surface Properties of Nanostructured Ceria-Based Catalysts on Their Stability Performance. Nanomaterials. 2022; 12(3):392. https://doi.org/10.3390/nano12030392
Chicago/Turabian StyleLi, Boyu, Eric Croiset, and John Z. Wen. 2022. "Influence of Surface Properties of Nanostructured Ceria-Based Catalysts on Their Stability Performance" Nanomaterials 12, no. 3: 392. https://doi.org/10.3390/nano12030392
APA StyleLi, B., Croiset, E., & Wen, J. Z. (2022). Influence of Surface Properties of Nanostructured Ceria-Based Catalysts on Their Stability Performance. Nanomaterials, 12(3), 392. https://doi.org/10.3390/nano12030392