
Preparation of a Sustainable Shape-Stabilized Phase Change Material for Thermal Energy Storage Based on Mg2+-Doped CaCO3/PEG Composites

 ,
,  , , , ,
  ,
,  and
and 
Abstract
1. Introduction
2. Materials and Methods
2.1. Chemicals
2.2. Hydrothermal Method
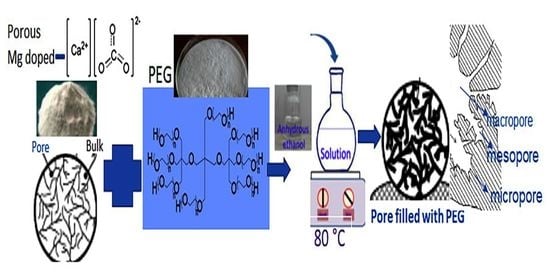
2.3. Preparation of Composite PCM
2.4. Characterization
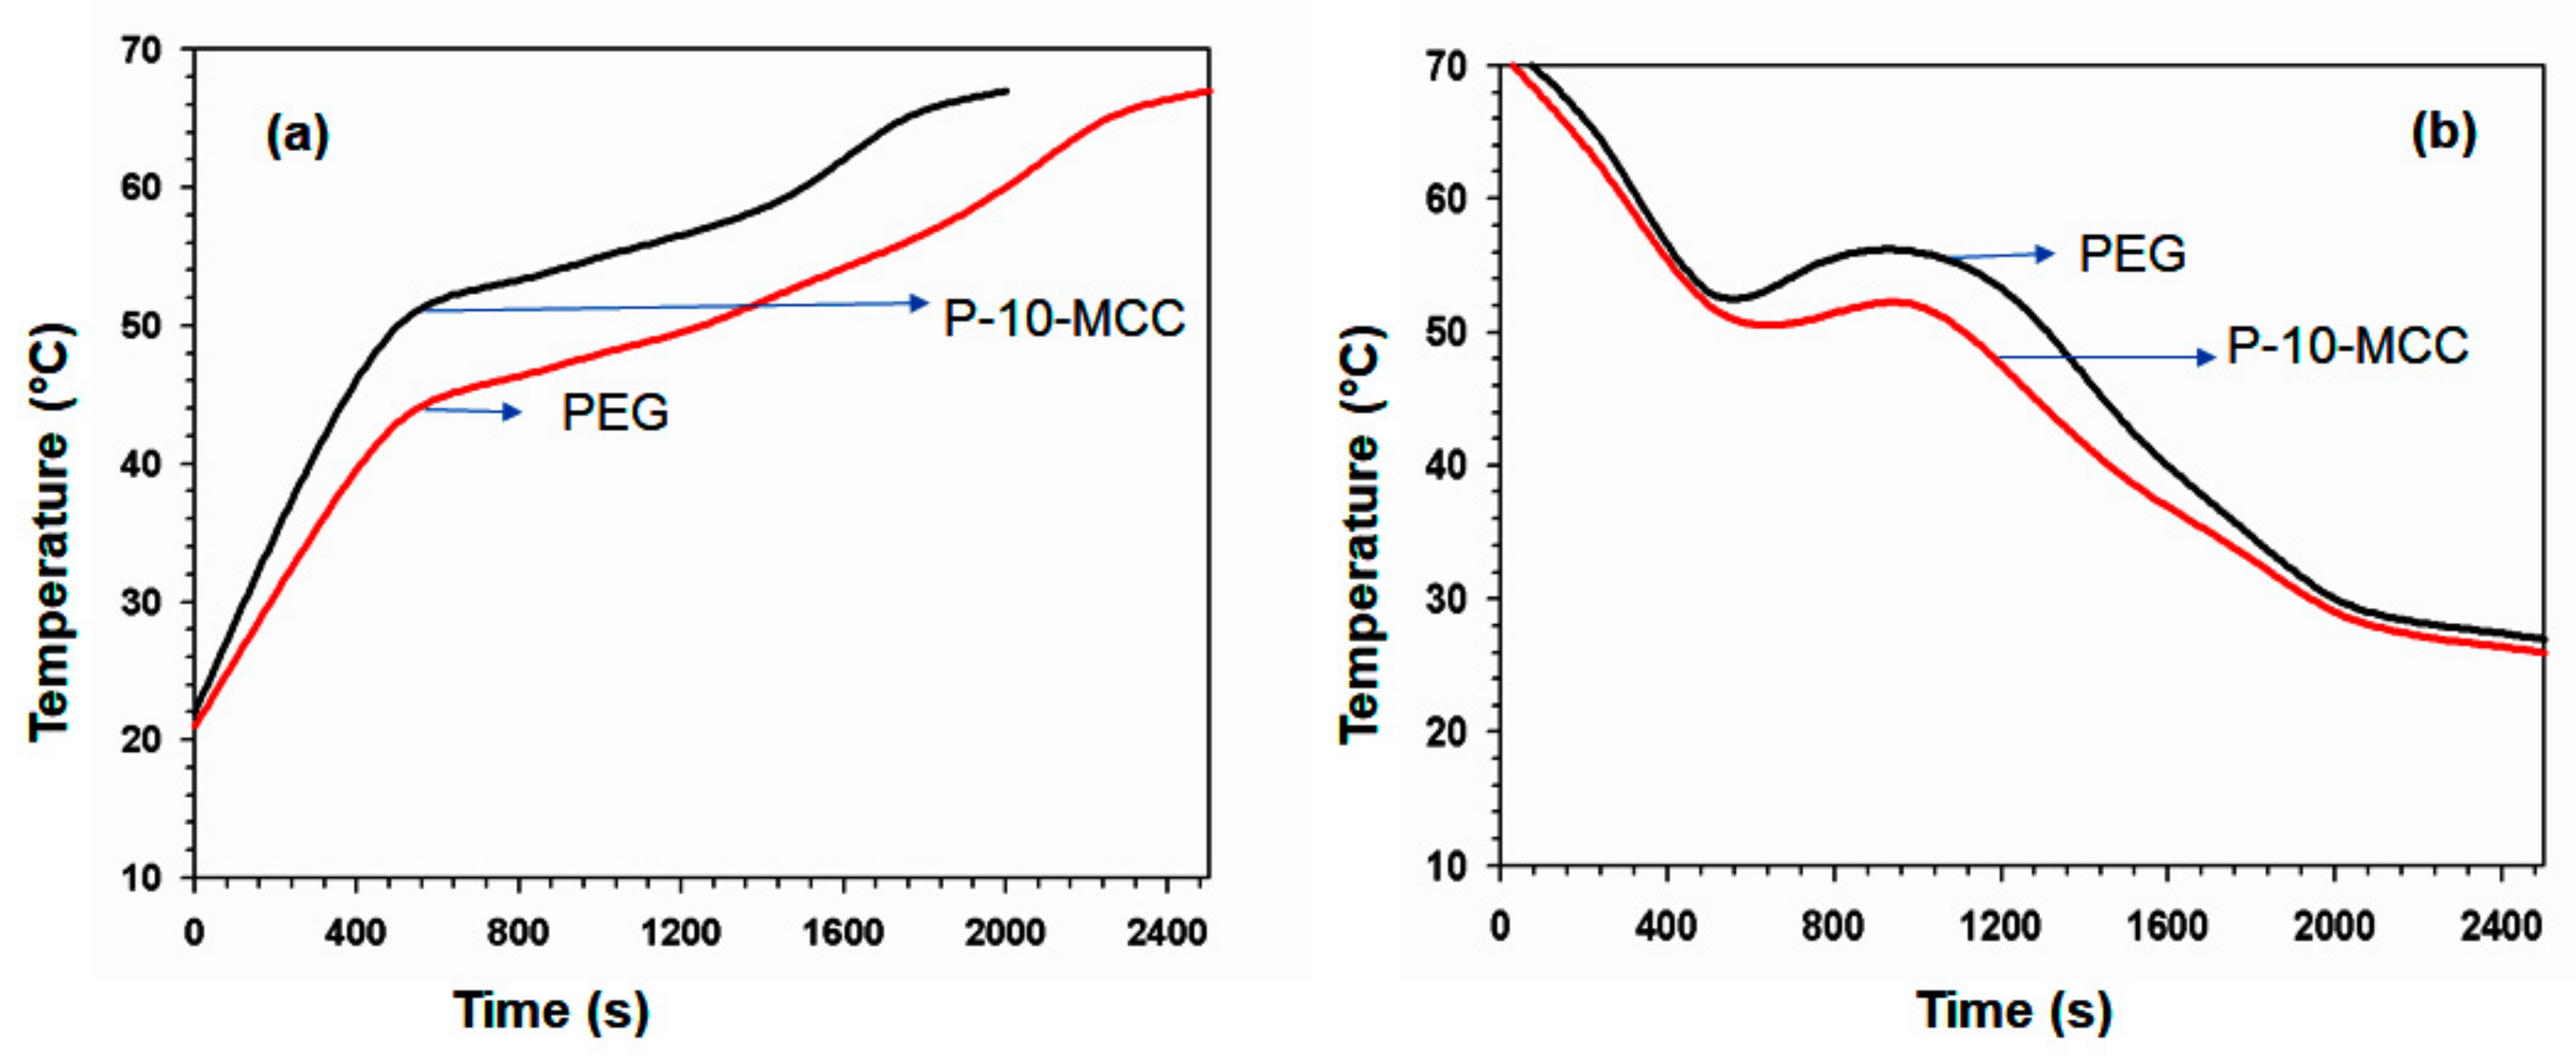
2.5. Light-to-Heat Energy Conversion Experiment
3. Results and Discussion
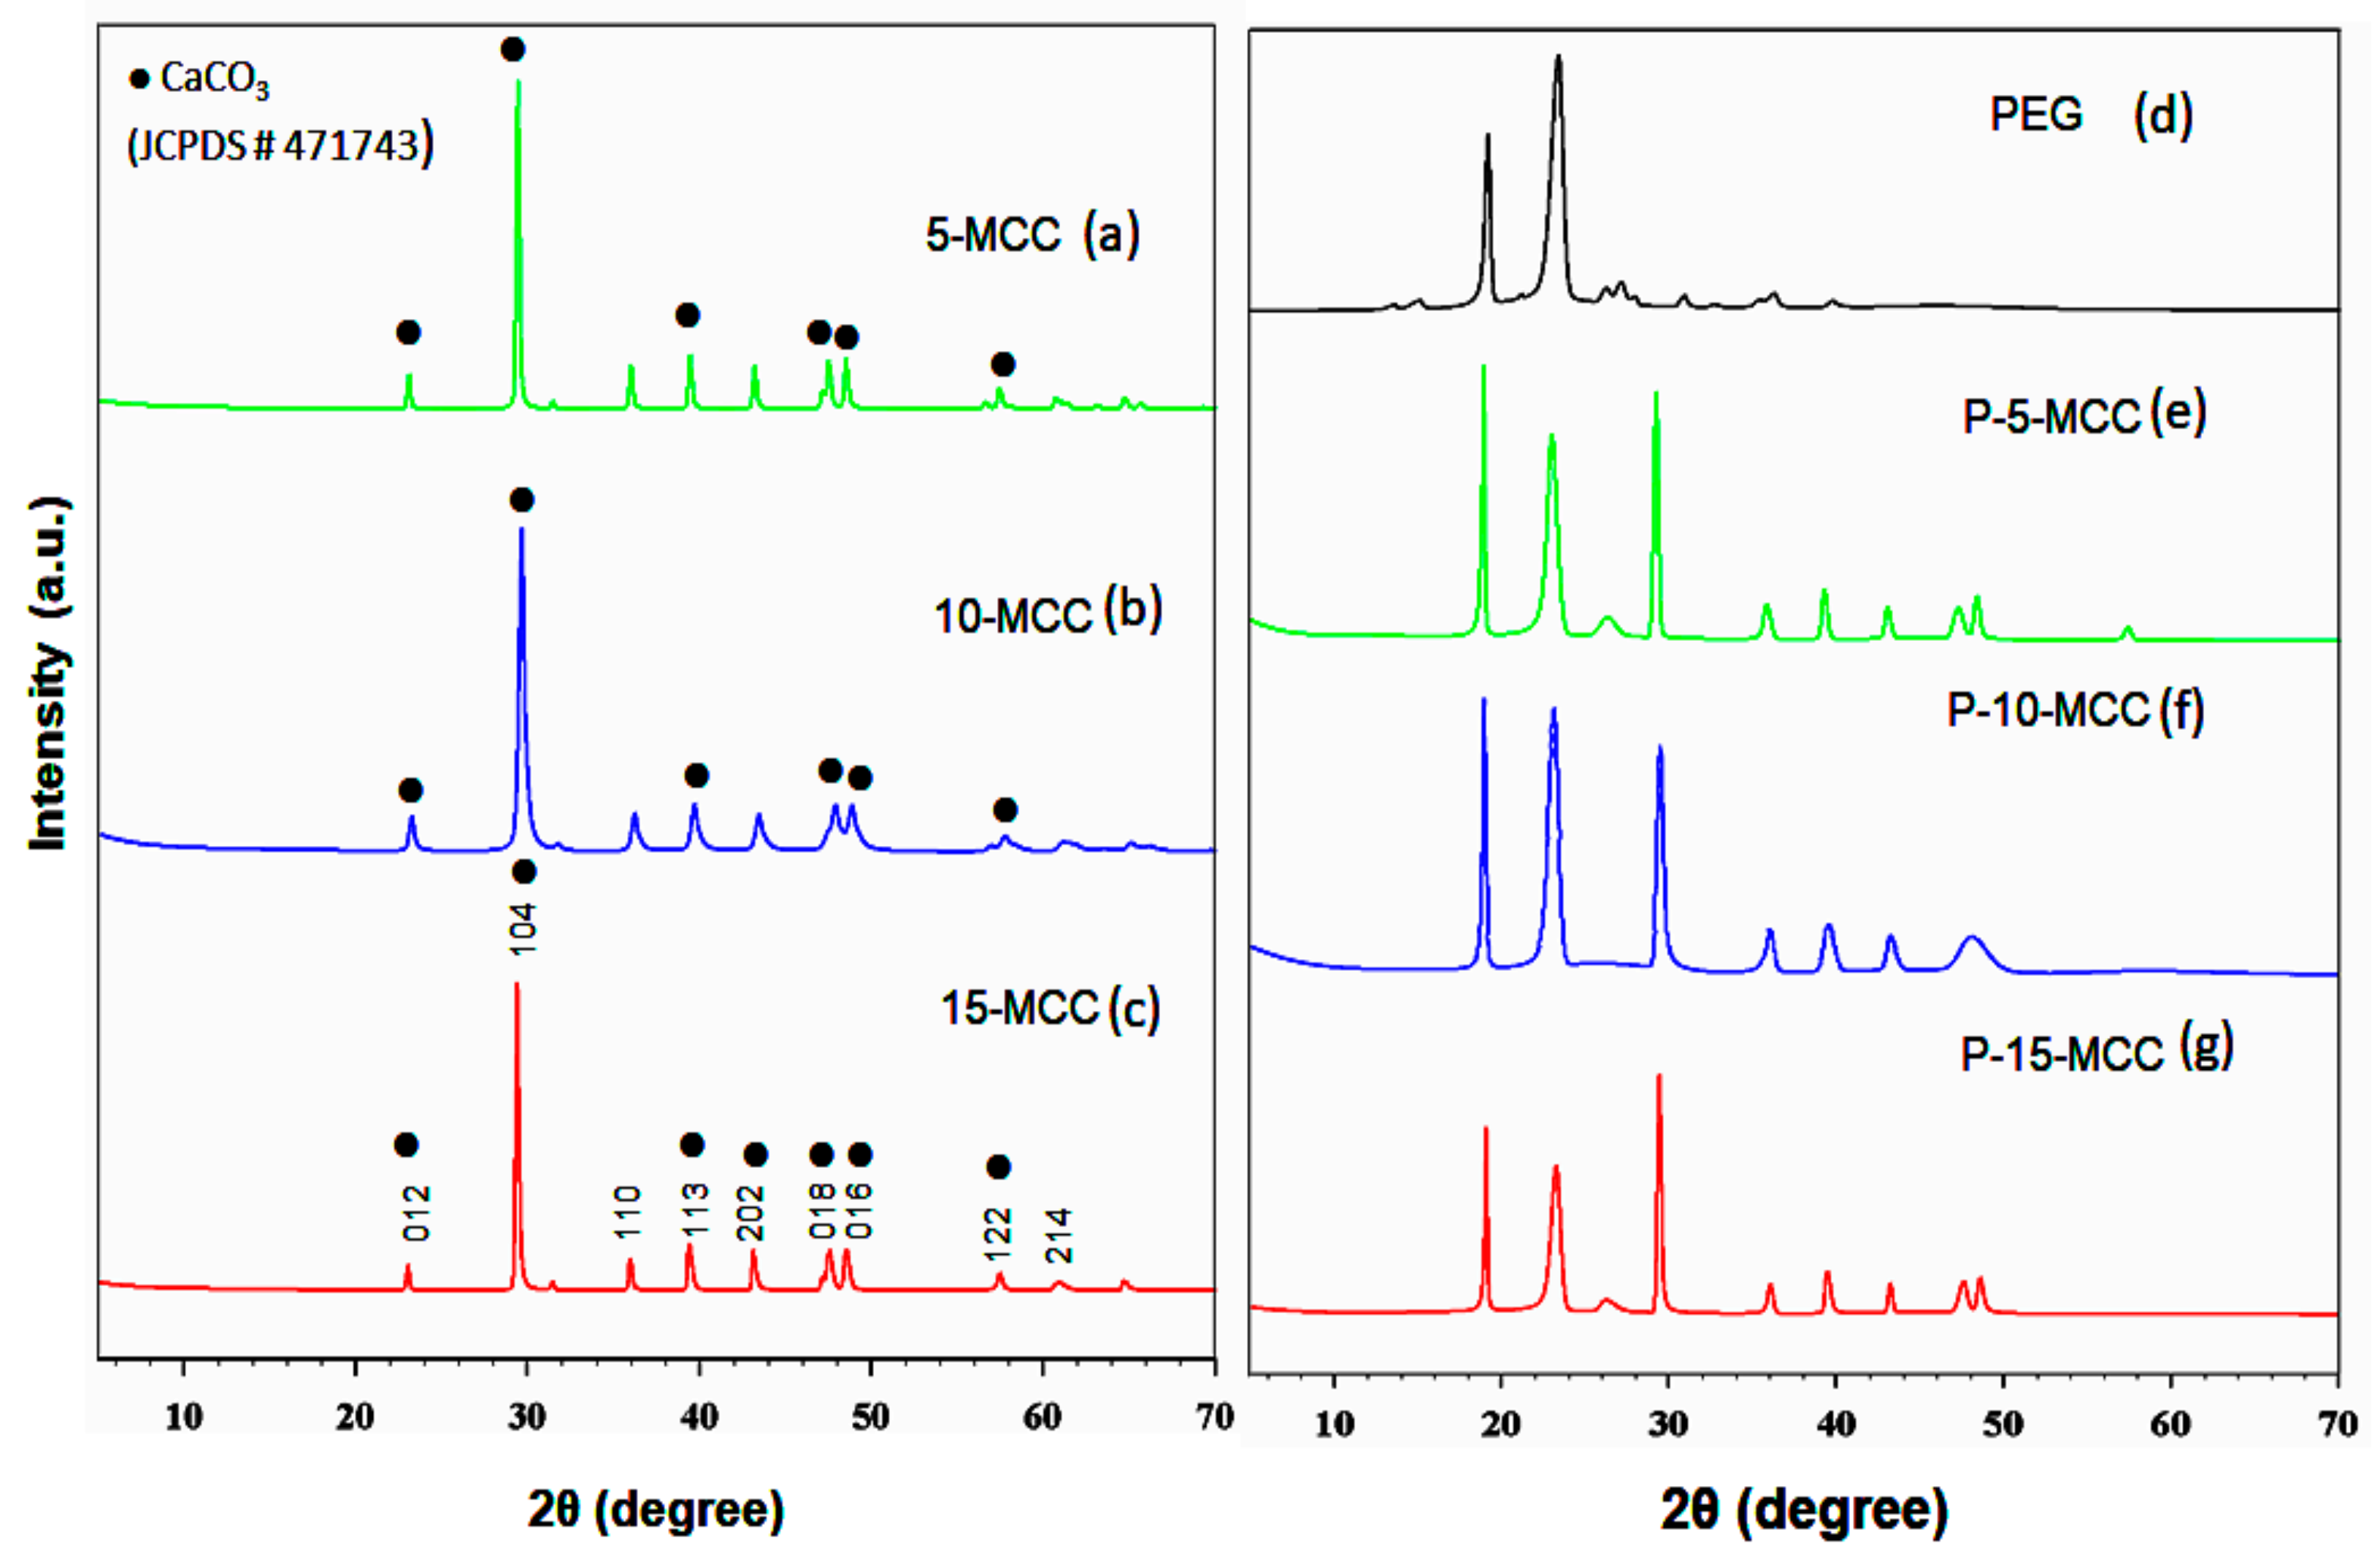
3.1. XRD
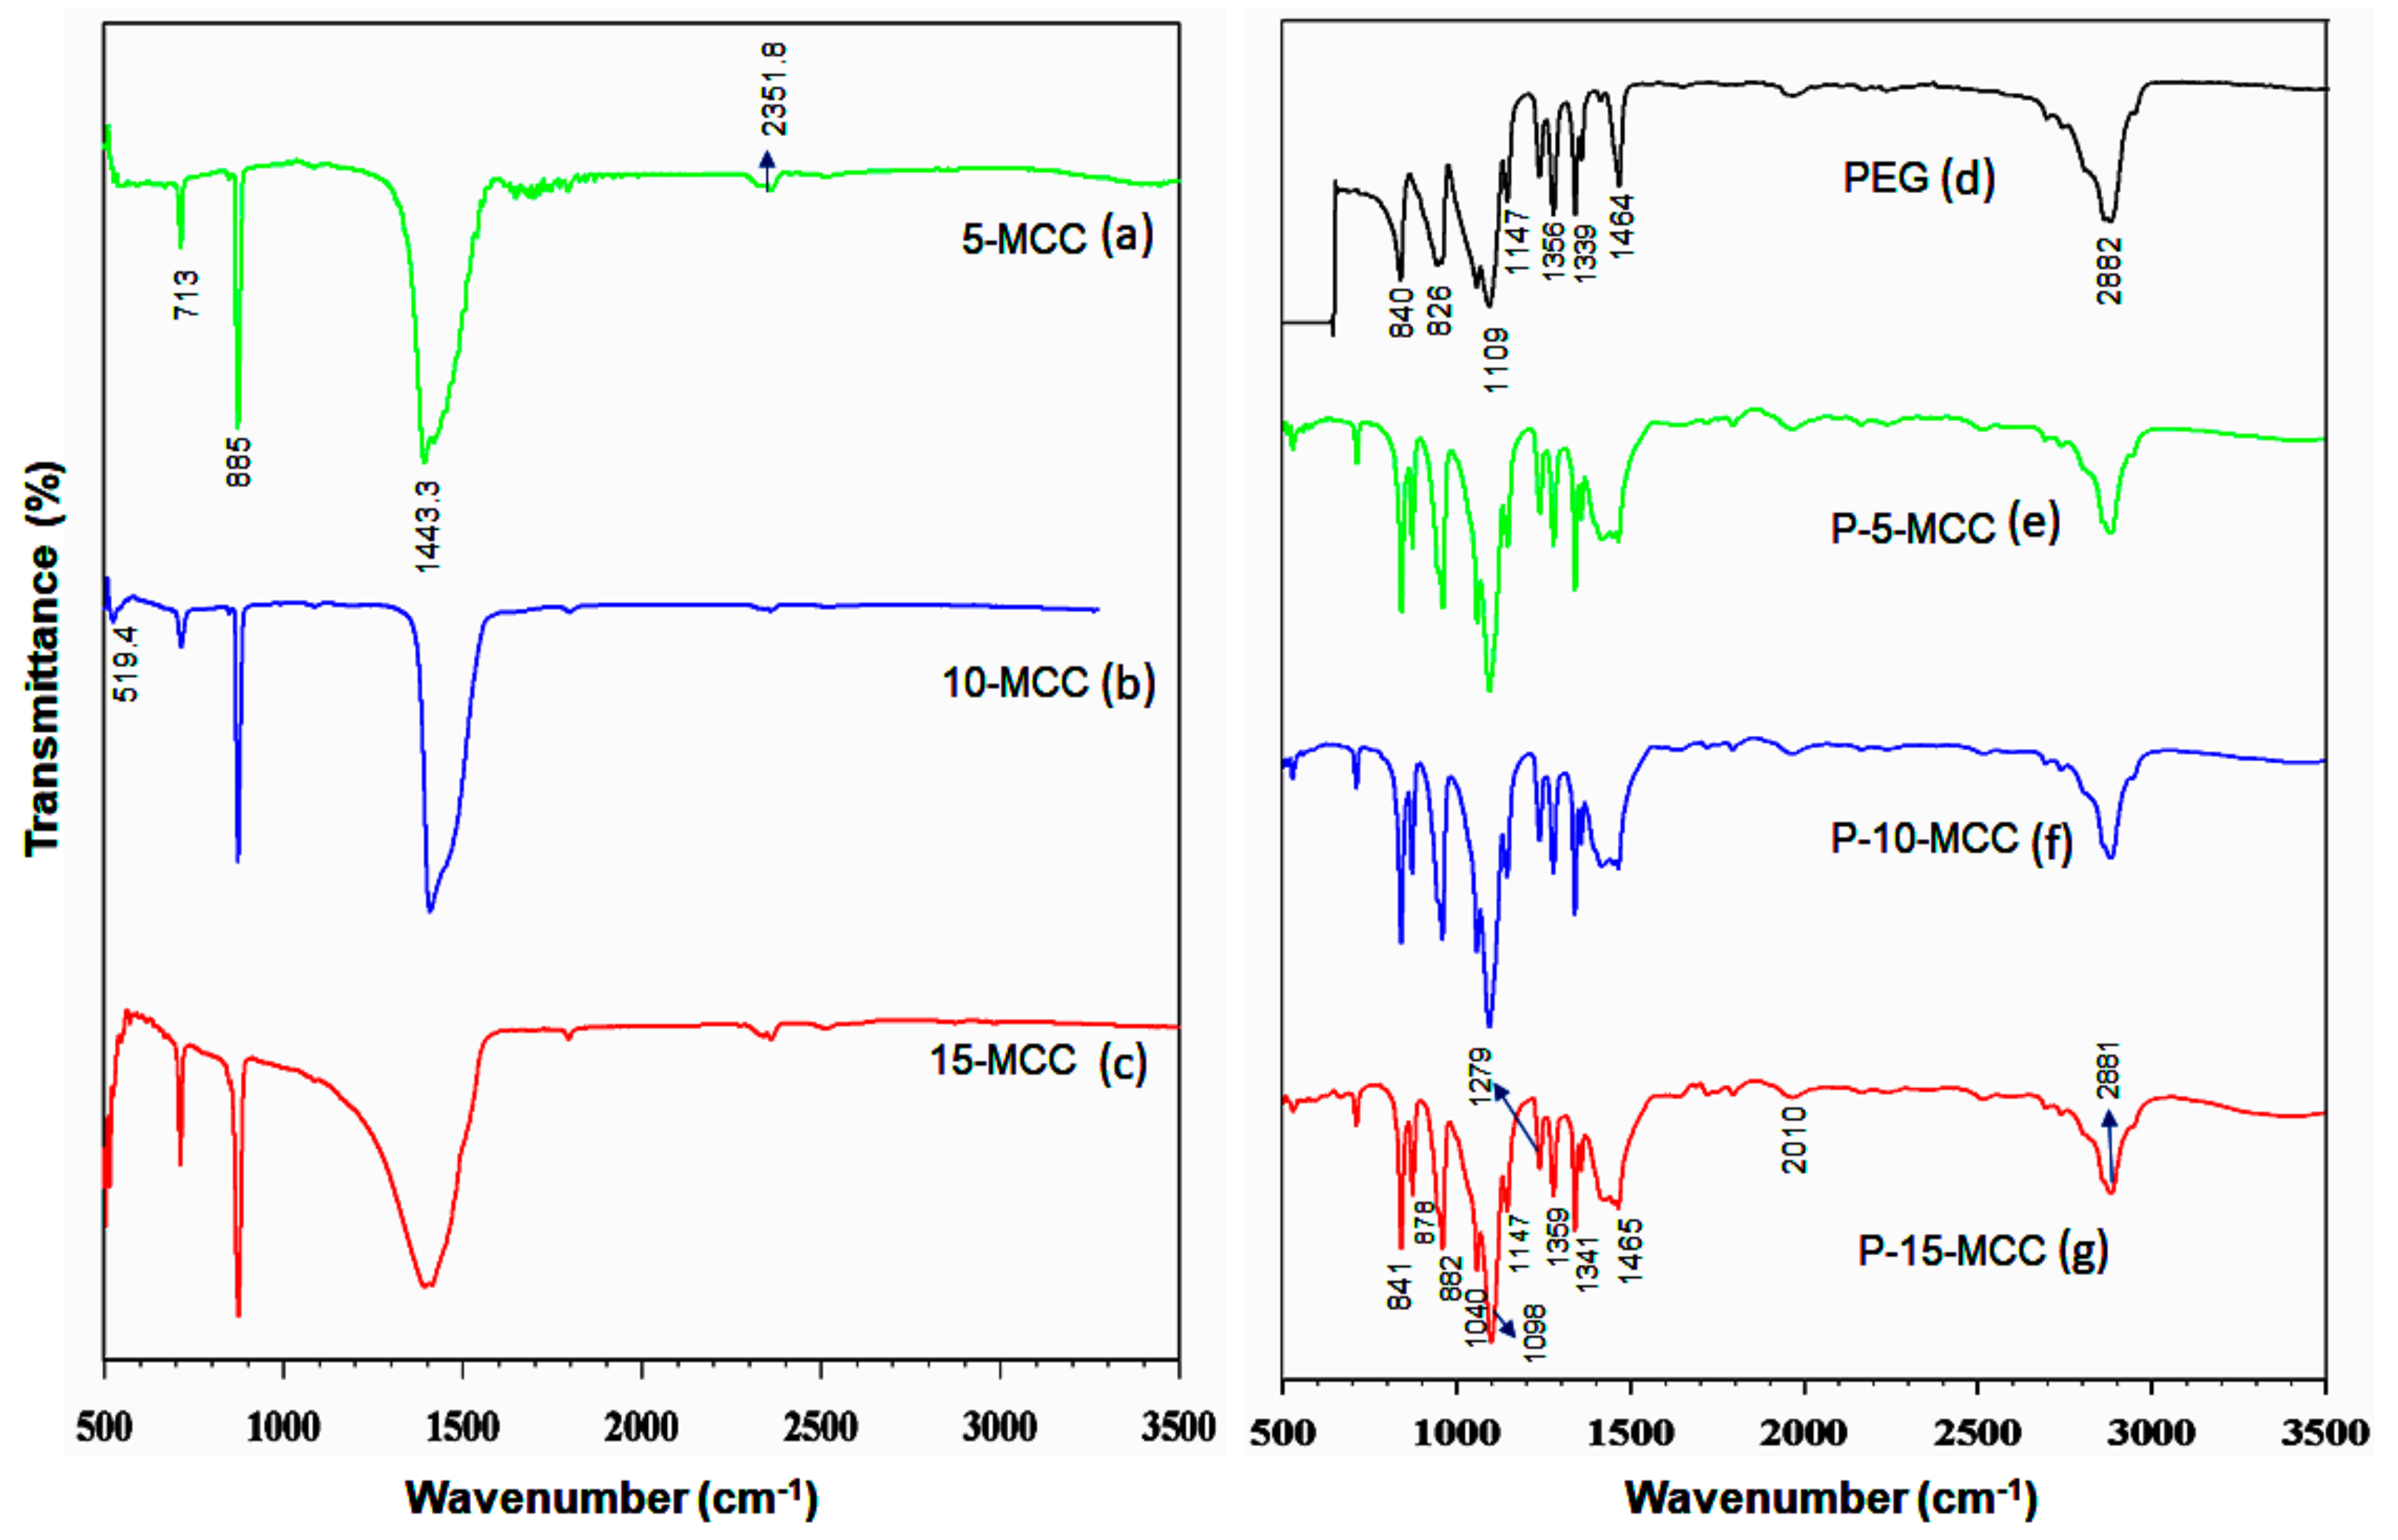
3.2. FTIR
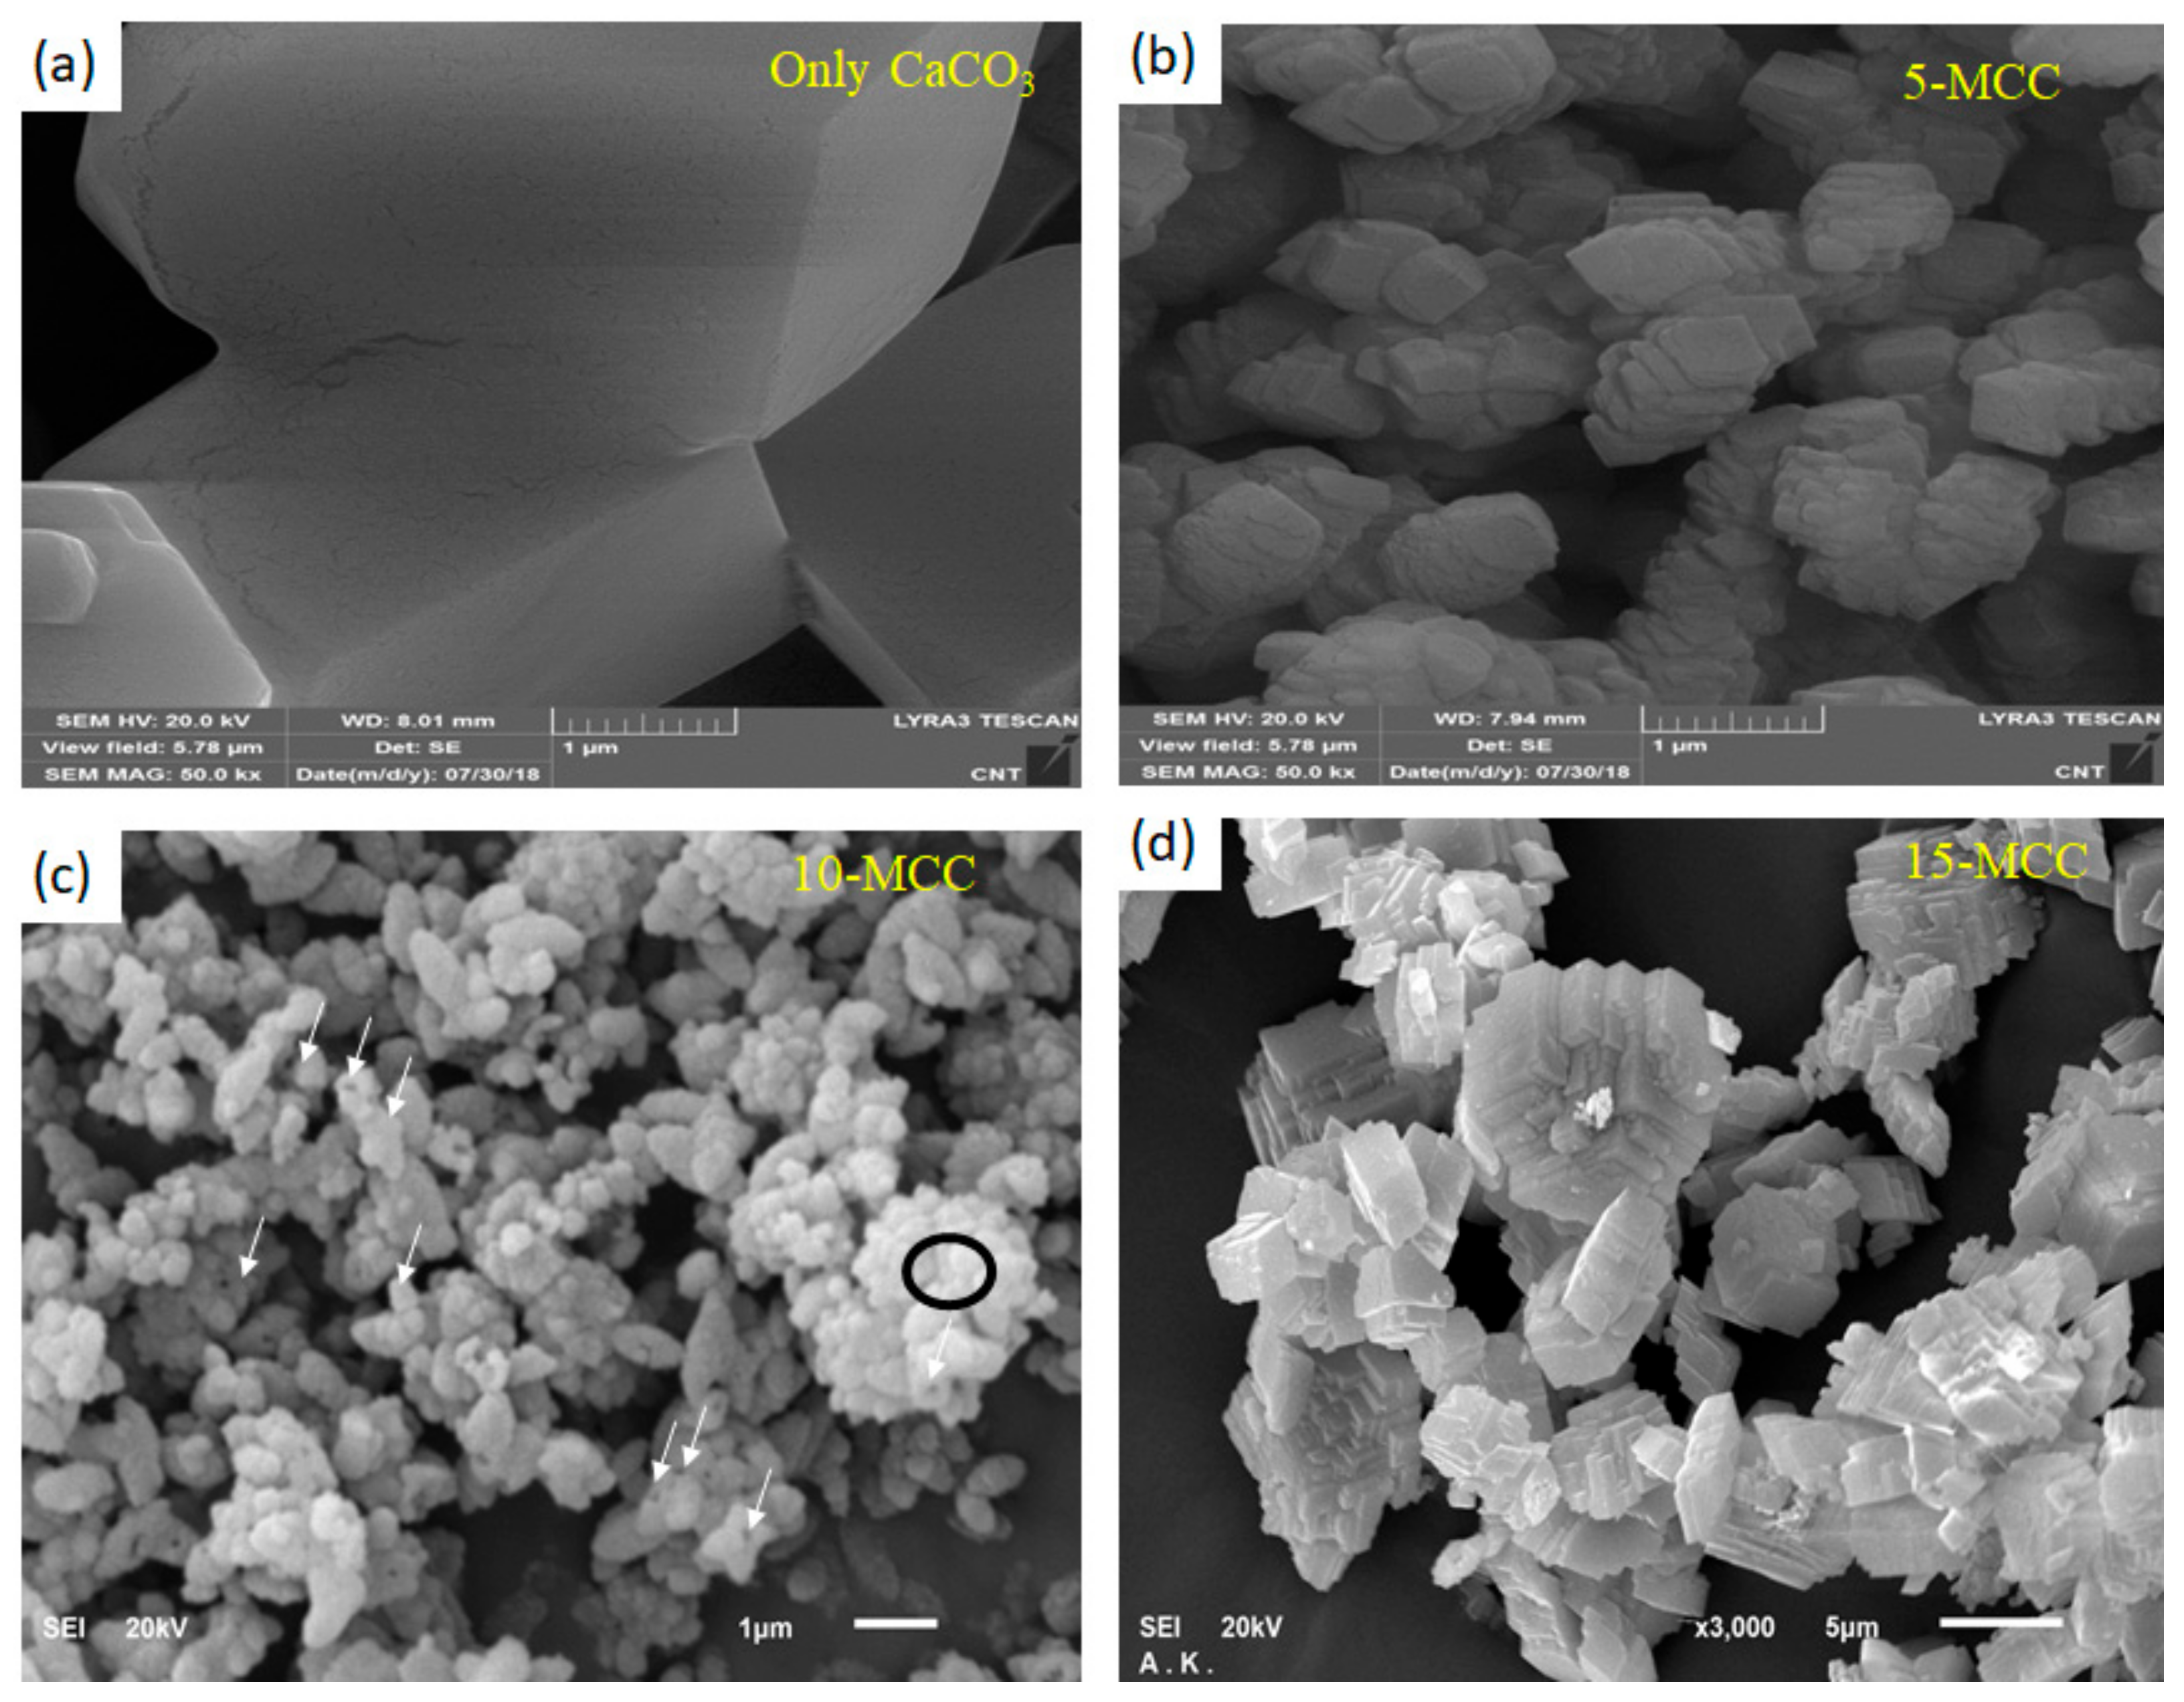
3.3. Scanning Electron Microscopy
3.4. Pore Size and Pore Volume
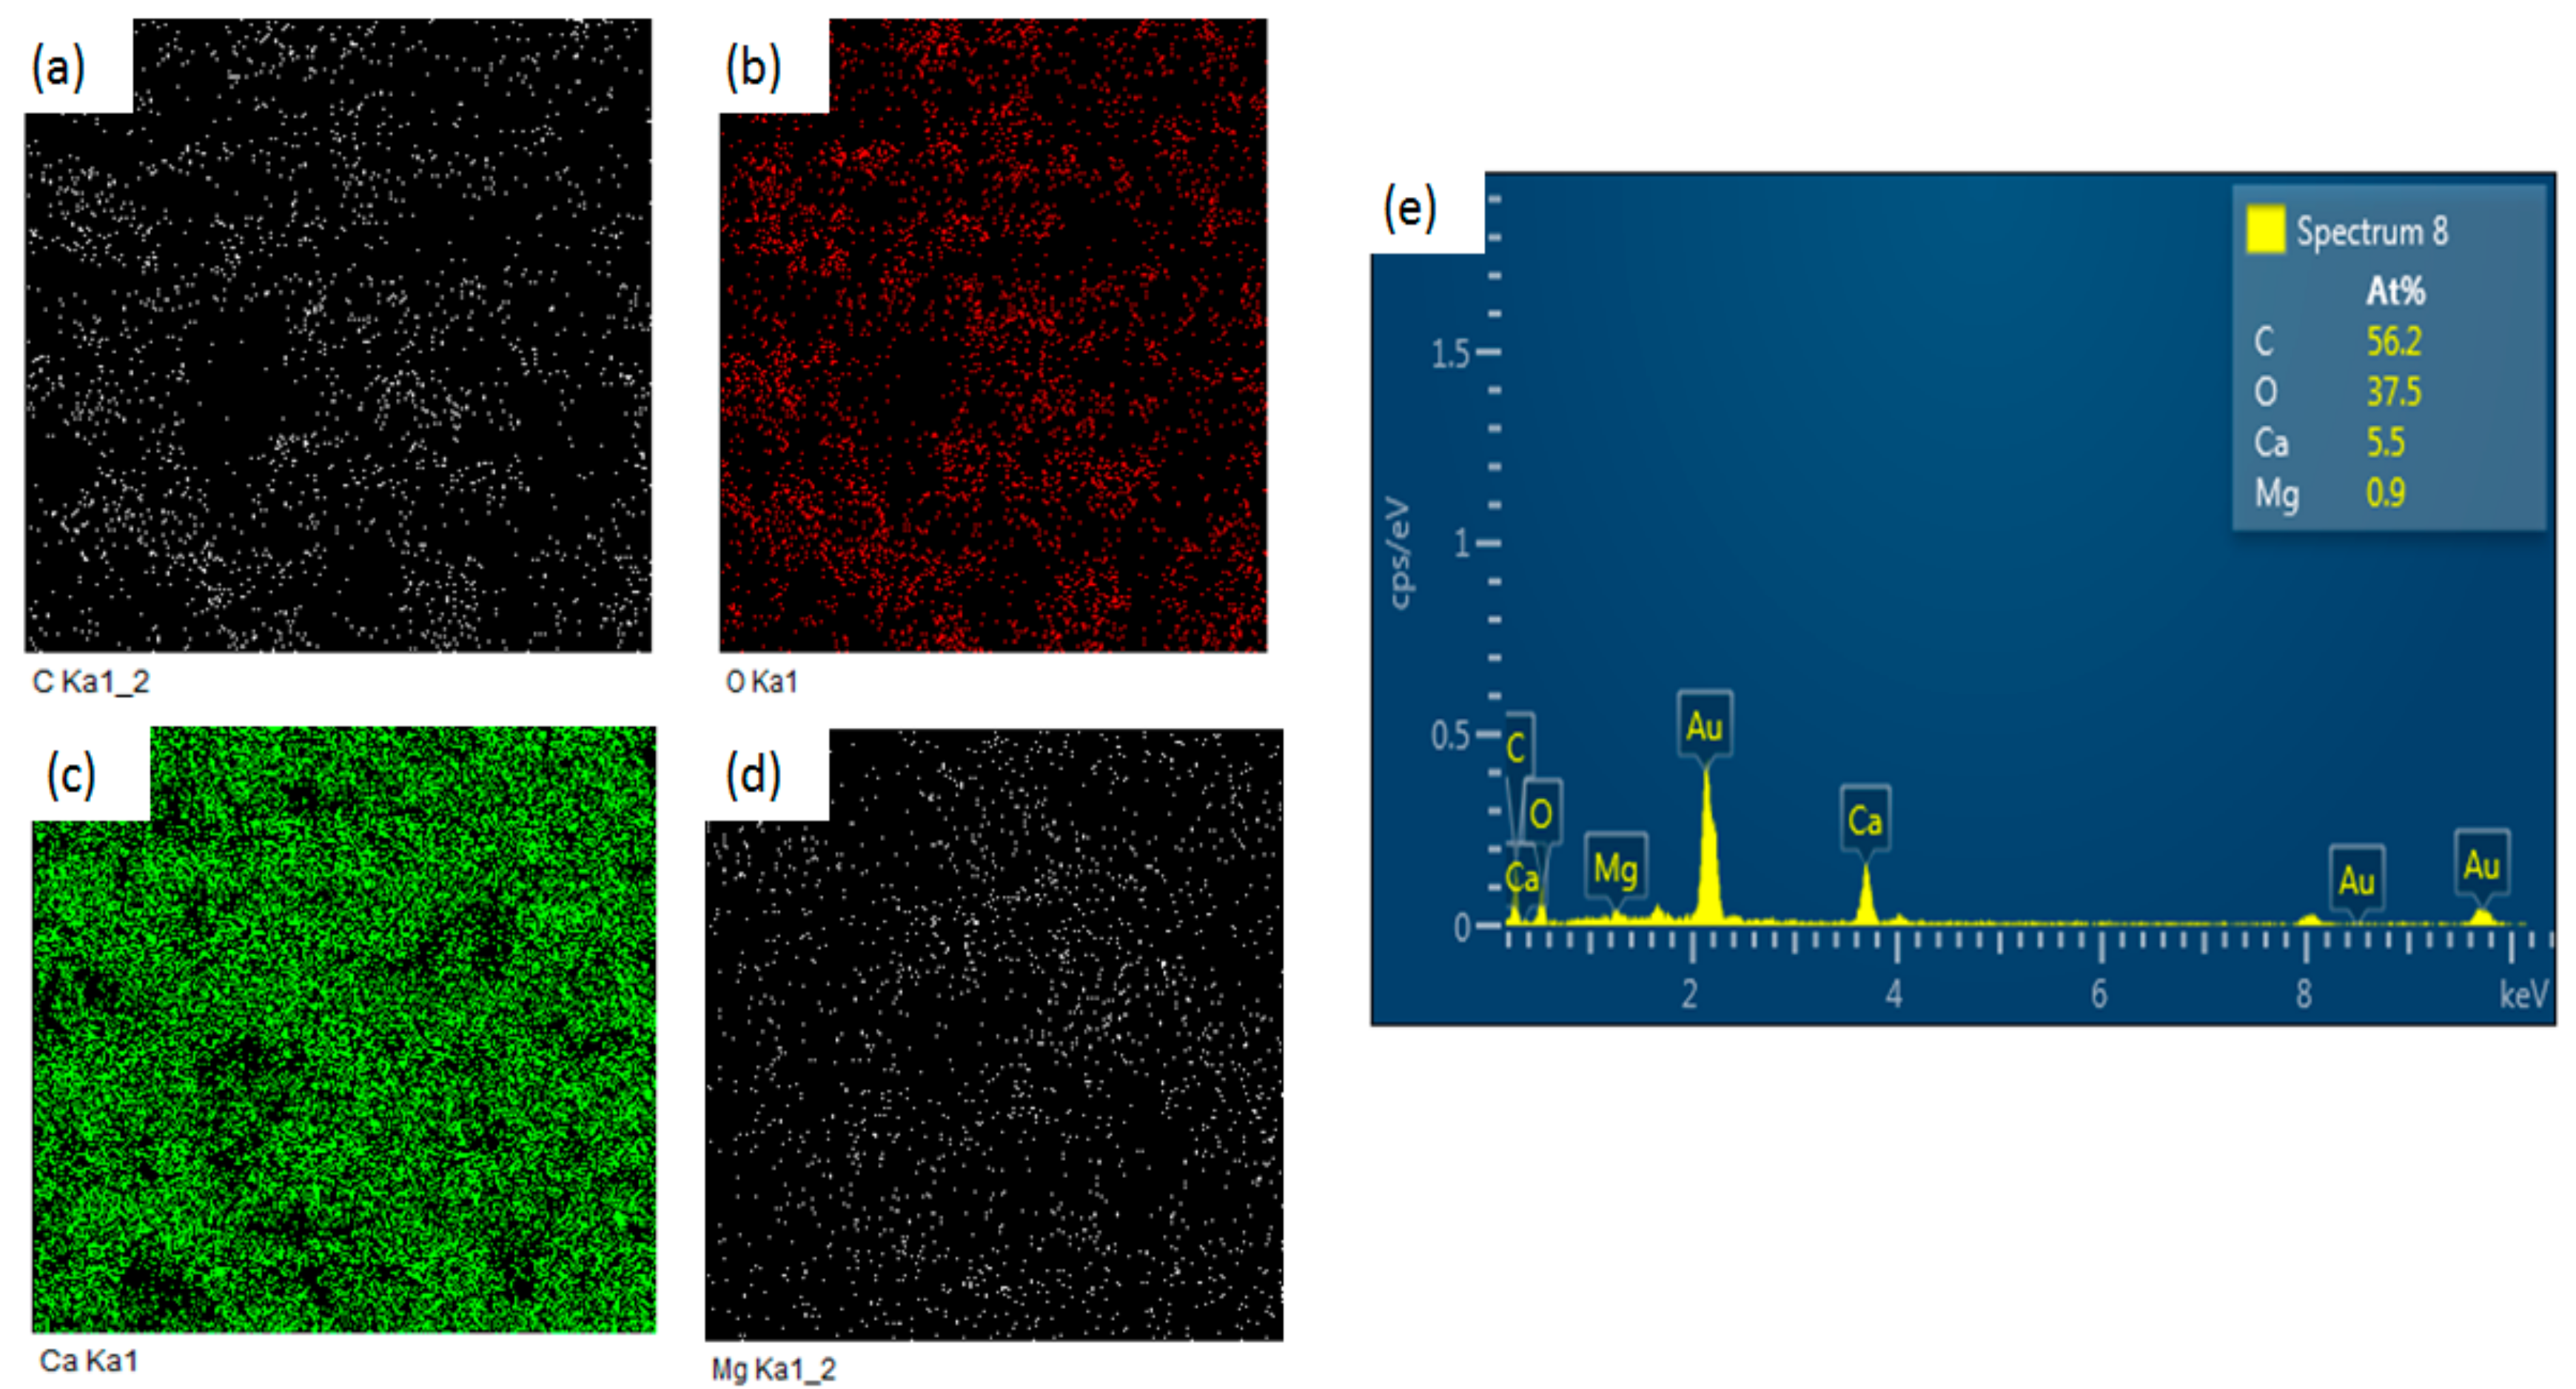
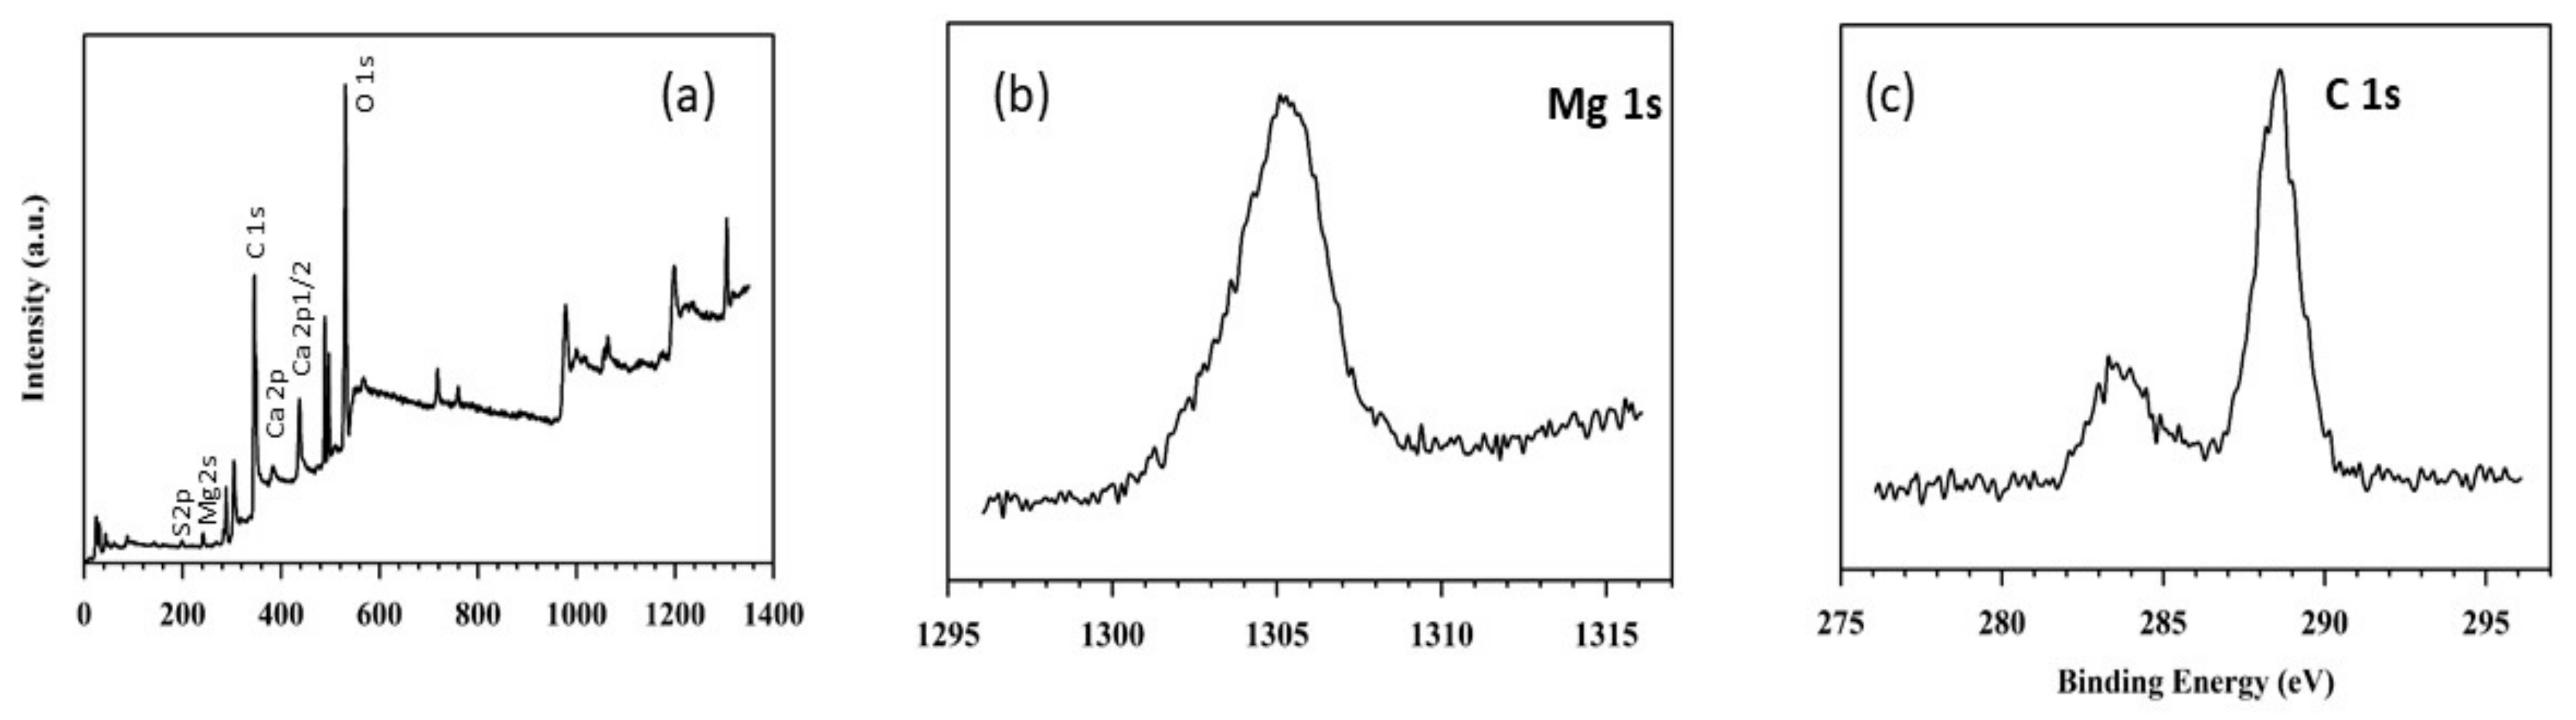
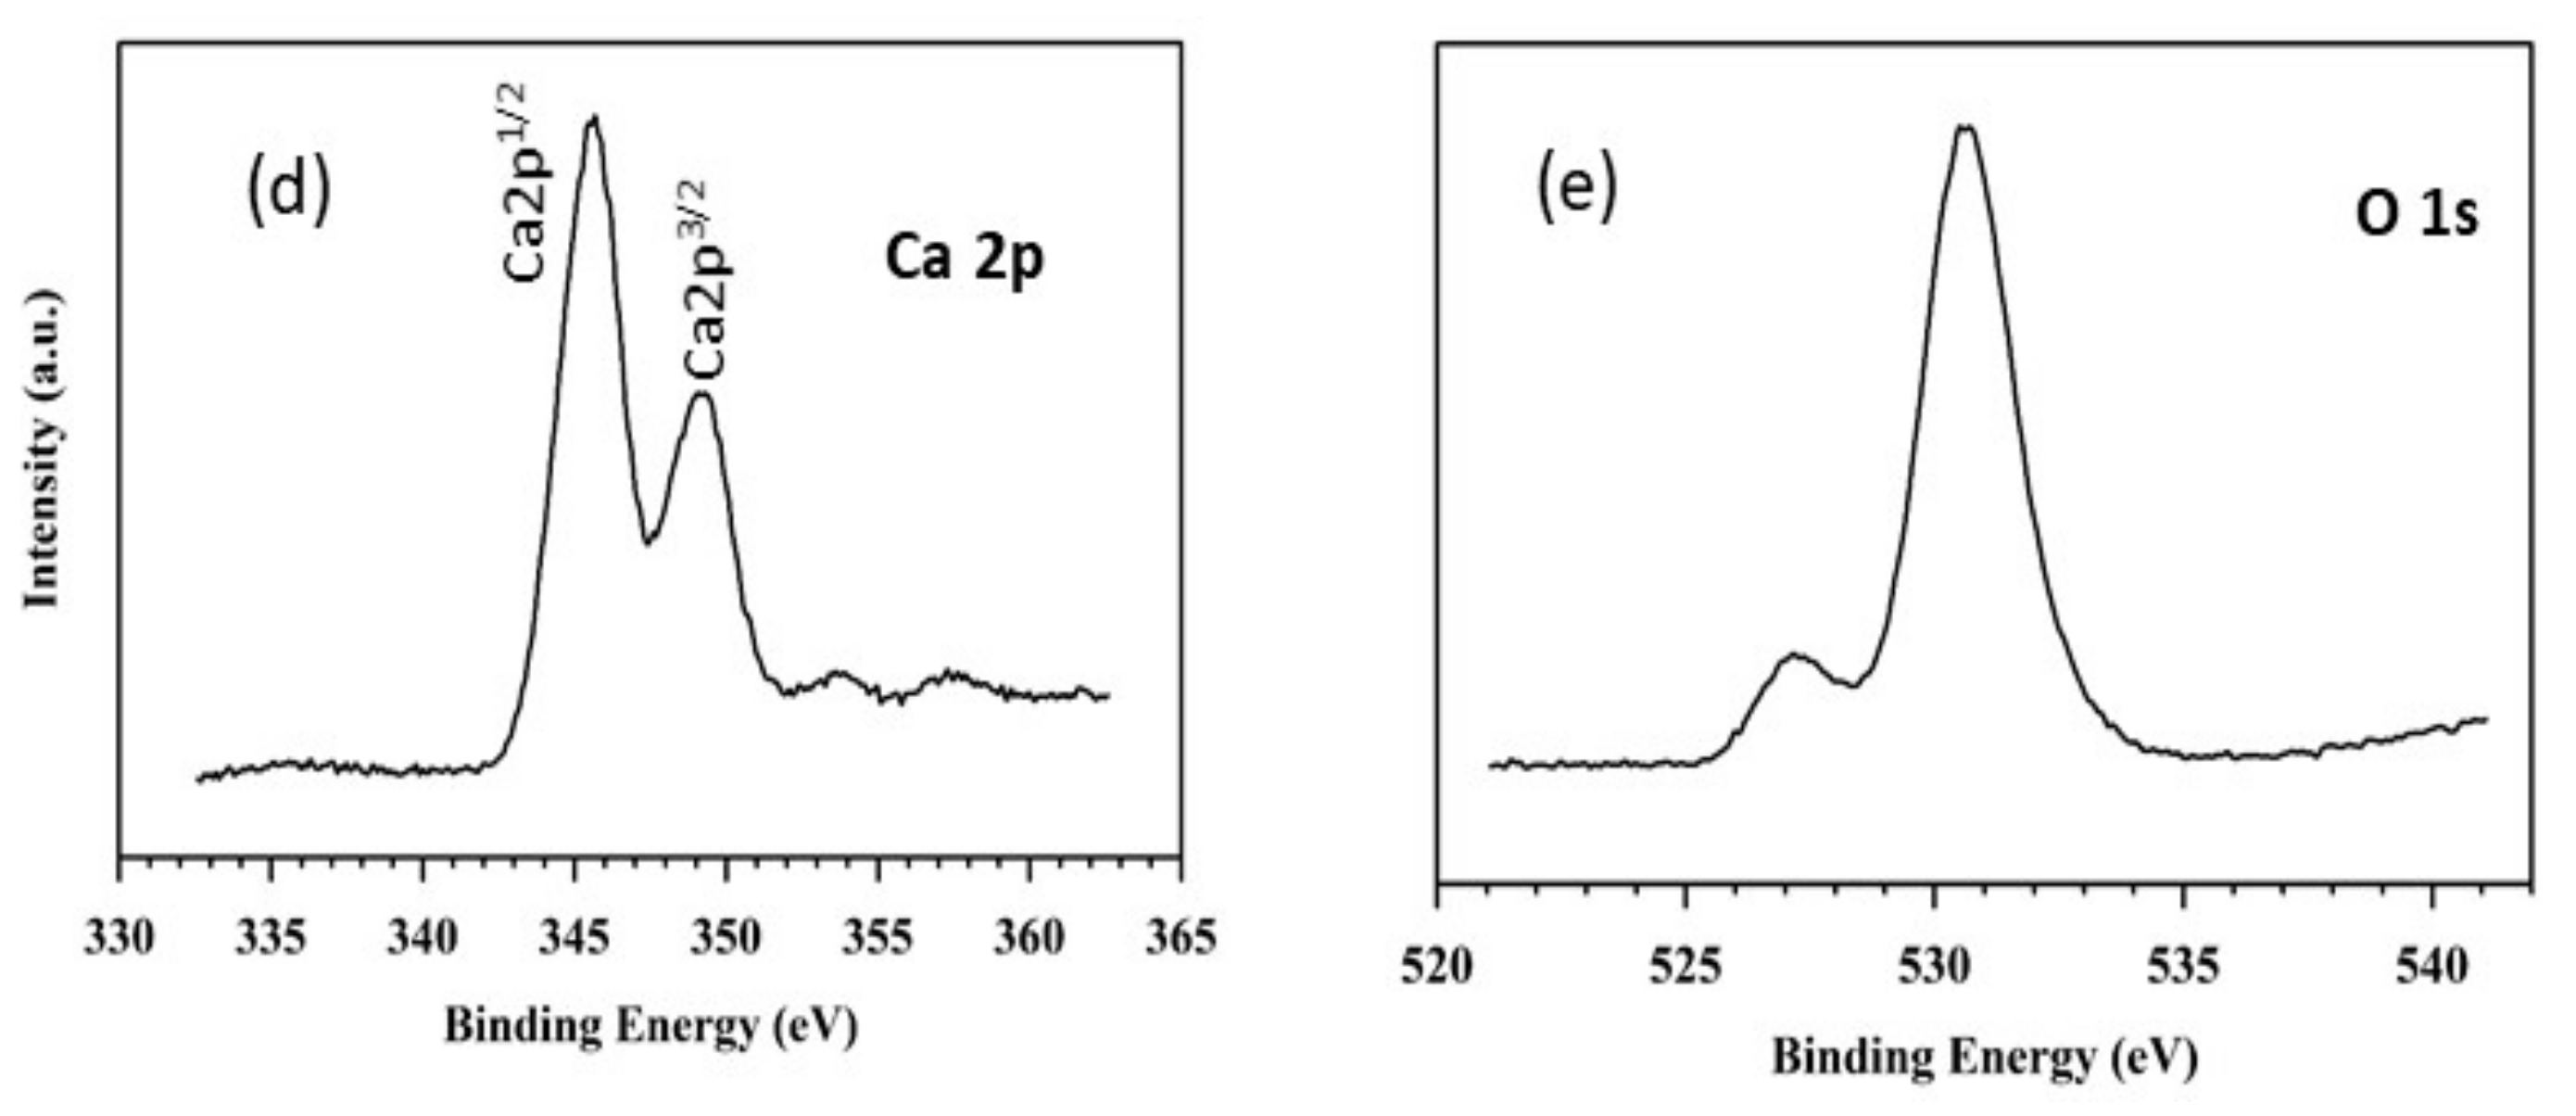
3.5. XPS
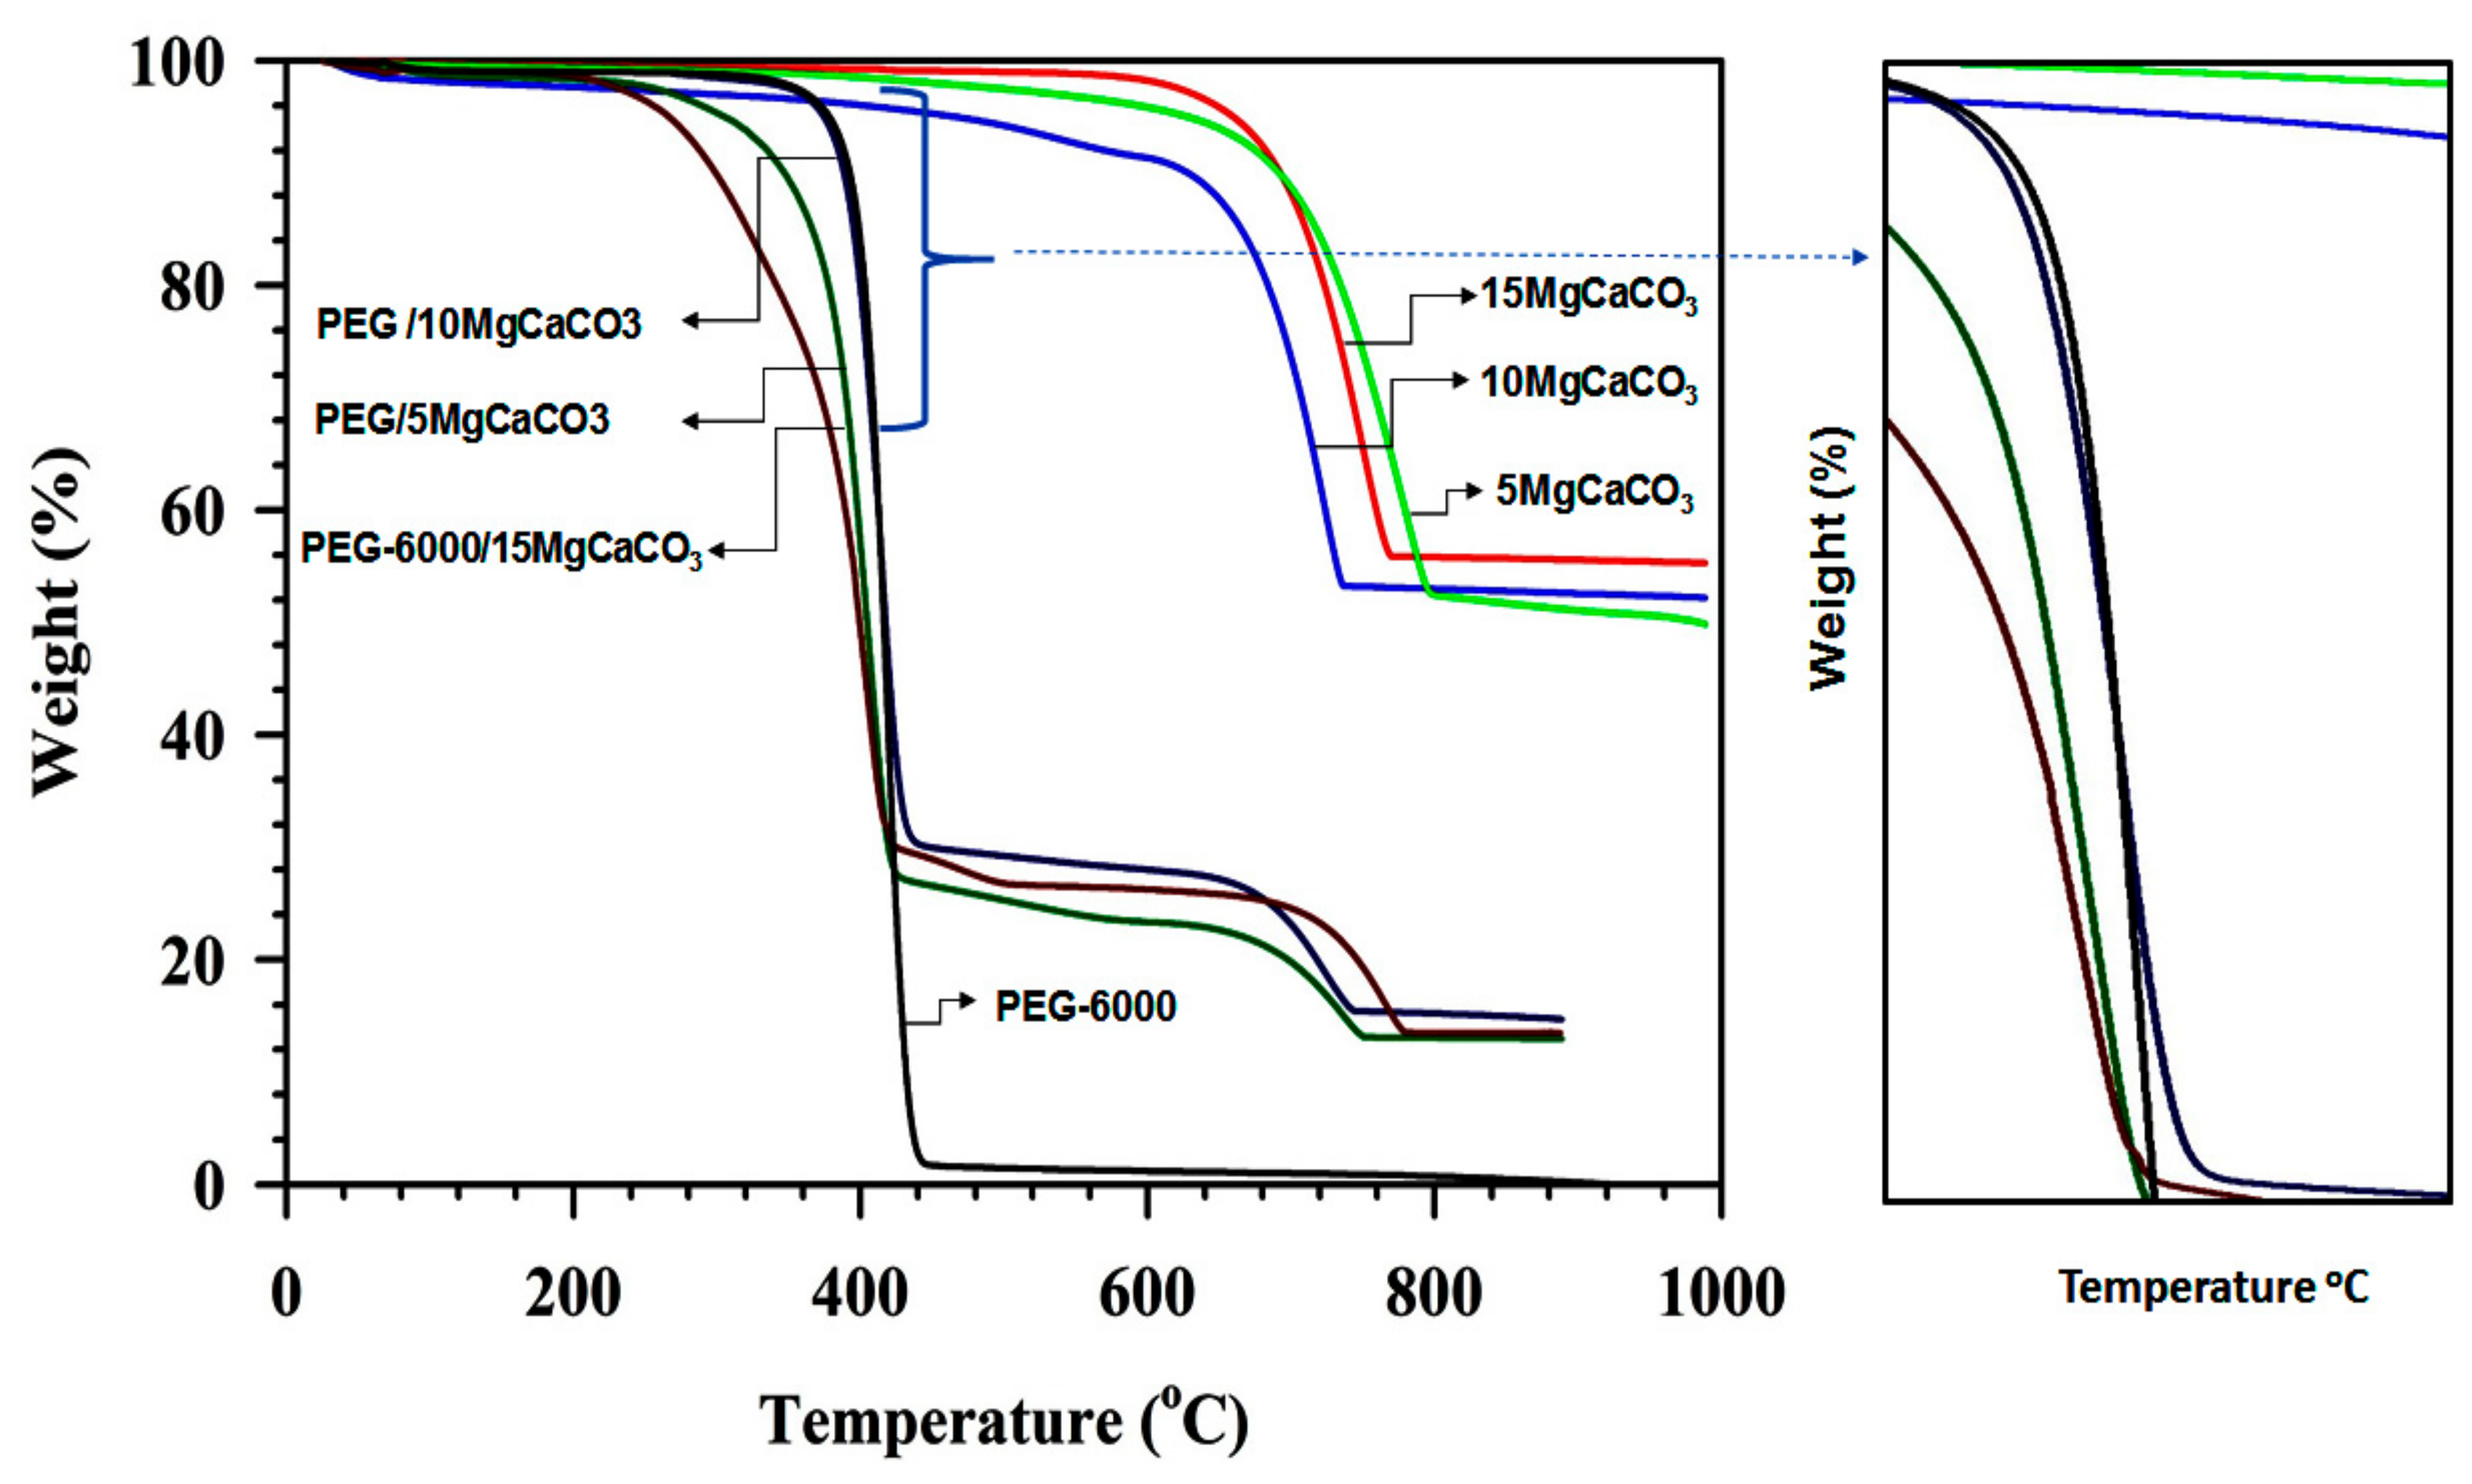
3.6. Thermal Stability
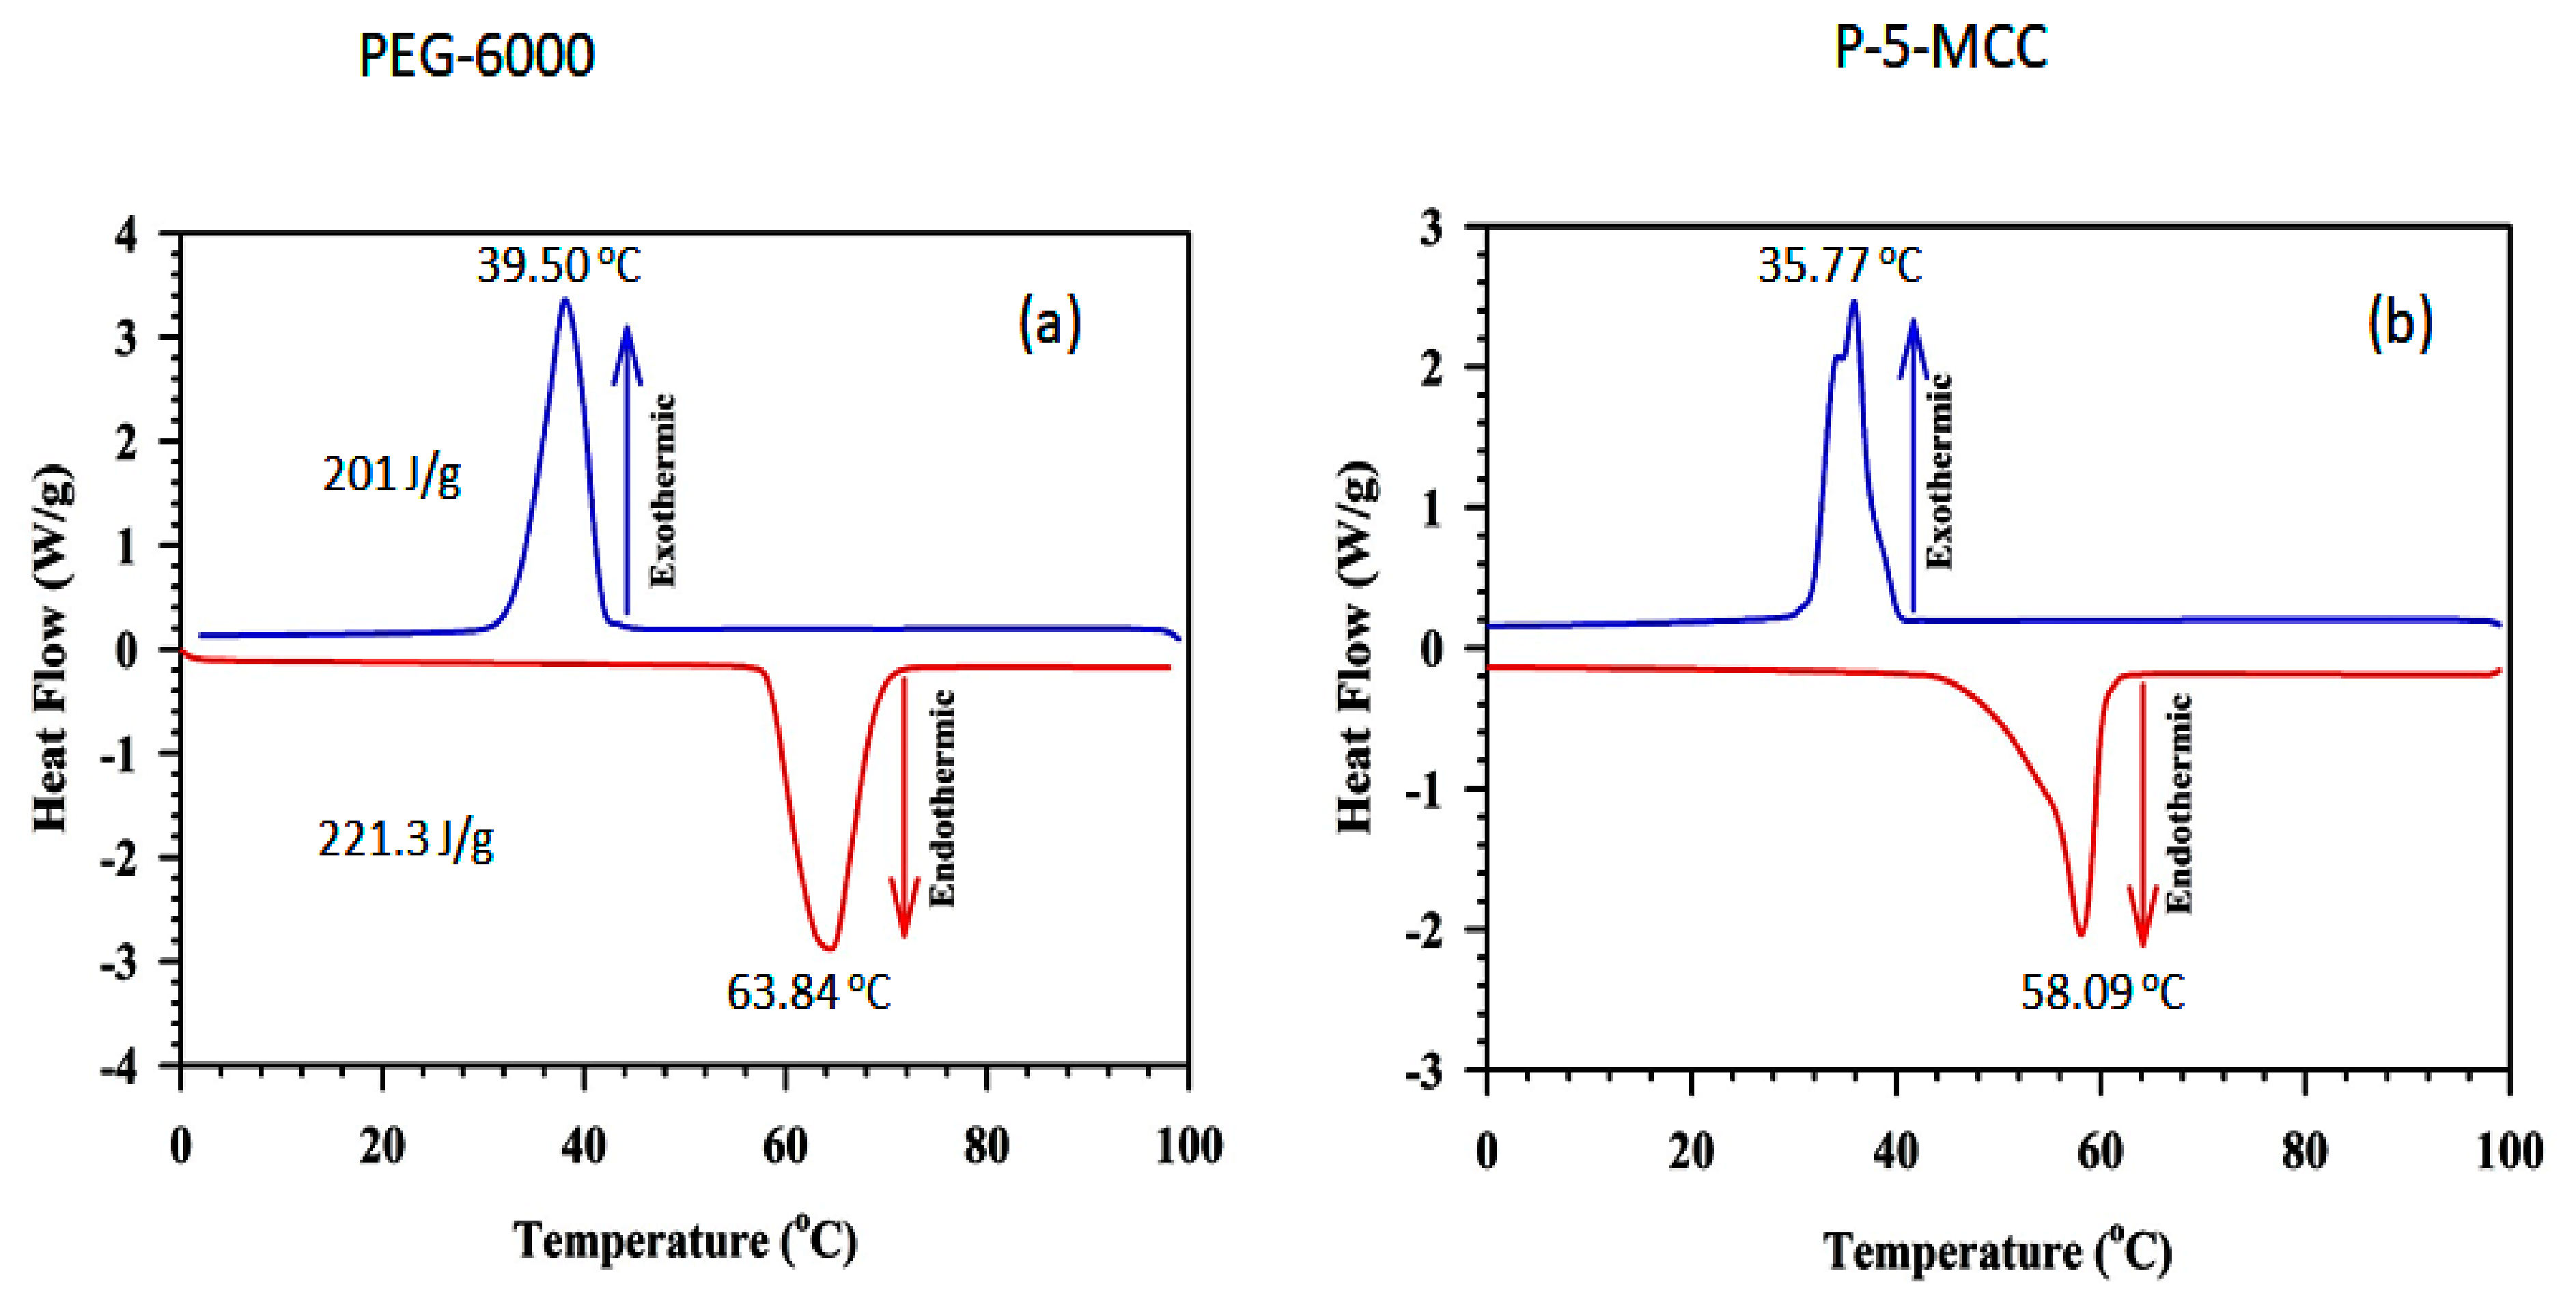
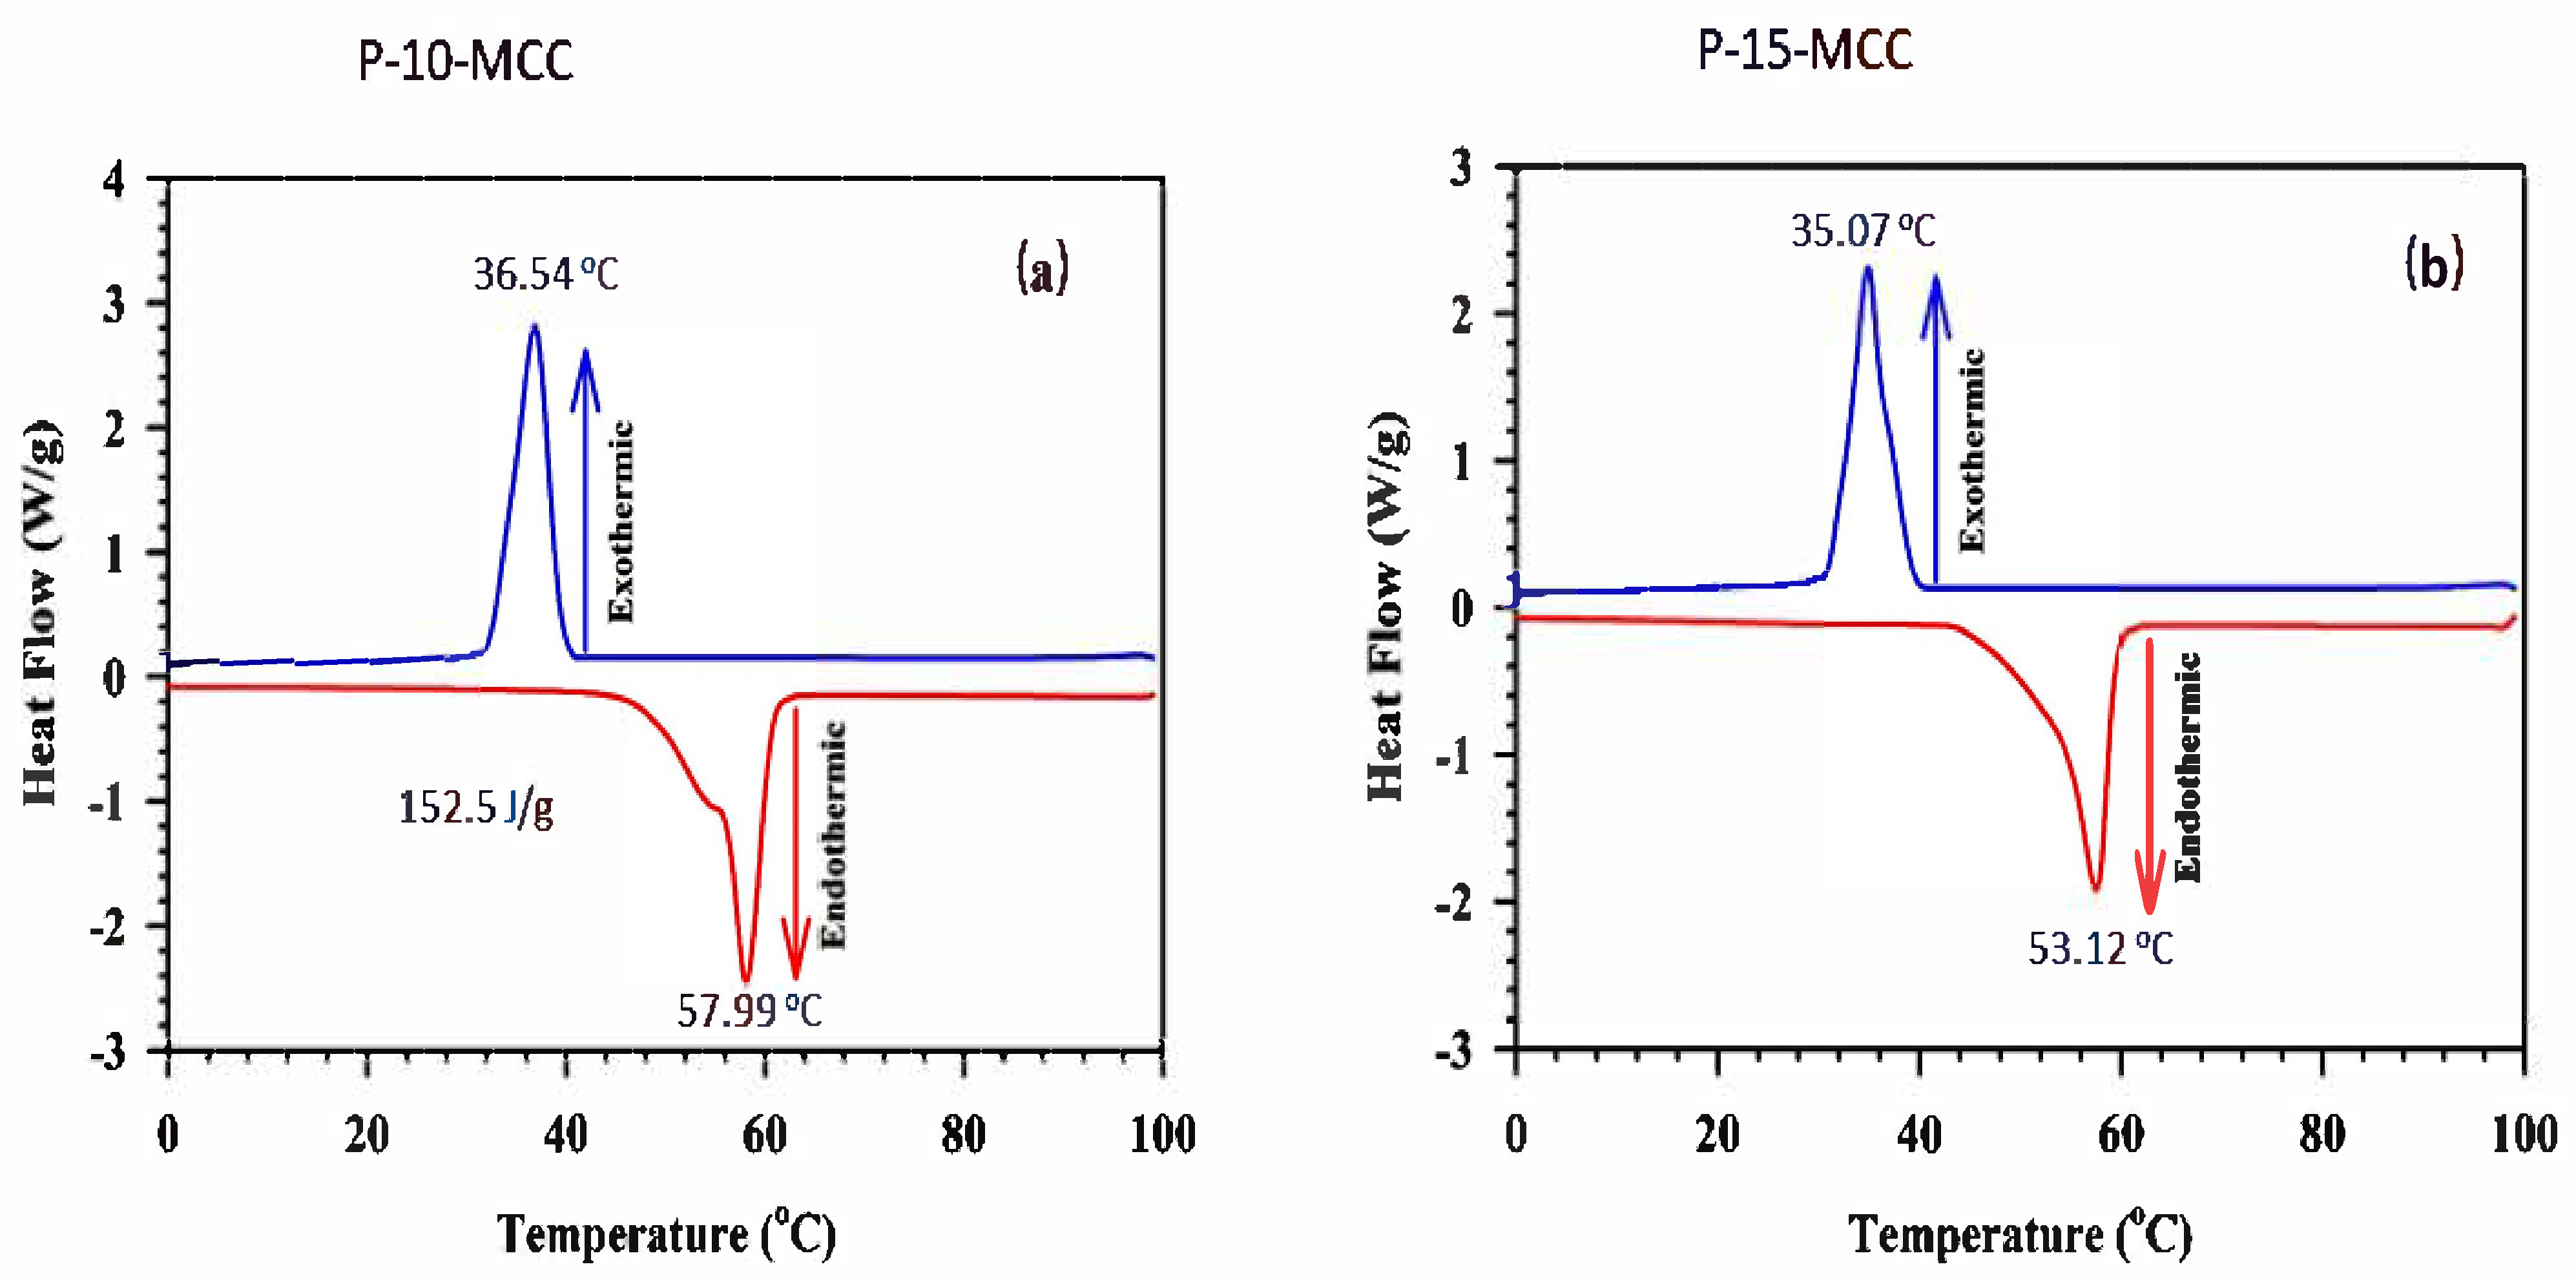
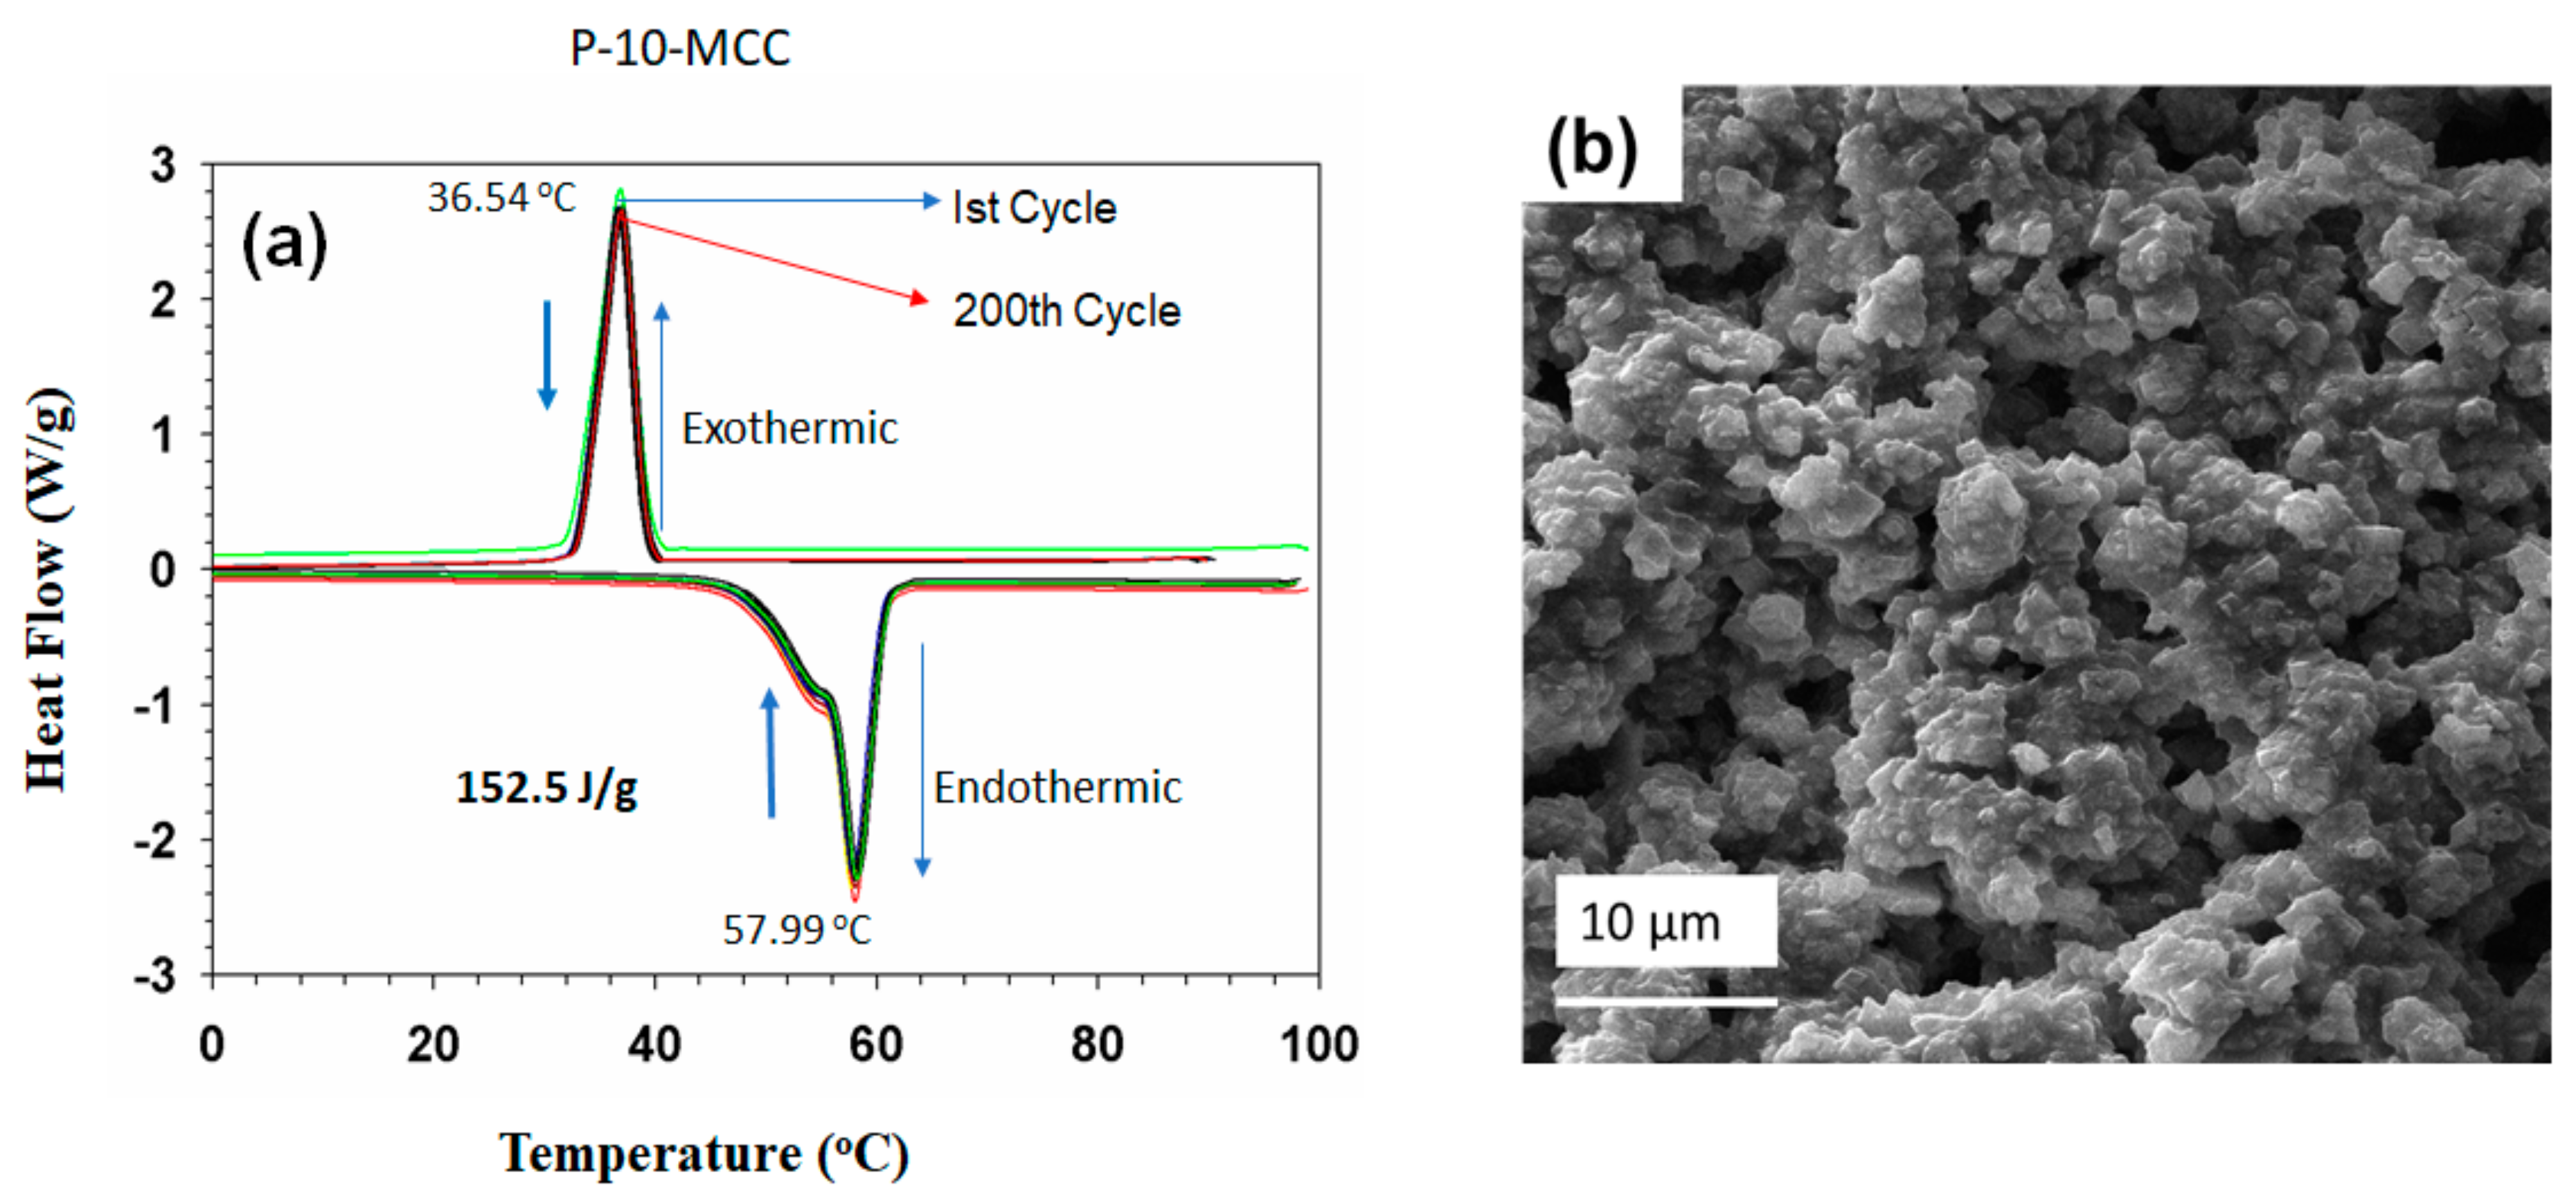
3.7. Differential Scanning Calorimetry

| Sample | Tf (°C) | Tm (°C) | ΔHf (J/g) | ΔHm (J/g) | ΔTs (°C) | R% | E% | φ | γ | Reference |
|---|---|---|---|---|---|---|---|---|---|---|
| * PEG | 39.5 | 63.84 | 201 | 221.3 | 24.3 | - | - | - | 100.0 | This work |
| * P-5-MCC | 35.77 | 54.36 | 116.3 | 134.5 | 18.59 | 60.78 | 59.39 | 97.72 | 85.09 | This work |
| * P-10-MCC | 36.54 | 55.17 | 134.4 | 152.5 | 18.63 | 68.91 | 67.94 | 98.59 | 96.48 | This work |
| * P-15-MCC | 35.07 | 53.12 | 107.1 | 125.3 | 18.05 | 56.62 | 55.03 | 97.20 | 35.07 | This work |
| PEG1000/MgO | 8.30 | 34.4 | - | 61.62 | 16.1 | 64.6 | - | - | - | [13] |
| PEG10000/SiO2 | - | 61.61 | - | 162.9 | - | - | [15] | |||
| PEG1000/SiO2-β-AIN | 45.13 | 60.41 | 161.4 | 132.9 | 15.28 | - | - | - | - | [37] |
| PEG6000/CaO4Si | 44.10 | 57.03 | 106.8 | 122.1 | - | - | - | - | - | [22] |
| PEG | 42.02 | 56.89 | 176.36 | 190.08 | 14.87 | - | - | - | - | [48] |
| PEG/EP | 46.33 | 58.41 | 137.32 | 145.14 | 12.08 | - | 76.36 | 77.08 | 100.95 | [48] |
| PEG/EP/Carbon | 46.71 | 55.19 | 129.27 | 134.93 | 8.48 | - | 70.99 | 72.10 | 101.57 | [48] |
| PEG6000 | 36.2 | 61.8 | 187.1 | 185.3 | 25.6 | - | - | - | - | [49] |
| GNS | 37.3 | 60.5 | 178.8 | 176.9 | 23.2 | - | 95.47 | 95.52 | 100.05 | [49] |
| Ag–GNS/PEG-1 | 35.9 | 60.2 | 179.4 | 177.2 | 24.3 | - | 95.63 | 95.76 | 100.13 | [49] |
| Ag–GNS/PEG-2 | 35.6 | 60.3 | 175.8 | 173.3 | 24.7 | - | 93.52 | 93.74 | 100.23 | [49] |
| Ag–GNS/PEG-3 | 36 | 60.2 | 171.9 | 169.6 | 24.2 | - | 91.53 | 91.70 | 100.19 | [49] |
| Ag–GNS/PEG-4 | 36.1 | 60.3 | 167.8 | 166.1 | 24.2 | - | 89.64 | 89.66 | 100.03 | [49] |
| Paraffin wax (RT27) | 25 | 25.1 | - | 154 | 0.1 | - | - | - | - | [50] |
| RT27/Expanded perlite | 25.5 | 26.3 | 84 | 0.8 | - | 54.55 | - | - | [50] | |
| RT27/EP/Sikalatex(SL) | 25.8 | 26.3 | 51.6 | 0.5 | - | 33.51 | - | - | [50] | |
| RT27/EP/SL/AL | 25.3 | 26.1 | 50 | 0.8 | - | 32.47 | - | - | [50] | |
| Paraffin | 23.04 | 26.83 | 135.8 | 136.2 | 3.79 | - | - | - | - | [51] |
| P1 (EP/Paraffin 20%) | 22.62 | 27.5 | 11.3 | 10.4 | 4.88 | - | 7.64 | 7.98 | - | [51] |
| P1 (EP/Paraffin 40%) | 22.36 | 27.34 | 51.6 | 53.5 | 4.98 | - | 39.28 | 38.64 | - | [51] |
| P1 (EP/Paraffin 60%) | 22.52 | 27.56 | 80.8 | 80.9 | 5.04 | - | 59.40 | 59.45 | - | [51] |
| P1 (EP/Paraffin 80%) | 22.38 | 27.38 | 118 | 118.2 | 5 | - | 86.78 | 86.84 | - | [51] |
| Eicosane (C20) | 32.92 | 36.18 | 268.13 | 275.91 | 3.26 | - | - | - | - | [52] |
| EP/C20 60% | 34.32 | 36.12 | 155.26 | 161.18 | 1.8 | - | 58.42 | 58.16 | - | [52] |
| EP/C20 60%/CNT 0.3% | 34.32 | 36.24 | 155.26 | 160.38 | 1.92 | - | 58.13 | 58.02 | - | [52] |
| EP/C20 60%/CNT 0.5% | 35.55 | 36.34 | 145.92 | 159.02 | 0.79 | - | 57.63 | 56.05 | - | [52] |
| EP/C20 60%/CNT 1% | 35.53 | 36.47 | 141.15 | 157.43 | 0.94 | - | 57.06 | 54.88 | - | [52] |
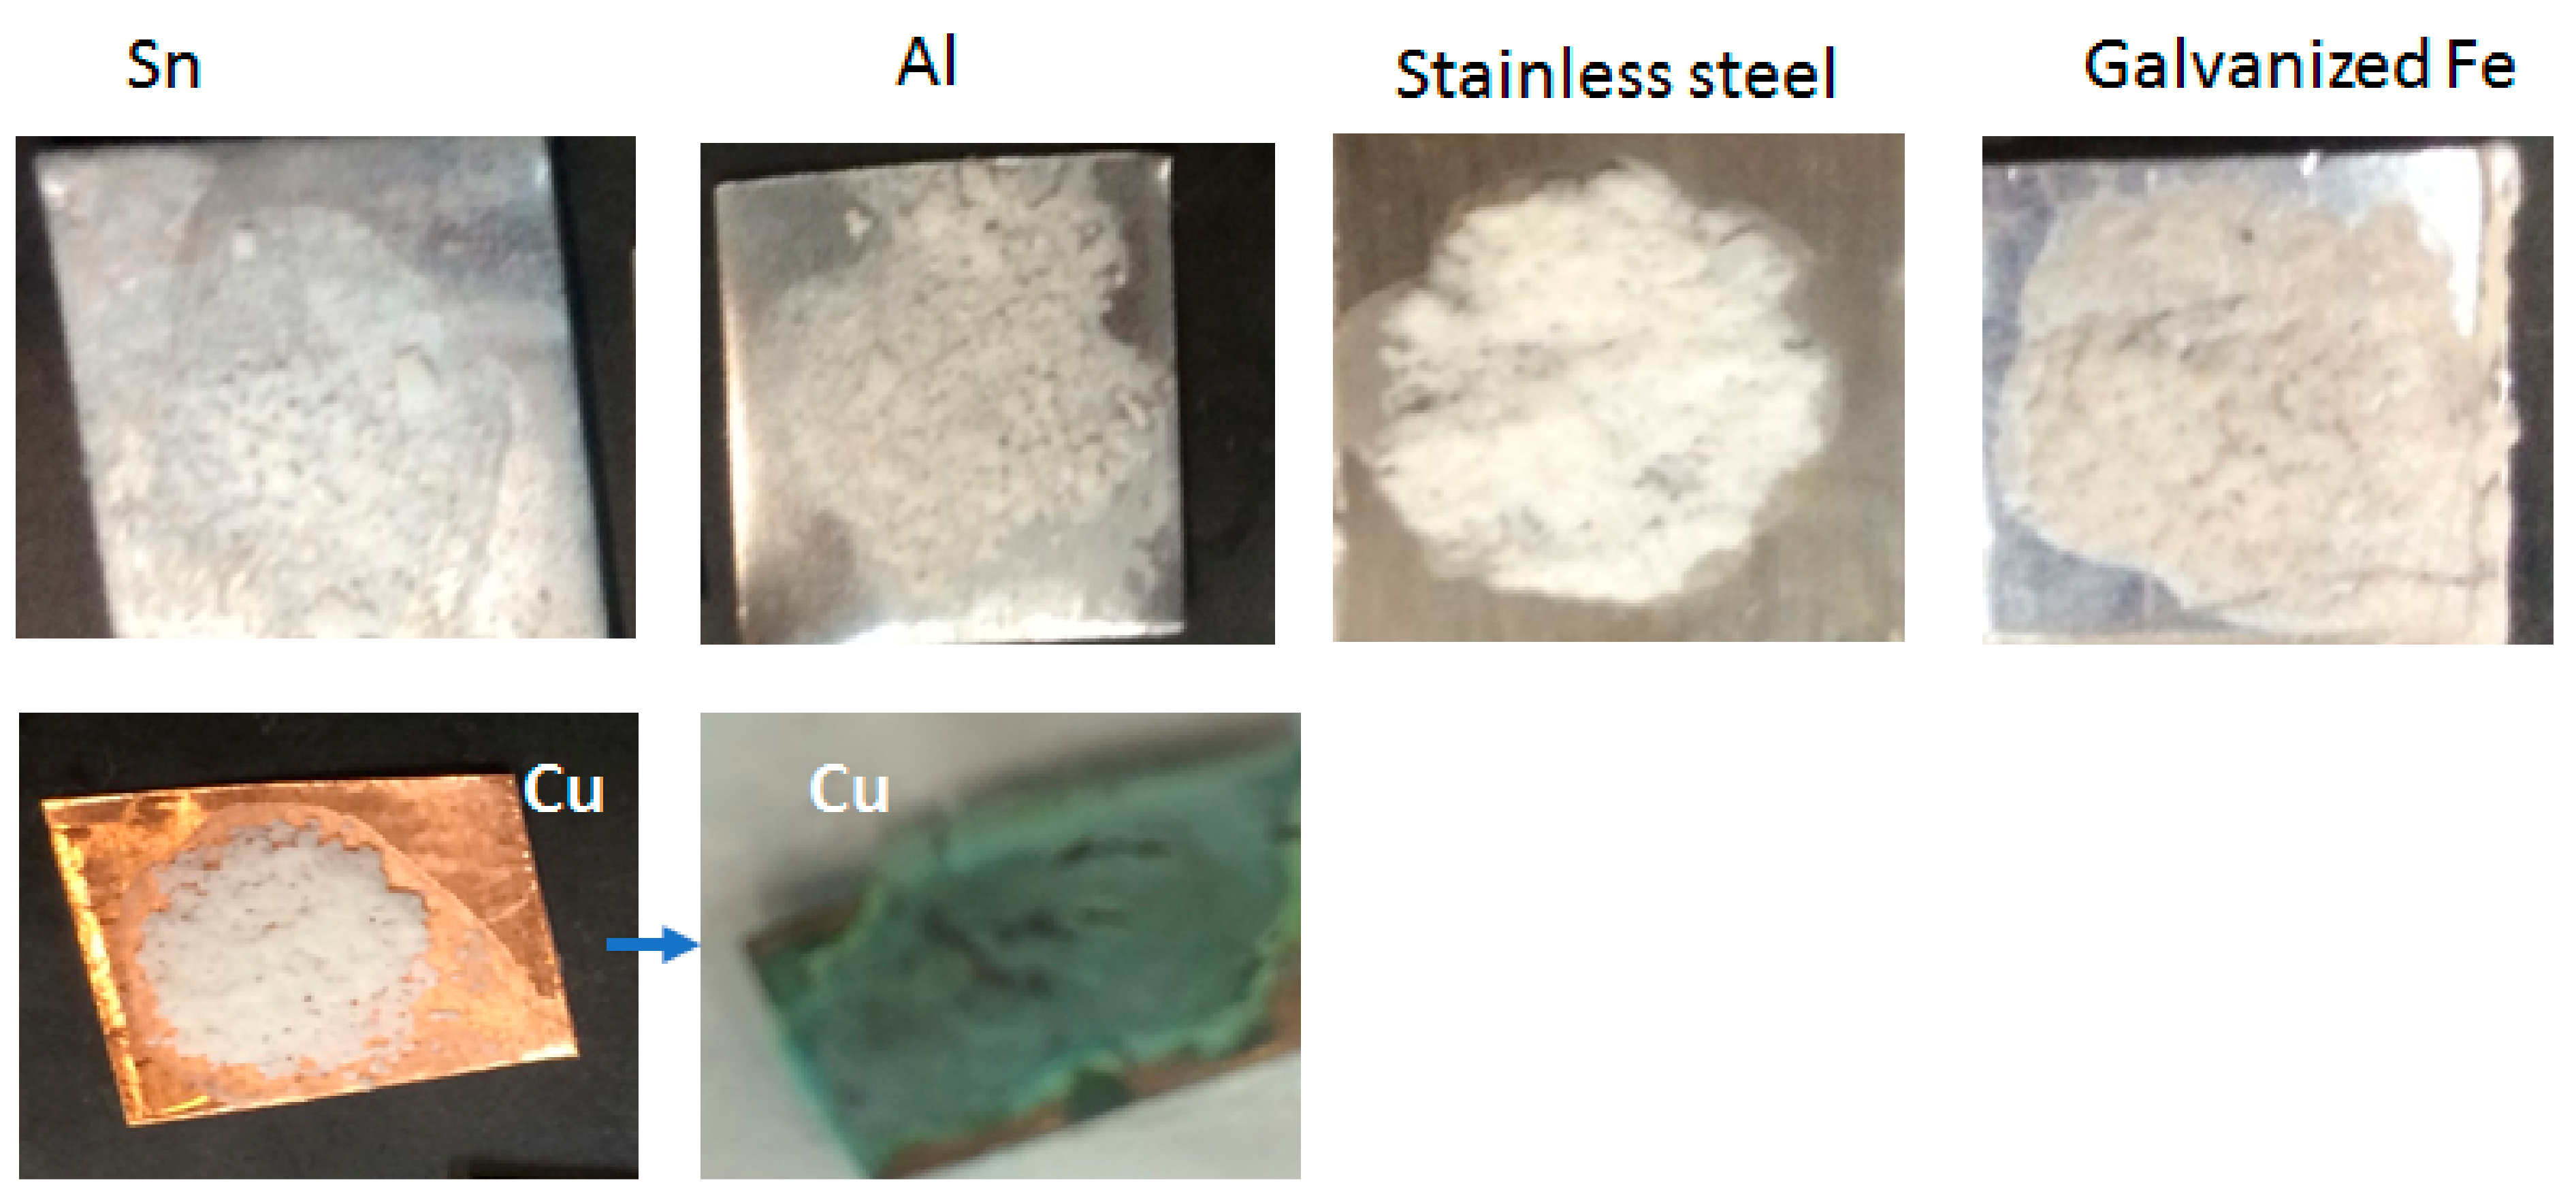
3.8. Compatibility of the PCM with Metals Used for Containers
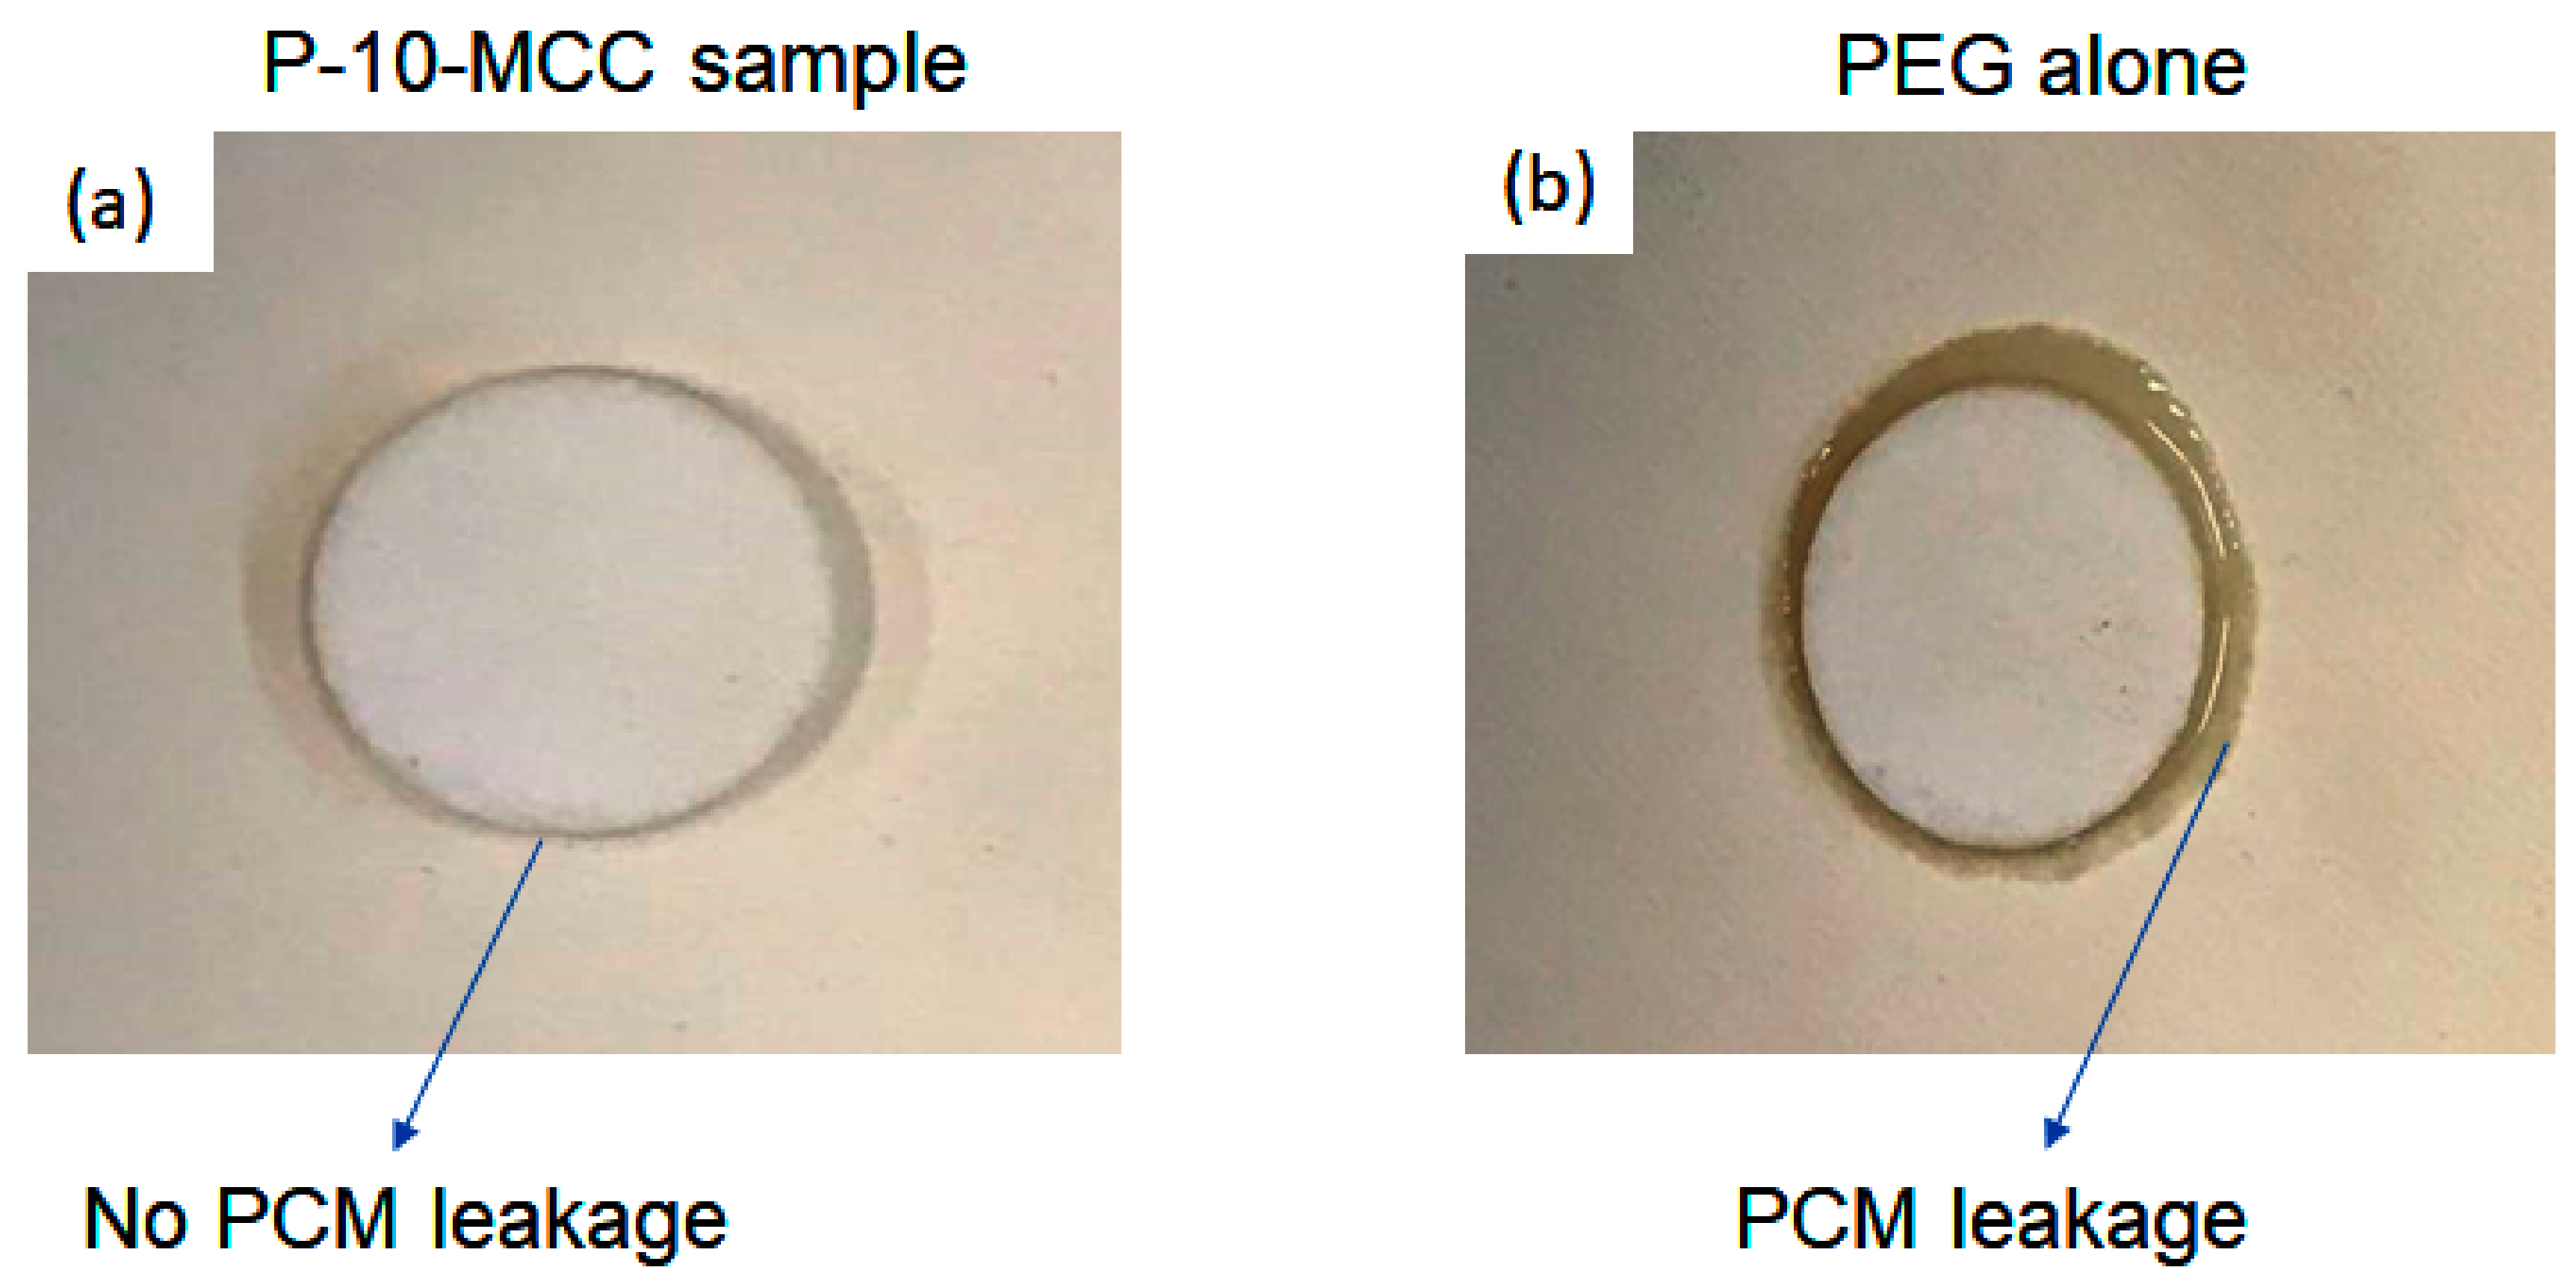
3.9. Seepage Test
3.10. Comparison of the Results of the Present Study with Those of Previous Studies
3.11. Thermal Conductivity
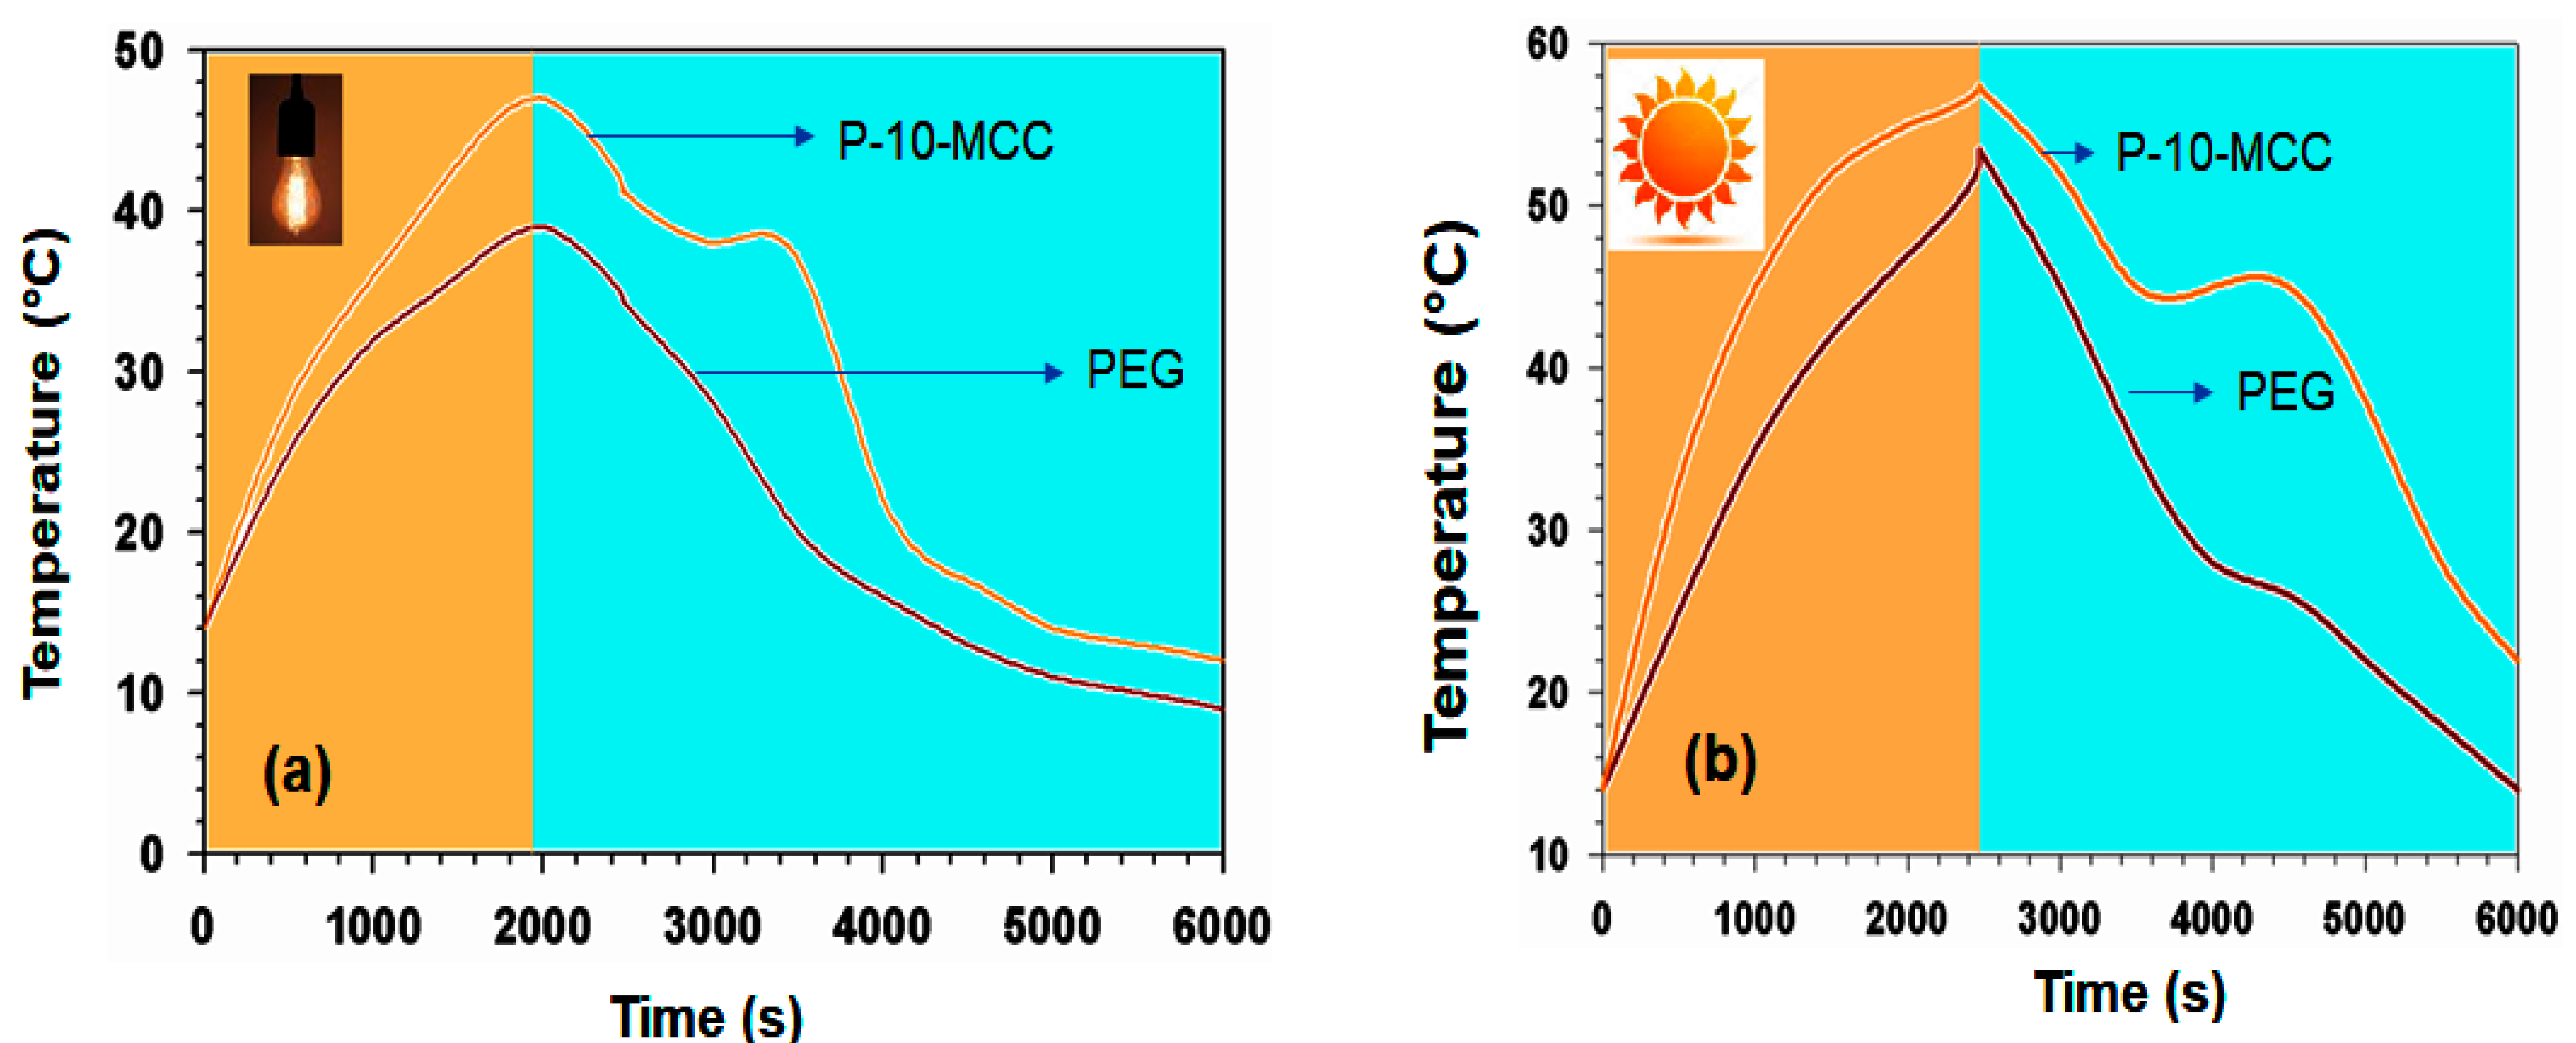
3.12. Solar-to-Thermal Energy Storage Efficiency
4. Conclusions
Supplementary Materials
Author Contributions
Funding
Data Availability Statement
Conflicts of Interest
References
- Heier, J.; Bales, C.; Martin, V. Combining Thermal Energy Storage with Buildings—A Review. Renew. Sustain. Energy Rev. 2015, 42, 1305–1325. [Google Scholar] [CrossRef]
- Cui, Y.; Xie, J.; Liu, J.; Wang, J.; Chen, S. A Review on Phase Change Material Application in Building. Adv. Mech. Eng. 2017, 9, 1–15. [Google Scholar] [CrossRef]
- Zahir, M.H.; Mohamed, S.A.; Saidur, R.; Al-Sulaiman, F.A. Supercooling of Phase-Change Materials and the Techniques Used to Mitigate the Phenomenon. Appl. Energy 2019, 240, 793–817. [Google Scholar] [CrossRef]
- Farid, M.M.; Khudhair, A.M.; Razack, S.A.K.; Al-Hallaj, S. A Review on Phase Change Energy Storage: Materials and Applications. Energy Convers. Manag. 2004, 45, 1597–1615. [Google Scholar] [CrossRef]
- Kenisarin, M.M. Thermophysical Properties of Some Organic Phase Change Materials for Latent Heat Storage. A Review. Sol. Energy 2014, 107, 553–575. [Google Scholar] [CrossRef]
- Zhang, N.; Yuan, Y.; Cao, X.; Du, Y.; Zhang, Z.; Gui, Y. Latent Heat Thermal Energy Storage Systems with Solid–Liquid Phase Change Materials: A Review. Adv. Eng. Mater. 2018, 20, 1–30. [Google Scholar] [CrossRef]
- Abhat, A. Low Temperature Latent Heat Thermal Energy Storage: Heat Storage Materials. Sol. Energy 1983, 30, 313–332. [Google Scholar] [CrossRef]
- Memon, S.A. Phase Change Materials Integrated in Building Walls: A State of the Art Review. Renew. Sustain. Energy Rev. 2014, 31, 870–906. [Google Scholar] [CrossRef]
- Kenisarin, M.M.; Kenisarina, K.M. Form-Stable Phase Change Materials for Thermal Energy Storage. Renew. Sustain. Energy Rev. 2012, 16, 1999–2040. [Google Scholar] [CrossRef]
- Liu, L.; Alva, G.; Huang, X.; Fang, G. Preparation, Heat Transfer and Flow Properties of Microencapsulated Phase Change Materials for Thermal Energy Storage. Renew. Sustain. Energy Rev. 2016, 66, 399–414. [Google Scholar] [CrossRef]
- Huang, X.; Liu, L.; Gao, H.; Dong, W.; Yang, M.; Wang, G. Hierarchically Nanostructured MnCo2O4 as Active Catalysts for the Synthesis of N-Benzylideneaniline from Benzyl Alcohol and Aniline. Green Chem. 2017, 19, 769–777. [Google Scholar] [CrossRef]
- Zhang, Y.; Gurzadyan, G.G.; Umair, M.M.; Wang, W.; Lu, R.; Zhang, S.; Tang, B. Ultrafast and Efficient Photothermal Conversion for Sunlight-Driven Thermal-Electric System. Chem. Eng. J. 2018, 344, 402–409. [Google Scholar] [CrossRef]
- Hao, Y.; Shao, X.; Liu, T.; Li, B.; Nie, S. Porous MgO Material with Ultrahigh Surface Area as the Matrix for Phase Change Composite. Thermochim. Acta 2015, 604, 45–51. [Google Scholar] [CrossRef]
- Zhang, S.; Zhou, M.; Lu, X.; Wu, C.; Sun, Y.; Xie, Y. Macroscaled Mesoporous Calcium Carbonate Tetragonal Prisms: Top-down Solid-Phase Fabrication and Applications of Phase-Change Material Support Matrices. CrystEngComm 2010, 12, 3571–3578. [Google Scholar] [CrossRef]
- Wang, W.; Yang, X.; Fang, Y.; Ding, J. Preparation and Performance of Form-Stable Polyethylene Glycol/Silicon Dioxide Composites as Solid-Liquid Phase Change Materials. Appl. Energy 2009, 86, 170–174. [Google Scholar] [CrossRef]
- Zhang, Z.; Zheng, Y.; Ni, Y.; Liu, Z.; Chen, J.; Liang, X. Temperature- and PH-Dependent Morphology and FT−IR Analysis of Magnesium Carbonate Hydrates. J. Phys. Chem. B 2006, 110, 12969–12973. [Google Scholar] [CrossRef]
- Zahir, M.H.; Irshad, K.; Aziz, M.A.; Shafiullah, M.; Rahman, M.M.; Hossain, M.M. Shape-Stabilized Phase Change Material for Solar Thermal Energy Storage: CaO Containing MgCO3 Mixed with Polyethylene Glycol. Energy Fuels 2019, 33, 12041–12051. [Google Scholar] [CrossRef]
- Xu, X.; Zhao, Y.; Lai, Q.; Hao, Y. Effect of Polyethylene Glycol on Phase and Morphology of Calcium Carbonate. J. Appl. Polym. Sci. 2010, 119, 319–324. [Google Scholar] [CrossRef]
- Yu, S.; Wang, X.; Wu, D. Microencapsulation of N-Octadecane Phase Change Material with Calcium Carbonate Shell for Enhancement of Thermal Conductivity and Serving Durability: Synthesis, Microstructure, and Performance Evaluation. Appl. Energy 2014, 114, 632–643. [Google Scholar] [CrossRef]
- Mesalhy, O.; Lafdi, K.; Elgafy, A.; Bowman, K. Numerical Study for Enhancing the Thermal Conductivity of Phase Change Material (PCM) Storage Using High Thermal Conductivity Porous Matrix. Energy Convers. Manag. 2005, 46, 847–867. [Google Scholar] [CrossRef]
- Wu, Z.G.; Zhao, C.Y. Experimental Investigations of Porous Materials in High Temperature Thermal Energy Storage Systems. Sol. Energy 2011, 85, 1371–1380. [Google Scholar] [CrossRef]
- Qian, T.; Li, J.; Min, X.; Deng, Y.; Guan, W.; Ma, H. Polyethylene Glycol/Mesoporous Calcium Silicate Shape-Stabilized Composite Phase Change Material: Preparation, Characterization, and Adjustable Thermal Property. Energy 2015, 82, 333–340. [Google Scholar] [CrossRef]
- Ma, X.; Li, L.; Yang, L.; Su, C.; Wang, K.; Yuan, S.; Zhou, J. Adsorption of Heavy Metal Ions Using Hierarchical CaCO 3-Maltose Meso/Macroporous Hybrid Materials: Adsorption Isotherms and Kinetic Studies. J. Hazard. Mater. 2012, 209–210, 467–477. [Google Scholar] [CrossRef]
- Kou, Y.; Wang, S.; Luo, J.; Sun, K.; Zhang, J.; Tan, Z.; Shi, Q. Thermal Analysis and Heat Capacity Study of Polyethylene Glycol (PEG) Phase Change Materials for Thermal Energy Storage Applications. J. Chem. Thermodyn. 2019, 128, 259–274. [Google Scholar] [CrossRef]
- Sharma, S.D.; Buddhi, D.; Sawhney, R.L. Accelerated Thermal Cycle Test of Latent Heat-Storage Materials. Sol. Energy 1999, 66, 483–490. [Google Scholar] [CrossRef]
- Al-Ahmed, A.; Sarı, A.; Mazumder, M.A.J.; Hekimoğlu, G.; Al-Sulaiman, F.A.; Inamuddin. Thermal Energy Storage and Thermal Conductivity Properties of Octadecanol-MWCNT Composite PCMs as Promising Organic Heat Storage Materials. Sci. Rep. 2020, 10, 1–15. [Google Scholar] [CrossRef]
- Mohamed, S.A.; Al-Sulaiman, F.A.; Ibrahim, N.I.; Zahir, M.H.; Al-Ahmed, A.; Saidur, R.; Yılbaş, B.S.; Sahin, A.Z. A Review on Current Status and Challenges of Inorganic Phase Change Materials for Thermal Energy Storage Systems. Renew. Sustain. Energy Rev. 2017, 70, 1072–1089. [Google Scholar] [CrossRef]
- Wang, T.; Wang, S.; Luo, R.; Zhu, C.; Akiyama, T.; Zhang, Z. Microencapsulation of Phase Change Materials with Binary Cores and Calcium Carbonate Shell for Thermal Energy Storage. Appl. Energy 2016, 171, 113–119. [Google Scholar] [CrossRef]
- Tang, B.; Wang, Y.; Qiu, M.; Zhang, S. A Full-Band Sunlight-Driven Carbon Nanotube/PEG/SiO2 Composites for Solar Energy Storage. Sol. Energy Mater. Sol. Cells 2014, 123, 7–12. [Google Scholar] [CrossRef]
- Yu, S.; Wang, X.; Wu, D. Self-Assembly Synthesis of Microencapsulated n-Eicosane Phase-Change Materials with Crystalline-Phase-Controllable Calcium Carbonate Shell. Energy Fuels 2014, 5, 3519–3529. [Google Scholar] [CrossRef]
- Tomić, Z.; Makreski, P.; Gajić, B. Identification and Spectra-Structure Determination of Soil Minerals: Raman Study Supported by IR Spectroscopy and x-Ray Powder Diffraction. J. Raman Spectrosc. 2010, 41, 582–586. [Google Scholar] [CrossRef]
- Kelleher, I.J.; Redfern, S.A.T. Hydrous Calcium Magnesium Carbonate: A Possible Precursor to the Formation of Sedimentary Dolomite. Mol. Simul. 2002, 28, 557–572. [Google Scholar] [CrossRef]
- Barabas, M.; Bach, A.; Mudelsee, M.; Mangini, A. Influence of the Mg-Content on ESR-Signals in Synthetic Calcium Carbonate. Int. J. Radiat. Appl. Instrum. Part 1989, 40, 1105–1111. [Google Scholar] [CrossRef][Green Version]
- Rodriguez-Blanco, J.D.; Shaw, S.; Bots, P.; Roncal-Herrero, T.; Benning, L.G. The Role of PH and Mg on the Stability and Crystallization of Amorphous Calcium Carbonate. J. Alloy. Compd. 2012, 536 (Suppl. 1), S477–S479. [Google Scholar] [CrossRef]
- Cheng, L.; Lei, L.; Guo, S. In Vitro and in Vivo Evaluation of Praziquantel Loaded Implants Based on PEG/PCL Blends. Int. J. Pharm. 2010, 387, 129–138. [Google Scholar] [CrossRef]
- Gao, Y.; Gao, Z.; Sun, W.; Yin, Z.; Wang, J.; Hu, Y. Adsorption of a Novel Reagent Scheme on Scheelite and Calcite Causing an Effective Flotation Separation. J. Colloid Interface Sci. 2018, 512, 39–46. [Google Scholar] [CrossRef] [PubMed]
- Karaman, S.; Karaipekli, A.; Sar, A.; Biçer, A. Polyethylene Glycol (PEG)/Diatomite Composite as a Novel Form-Stable Phase Change Material for Thermal Energy Storage. Sol. Energy Mater. Sol. Cells 2011, 95, 1647–1653. [Google Scholar] [CrossRef]
- Gao, C.; Zhang, W.; Li, H.; Lang, L.; Xu, Z. Controllable Fabrication of Mesoporous MgO with Various Morphologies and Their Absorption Performance for Toxic Pollutants in Water. Cryst. Growth Des. 2008, 8, 3785–3790. [Google Scholar] [CrossRef]
- Tong, H.; Ma, W.; Wang, L.; Wan, P.; Hu, J.; Cao, L. Control over the Crystal Phase, Shape, Size and Aggregation of Calcium Carbonate via a L-Aspartic Acid Inducing Process. Biomaterials 2004, 25, 3923–3929. [Google Scholar] [CrossRef]
- Liu, D.; Yuan, P.; Tan, D.; Liu, H.; Wang, T.; Fan, M.; Zhu, J.; He, H. Facile Preparation of Hierarchically Porous Carbon Using Diatomite as Both Template and Catalyst and Methylene Blue Adsorption of Carbon Products. J. Colloid Interface Sci. 2012, 388, 176–184. [Google Scholar] [CrossRef]
- Zahir, M.H.; Rahman, M.M. Calcium-Doped Magnesium Carbonate-Polymer-Based Synergistic Phase Change Composite. US 10,626,238 B2, 27 July 2020. [Google Scholar]
- Li, C.; Yu, H.; Song, Y.; Zhao, M. Synthesis and Characterization of PEG/ZSM-5 Composite Phase Change Materials for Latent Heat Storage. Renew. Energy 2018, 121, 45–52. [Google Scholar] [CrossRef]
- Luan, Y.; Yang, M.; Ma, Q.; Qi, Y.; Gao, H.; Wu, Z.; Wang, G. Introduction of an Organic Acid Phase Changing Material into Metal-Organic Frameworks and the Study of Its Thermal Properties. J. Mater. Chem. A 2016, 4, 7641–7649. [Google Scholar] [CrossRef]
- Liu, Z.; Wei, H.; Tang, B.; Xu, S.; Shufen, Z. Novel Light–Driven CF/PEG/SiO2 Composite Phase Change Materials with High Thermal Conductivity. Sol. Energy Mater. Sol. Cells 2018, 174, 538–544. [Google Scholar] [CrossRef]
- Zahir, M.H.; Rahman, M.M.; Irshad, K.; Rahman, M.M. Shape-Stabilized Phase Change Materials for Solar Energy Storage: MgO and Mg(OH)2 Mixed with Polyethylene Glycol. Nanomaterials 2019, 9, 1773. [Google Scholar] [CrossRef]
- Wang, W.; Wang, G.; Liu, Y.; Zheng, C.; Zhan, Y. Synthesis and Characterization of Aragonite Whiskers by a Novel and Simple Route. J. Mater. Chem. 2001, 11, 1752–1754. [Google Scholar] [CrossRef]
- Mitran, R.; Berger, D.; Munteanu, C.; Matei, C. Evaluation of Different Mesoporous Silica Supports for Energy Storage in Shape-Stabilized Phase Change Materials with Dual Thermal Responses. J. Phys. Chem. C 2015, 119, 15177–15184. [Google Scholar] [CrossRef]
- Mekaddem, N.; Ali, S.B.; Fois, M.; Hannachi, A. Paraffin/Expanded Perlite/Plaster as Thermal Energy Storage Composite. Energy Procedia 2019, 157, 1118–1129. [Google Scholar] [CrossRef]
- Zhang, Y.; Wang, J.; Qiu, J.; Jin, X.; Umair, M.M.; Lu, R.; Zhang, S.; Tang, B. Ag-Graphene/PEG Composite Phase Change Materials for Enhancing Solar-Thermal Energy Conversion and Storage Capacity. Appl. Energy 2019, 237, 83–90. [Google Scholar] [CrossRef]
- Karaipekli, A.; Biçer, A.; Sarı, A.; Tyagi, V.V. Thermal Characteristics of Expanded Perlite/Paraffin Composite Phase Change Material with Enhanced Thermal Conductivity Using Carbon Nanotubes. Energy Convers. Manag. 2017, 134, 373–381. [Google Scholar] [CrossRef]
- Chen, L.; Zou, R.; Xia, W.; Liu, Z.; Shang, Y.; Zhu, J.; Wang, Y.; Lin, J.; Xia, D.; Cao, A. Electro- and Photodriven Phase Change Composites Based on Wax-Infiltrated Carbon Nanotube Sponges. ACS Nano 2012, 6, 10884–10892. [Google Scholar] [CrossRef]
- Lu, Z.; Xu, B.; Zhang, J.; Zhu, Y.; Sun, G.; Li, Z. Preparation and Characterization of Expanded Perlite/Paraffin Composite as Form-Stable Phase Change Material. Sol. Energy 2014, 108, 460–466. [Google Scholar] [CrossRef]
- Pan, L.; Tao, Q.; Zhang, S.; Wang, S.; Zhang, J.; Wang, S.; Wang, Z.; Zhang, Z. Preparation, Characterization and Thermal Properties of Micro-Encapsulated Phase Change Materials. Sol. Energy Mater. Sol. Cells 2012, 98, 66–70. [Google Scholar] [CrossRef]
- Zhang, X.; Wen, R.; Tang, C.; Wu, B.; Huang, Z.; Min, X.; Huang, Y.; Liu, Y.; Fang, M.; Wu, X. Thermal Conductivity Enhancement of Polyethylene Glycol/Expanded Perlite with Carbon Layer for Heat Storage Application. Energy Build. 2016, 130, 113–121. [Google Scholar] [CrossRef]


| Material | Thermal Conductivity (Wm−1 K−1) | Reference |
|---|---|---|
| PEG-6000 | 0.2124 | This wok |
| CaCO3 | 2.167 | This work |
| PEG-6000/5MgCaCO3 | 0.3389 | This wok |
| PEG-6000/10MgCaCO3 | 0.5456 | This work |
| PEG-6000/15MgCaCO3 | 0.5634 | This work |
| PEG6000 | 0.212 | [49] |
| GNS | 0.257 | [49] |
| Ag–GNS/PEG-1 | 0.317 | [49] |
| Ag–GNS/PEG-2 | 0.337 | [49] |
| Ag–GNS/PEG-3 | 0.367 | [49] |
| Ag–GNS/PEG-4 | 0.414 | [49] |
| Paraffin wax (RT27) | 0.166 | [50] |
| RT27/Expanded perlite | 0.167 | [50] |
| RT27/EP/Sikalatex(SL) | 0.149 | [50] |
| RT27/EP/SL/AL | 0.247 | [50] |
| PEG | 0.263 | [51] |
| EP | 0.058 | [51] |
| PEG/EP | 0.161 | [51] |
| PEG/EP/Carbon layer | 0.479 | [51] |
| ExP | 0.05 | [52] |
| Eicosane (C20) | 0.22 | [52] |
| EP/C20 60% | 0.15 | [52] |
| EP/C20 60%/CNT 0.3% | 0.19 | [52] |
| EP/C20 60%/CNT 0.5% | 0.24 | [52] |
| EP/C20 60%/CNT 1% | 0.32 | [52] |
Publisher’s Note: MDPI stays neutral with regard to jurisdictional claims in published maps and institutional affiliations. |
© 2021 by the authors. Licensee MDPI, Basel, Switzerland. This article is an open access article distributed under the terms and conditions of the Creative Commons Attribution (CC BY) license (https://creativecommons.org/licenses/by/4.0/).
Share and Cite
Zahir, M.H.; Rahman, M.M.; Basamad, S.K.S.; Mohaisen, K.O.; Irshad, K.; Rahman, M.M.; Aziz, M.A.; Ali, A.; Hossain, M.M. Preparation of a Sustainable Shape-Stabilized Phase Change Material for Thermal Energy Storage Based on Mg2+-Doped CaCO3/PEG Composites. Nanomaterials 2021, 11, 1639. https://doi.org/10.3390/nano11071639
Zahir MH, Rahman MM, Basamad SKS, Mohaisen KO, Irshad K, Rahman MM, Aziz MA, Ali A, Hossain MM. Preparation of a Sustainable Shape-Stabilized Phase Change Material for Thermal Energy Storage Based on Mg2+-Doped CaCO3/PEG Composites. Nanomaterials. 2021; 11(7):1639. https://doi.org/10.3390/nano11071639
Chicago/Turabian StyleZahir, Md. Hasan, Mohammad Mominur Rahman, Salem K. S. Basamad, Khaled Own Mohaisen, Kashif Irshad, Mohammad Mizanur Rahman, Md. Abdul Aziz, Amjad Ali, and Mohammad M. Hossain. 2021. "Preparation of a Sustainable Shape-Stabilized Phase Change Material for Thermal Energy Storage Based on Mg2+-Doped CaCO3/PEG Composites" Nanomaterials 11, no. 7: 1639. https://doi.org/10.3390/nano11071639
APA StyleZahir, M. H., Rahman, M. M., Basamad, S. K. S., Mohaisen, K. O., Irshad, K., Rahman, M. M., Aziz, M. A., Ali, A., & Hossain, M. M. (2021). Preparation of a Sustainable Shape-Stabilized Phase Change Material for Thermal Energy Storage Based on Mg2+-Doped CaCO3/PEG Composites. Nanomaterials, 11(7), 1639. https://doi.org/10.3390/nano11071639