
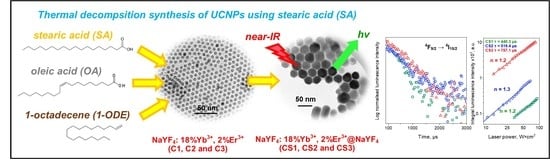
Improvement in Luminescence Intensity of β-NaYF4: 18%Yb3+, 2%Er3+@β-NaYF4 Nanoparticles as a Result of Synthesis in the Presence of Stearic Acid


Abstract
:
1. Introduction
2. Experimental Part
2.1. Materials
2.2. Synthesis of Materials
2.2.1. Synthesis of Rare Earth Precursors
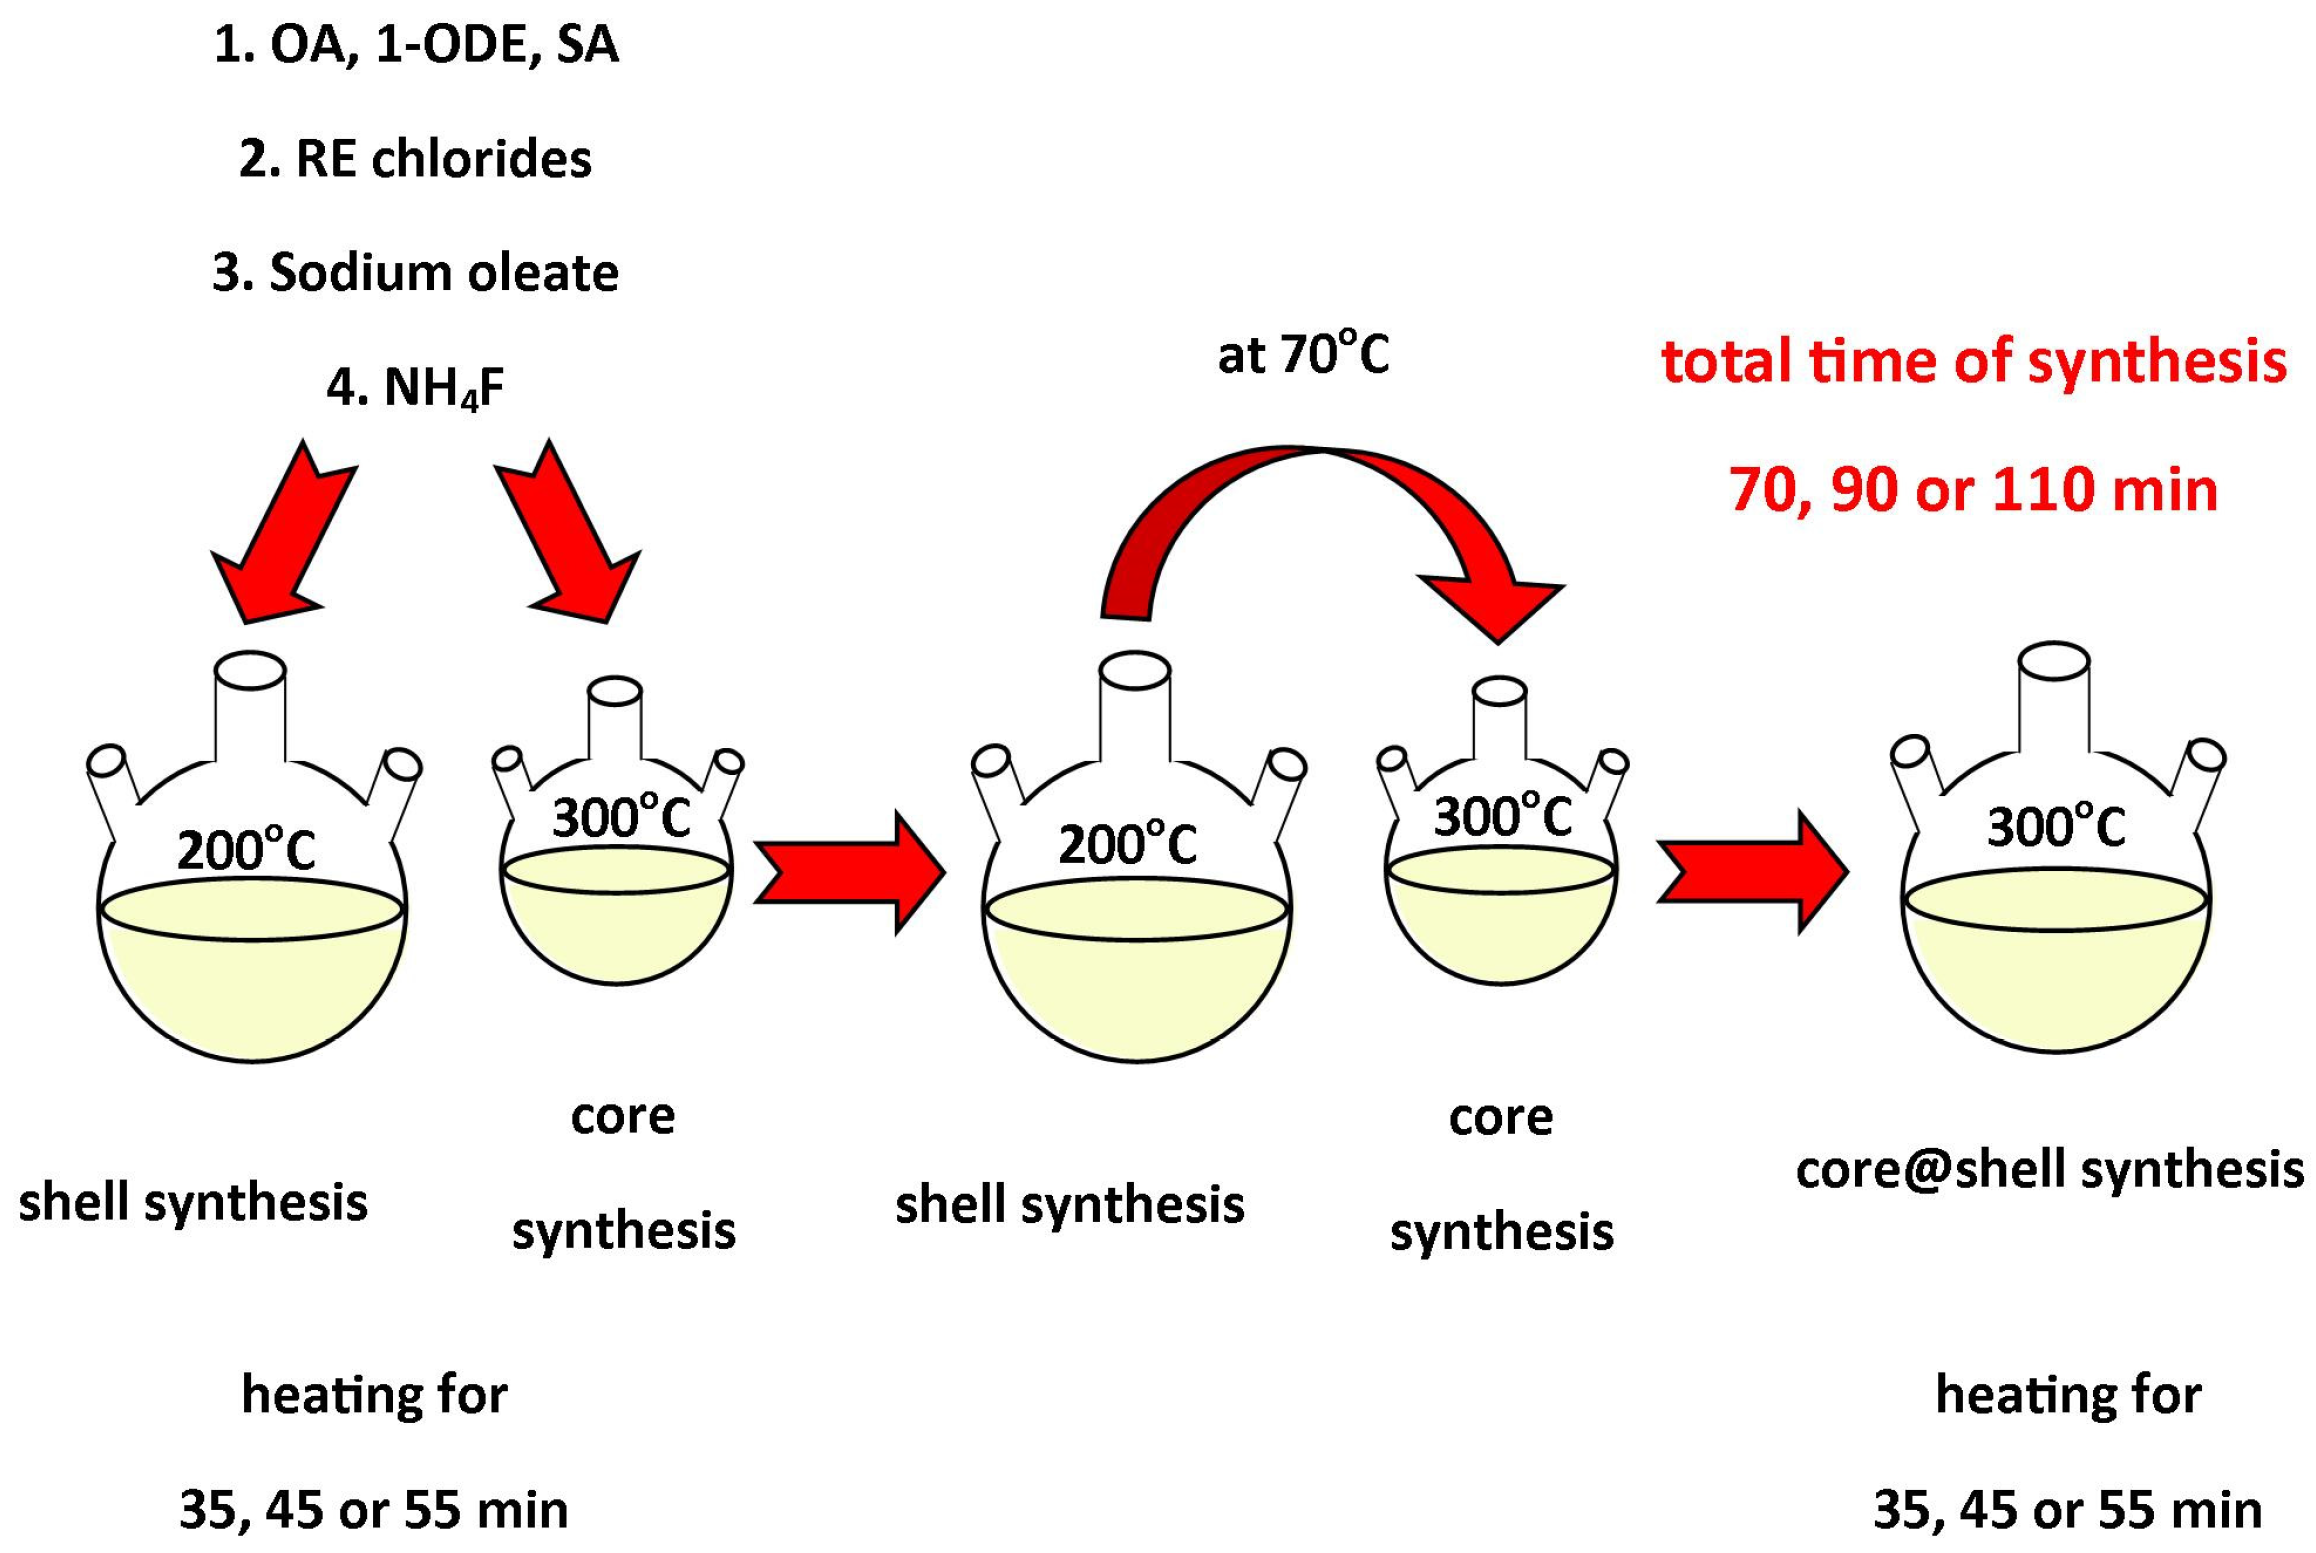
2.2.2. Synthesis of Nanomaterials
2.2.3. Synthesis of β-core NaYF4:18%Yb3+, 2%Er3+ and α-shell NaYF4 NPs
2.2.4. Synthesis of β-core@β-shell UCNPs
2.3. Characterization of Materials
3. Results and Discussion
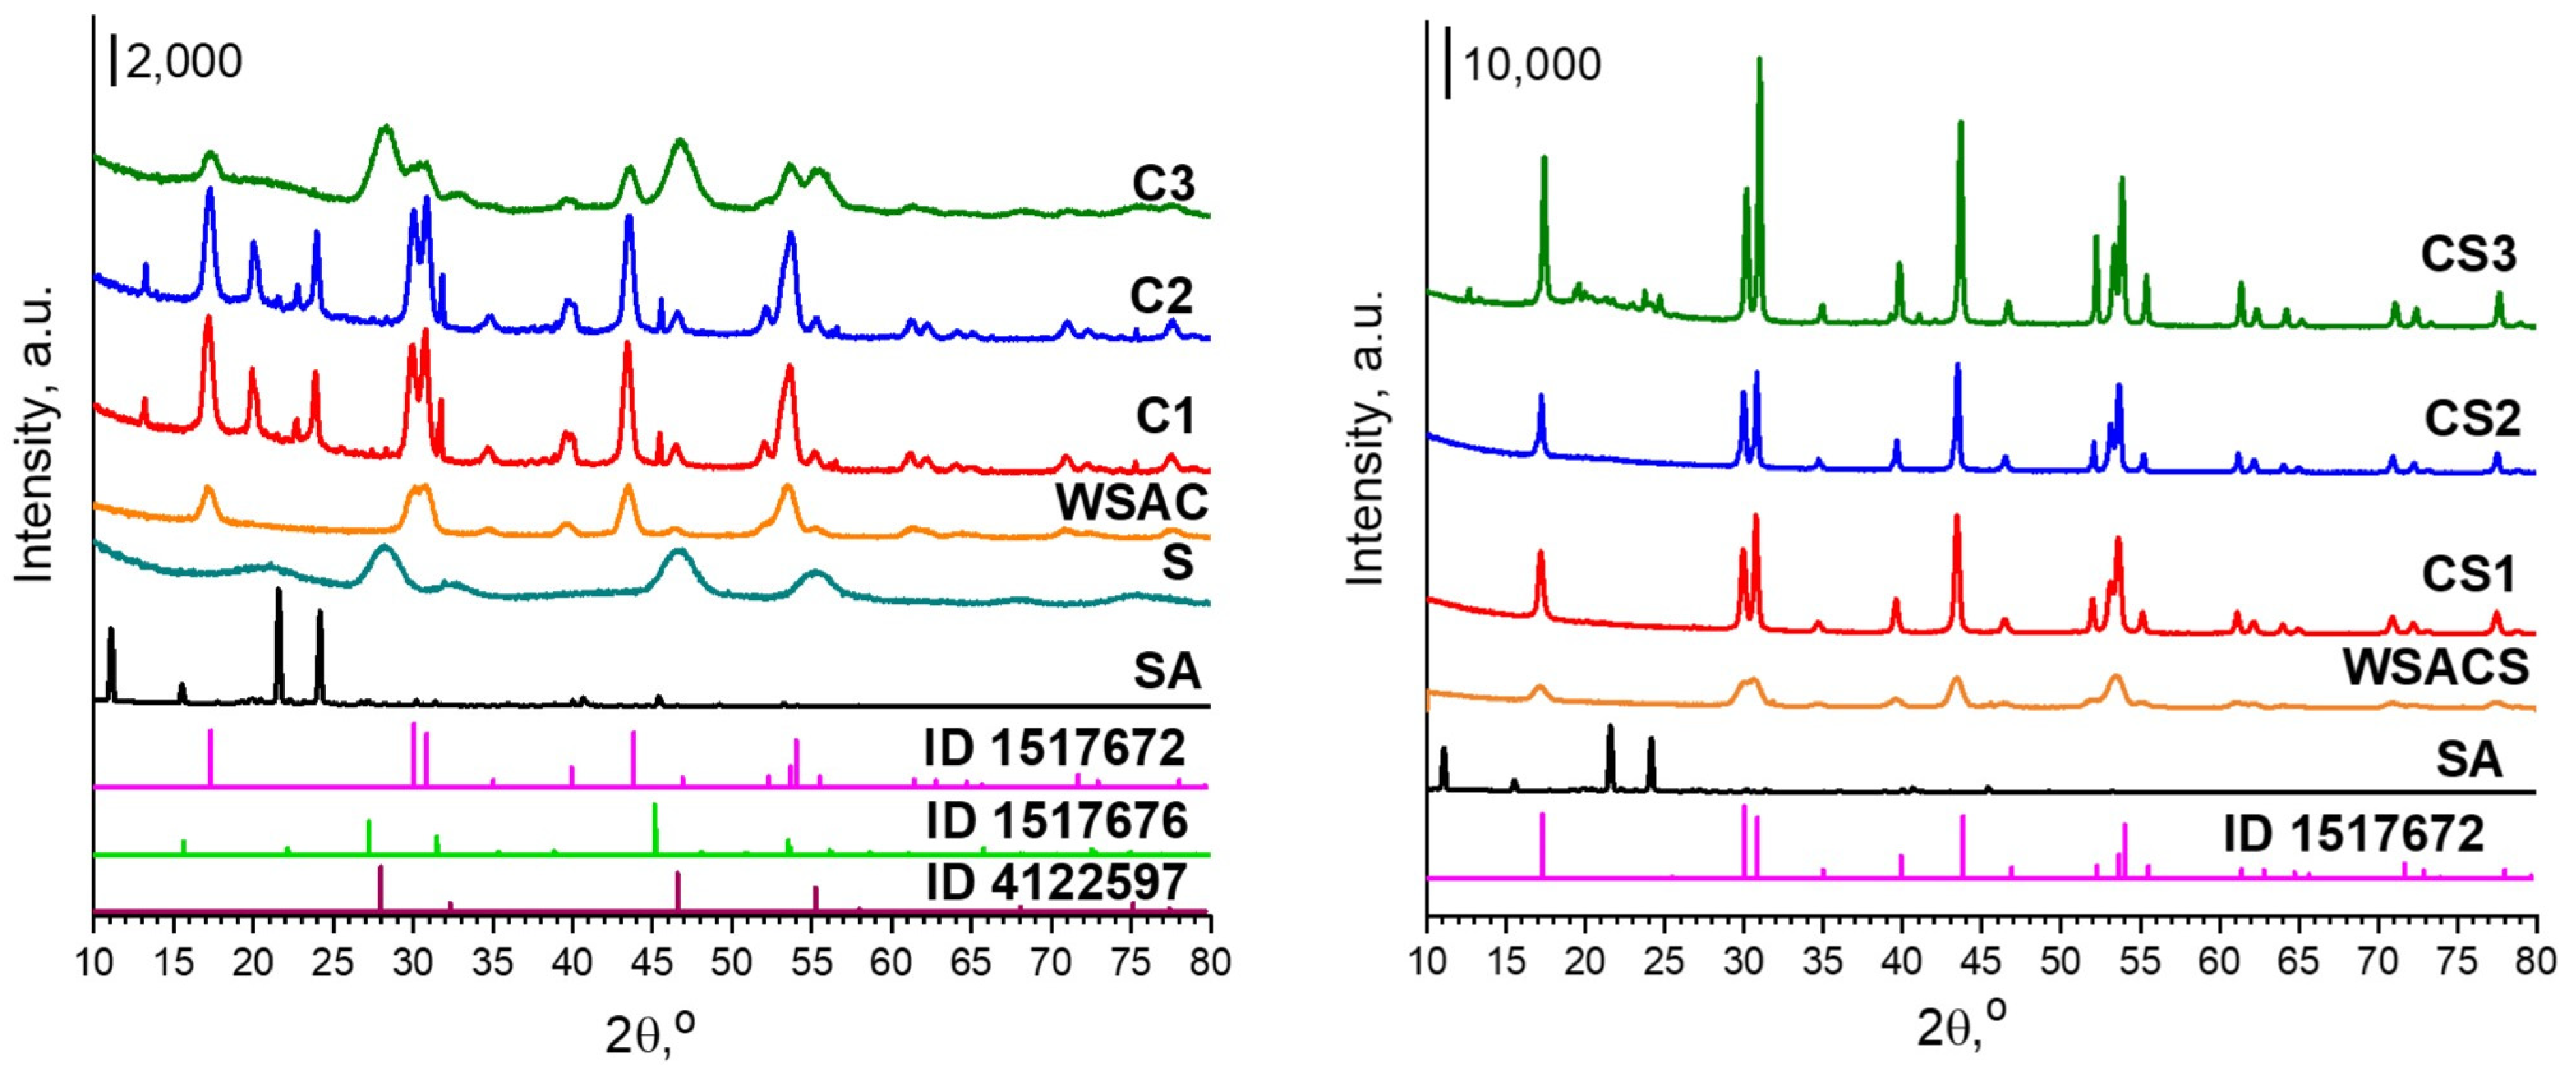
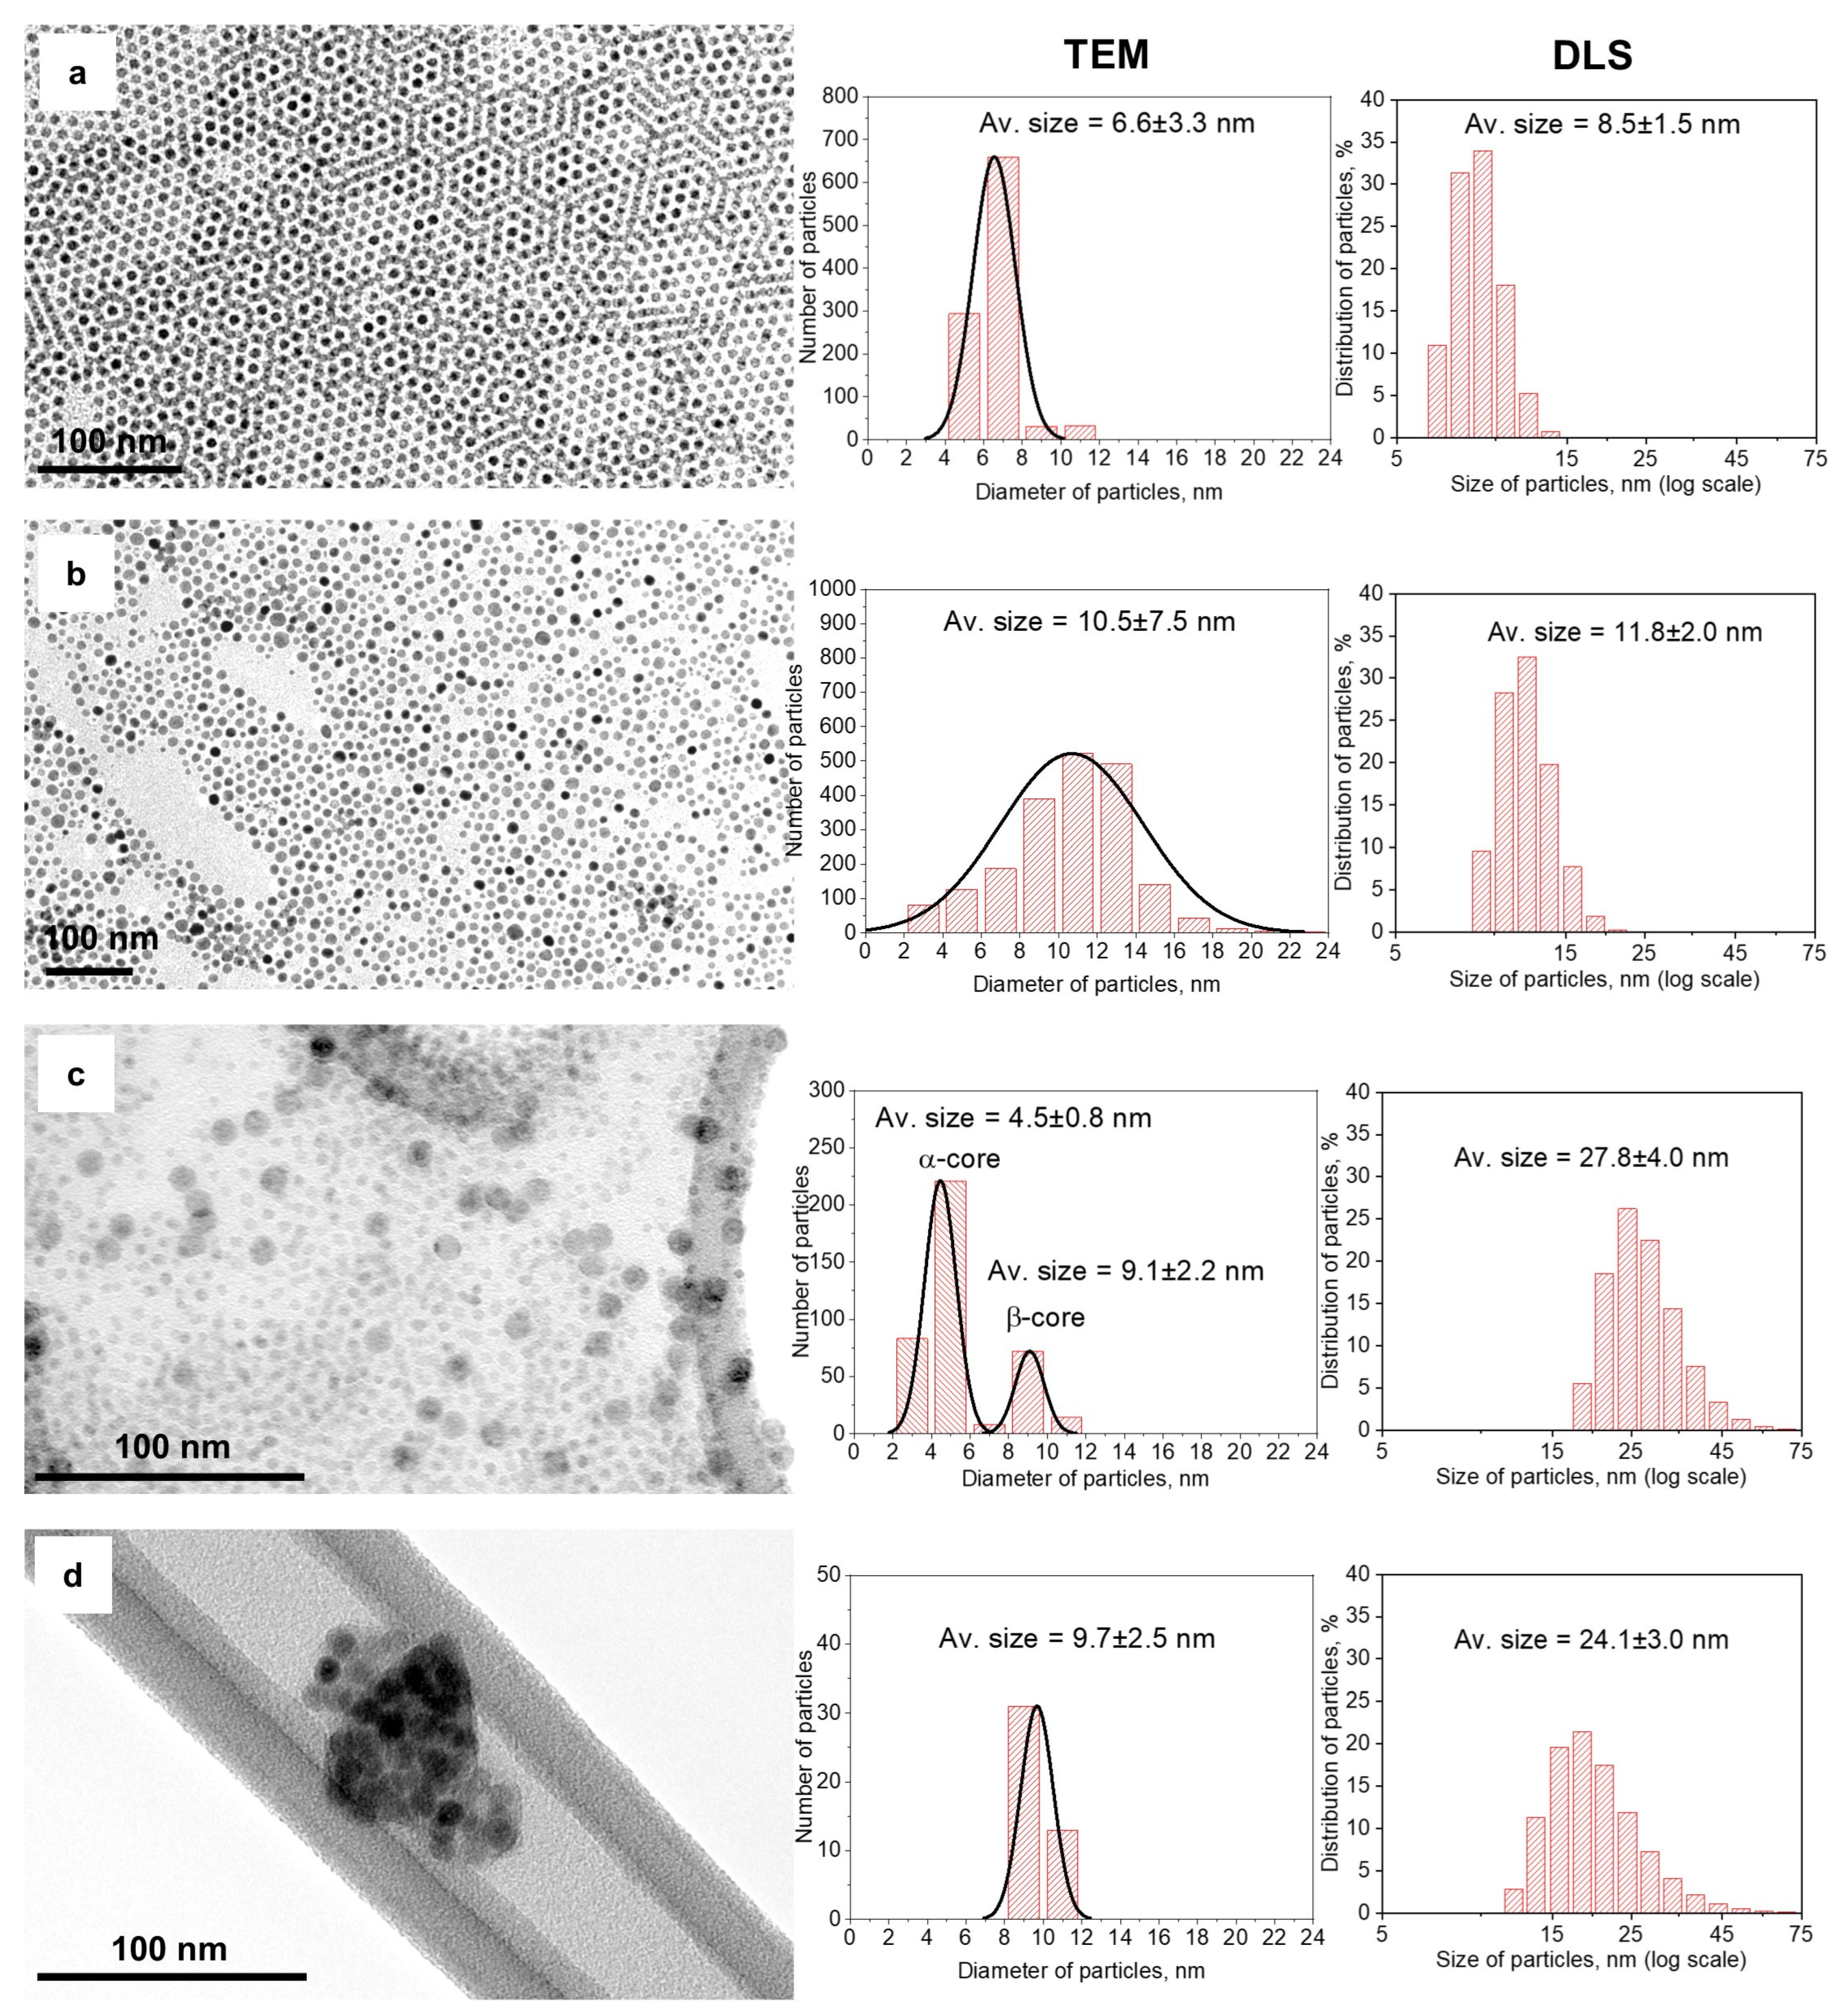
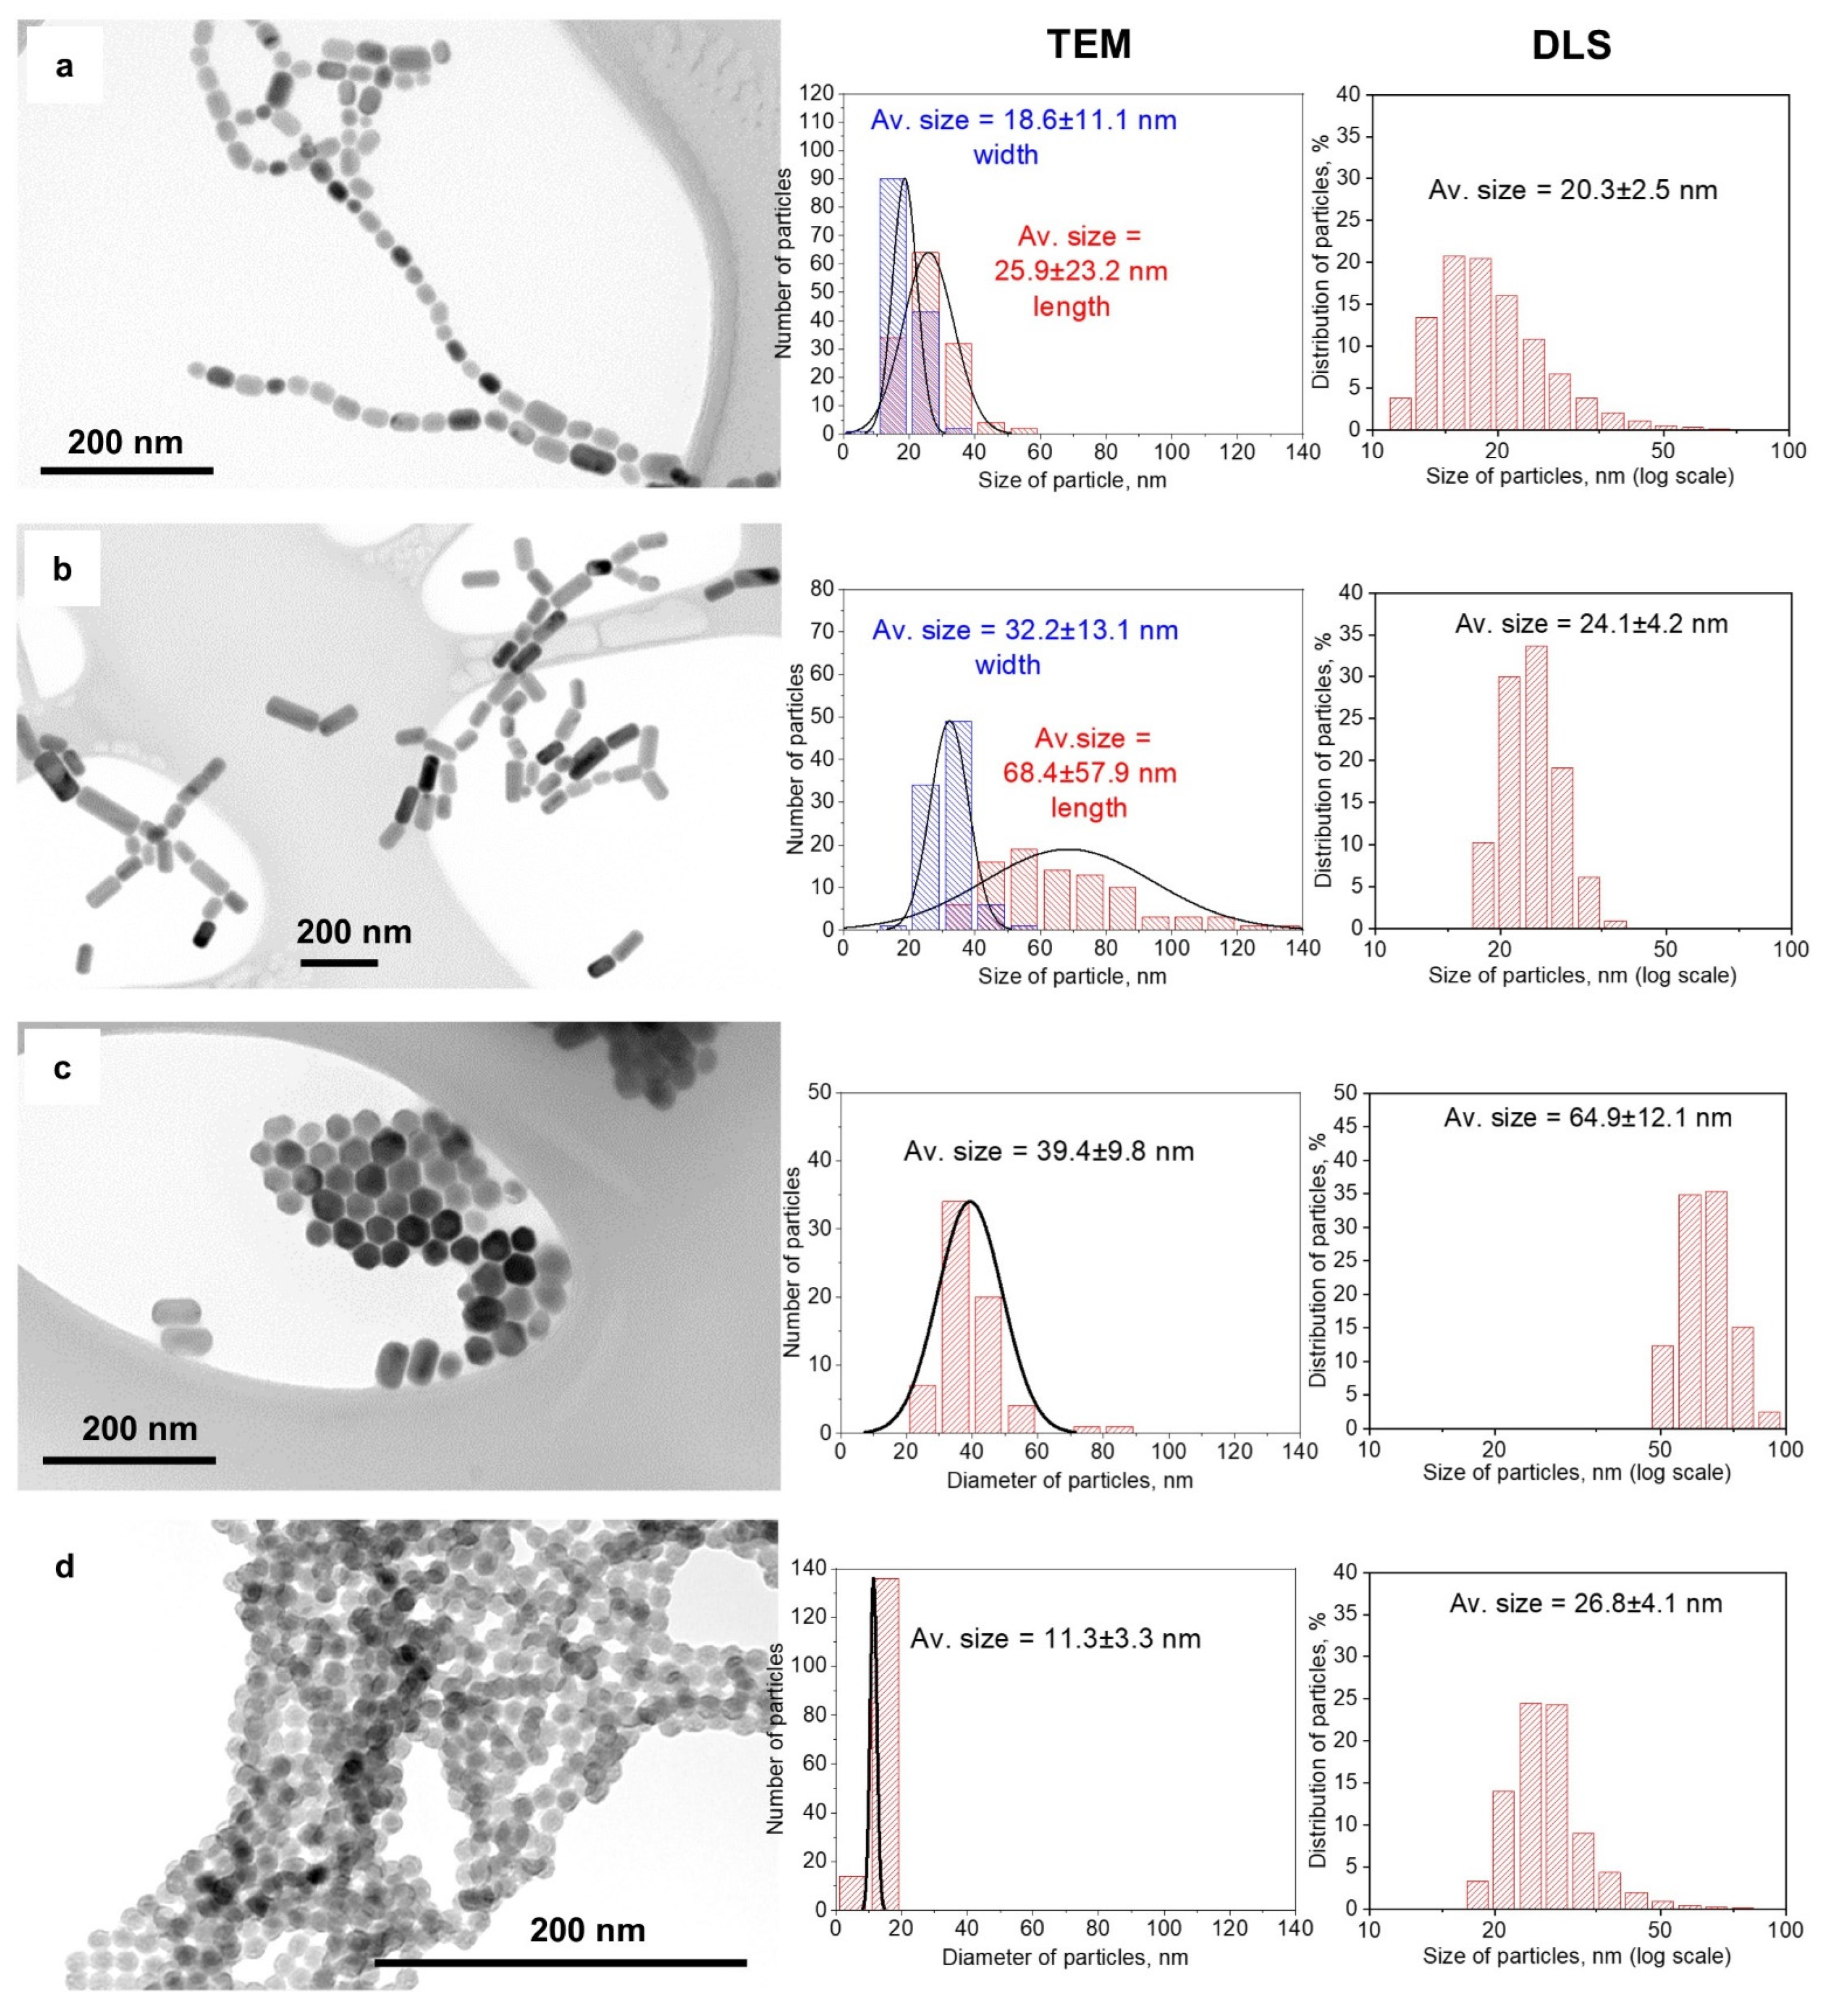
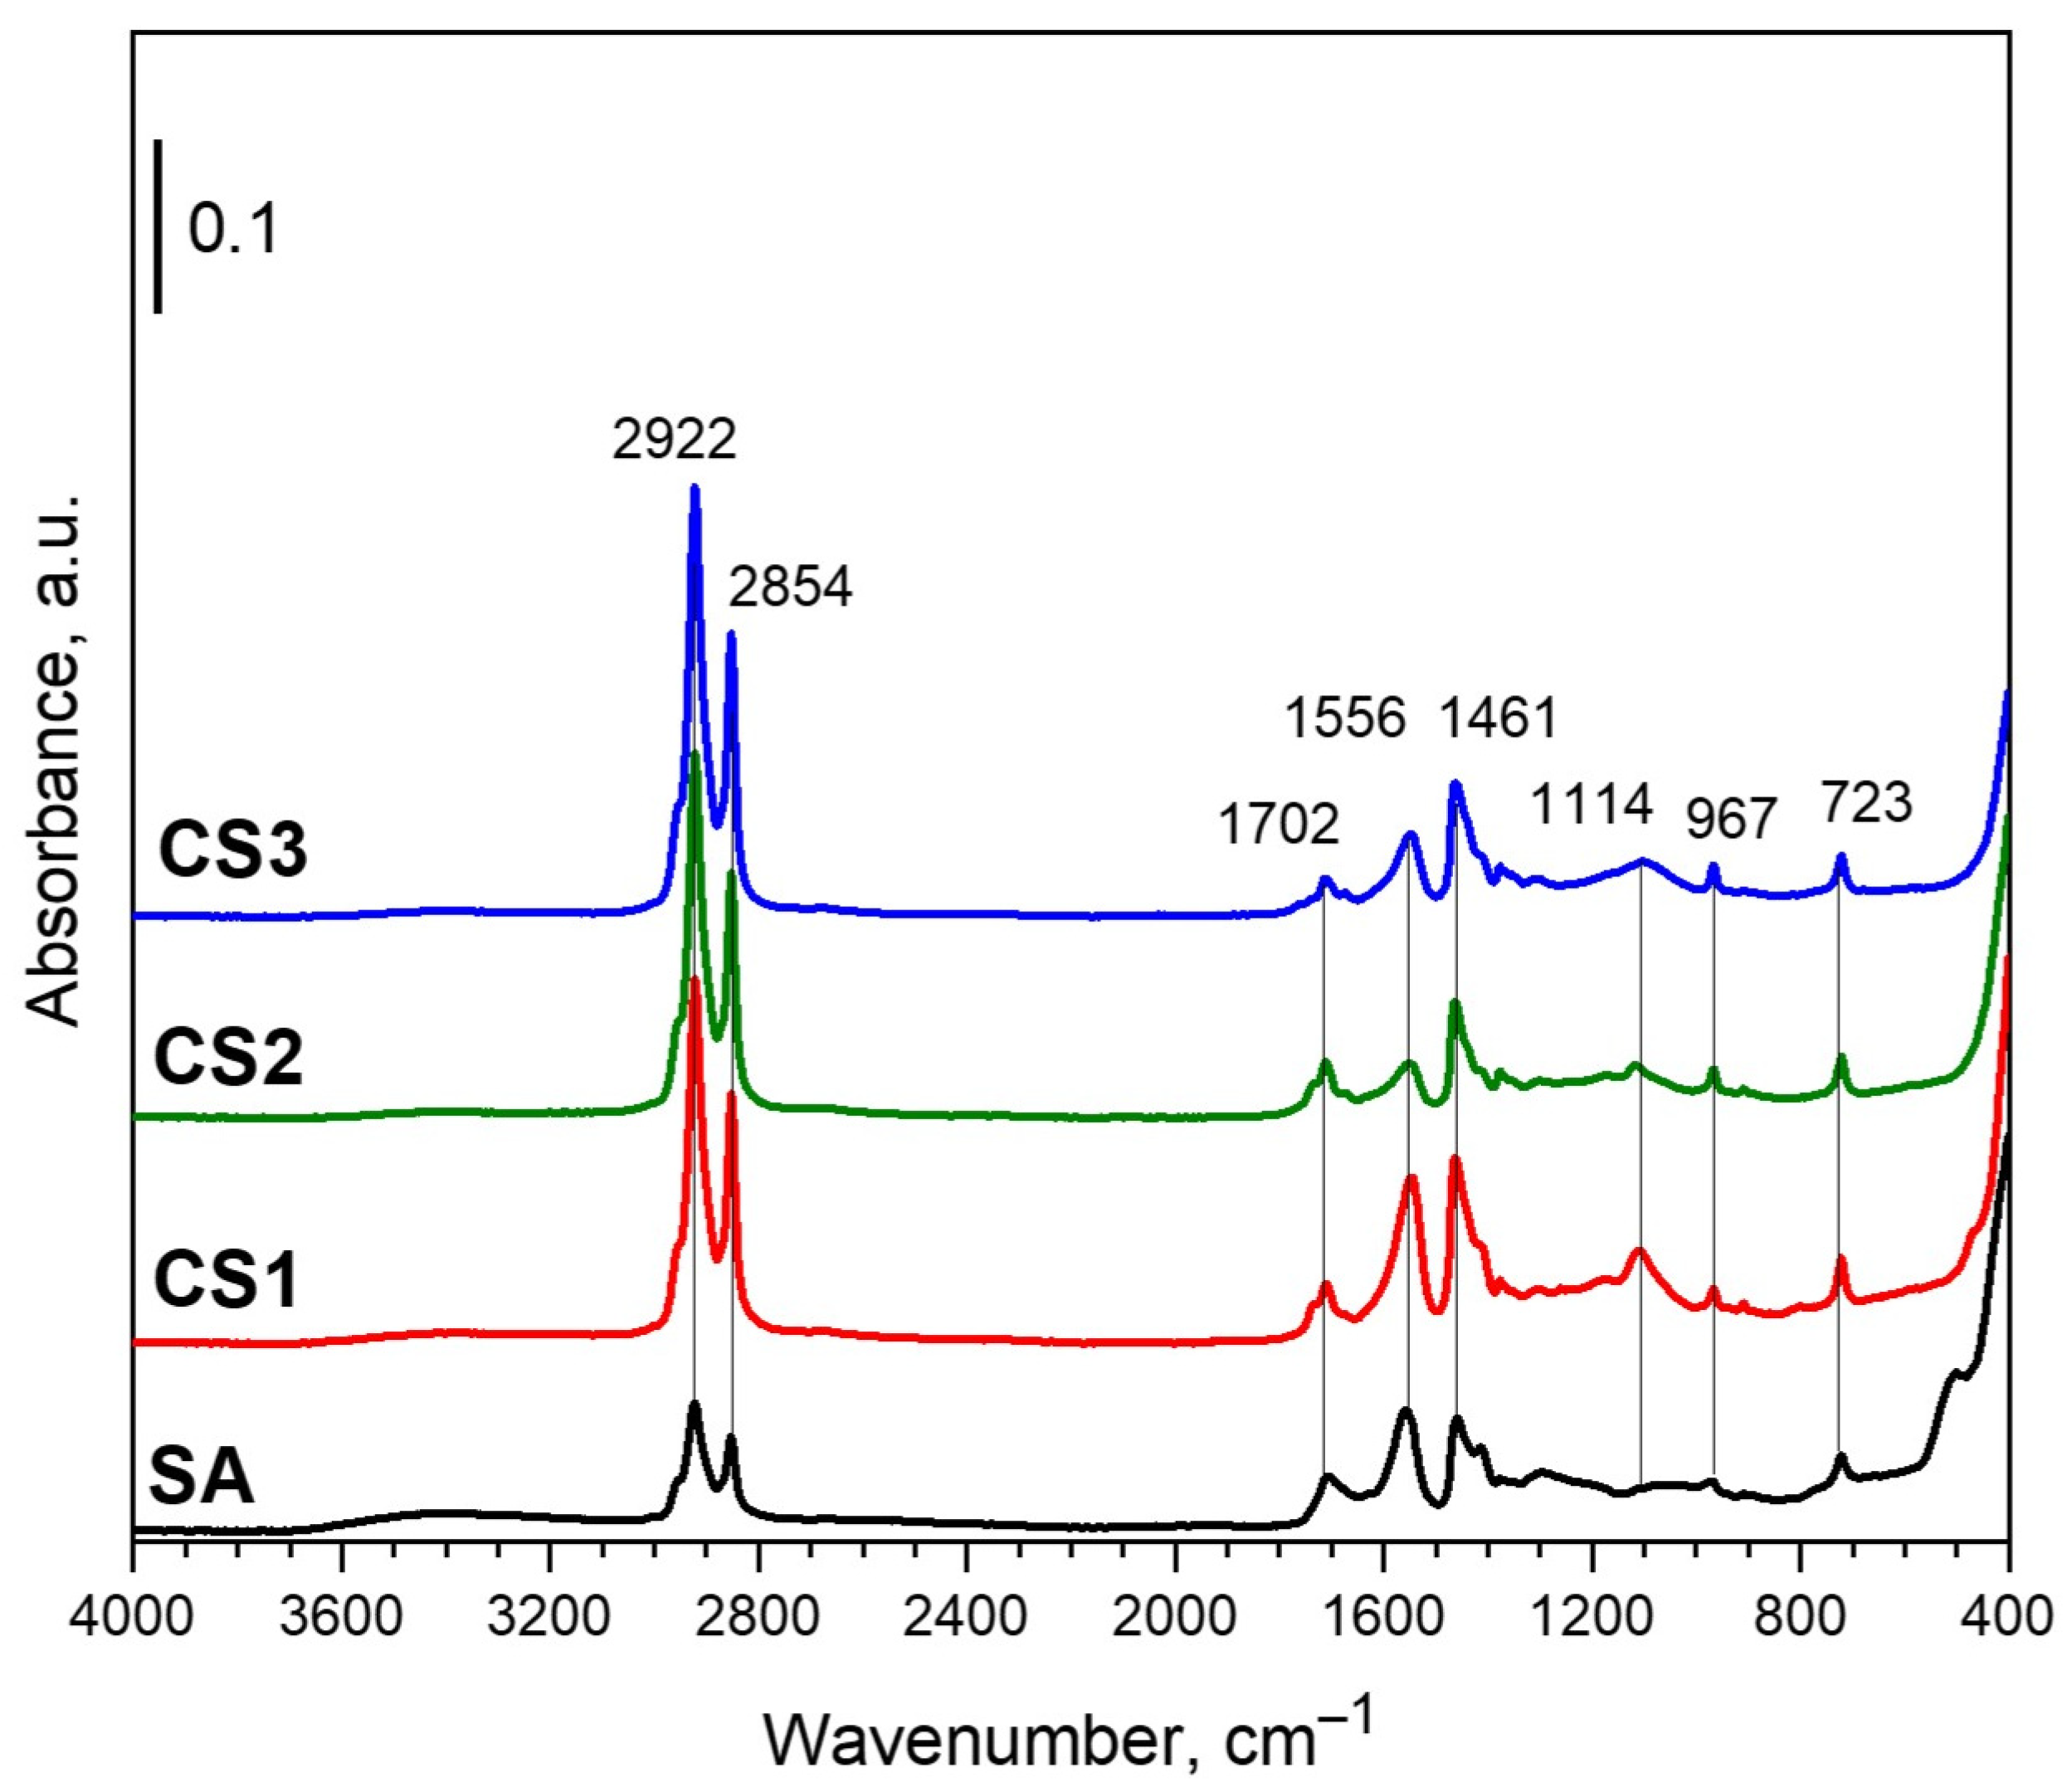
3.1. Structure and Morphology of NPs
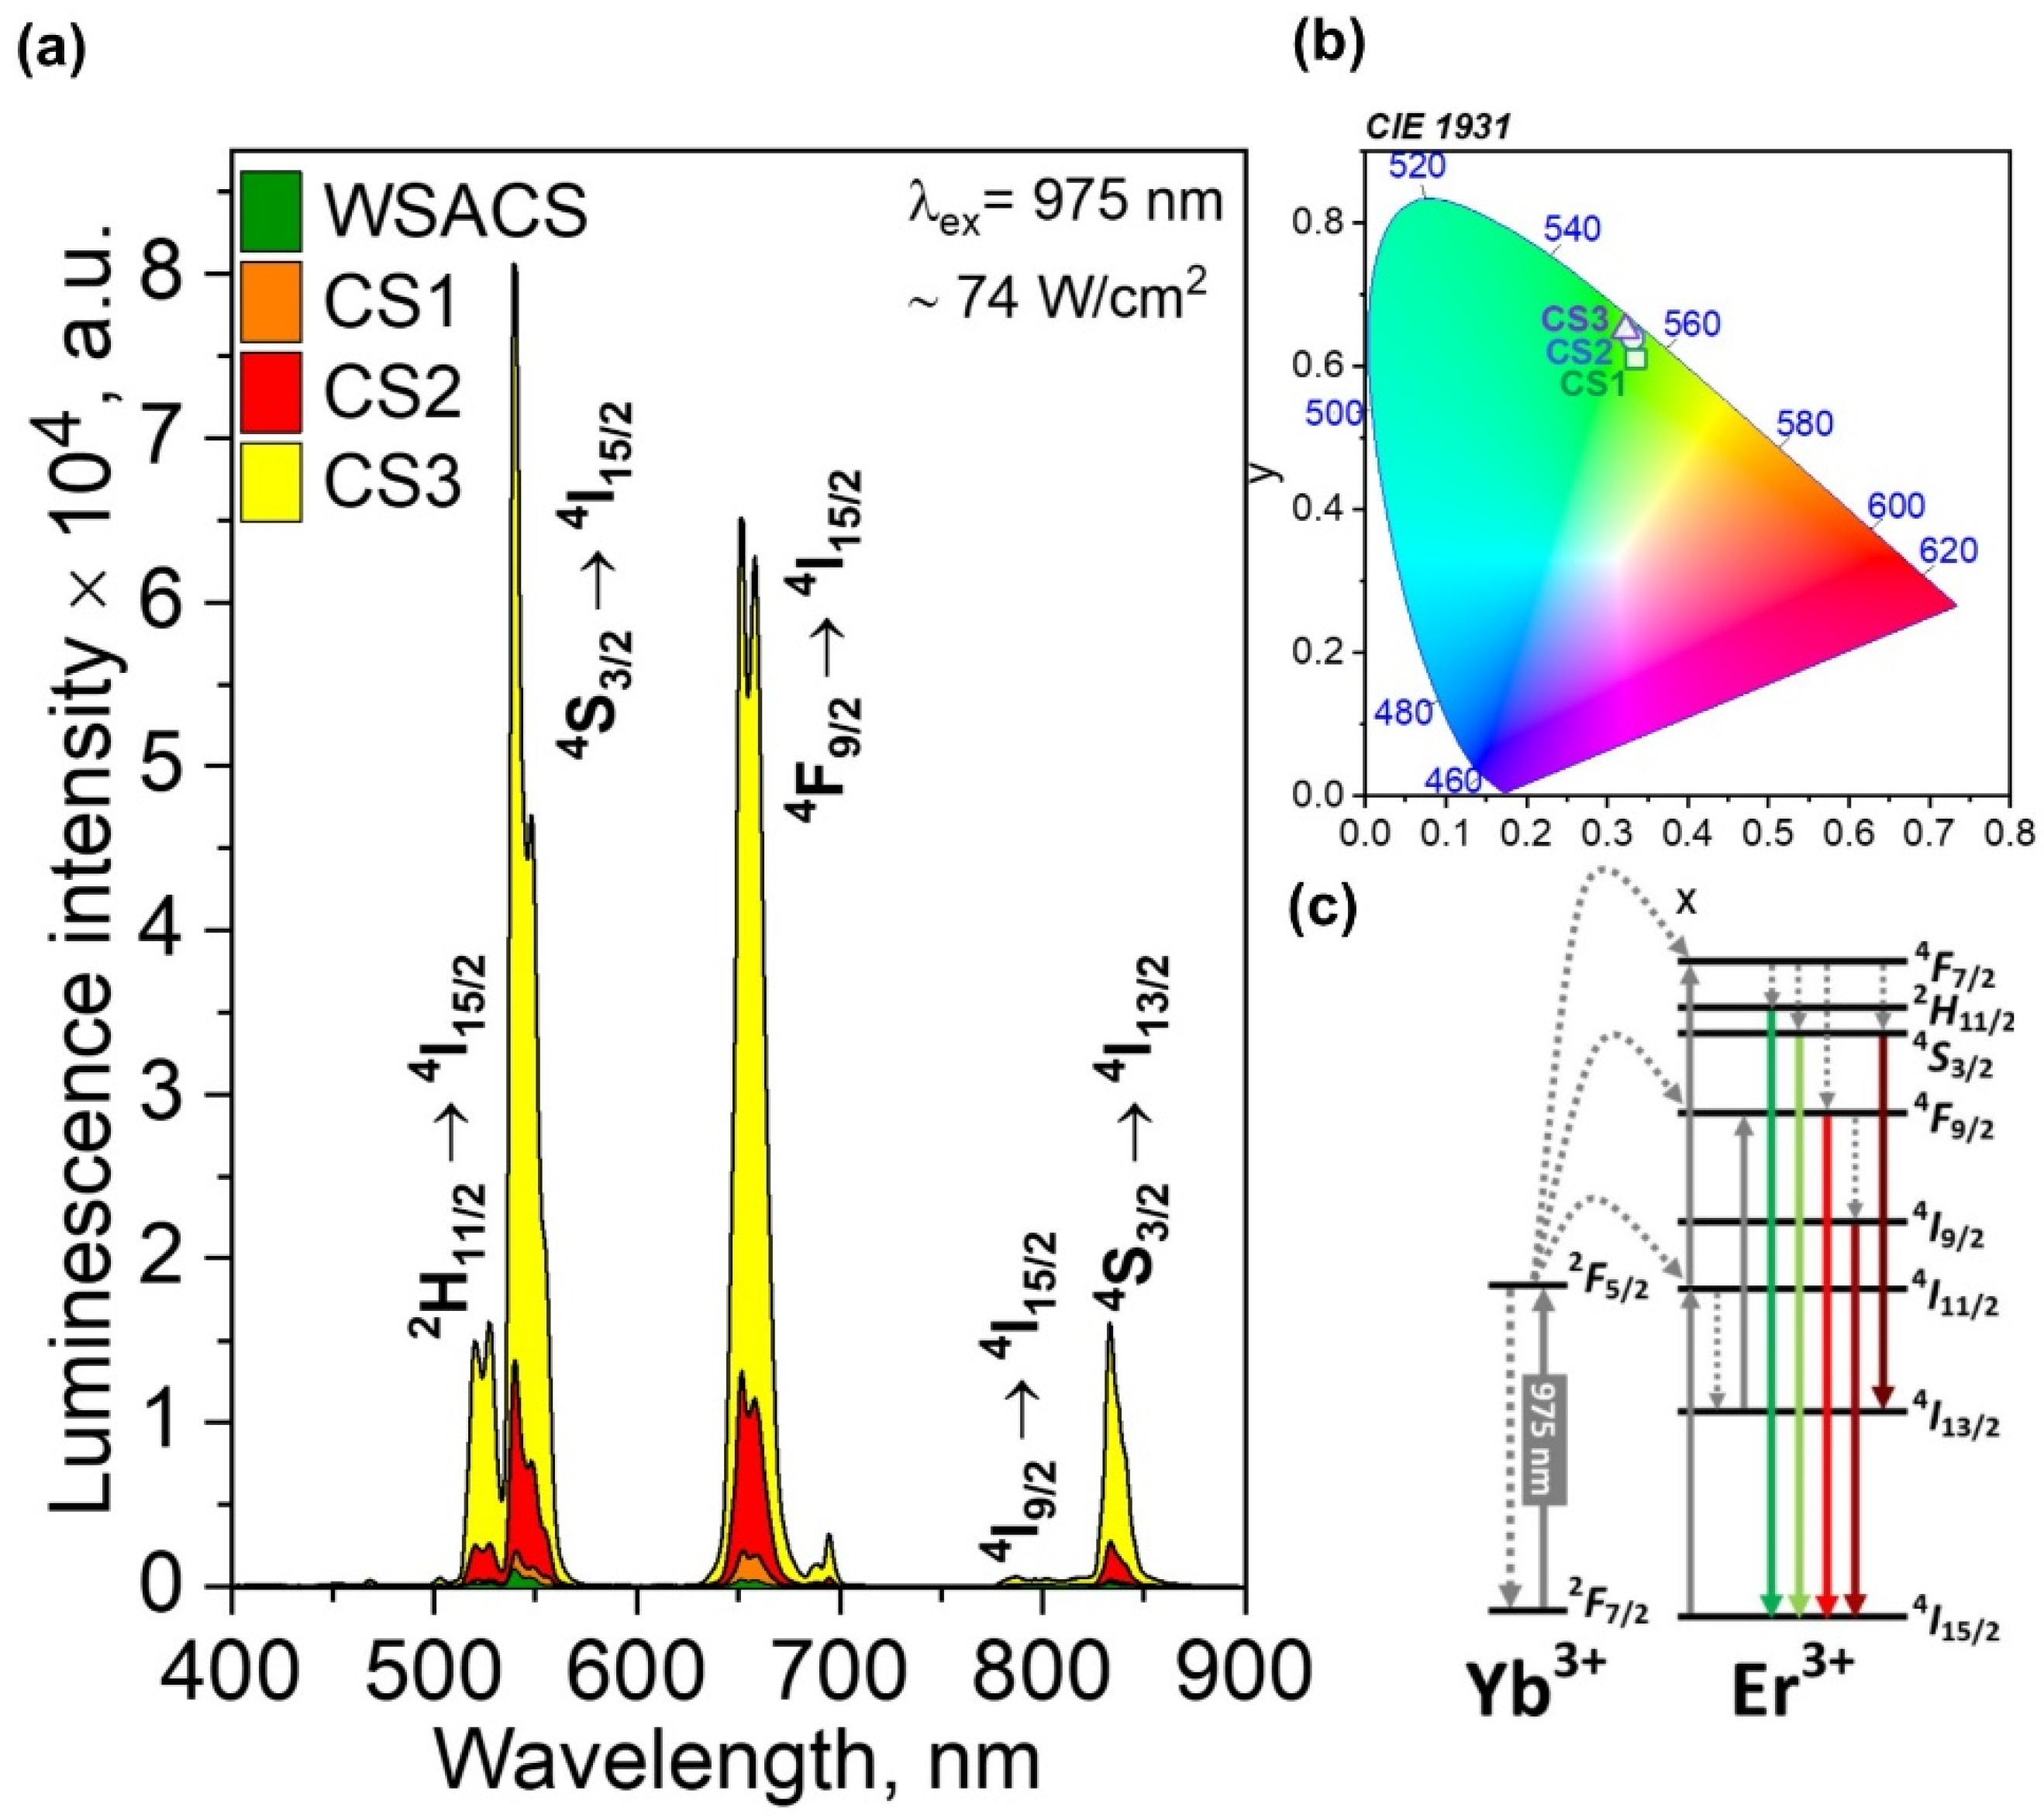
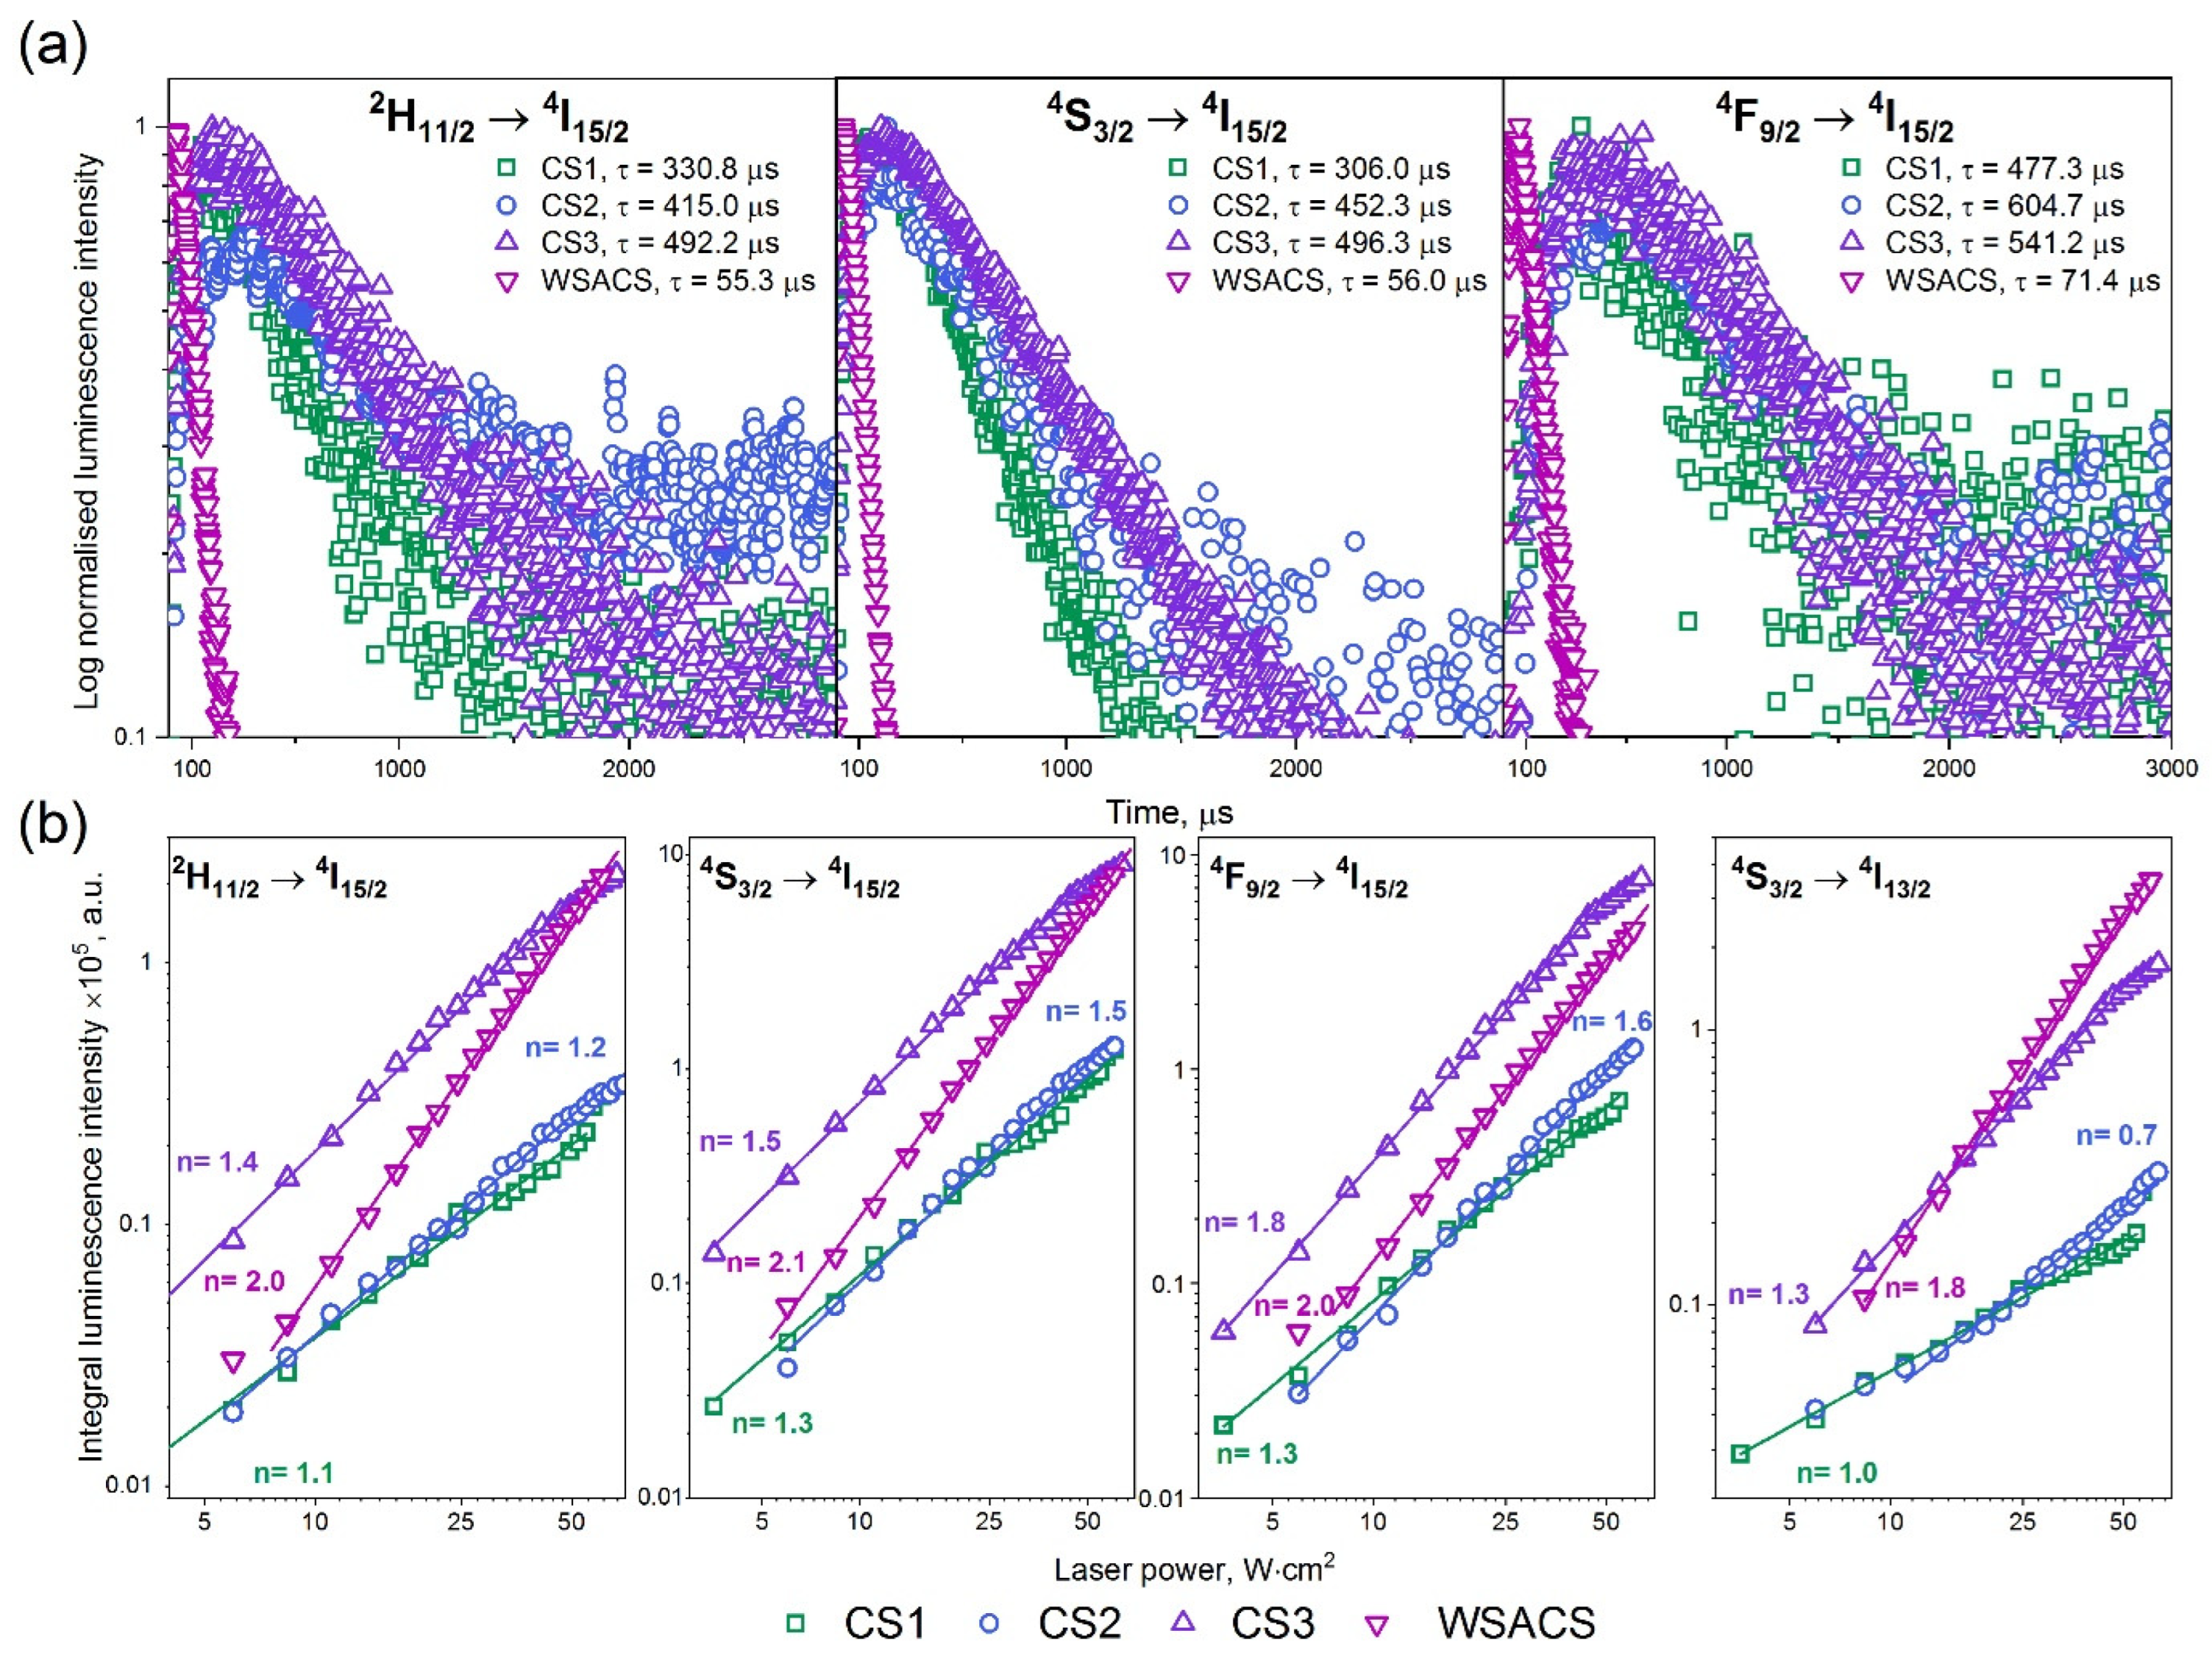
3.2. Luminescent Properties of NPs
4. Conclusions
Author Contributions
Funding
Institutional Review Board Statement
Informed Consent Statement
Data Availability Statement
Acknowledgments
Conflicts of Interest
References
- Kostiv, U.; Kučka, J.; Lobaz, V.; Kotov, N.; Janoušková, O.; Šlouf, M.; Krajnik, B.; Podhorodecki, A.; Francová, P.; Šefc, L.; et al. Highly colloidally stable trimodal 125I-radiolabeled PEG-neridronate-coated upconversion/magnetic bioimaging nanoprobes. Sci. Rep. 2020, 10, 20016. [Google Scholar] [CrossRef]
- Lee, J.S.; Kim, Y.J. The effects of preparation conditions on the structural and up-conversion properties of NaYF4:Yb3+, Er3+ nano powders. Opt. Mater. 2011, 33, 1111–1115. [Google Scholar] [CrossRef]
- Zhang, F. Photon Upconversion Nanomaterials; Springer: Berlin/Heidelberg, Germany, 2015. [Google Scholar] [CrossRef]
- Auzel, F. Upconversion and Anti-Stokes Processes with f and d Ions in Solids. Chem. Rev. 2004, 104, 139–173. [Google Scholar] [CrossRef] [PubMed]
- Lim, S.F.; Riehn, R.; Ryu, W.S.; Khanarian, N.; Tung, C.-K.; Tank, D.; Austin, R.H. In Vivo and Scanning Electron Microscopy Imaging of Upconverting Nanophosphors in Caenorhabditis elegans. Nano Lett. 2006, 6, 169–174. [Google Scholar] [CrossRef] [PubMed]
- Yu, S.; Gao, X.; Jing, H. Fabrication and characterization of novel magnetic/luminescent multifunctional nanocomposites for controlled drug release. Cryst. Eng. Comm. 2014, 16, 6645–6653. [Google Scholar] [CrossRef]
- Wang, F.; Banerjee, D.; Liu, Y.; Chen, X.; Liu, X. Upconversion nanoparticles in biological labeling, imaging and therapy. Analyst 2010, 135, 1839–1854. [Google Scholar] [CrossRef]
- Mickert, M.J.; Farka, Z.; Kostiv, U.; Hlaváček, A.; Horák, D.; Skládal, P.; Gorris, H.H. Measurement of Sub-femtomolar Concentrations of Prostate-Specific Antigen through Single-Molecule Counting with an Upconversion-Linked Immunosorbent Assay. Anal. Chem. 2019, 91, 9435–9441. [Google Scholar] [CrossRef]
- Wang, X.; Yakovliev, A.; Ohulchanskyy, T.Y.; Wu, L.; Zeng, S.; Han, X.; Qu, J.; Chen, G. Efficient Erbium-Sensitized Core/Shell Nanocrystals for Short Wave Infrared Bioimaging. Adv. Opt. Mater. 2018, 6, 1800690. [Google Scholar] [CrossRef]
- Deng, X.; Dai, Y.; Liu, J.; Zhou, Y.; Ma, P.; Cheng, Z.; Chen, Y.; Deng, K.; Li, X.; Hou, Z.; et al. Multifunctional hollow CaF2:Yb3+/Er3+/Mn2+-poly(2-Aminoethyl methacrylate) microspheres for Pt(IV) pro-drug delivery and tri-modal imaging. Biomaterials 2015, 50, 154–163. [Google Scholar] [CrossRef]
- Hamblin, M.R. Upconversion in photodynamic therapy: Plumbing the depths. Dalton Trans. 2018, 47, 8571–8580. [Google Scholar] [CrossRef]
- Zhu, X.; Feng, W.; Chang, J.; Tan, Y.-W.; Li, J.; Chen, M.; Sun, Y.; Li, F. Temperature-feedback upconversion nanocomposite for accurate photothermal therapy at facile temperature. Nat. Commun. 2016, 7, 10437. [Google Scholar] [CrossRef]
- Homann, C.; Krukewitt, L.; Frenzel, F.; Grauel, B.; Würth, C.; Resch-Genger, U.; Haase, M. NaYF4:Yb,Er/NaYF4 Core/Shell Nanocrystals with High Upconversion Luminescence Quantum Yield. Angew. Chem. Int. Ed. 2018, 57, 8765–8769. [Google Scholar] [CrossRef] [PubMed]
- Shao, W.; Hua, R.; Zhang, W. Hydrothermal synthesis of poly(acrylic acid)-functionalized α-(β-)NaYF4:Yb, Er up-conversion nano/micro-phosphors. Powder Technol. 2013, 237, 326–332. [Google Scholar] [CrossRef]
- Pin, M.W.; Park, E.J.; Choi, S.; Kim, Y.L.; Jeon, C.H.; Ha, T.H.; Kim, Y.H. Atomistic evolution during the phase transition on a metastable single NaYF4:Yb,Er upconversion nanoparticle. Sci. Rep. 2018, 8, 2199. [Google Scholar] [CrossRef] [PubMed] [Green Version]
- Bucior, B.J.; Rosen, A.S.; Haranczyk, M.; Yao, Z.; Ziebel, M.E.; Farha, O.K.; Hupp, J.T.; Siepmann, J.I.; Aspuru-Guzik, A.; Snurr, R.Q. Identification Schemes for Metal–Organic Frameworks To Enable Rapid Search and Cheminformatics Analysis. Cryst. Growth Des. 2019, 19, 6682–6697. [Google Scholar] [CrossRef]
- Johnson, N.J.J.; Korinek, A.; Dong, C.; van Veggel, F.C.J.M. Self-Focusing by Ostwald Ripening: A Strategy for Layer-by-Layer Epitaxial Growth on Upconverting Nanocrystals. J. Am. Chem. Soc. 2012, 134, 11068–11071. [Google Scholar] [CrossRef]
- Voss, B.; Haase, M. Intrinsic Focusing of the Particle Size Distribution in Colloids Containing Nanocrystals of Two Different Crystal Phases. ACS Nano 2013, 7, 11242–11254. [Google Scholar] [CrossRef] [PubMed]
- Kang, N.; Zhao, J.; Zhou, Y.; Ai, C.; Wang, X.; Ren, L. Enhanced upconversion luminescence intensity of core–shell NaYF4 nanocrystals guided by morphological control. Nanotechnology 2019, 30, 105701. [Google Scholar] [CrossRef] [PubMed]
- Tian, Q.; Tao, K.; Li, W.; Sun, K. Hot-Injection Approach for Two-Stage Formed Hexagonal NaYF4:Yb, Er Nanocrystals. J. Phys. Chem. C 2011, 115, 22886–22892. [Google Scholar] [CrossRef]
- Yordanov, G.G.; Yoshimura, H.; Dushkin, C.D. Synthesis of high-quality core–shell quantum dots of CdSe–CdS by means of gradual heating in liquid parafin. Colloid Polym. Sci. 2008, 286, 1097–1102. [Google Scholar] [CrossRef]
- Grzyb, T.; Węcławiak, M.; Pędziński, T.; Lis, S. Synthesis, spectroscopic and structural studies on YOF, LaOF and GdOF nanocrystals doped with Eu3+, synthesized via stearic acid method. Opt. Mater. 2013, 35, 2226–2233. [Google Scholar] [CrossRef]
- Dong, C.; Zhang, X.; Cai, H.; Cao, C.; Zhou, K.; Wang, X.; Xiao, X. Synthesis of stearic acid-stabilized silver nanoparticles in aqueous solution. Adv. Powder Technol. 2016, 27, 2416–2423. [Google Scholar] [CrossRef]
- Xiao, Q.; Xi, Y.; Wang, J.; Tu, D.; You, W.; Ye, X.; Liu, H.; Chen, X.; Lin, H. Combined In Situ Spectroscopies Reveal the Ligand Ordering-Modulated Photoluminescence of Upconverting Nanoparticles. J. Phys. Chem. C 2020, 124, 23086–23093. [Google Scholar] [CrossRef]
- Cepeda-Perez, E.; Doblas, D.; Kraus, T.; de Jonge, N. Electron microscopy of nanoparticle superlattice formation at a solid-liquid interface in nonpolar liquids. Sci. Adv. 2020, 6, 1404. [Google Scholar] [CrossRef] [PubMed]
- Carneiro, L.M.; Cushing, S.K.; Liu, C.; Su, Y.; Yang, P.; Alivisatos, A.P.; Leone, S.R. Excitation-wavelength-dependent small polaron trapping of photoexcited carriers in α-Fe2O3. Nat. Mater. 2017, 16, 819–825. [Google Scholar] [CrossRef] [PubMed] [Green Version]
- Zobel, M.; Neder, R.B.; Kimber, S.A.J. Universal solvent restructuring induced by colloidal nanoparticles. Science 2015, 347, 292–294. [Google Scholar] [CrossRef] [PubMed] [Green Version]
- Zhu, J.; Liu, B.; Li, L.; Zeng, Z.; Zhao, W.; Wang, G.; Guan, X. Simple and Green Fabrication of a Superhydrophobic Surface by One-Step Immersion for Continuous Oil/Water Separation. J. Phys. Chem. A 2016, 120, 5617–5623. [Google Scholar] [CrossRef] [PubMed]
- Chen, Z.; Li, F.; Hao, L.; Chen, A.; Kong, Y. One-step electrodeposition process to fabricate cathodic superhydrophobic surface. Appl. Surf. Sci. 2011, 258, 1395–1398. [Google Scholar] [CrossRef]
- Wang, Y.; Wang, W.; Zhong, L.; Wang, J.; Jiang, Q.; Guo, X. Super-hydrophobic surface on pure magnesium substrate by wet chemicalmethod. Appl. Surf. Sci. 2010, 256, 3837–3840. [Google Scholar] [CrossRef]
- Pudney, P.D.A.; Mutch, K.J.; Zhu, S. Characterising the phase behaviour of stearic acid and its triethanolamine soap and acid–soap by infrared spectroscopy. Phys. Chem. Chem. Phys. 2009, 11, 5010–5018. [Google Scholar] [CrossRef]
- Lynch, M.L.; Pan, Y.; Laughlin, R.G. Spectroscopic and Thermal Characterization of 1:2 Sodium Soap/Fatty Acid Acid-Soap Crystals. J. Phys. Chem. 1996, 100, 357–361. [Google Scholar] [CrossRef]
- Joshy, K.S.; George, A.; Snigdha, S.; Joseph, B.; Kalarikkal, N.; Pothen, L.A.; Thomas, S. Novel core-shell dextran hybrid nanosystem for anti-viral drug delivery. Mater. Sci. Eng. C 2018, 93, 864–872. [Google Scholar] [CrossRef] [PubMed]
- Sengar, M.; Narula, A.K. Lanthanide doped luminescent NaGdF4:Nd3+,Yb3+@CaF2:Eu3+ nanoparticles for dual-mode (visible and NIR) luminescence. J. Solid State Chem. 2021, 295, 121913. [Google Scholar] [CrossRef]
- Cheng, C.; Xu, Y.; Liu, S.; Liu, Y.; Wang, X.; Wang, J.; De, G. One-pot synthesis of ultrasmall β-NaGdF4 nanoparticles with enhanced upconversion luminescence. J. Mater. Chem. C 2019, 7, 8898–8904. [Google Scholar] [CrossRef]
- Chen, B.; Ren, B.; Wang, F. Cs+-Assisted Synthesis of NaLaF4 Nanoparticles. Chem. Mater. 2019, 31, 9497–9503. [Google Scholar] [CrossRef]
- Huang, Q.; Ye, W.; Jiao, X.; Yu, L.; Liu, Y.; Liu, X. Efficient upconversion fluorescence in NaYF4:Yb3+,Er3+/mNaYF4 multilayer core-shell nanoparticles. J. Alloys Compd. 2018, 763, 216–222. [Google Scholar] [CrossRef]
- Xia, Z.; Du, P.; Liao, L. Facile hydrothermal synthesis and upconversion luminescence of tetragonal Sr2LnF7:Yb3+/Er3+ (Ln = Y, Gd) nanocrystals. Phys. Status Solidi A 2013, 210, 1734–1737. [Google Scholar] [CrossRef]

| No. | Sample Name | The Volume Ratio of Organic Solutions | Conditions of Synthesis |
|---|---|---|---|
| 1. | C1 | OA:SA:ODE = 1:1:2 | β-core—35 min at 300 °C |
| 2. | C2 | OA:SA:ODE = 1:1:2 | β-core—45 min at 300 °C |
| 3. | C3 | OA:SA:ODE = 1:1:2 | β-core—55 min at 300 °C |
| 4. | WSAC | OA:ODE = 1:1 | β-core—55 min at 300 °C |
| 5. | CS1 | OA:SA:ODE = 1:1:2 | β-core—35 min at 300 °C α-shell—35 min at 200 °C β-core@β-shell—35 min at 300 °C |
| 6. | CS2 | OA:SA:ODE = 1:1:2 | β-core—45 min at 300 °C α-shell—45 min at 200 °C β-core@β-shell—45 min at 300 °C |
| 7. | CS3 | OA:SA:ODE = 1:1:2 | β-core—55 min at 300 °C α-shell—55 min at 200 °C β-core@β-shell—55 min at 300 °C |
| 8. | WSACS | OA:ODE = 1:1 | β-core—55 min at 300 °C α-shell—55 min at 200 °C β-core@β-shell—55 min at 300 °C |
| Sample Name | Er at. % | Yb at. % | Y at. % |
|---|---|---|---|
| CS1 | 1.13 ± 0.10 | 8.81 ± 0.29 | 90.06 ± 3.93 |
| CS2 | 1.32 ± 0.60 | 8.48 ± 0.58 | 90.20 ± 3.39 |
| CS3 | 1.01 ± 0.31 | 7.30 ± 0.43 | 91.69 ± 2.96 |
| WSACS | 1.02 ± 0.05 | 9.20 ± 0.46 | 89.78 ± 5.27 |
| Material | RE Source | Organic Mixture (Volume Ratio) | Time of Synthesis, min | The Temperature of Synthesis, °C | The Size of core@shell Nanoparticles, nm a | Morphology | Ref. |
|---|---|---|---|---|---|---|---|
| NaGdF4:Nd3+, Yb3+ @CaF2:Eu3+ | acetates | OA/ODE (2:3) | 30 (α-shell) 90 (core@shell) 120—total time | 150 (α-shell) 300 (core@shell) | 150–159 | hexagonal particles | [34] |
| β-NaYF4: 18%Yb3+, 2%Er3+ @β-NaYF4 | oleates | OA/ODE (1:6) OA/ODE (2:5) OA/ODE (1:1) OA/ODE (3:2) OA/ODE (3:1) | 60 (β-core) 60 (core@shell) 120—total time | 300 (β-core) 290 (core@shell) | 48.9 ± 2.2 (l), 26.9 ± 2.2 (w) 28.6 ± 1.9 (l), 23.7 ± 1.9 (w) 33.3 ± 1.9 (l), 30.1 ± 1.4 (w) 27.6 ± 1.7 (l), 25.3 ± 1.4 (w) 36.2 ± 1.7 (l), 32.4 ± 2.2 (w) | nanorods | [19] |
| β-NaGdF4: Yb/Er @β-NaYF4 | TFA | OA/ODE/OM (1:2:1) (β-core) OA/ODE (1:1) (β-core and core@shell) | 15 (β-shell) 30 (β-core) 60 (core@shell) 105—total time | 310 (β-shell) 310 (β-core) 290 (core@shell) | 16.5 | hexagonal particles | [35] |
| NaLaF4:Nd3+ @NaLaF4 | acetates | OA/ODE (3:7) | 30 (α-shell) 60 (β-core) 60 (core@shell) 210—total time | 170 (α-shell) 310 (β-core) 310 (core@shell) | 20 ± 3 (l), 80 ± 12 (w) | nanorods | [36] |
| CS1 | chlorides | OA/ODE/SA (1:2:1) | 35 (α-shell/β-core) 35 (core@shell) 70—total time | 200 (α-shell) 300 (β-core) 300 (core@shell) | 26.6 ± 7.8 | nanorods | this work |
| CS2 | chlorides | OA/ODE/SA (1:2:1) | 45 (α-shell/β-core) 45 (core@shell) 90—total time | 200 (α-shell) 300 (β-core) 300 (core@shell) | 70.1 ± 25.5 | nanorods | this work |
| CS3 | chlorides | OA/ODE/SA (1:2:1) | 55 (α-shell/β-core) 55 (core@shell) 110—total time | 200 (α-shell) 300 (β-core) 300 (core@shell) | 39.4 ± 9.8 | hexagonal particles | this work |
Publisher’s Note: MDPI stays neutral with regard to jurisdictional claims in published maps and institutional affiliations. |
© 2022 by the authors. Licensee MDPI, Basel, Switzerland. This article is an open access article distributed under the terms and conditions of the Creative Commons Attribution (CC BY) license (https://creativecommons.org/licenses/by/4.0/).
Share and Cite
Kaminski, P.; Przybylska, D.; Klima, G.; Grzyb, T. Improvement in Luminescence Intensity of β-NaYF4: 18%Yb3+, 2%Er3+@β-NaYF4 Nanoparticles as a Result of Synthesis in the Presence of Stearic Acid. Nanomaterials 2022, 12, 319. https://doi.org/10.3390/nano12030319
Kaminski P, Przybylska D, Klima G, Grzyb T. Improvement in Luminescence Intensity of β-NaYF4: 18%Yb3+, 2%Er3+@β-NaYF4 Nanoparticles as a Result of Synthesis in the Presence of Stearic Acid. Nanomaterials. 2022; 12(3):319. https://doi.org/10.3390/nano12030319
Chicago/Turabian StyleKaminski, Piotr, Dominika Przybylska, Gabriela Klima, and Tomasz Grzyb. 2022. "Improvement in Luminescence Intensity of β-NaYF4: 18%Yb3+, 2%Er3+@β-NaYF4 Nanoparticles as a Result of Synthesis in the Presence of Stearic Acid" Nanomaterials 12, no. 3: 319. https://doi.org/10.3390/nano12030319
APA StyleKaminski, P., Przybylska, D., Klima, G., & Grzyb, T. (2022). Improvement in Luminescence Intensity of β-NaYF4: 18%Yb3+, 2%Er3+@β-NaYF4 Nanoparticles as a Result of Synthesis in the Presence of Stearic Acid. Nanomaterials, 12(3), 319. https://doi.org/10.3390/nano12030319