
Aqueous Manufacturing of Defect-Free Thick Multi-Layer NMC811 Electrodes

 , ,
, ,  and
and
Abstract
:1. Introduction
2. Materials and Methods
2.1. Electrode Preparation
2.2. Cell Assembly and Electrochemical Analysis
2.3. Slurry and Electrode Properties
3. Results and Discussion
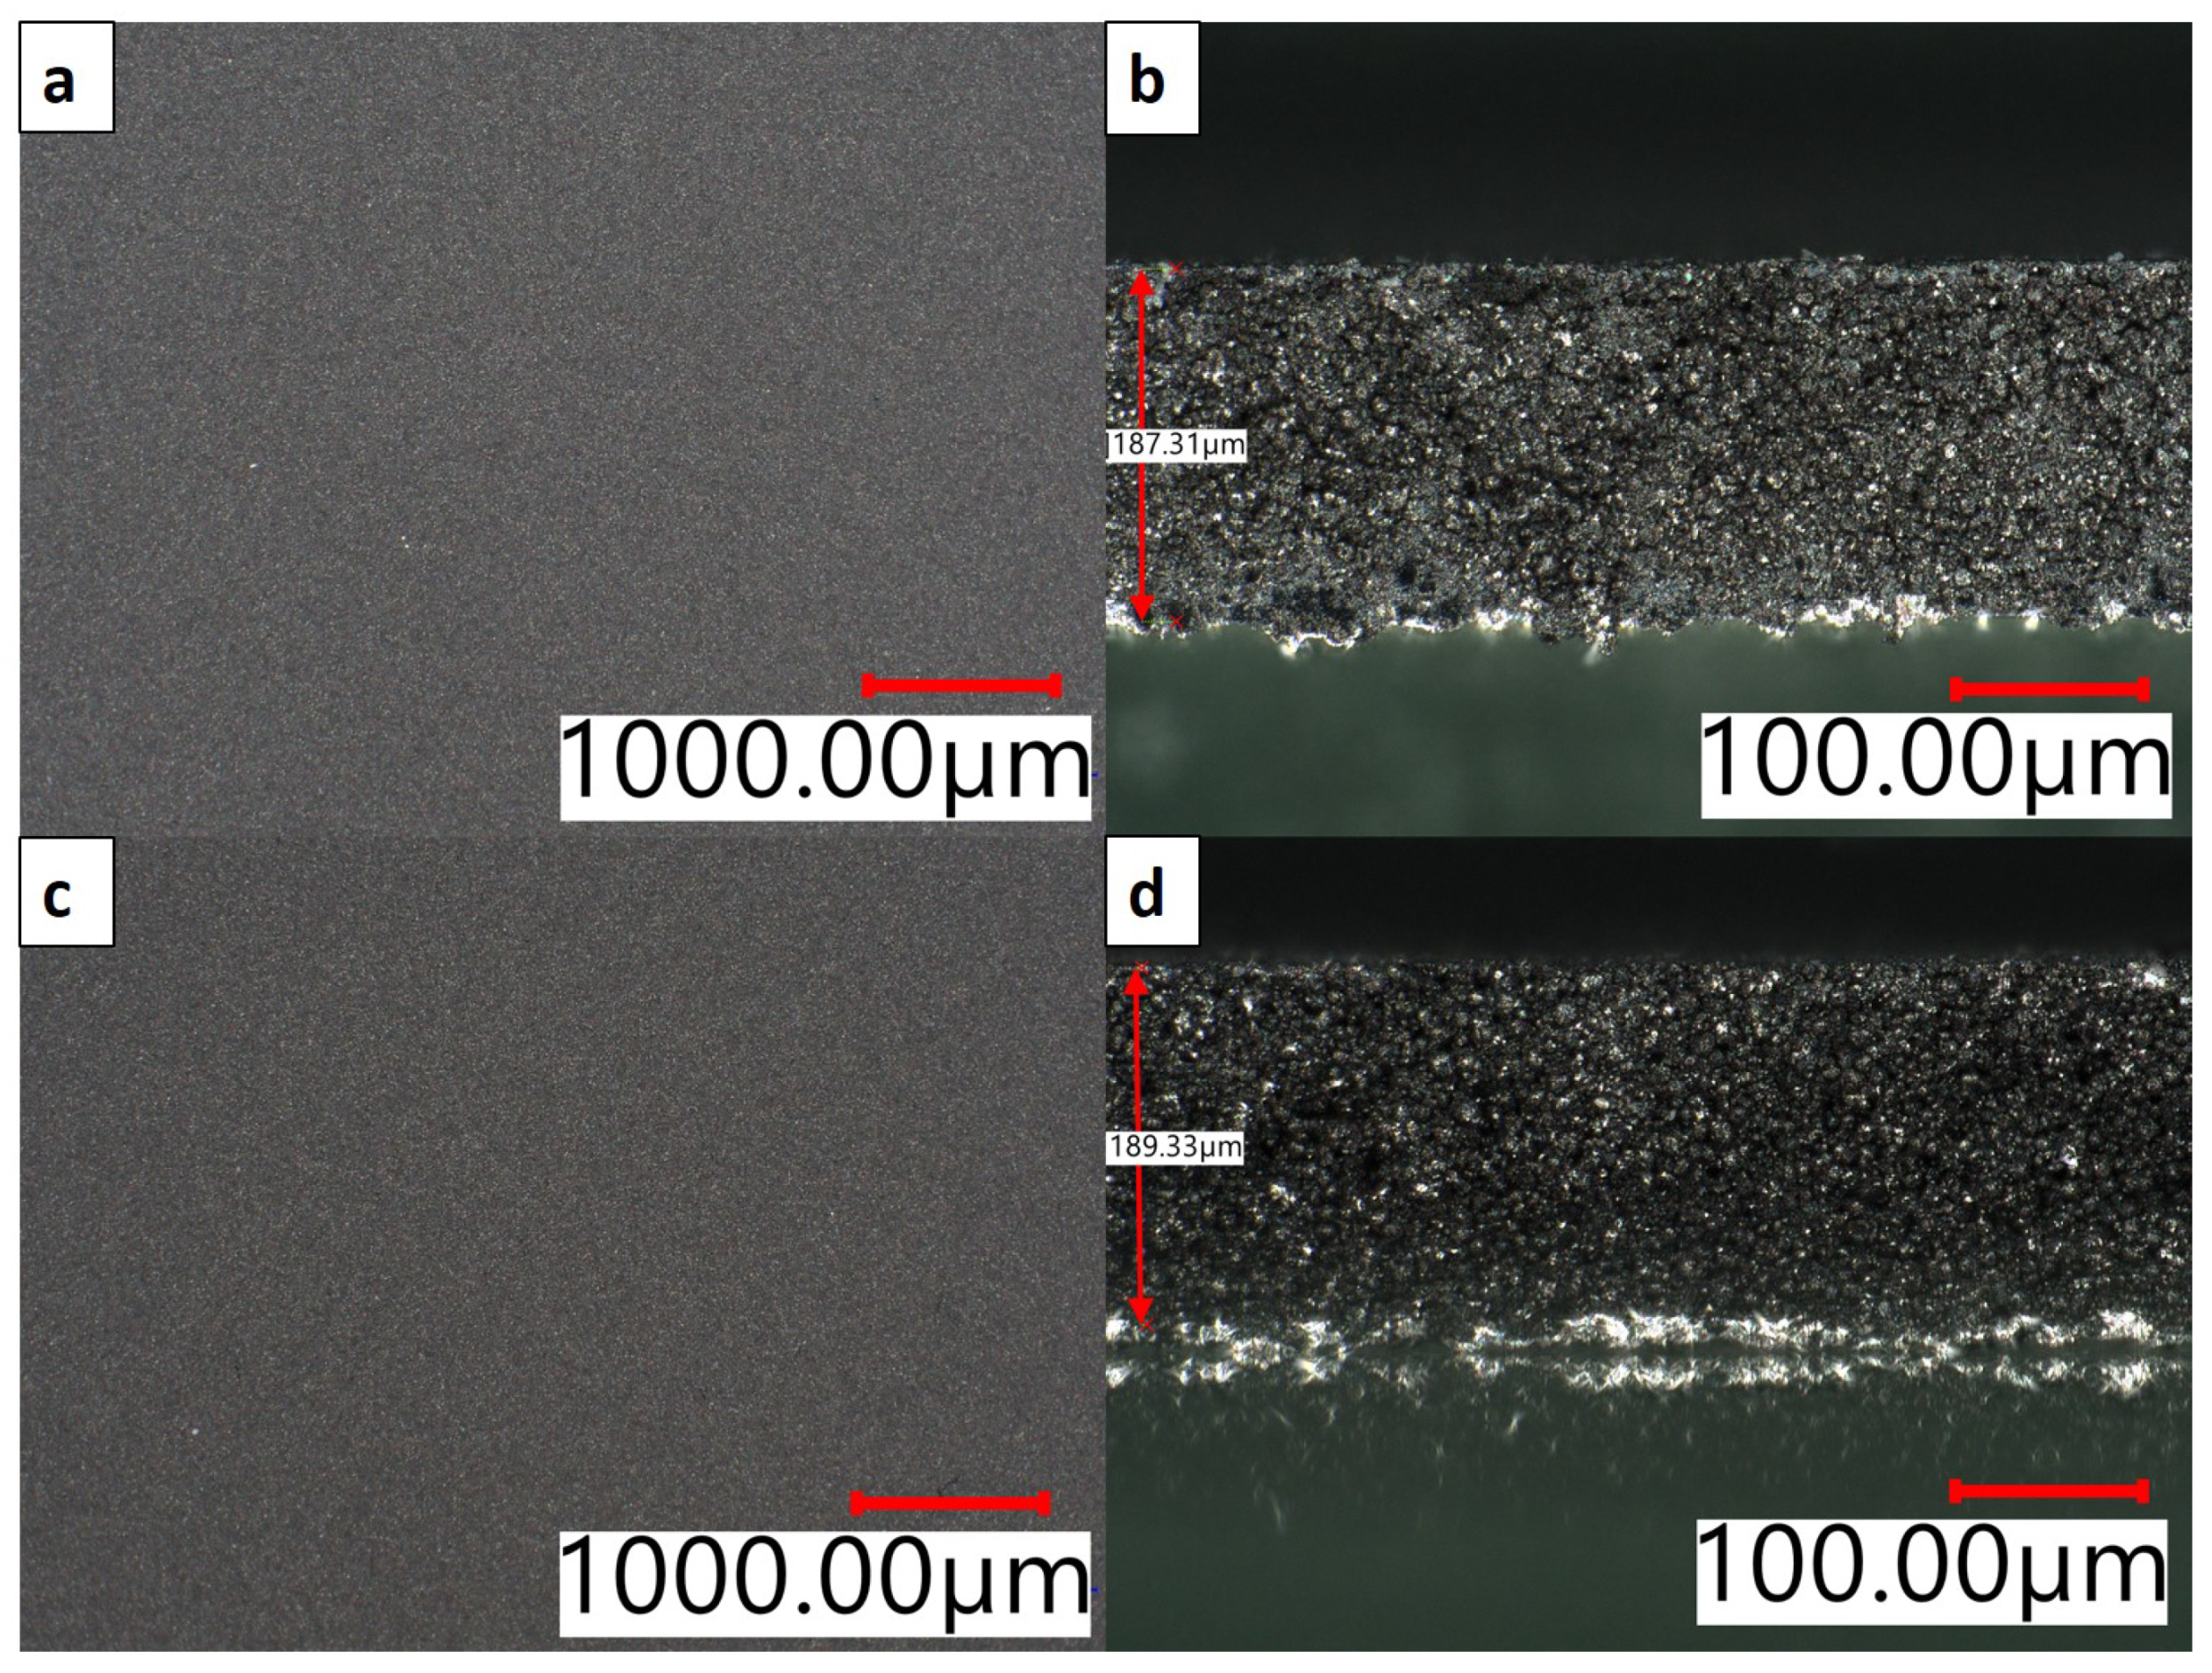
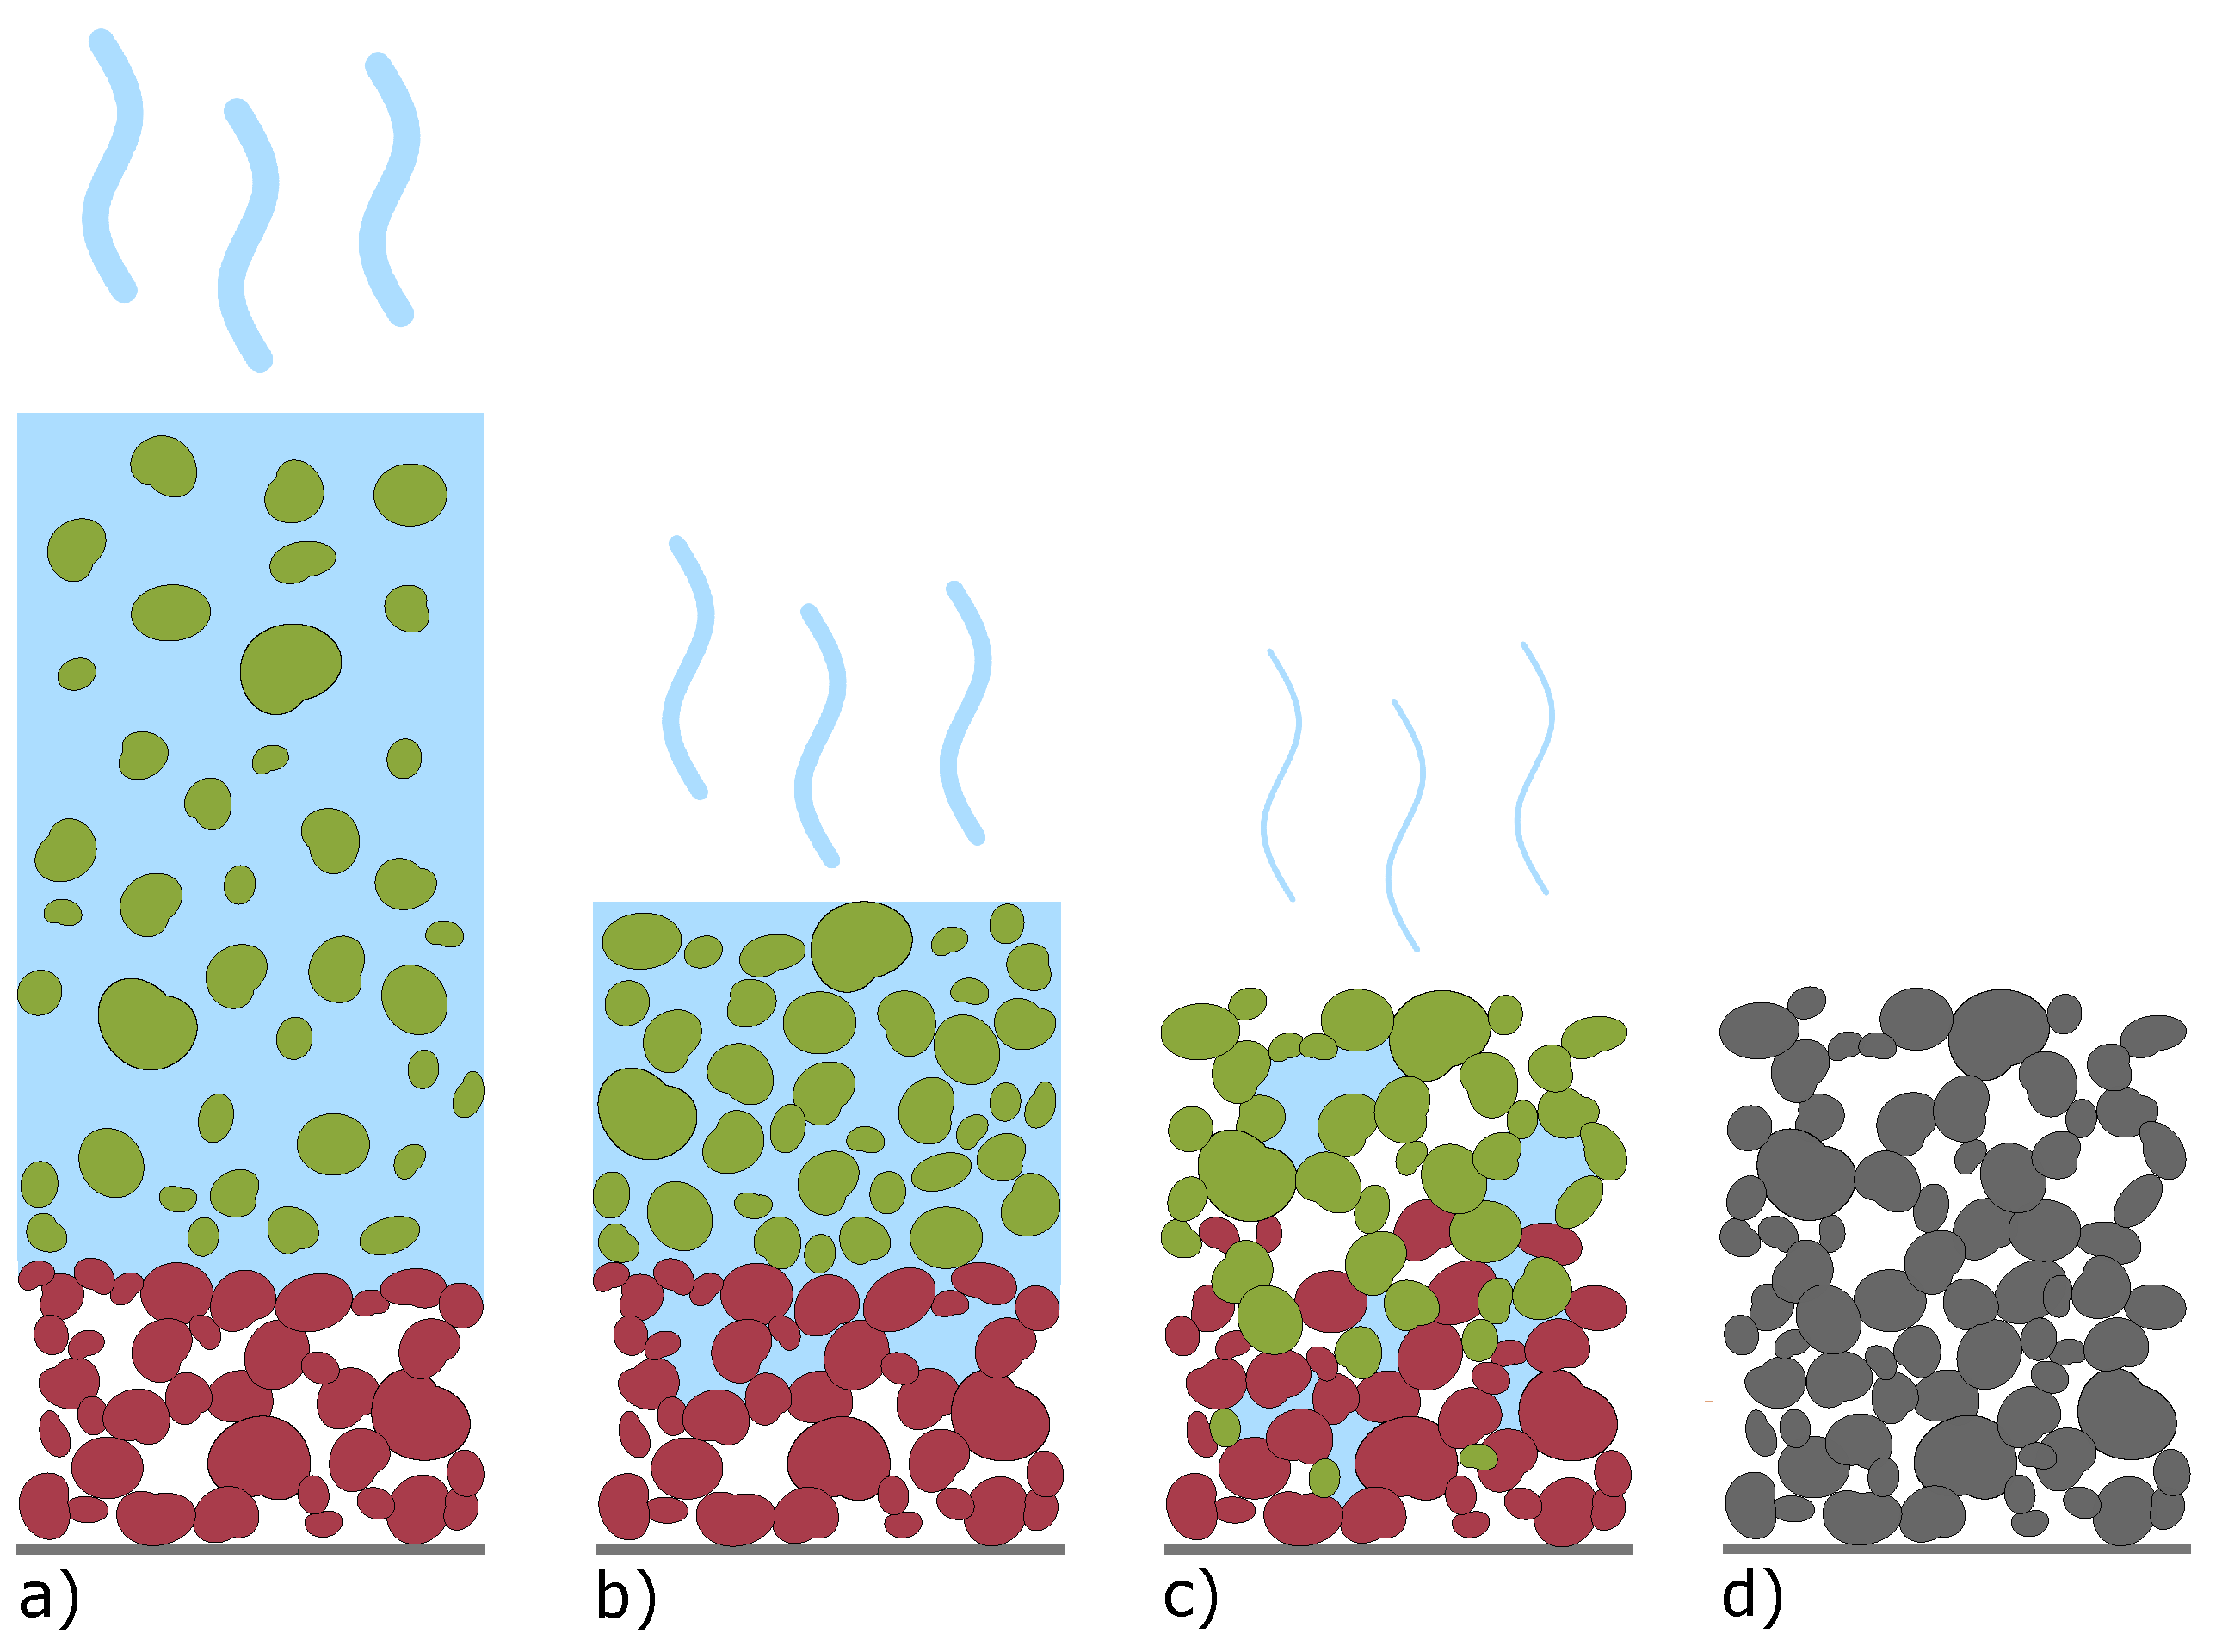
3.1. Characterization of Slurries and Electrodes
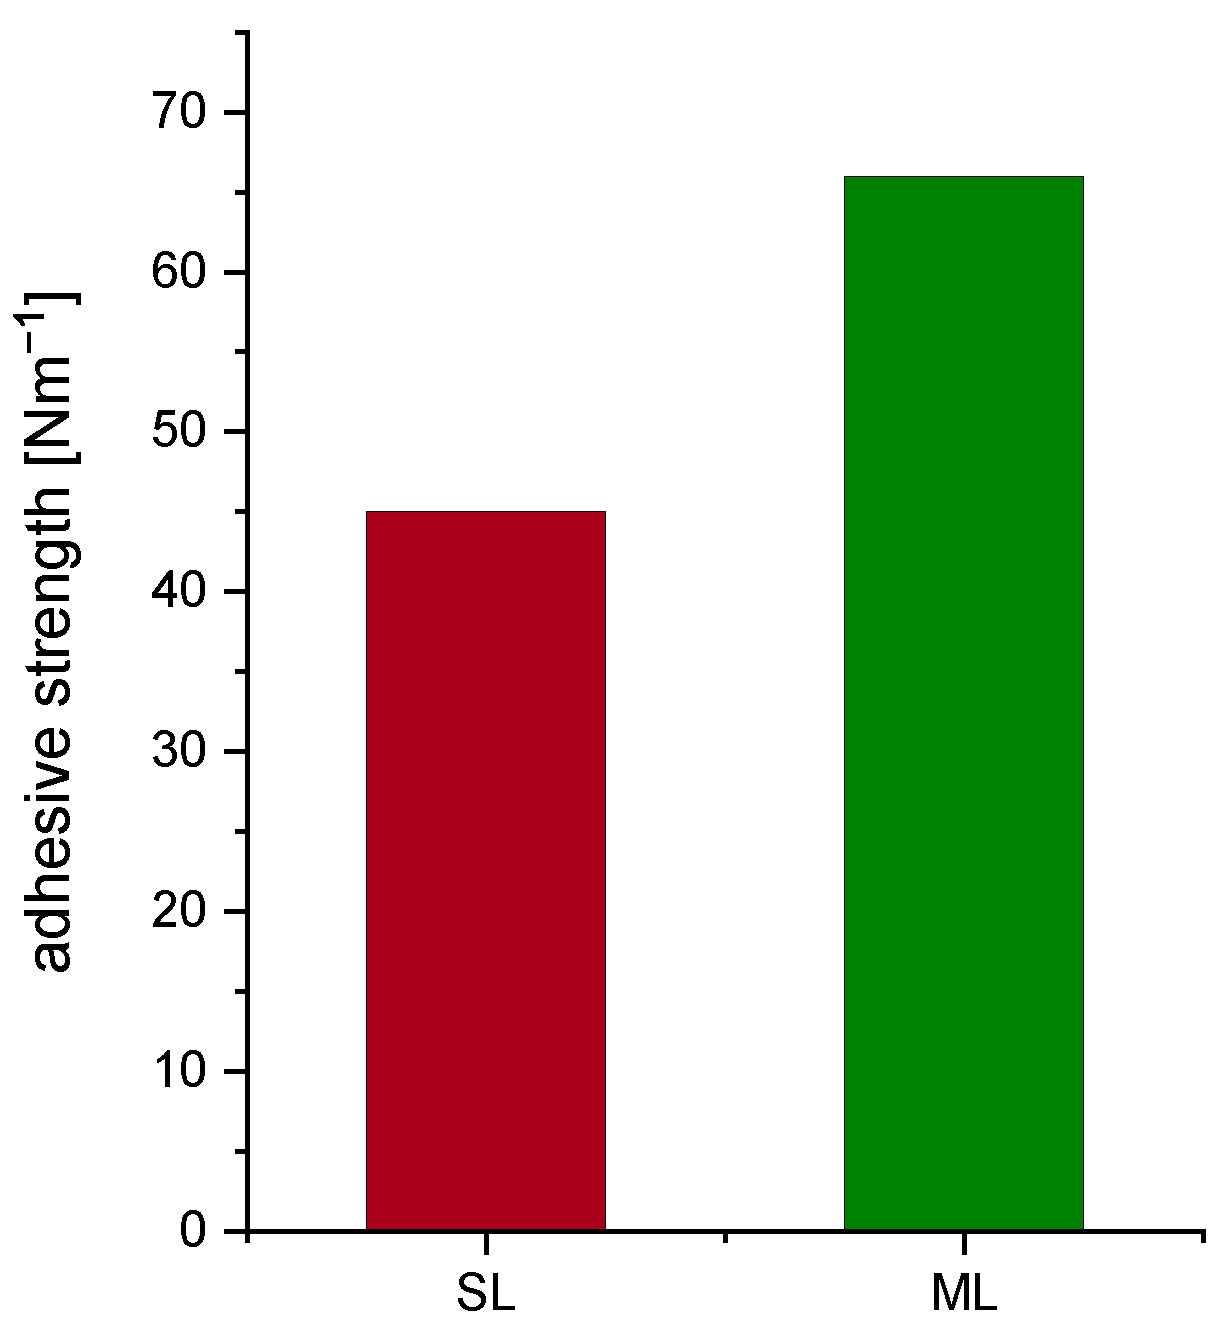
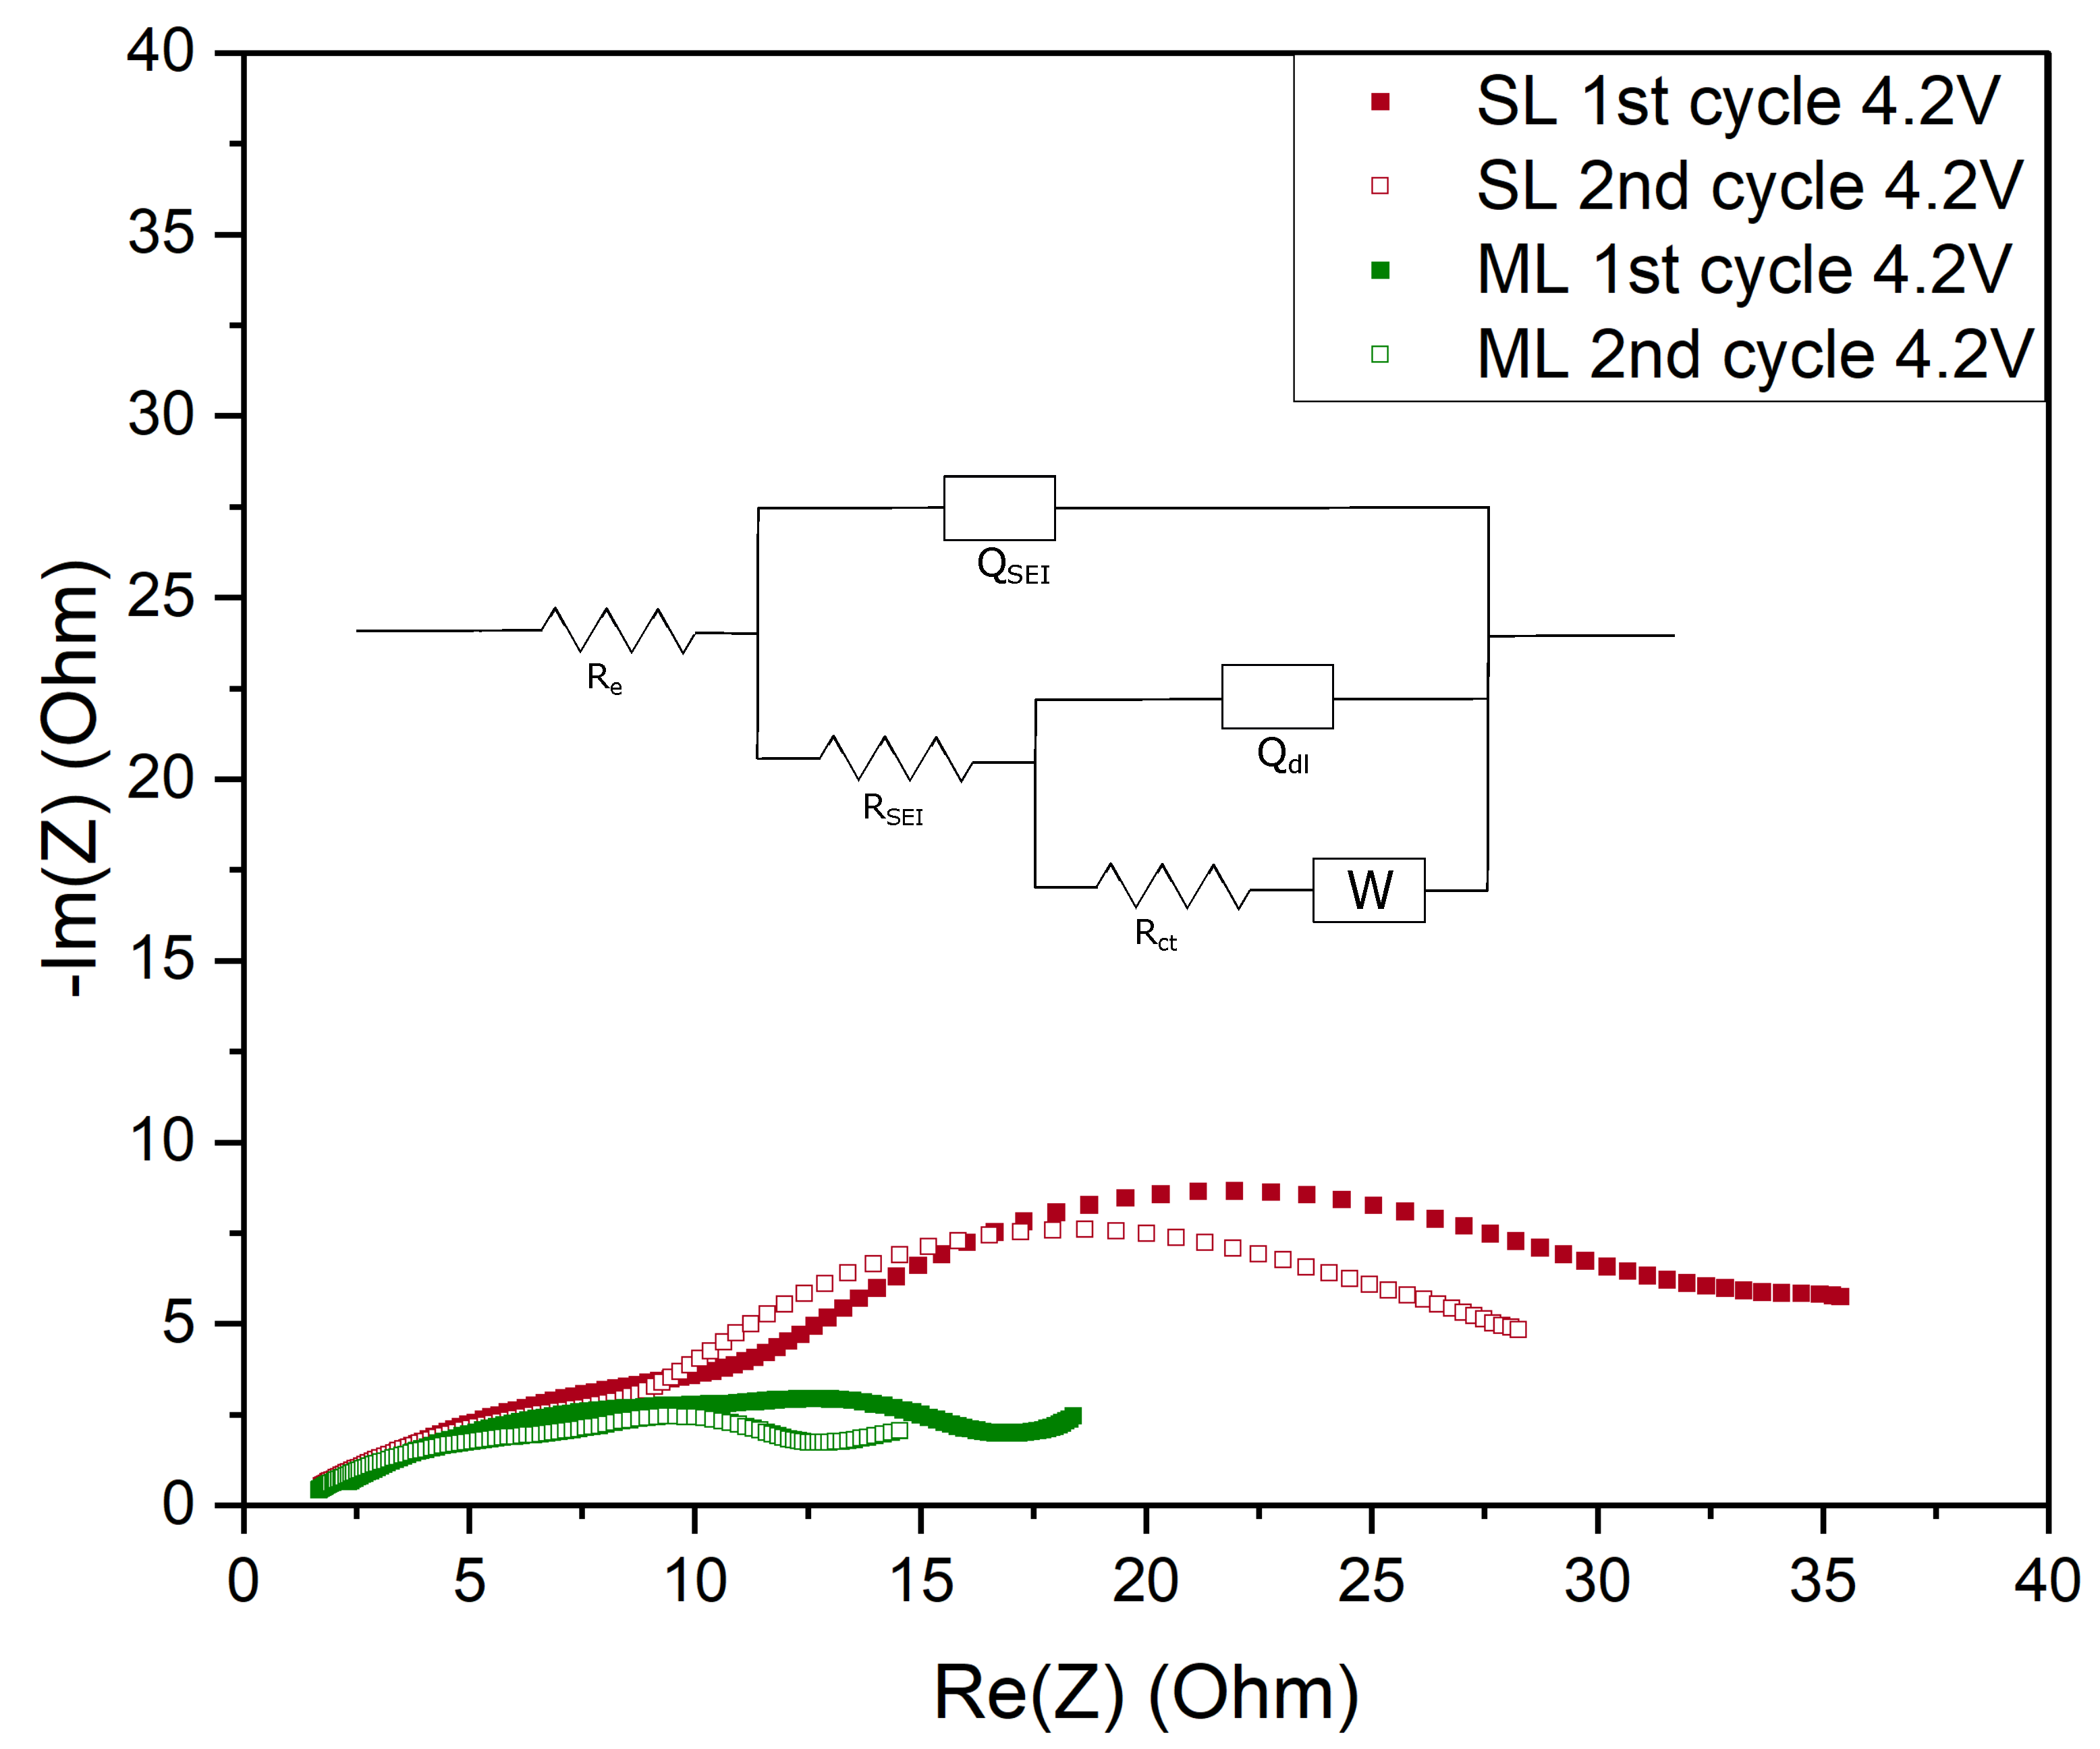
3.2. Electrochemical Performance of Cells
4. Conclusions
Author Contributions
Funding
Institutional Review Board Statement
Informed Consent Statement
Data Availability Statement
Acknowledgments
Conflicts of Interest
Abbreviations
| CB | carbon black |
| CCCV | constant current constant voltage |
| CMC | carboxymethyl cellulose |
| CV | cyclic voltammetry |
| EIS | electrochemical impedance spectroscopy |
| ML | multi-layer |
| NMC | lithium nickel manganese cobalt oxide |
| NMP | N-Methyl-2-pyrrolidone |
| N/P ratio | negative/positive capacity ratio |
| PMA | poly(methyl)acylate |
| PVDF | polyvinylidene fluoride |
| R2R | roll-to-roll |
| SEI | solid electrolyte interphase |
| SEM | scanning electron microscopy |
| SL | single-layer |
| SOC | state of charge |
References
- Wood, D.L., III; Li, J.; Daniel, C. Prospects for reducing the processing cost of lithium ion batteries. J. Power Sources 2015, 275, 234–242. [Google Scholar] [CrossRef] [Green Version]
- Bryntesen, S.N.; Strømman, A.H.; Tolstorebrov, I.; Shearing, P.R.; Lamb, J.J.; Stokke Burheim, O. Opportunities for the State-of-the-Art Production of LIB Electrodes—A Review. Energies 2021, 14, 1406. [Google Scholar] [CrossRef]
- Li, J.; Du, Z.; Ruther, R.E.; An, S.J.; David, L.A.; Hays, K.; Wood, M.; Phillip, N.D.; Sheng, Y.; Mao, C.; et al. Toward low-cost, high-energy density, and high-power density lithium-ion batteries. JOM 2017, 69, 1484–1496. [Google Scholar] [CrossRef] [Green Version]
- Susarla, N.; Ahmed, S.; Dees, D.W. Modeling and analysis of solvent removal during Li-ion battery electrode drying. J. Power Sources 2018, 378, 660–670. [Google Scholar] [CrossRef]
- Chatalov, A.Y. Effet du pH sur le comportement électrochimique des métaux et leur résistance à la corrosion. Dokl. Akad. Naouk SSSR 1952, 86, 775. [Google Scholar]
- Kazzazi, A.; Bresser, D.; Birrozzi, A.; von Zamory, J.; Hekmatfar, M.; Passerini, S. Comparative analysis of aqueous binders for high-energy li-rich NMC as a Lithium-Ion cathode and the impact of adding phosphoric acid. ACS Appl. Mater. Interfaces 2018, 10, 17214–17222. [Google Scholar] [CrossRef] [PubMed]
- Kukay, A.; Sahore, R.; Parejiya, A.; Hawley, W.B.; Li, J.; Wood, D.L., III. Aqueous Ni-rich-cathode dispersions processed with phosphoric acid for lithium-ion batteries with ultra-thick electrodes. J. Colloid Interface Sci. 2021, 581, 635–643. [Google Scholar] [CrossRef] [PubMed]
- Carvalho, D.V.; Loeffler, N.; Kim, G.T.; Marinaro, M.; Wohlfahrt-Mehrens, M.; Passerini, S. Study of water-based lithium titanate electrode processing: The role of pH and binder molecular structure. Polymers 2016, 8, 276. [Google Scholar] [CrossRef] [Green Version]
- Hamam, I.; Zhang, N.; Liu, A.; Johnson, M.; Dahn, J. Study of the reactions between Ni-rich positive electrode materials and aqueous solutions and their relation to the failure of Li-ion cells. J. Electrochem. Soc. 2020, 167, 130521. [Google Scholar] [CrossRef]
- Li, C.C.; Lee, J.T.; Tung, Y.L.; Yang, C.R. Effects of pH on the dispersion and cell performance of LiCoO2 cathodes based on the aqueous process. J. Mater. Sci. 2007, 42, 5773–5777. [Google Scholar] [CrossRef]
- Bauer, W.; Çetinel, F.A.; Müller, M.; Kaufmann, U. Effects of pH control by acid addition at the aqueous processing of cathodes for lithium ion batteries. Electrochim. Acta 2019, 317, 112–119. [Google Scholar] [CrossRef]
- Zhu, P.; Han, J.; Pfleging, W. Characterization and Laser Structuring of Aqueous Processed Li (Ni0.6Mn0.2Co0.2) O2 Thick-Film Cathodes for Lithium-Ion Batteries. Nanomaterials 2021, 11, 1840. [Google Scholar] [CrossRef] [PubMed]
- Loeffler, N.; Kim, G.T.; Mueller, F.; Diemant, T.; Kim, J.K.; Behm, R.J.; Passerini, S. In situ coating of Li [Ni0.33Mn0.33Co0.33] O2 particles to enable aqueous electrode processing. ChemSusChem 2016, 9, 1112–1117. [Google Scholar] [CrossRef]
- Kuenzel, M.; Bresser, D.; Diemant, T.; Carvalho, D.V.; Kim, G.T.; Behm, R.J.; Passerini, S. Complementary strategies toward the aqueous processing of high-voltage LiNi0.5Mn1.5O4 lithium-ion cathodes. ChemSusChem 2018, 11, 562–573. [Google Scholar] [CrossRef]
- Ligneel, E.; Lestriez, B.; Hudhomme, A.; Guyomard, D. Effects of the solvent concentration (solid loading) on the processing and properties of the composite electrode. J. Electrochem. Soc. 2007, 154, A235. [Google Scholar] [CrossRef]
- Lee, J.H.; Paik, U.; Hackley, V.A.; Choi, Y.M. Effect of carboxymethyl cellulose on aqueous processing of natural graphite negative electrodes and their electrochemical performance for lithium batteries. J. Electrochem. Soc. 2005, 152, A1763. [Google Scholar] [CrossRef]
- Kuang, Y.; Chen, C.; Kirsch, D.; Hu, L. Thick electrode batteries: Principles, opportunities, and challenges. Adv. Energy Mater. 2019, 9, 1901457. [Google Scholar] [CrossRef]
- Du, Z.; Rollag, K.; Li, J.; An, S.J.; Wood, M.; Sheng, Y.; Mukherjee, P.; Daniel, C.; Wood, D., III. Enabling aqueous processing for crack-free thick electrodes. J. Power Sources 2017, 354, 200–206. [Google Scholar] [CrossRef] [Green Version]
- Singh, M.; Kaiser, J.; Hahn, H. Thick Electrodes for High Energy Lithium Ion Batteries. J. Electrochem. Soc. 2015, 162, A1196–A1201. [Google Scholar] [CrossRef]
- Golmon, S.; Maute, K.; Dunn, M.L. A design optimization methodology for Li+ batteries. J. Power Sources 2014, 253, 239–250. [Google Scholar] [CrossRef]
- Lu, W.; Jansen, A.; Dees, D.; Nelson, P.; Veselka, N.R.; Henriksen, G. High-energy electrode investigation for plug-in hybrid electric vehicles. J. Power Sources 2011, 196, 1537–1540. [Google Scholar] [CrossRef]
- Sahore, R.; Wood, D.L., III; Kukay, A.; Grady, K.M.; Li, J.; Belharouak, I. Towards understanding of cracking during drying of thick aqueous-processed LiNi0.8Mn0.1Co0.1O2 cathodes. ACS Sustain. Chem. Eng. 2020, 8, 3162–3169. [Google Scholar] [CrossRef]
- Font, F.; Protas, B.; Richardson, G.; Foster, J.M. Binder migration during drying of lithium-ion battery electrodes: Modelling and comparison to experiment. J. Power Sources 2018, 393, 177–185. [Google Scholar] [CrossRef] [Green Version]
- Müller, M.; Pfaffmann, L.; Jaiser, S.; Baunach, M.; Trouillet, V.; Scheiba, F.; Scharfer, P.; Schabel, W.; Bauer, W. Investigation of binder distribution in graphite anodes for lithium-ion batteries. J. Power Sources 2017, 340, 1–5. [Google Scholar] [CrossRef]
- Kremer, L.S.; Hoffmann, A.; Danner, T.; Hein, S.; Prifling, B.; Westhoff, D.; Dreer, C.; Latz, A.; Schmidt, V.; Wohlfahrt-Mehrens, M. Manufacturing Process for Improved Ultra-Thick Cathodes in High-Energy Lithium-Ion Batteries. Energy Technol. 2020, 8, 1900167. [Google Scholar] [CrossRef]
- Jaiser, S.; Müller, M.; Baunach, M.; Bauer, W.; Scharfer, P.; Schabel, W. Investigation of film solidification and binder migration during drying of Li-Ion battery anodes. J. Power Sources 2016, 318, 210–219. [Google Scholar] [CrossRef]
- Westphal, B.G.; Kwade, A. Critical electrode properties and drying conditions causing component segregation in graphitic anodes for lithium-ion batteries. J. Energy Storage 2018, 18, 509–517. [Google Scholar] [CrossRef]
- Baunach, M.; Jaiser, S.; Schmelzle, S.; Nirschl, H.; Scharfer, P.; Schabel, W. Delamination behavior of lithium-ion battery anodes: Influence of drying temperature during electrode processing. Dry. Technol. 2016, 34, 462–473. [Google Scholar] [CrossRef]
- Liu, L.; Guan, P.; Liu, C. Experimental and simulation investigations of porosity graded cathodes in mitigating battery degradation of high voltage lithium-ion batteries. J. Electrochem. Soc. 2017, 164, A3163. [Google Scholar] [CrossRef]
- Qi, Y.; Jang, T.; Ramadesigan, V.; Schwartz, D.T.; Subramanian, V.R. Is there a benefit in employing graded electrodes for lithium-ion batteries? J. Electrochem. Soc. 2017, 164, A3196. [Google Scholar] [CrossRef] [Green Version]
- Fang, R.; Ge, H.; Wang, Z.; Li, Z.; Zhang, J. A two-dimensional heterogeneous model of lithium-ion battery and application on designing electrode with non-uniform porosity. J. Electrochem. Soc. 2020, 167, 130513. [Google Scholar] [CrossRef]
- Müller, D.; Landa-Medrano, I.; Eguia-Barrio, A.; Boyano, I.; Urdampilleta, I.; de Meatza, I.; Fill, A.; Birke, P. Electrochemical characterization of bi-layered graphite anodes combining high and low porosity in lithium-ion cells to improve cell performance. Electrochim. Acta 2021, 391, 138966. [Google Scholar] [CrossRef]
- Dai, Y.; Srinivasan, V. On graded electrode porosity as a design tool for improving the energy density of batteries. J. Electrochem. Soc. 2015, 163, A406. [Google Scholar] [CrossRef]
- Kespe, M.; Cernak, S.; Gleiß, M.; Hammerich, S.; Nirschl, H. Three-dimensional simulation of transport processes within blended electrodes on the particle scale. Int. J. Energy Res. 2019, 43, 6762–6778. [Google Scholar] [CrossRef]
- Imachi, N.; Takano, Y.; Fujimoto, H.; Kida, Y.; Fujitani, S. Layered cathode for improving safety of Li-ion batteries. J. Electrochem. Soc. 2007, 154, A412. [Google Scholar] [CrossRef]
- Whitacre, J.; Zaghib, K.; West, W.; Ratnakumar, B. Dual active material composite cathode structures for Li-ion batteries. J. Power Sources 2008, 177, 528–536. [Google Scholar] [CrossRef]
- Liu, D.; Chen, L.C.; Liu, T.J.; Chu, W.B.; Tiu, C. Improvement of lithium-ion battery performance by two-layered slot–die coating operation. Energy Technol. 2017, 5, 1235–1241. [Google Scholar] [CrossRef]
- Diehm, R.; Kumberg, J.; Dörrer, C.; Müller, M.; Bauer, W.; Scharfer, P.; Schabel, W. In Situ Investigations of Simultaneous Two-Layer Slot Die Coating of Component-Graded Anodes for Improved High-Energy Li-Ion Batteries. Energy Technol. 2020, 8, 1901251. [Google Scholar] [CrossRef]
- Zheng, H.; Li, J.; Song, X.; Liu, G.; Battaglia, V.S. A comprehensive understanding of electrode thickness effects on the electrochemical performances of Li-ion battery cathodes. Electrochim. Acta 2012, 71, 258–265. [Google Scholar] [CrossRef]
- Gao, H.; Wu, Q.; Hu, Y.; Zheng, J.P.; Amine, K.; Chen, Z. Revealing the rate-limiting Li-ion diffusion pathway in ultrathick electrodes for Li-ion batteries. J. Phys. Chem. Lett. 2018, 9, 5100–5104. [Google Scholar] [CrossRef]
- Fröhlich, K.; Abrahams, I.; Jahn, M. Determining phase transitions of layered oxides via electrochemical and crystallographic analysis. Sci. Technol. Adv. Mater. 2020, 21, 653–660. [Google Scholar] [CrossRef] [PubMed]
- Heubner, C.; Nickol, A.; Seeba, J.; Reuber, S.; Junker, N.; Wolter, M.; Schneider, M.; Michaelis, A. Understanding thickness and porosity effects on the electrochemical performance of LiNi0.6Co0.2Mn0.2O2-based cathodes for high energy Li-ion batteries. J. Power Sources 2019, 419, 119–126. [Google Scholar] [CrossRef]


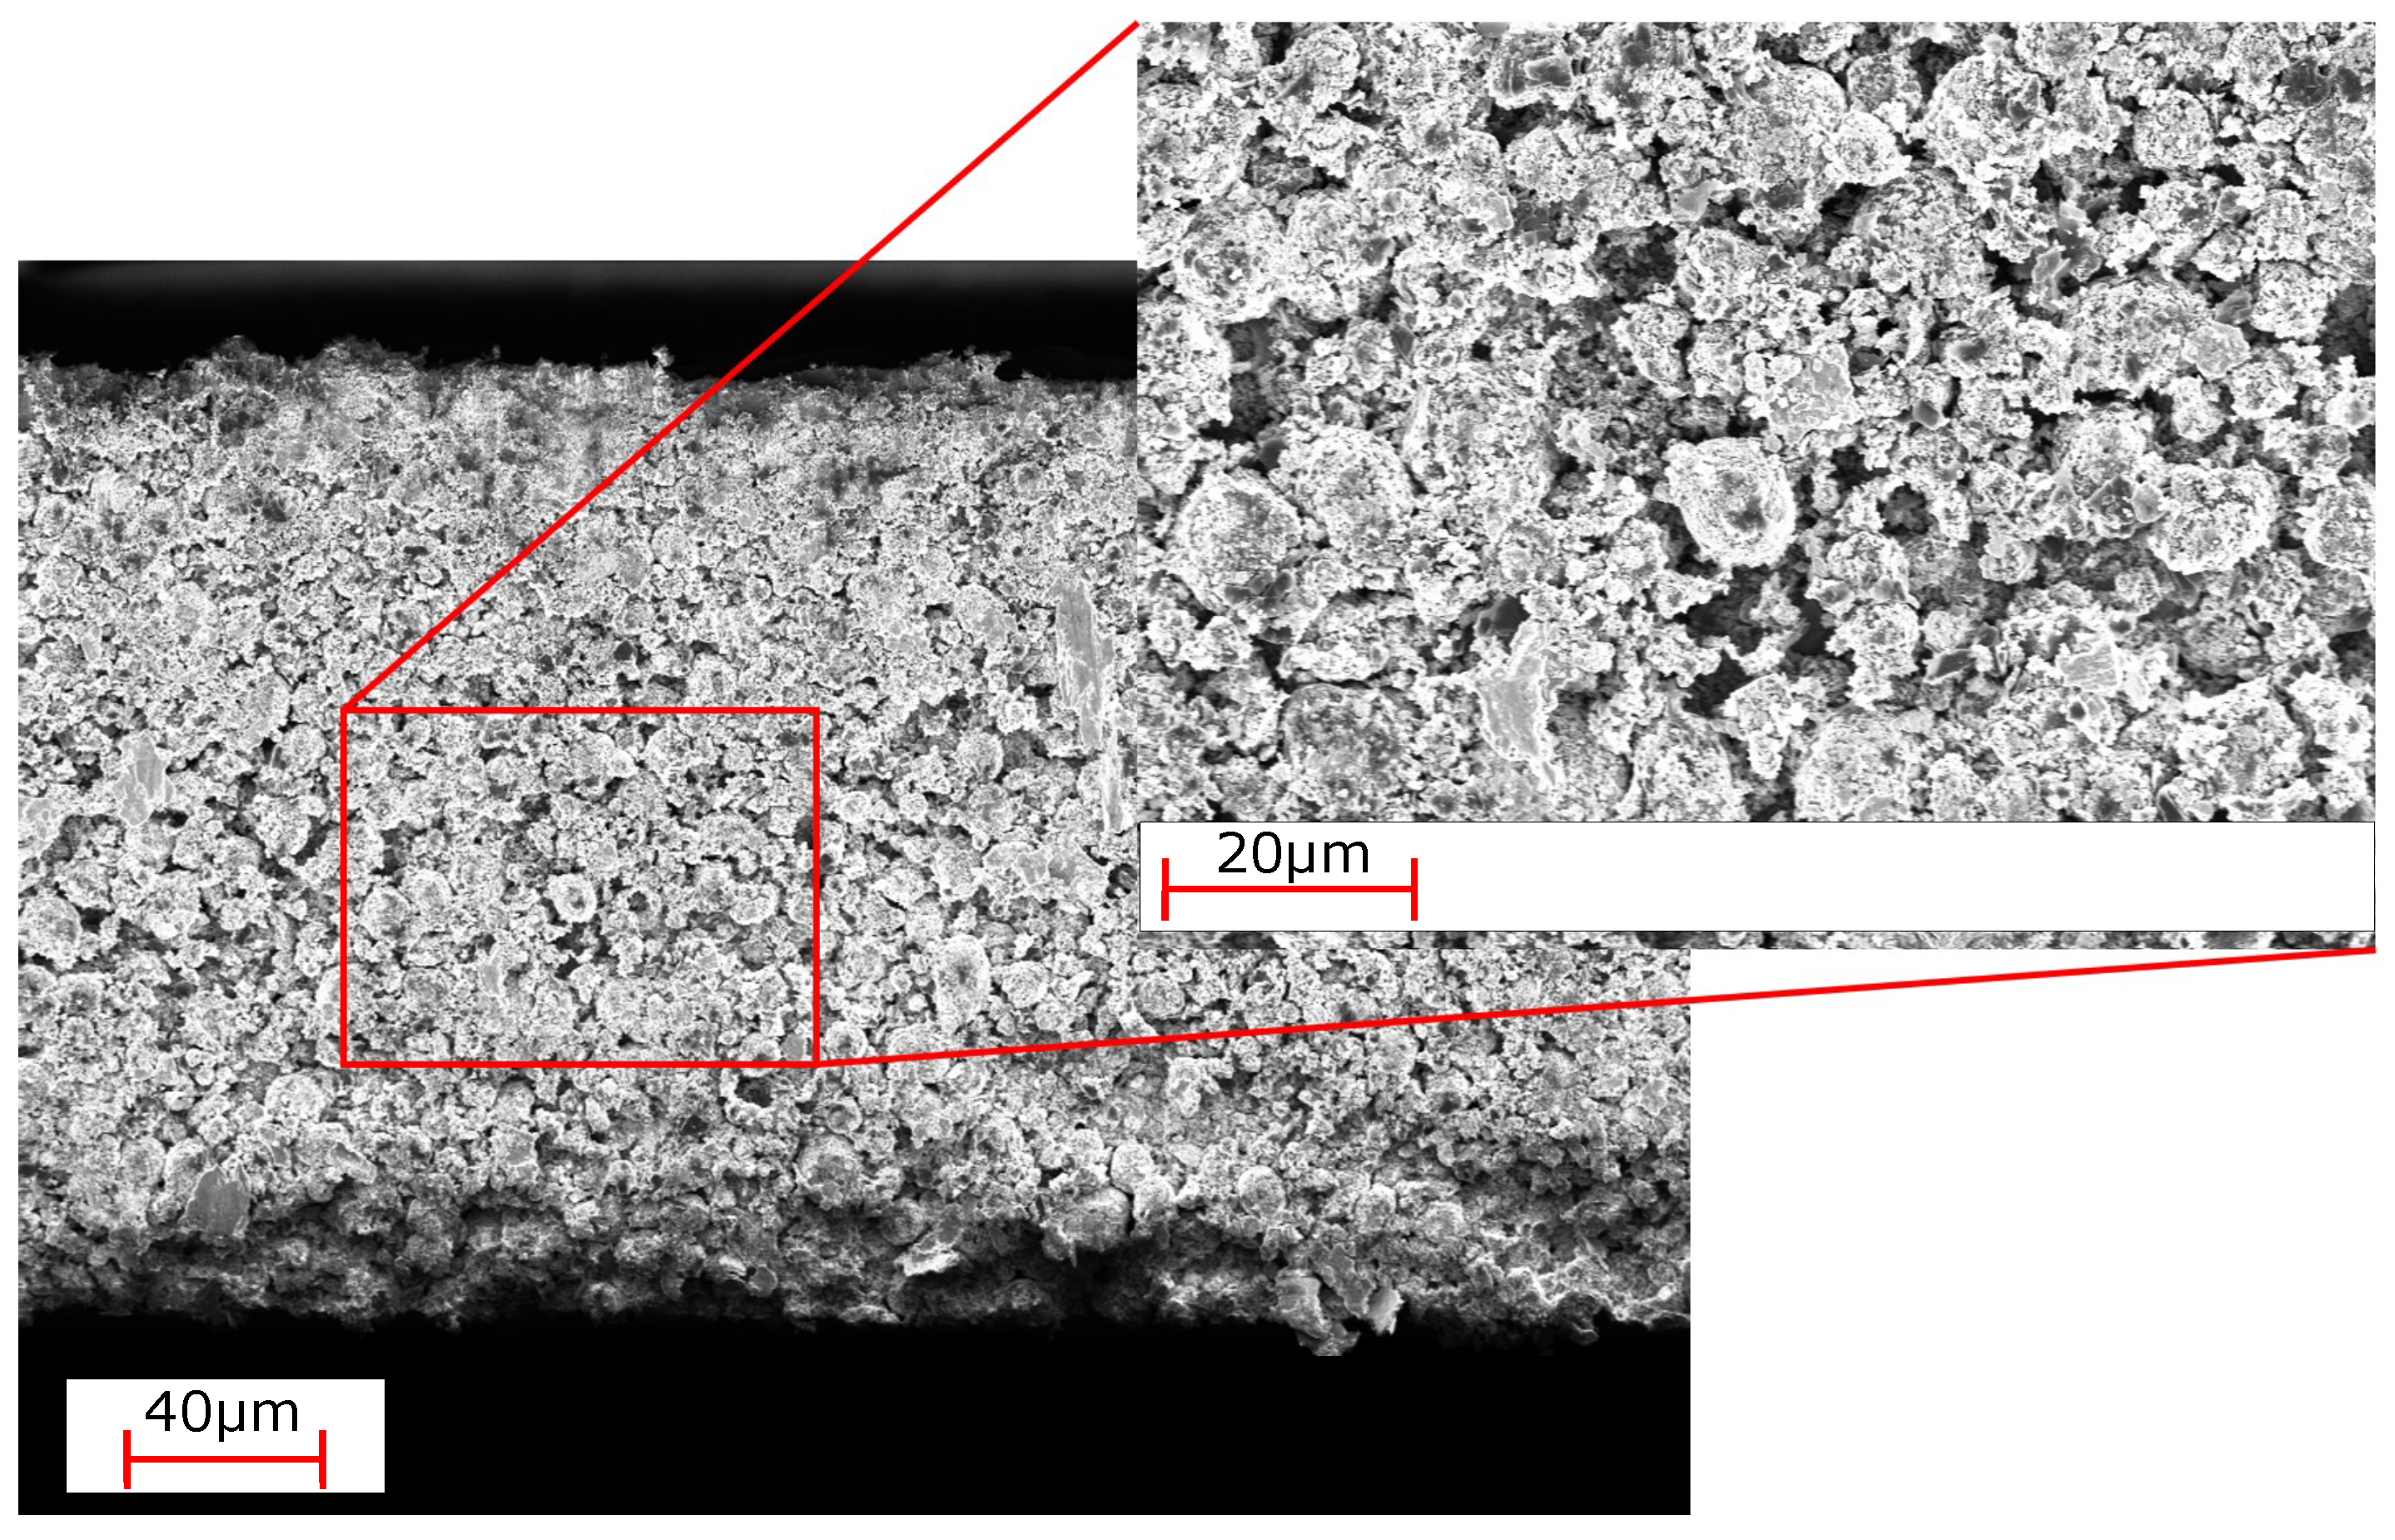
| Electrode Type | Total Thickness [] | Porosity [%] | Areal Capacity [mA h/cm2] |
|---|---|---|---|
| Single-layer | 202 ± 2 | 52.7 ± 0.3 | 8.6 ± 0.1 |
| Multi-layer | 208 ± 4 | 52.6 ± 0.2 | 8.6 ± 0.2 |
| Bottom layer | 89 ± 5 | 59.3 ± 0.9 | 3.1 ± 0.0 |
| C/10* | C/5 | C/2 | 1C | C/10 | |
|---|---|---|---|---|---|
| Improvement [%] |
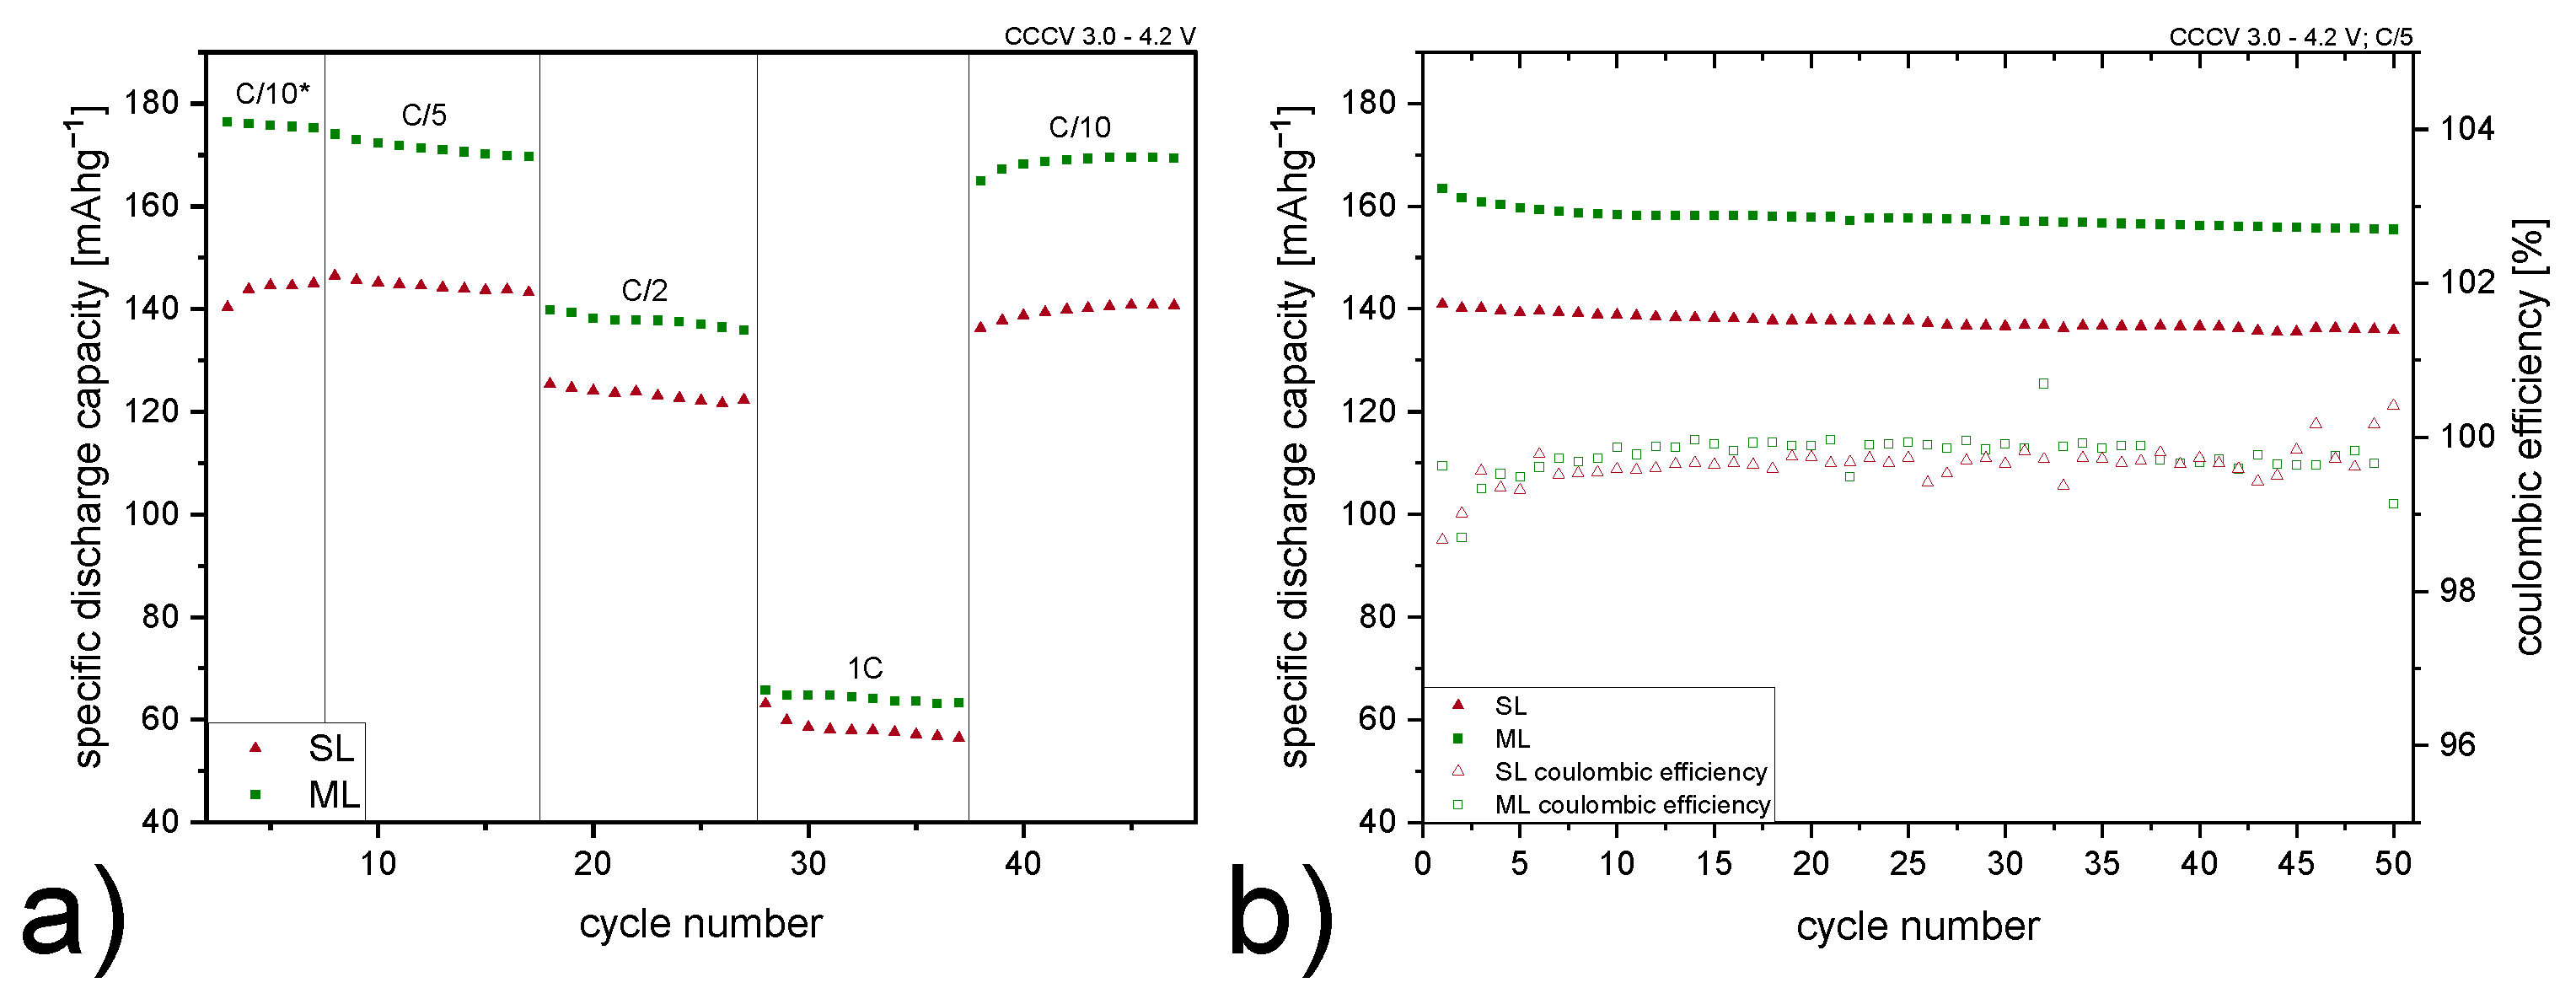
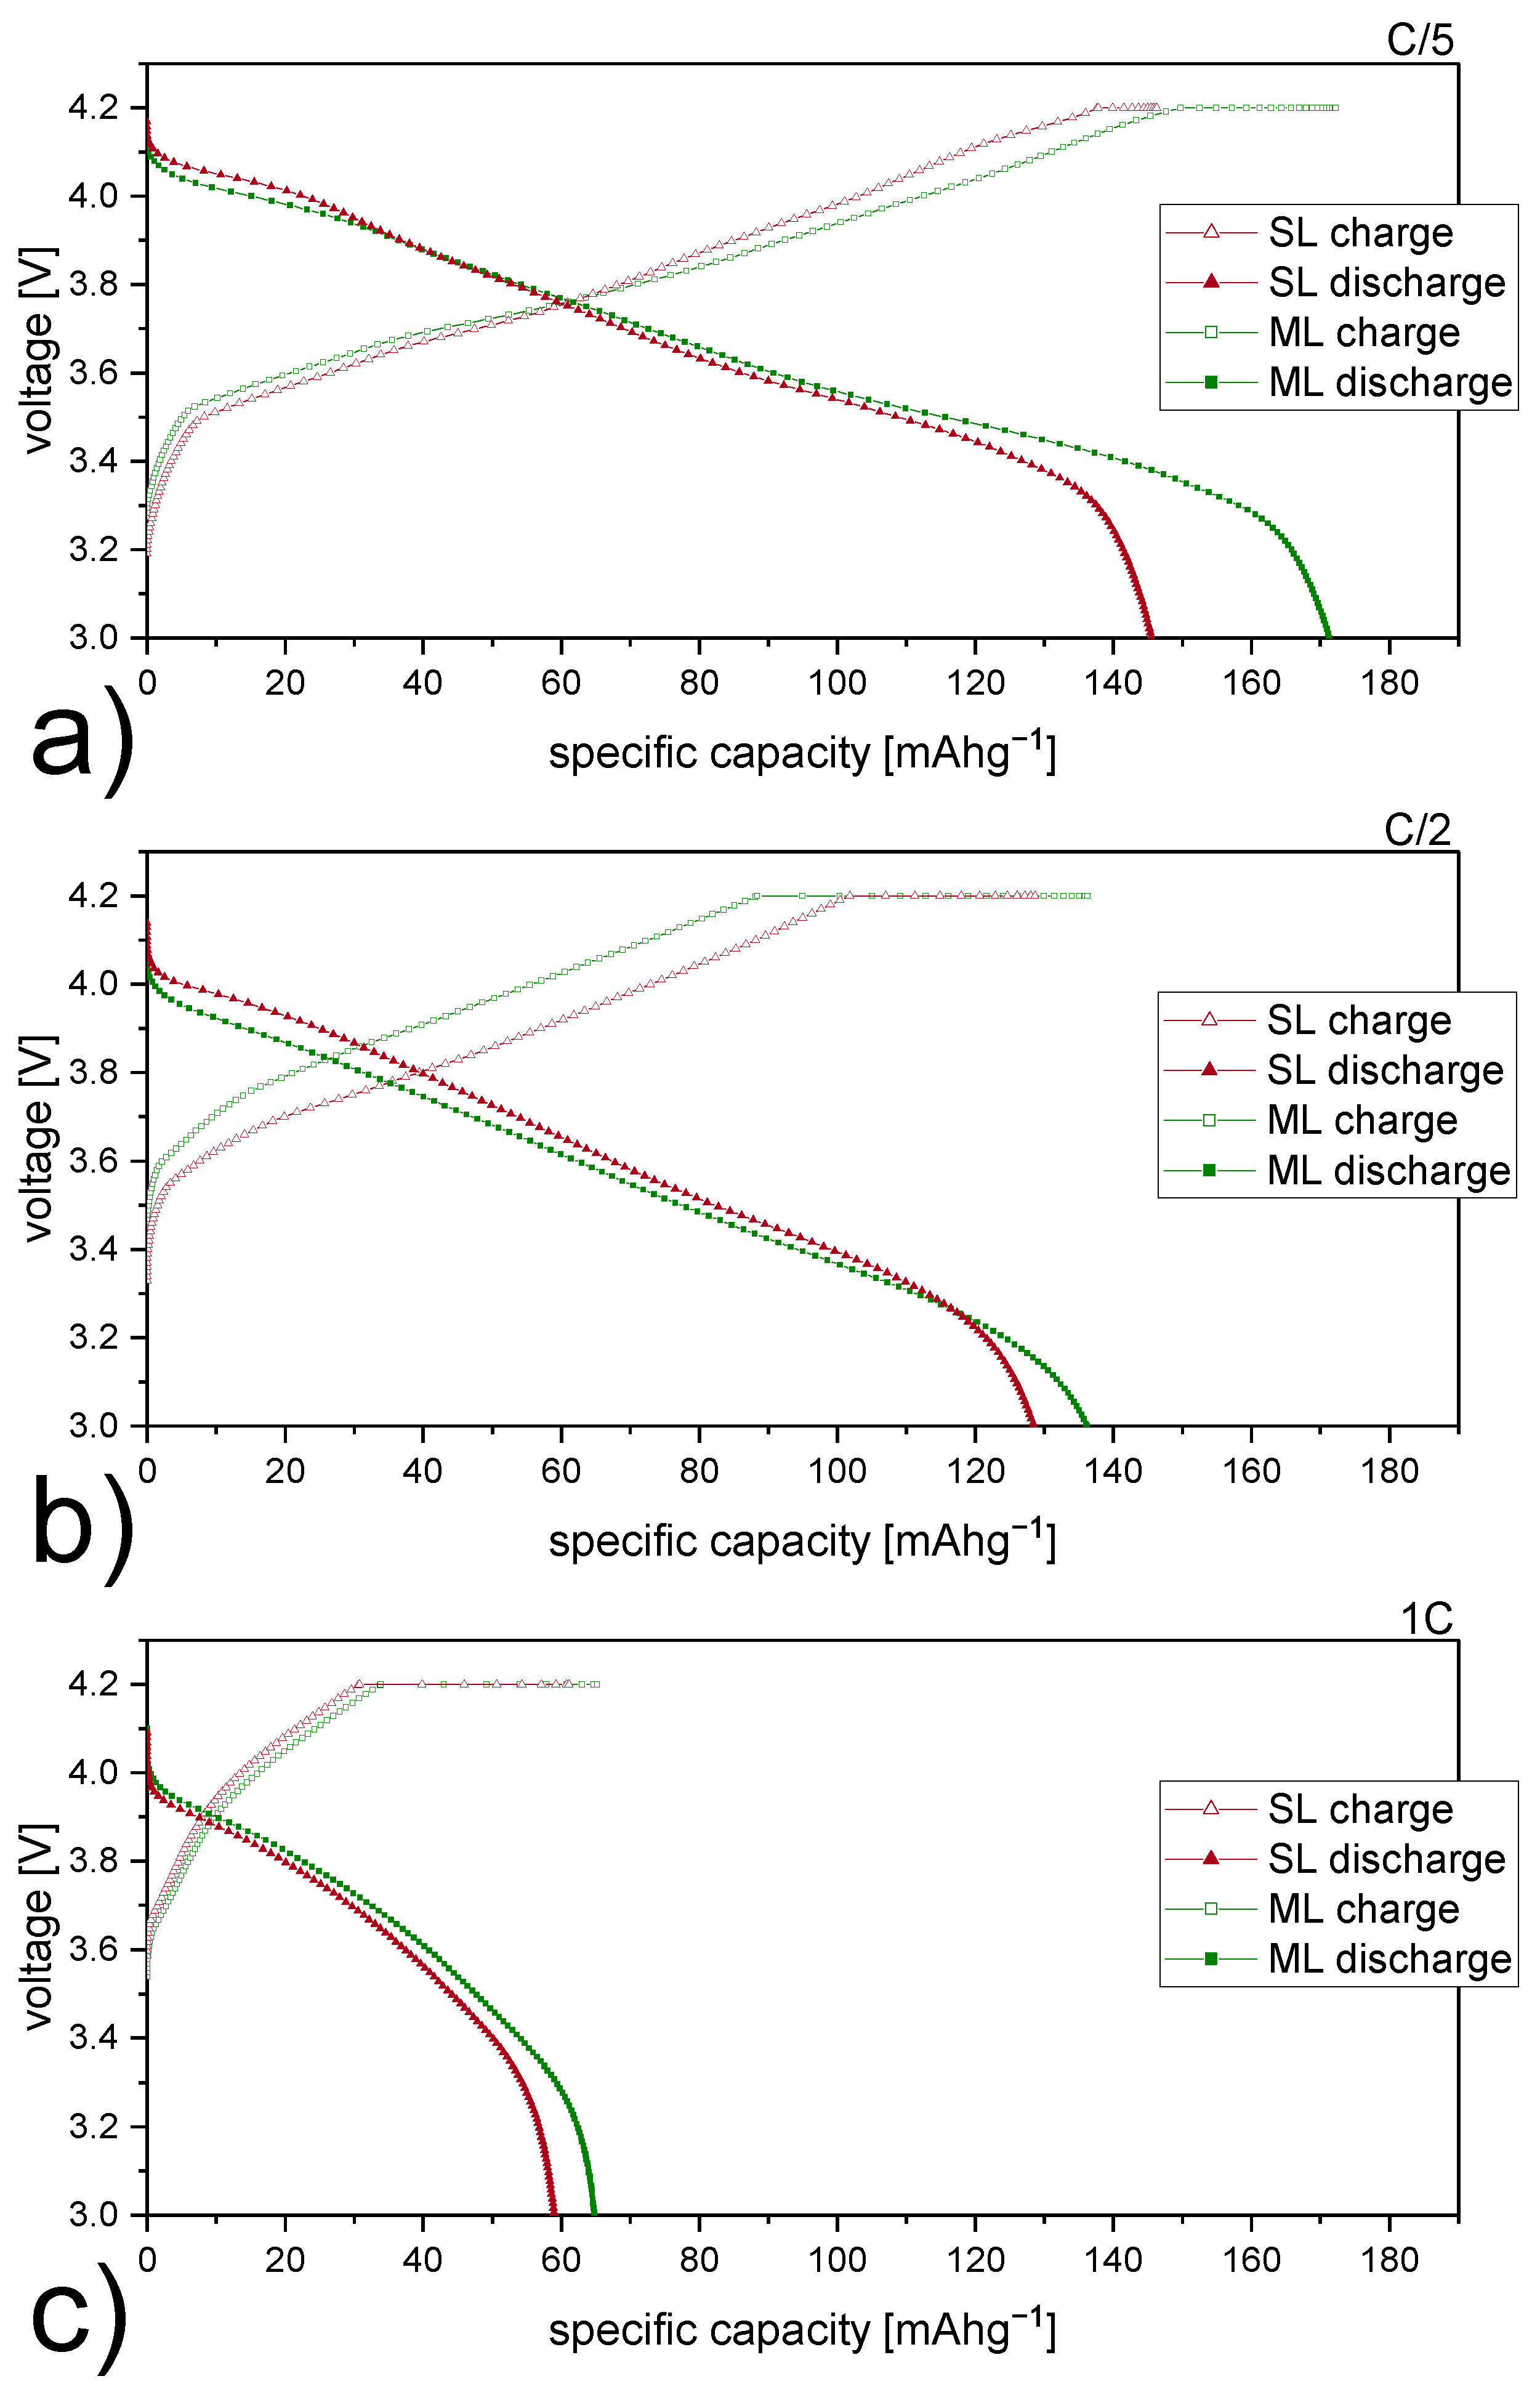
| C-Rate | Electrode Type | Specific Discharge Capacity [mA h g−1] |
|---|---|---|
| C/5 | SL | 146 |
| ML | 171 | |
| C/2 | SL | 128 |
| ML | 136 | |
| 1C | SL | 59 |
| ML | 65 |
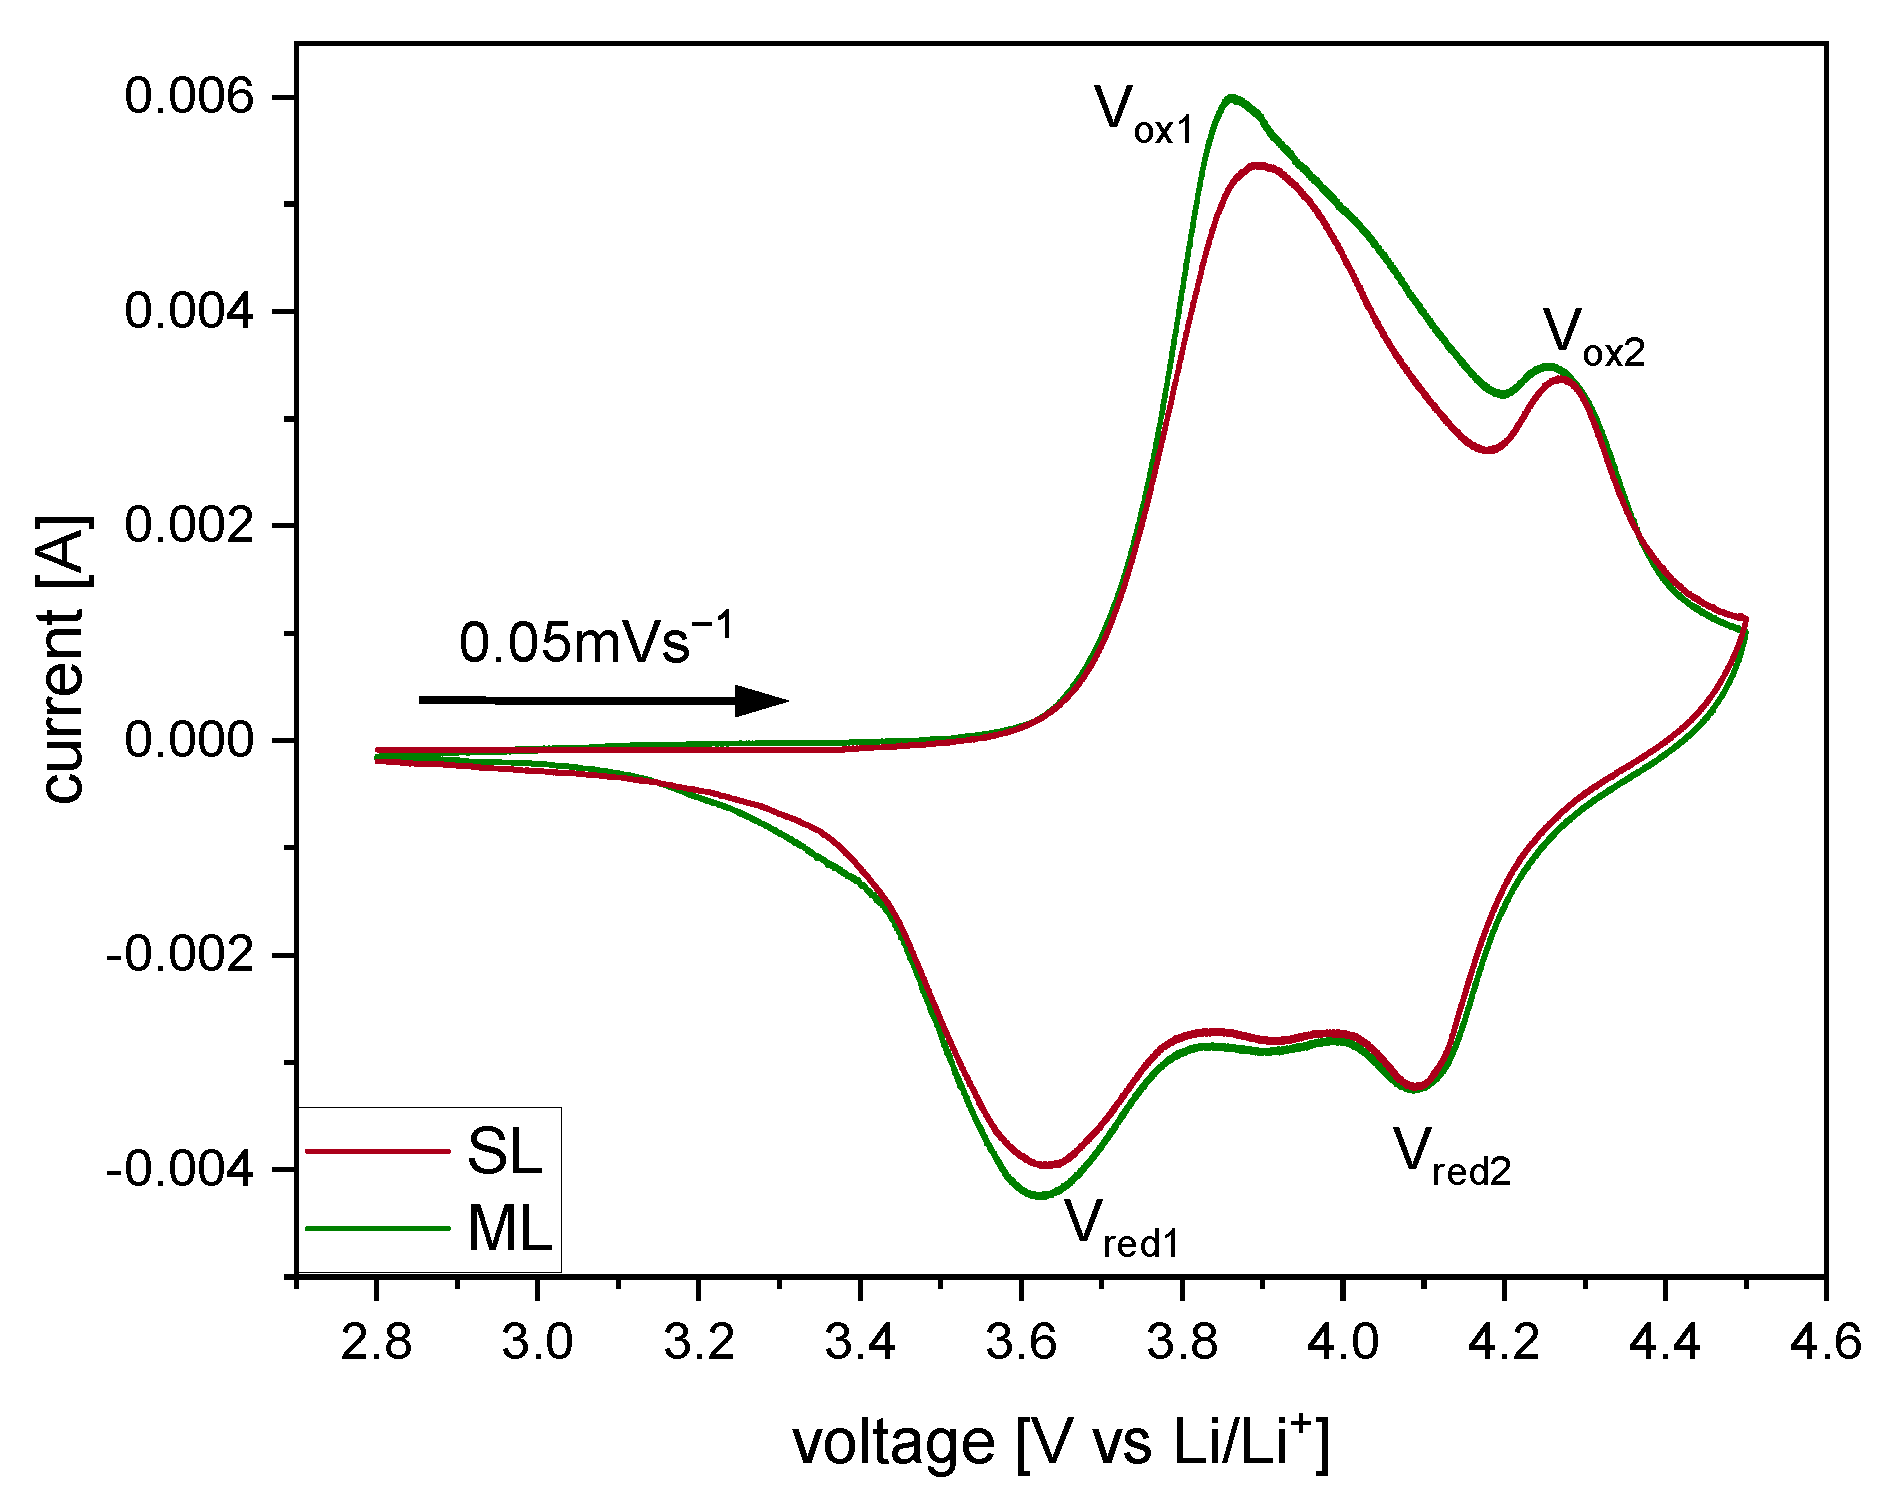
| Electrode Type | Vox1 [v] | Vred1 [v] | V1 [v] | Vox2 [v] | Vred2 [v] | V2 [v] |
|---|---|---|---|---|---|---|
| SL | 3.90 | 3.63 | 0.27 | 4.27 | 4.09 | 0.18 |
| ML | 3.86 | 3.62 | 0.24 | 4.25 | 4.09 | 0.16 |
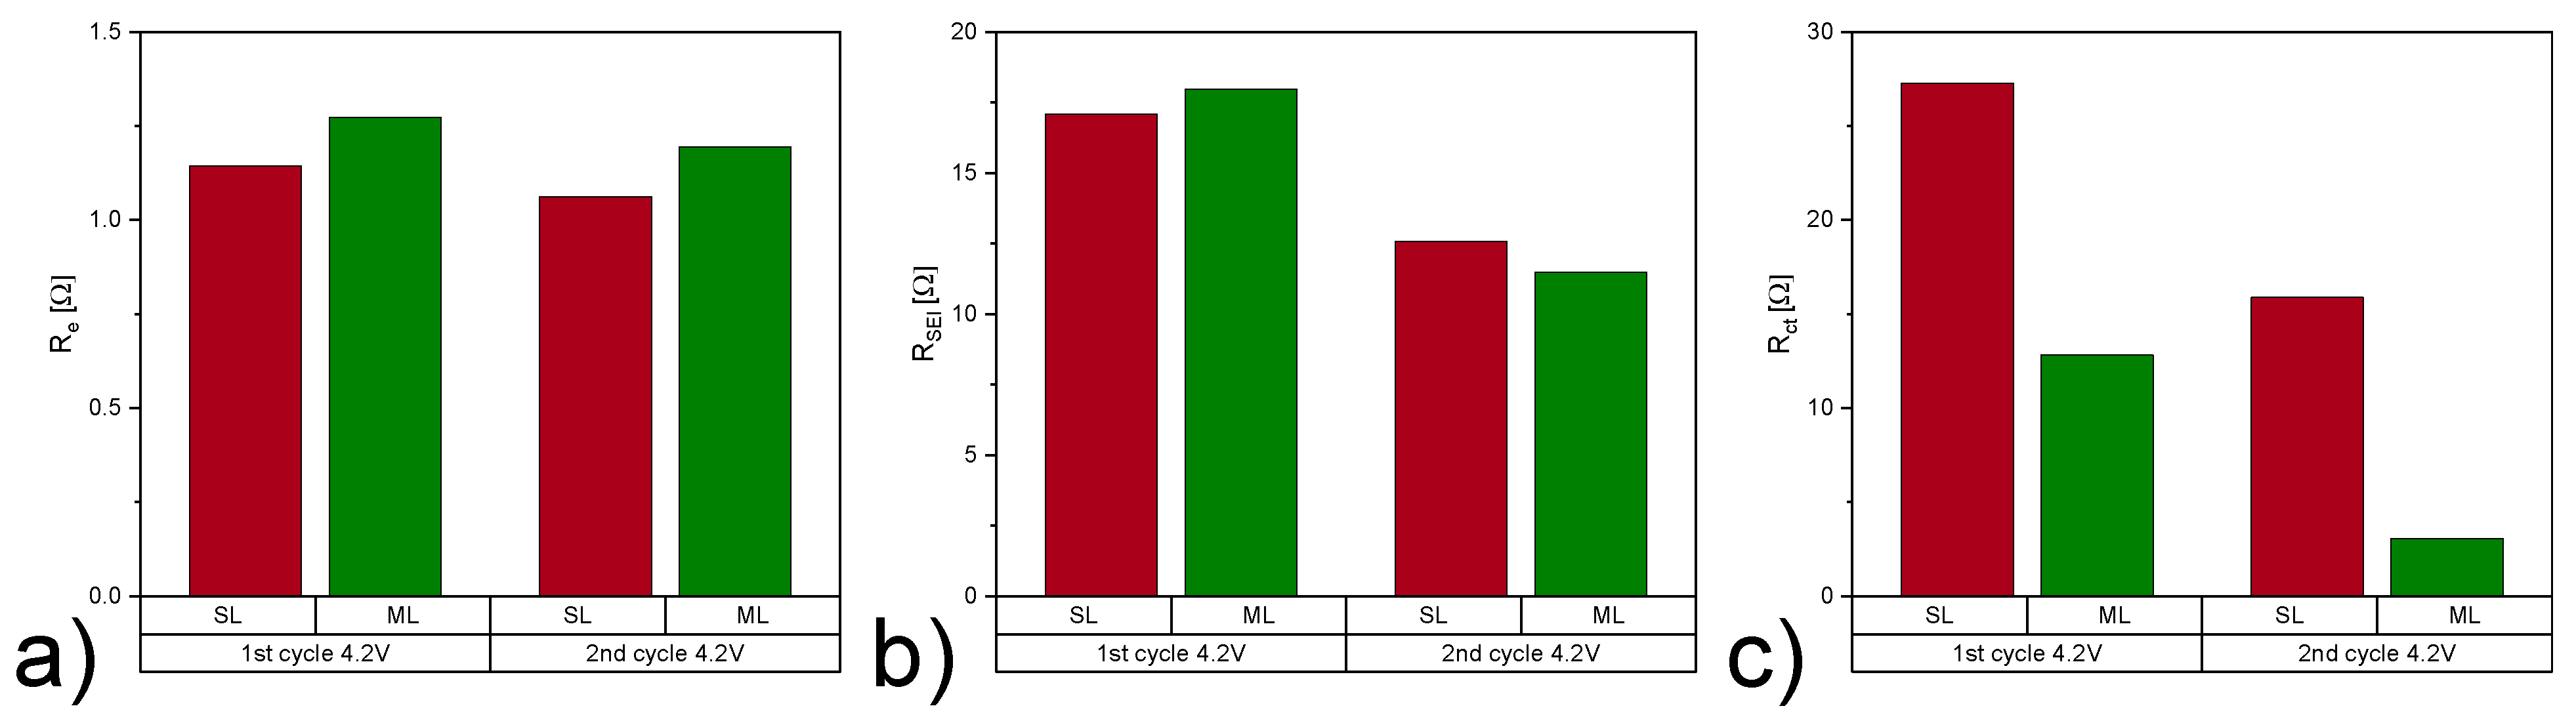
| Electrode Type | Re [] | RSEI [] | Rct [] | QSEI [mF] | SEI | Qdl [mF] | dlA | 2 | |
|---|---|---|---|---|---|---|---|---|---|
| 1st cycle 4.2 V | SL | 1.14 | 17.08 | 27.29 | 4.90 | 0.45 | 2.85 | 1 | 0.006 |
| ML | 1.27 | 17.97 | 12.81 | 5.91 | 0.45 | 7.36 | 0.99 | 0.009 | |
| 2nd cycle 4.2 V | SL | 1.06 | 12.58 | 15.88 | 6.50 | 0.45 | 4.23 | 0.98 | 0.004 |
| ML | 1.19 | 11.48 | 3.05 | 6.48 | 0.45 | 7.90 | 1 | 0.005 |
Publisher’s Note: MDPI stays neutral with regard to jurisdictional claims in published maps and institutional affiliations. |
© 2022 by the authors. Licensee MDPI, Basel, Switzerland. This article is an open access article distributed under the terms and conditions of the Creative Commons Attribution (CC BY) license (https://creativecommons.org/licenses/by/4.0/).
Share and Cite
Neidhart, L.; Fröhlich, K.; Eshraghi, N.; Cupid, D.; Winter, F.; Jahn, M. Aqueous Manufacturing of Defect-Free Thick Multi-Layer NMC811 Electrodes. Nanomaterials 2022, 12, 317. https://doi.org/10.3390/nano12030317
Neidhart L, Fröhlich K, Eshraghi N, Cupid D, Winter F, Jahn M. Aqueous Manufacturing of Defect-Free Thick Multi-Layer NMC811 Electrodes. Nanomaterials. 2022; 12(3):317. https://doi.org/10.3390/nano12030317
Chicago/Turabian StyleNeidhart, Lukas, Katja Fröhlich, Nicolas Eshraghi, Damian Cupid, Franz Winter, and Marcus Jahn. 2022. "Aqueous Manufacturing of Defect-Free Thick Multi-Layer NMC811 Electrodes" Nanomaterials 12, no. 3: 317. https://doi.org/10.3390/nano12030317
APA StyleNeidhart, L., Fröhlich, K., Eshraghi, N., Cupid, D., Winter, F., & Jahn, M. (2022). Aqueous Manufacturing of Defect-Free Thick Multi-Layer NMC811 Electrodes. Nanomaterials, 12(3), 317. https://doi.org/10.3390/nano12030317