
Synthesis, Purification, and Characterization of Carbon Dots from Non-Activated and Activated Pyrolytic Carbon Black

 ,
,  ,
,  ,
, 

Abstract
:
1. Introduction
2. Materials and Methods
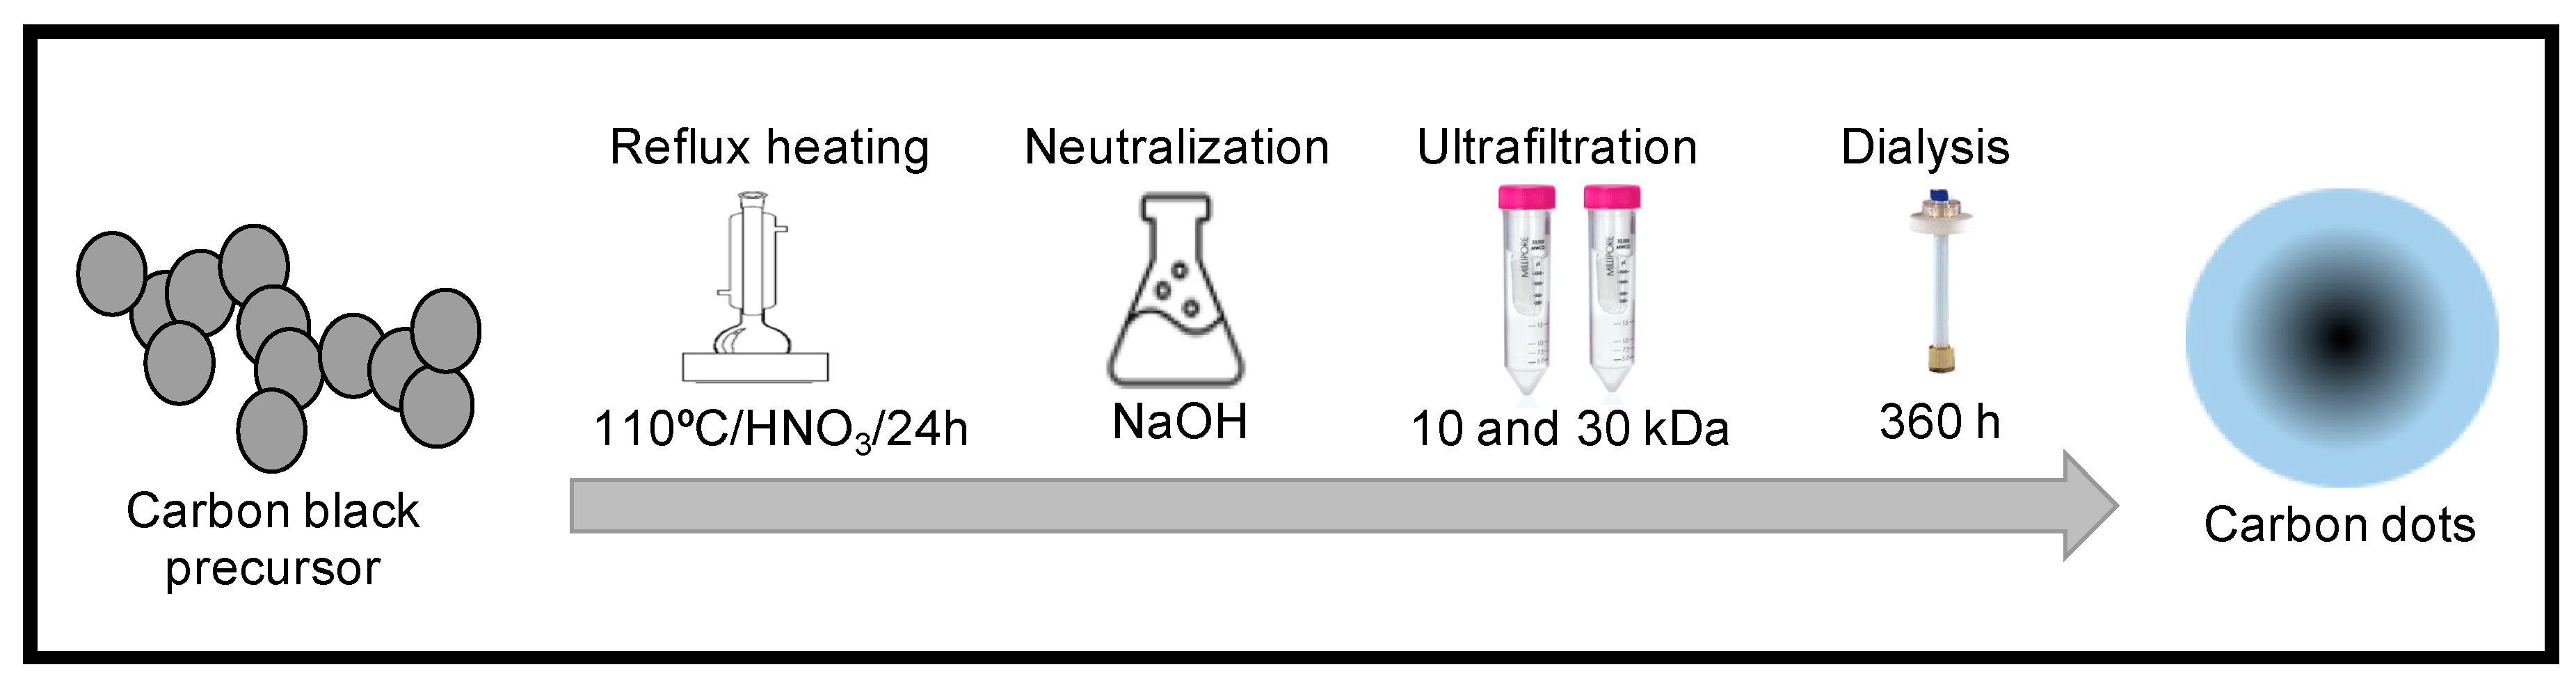
2.1. Carbon Dots Synthesis
2.2. Carbon Dots Characterization
3. Results and Discussion
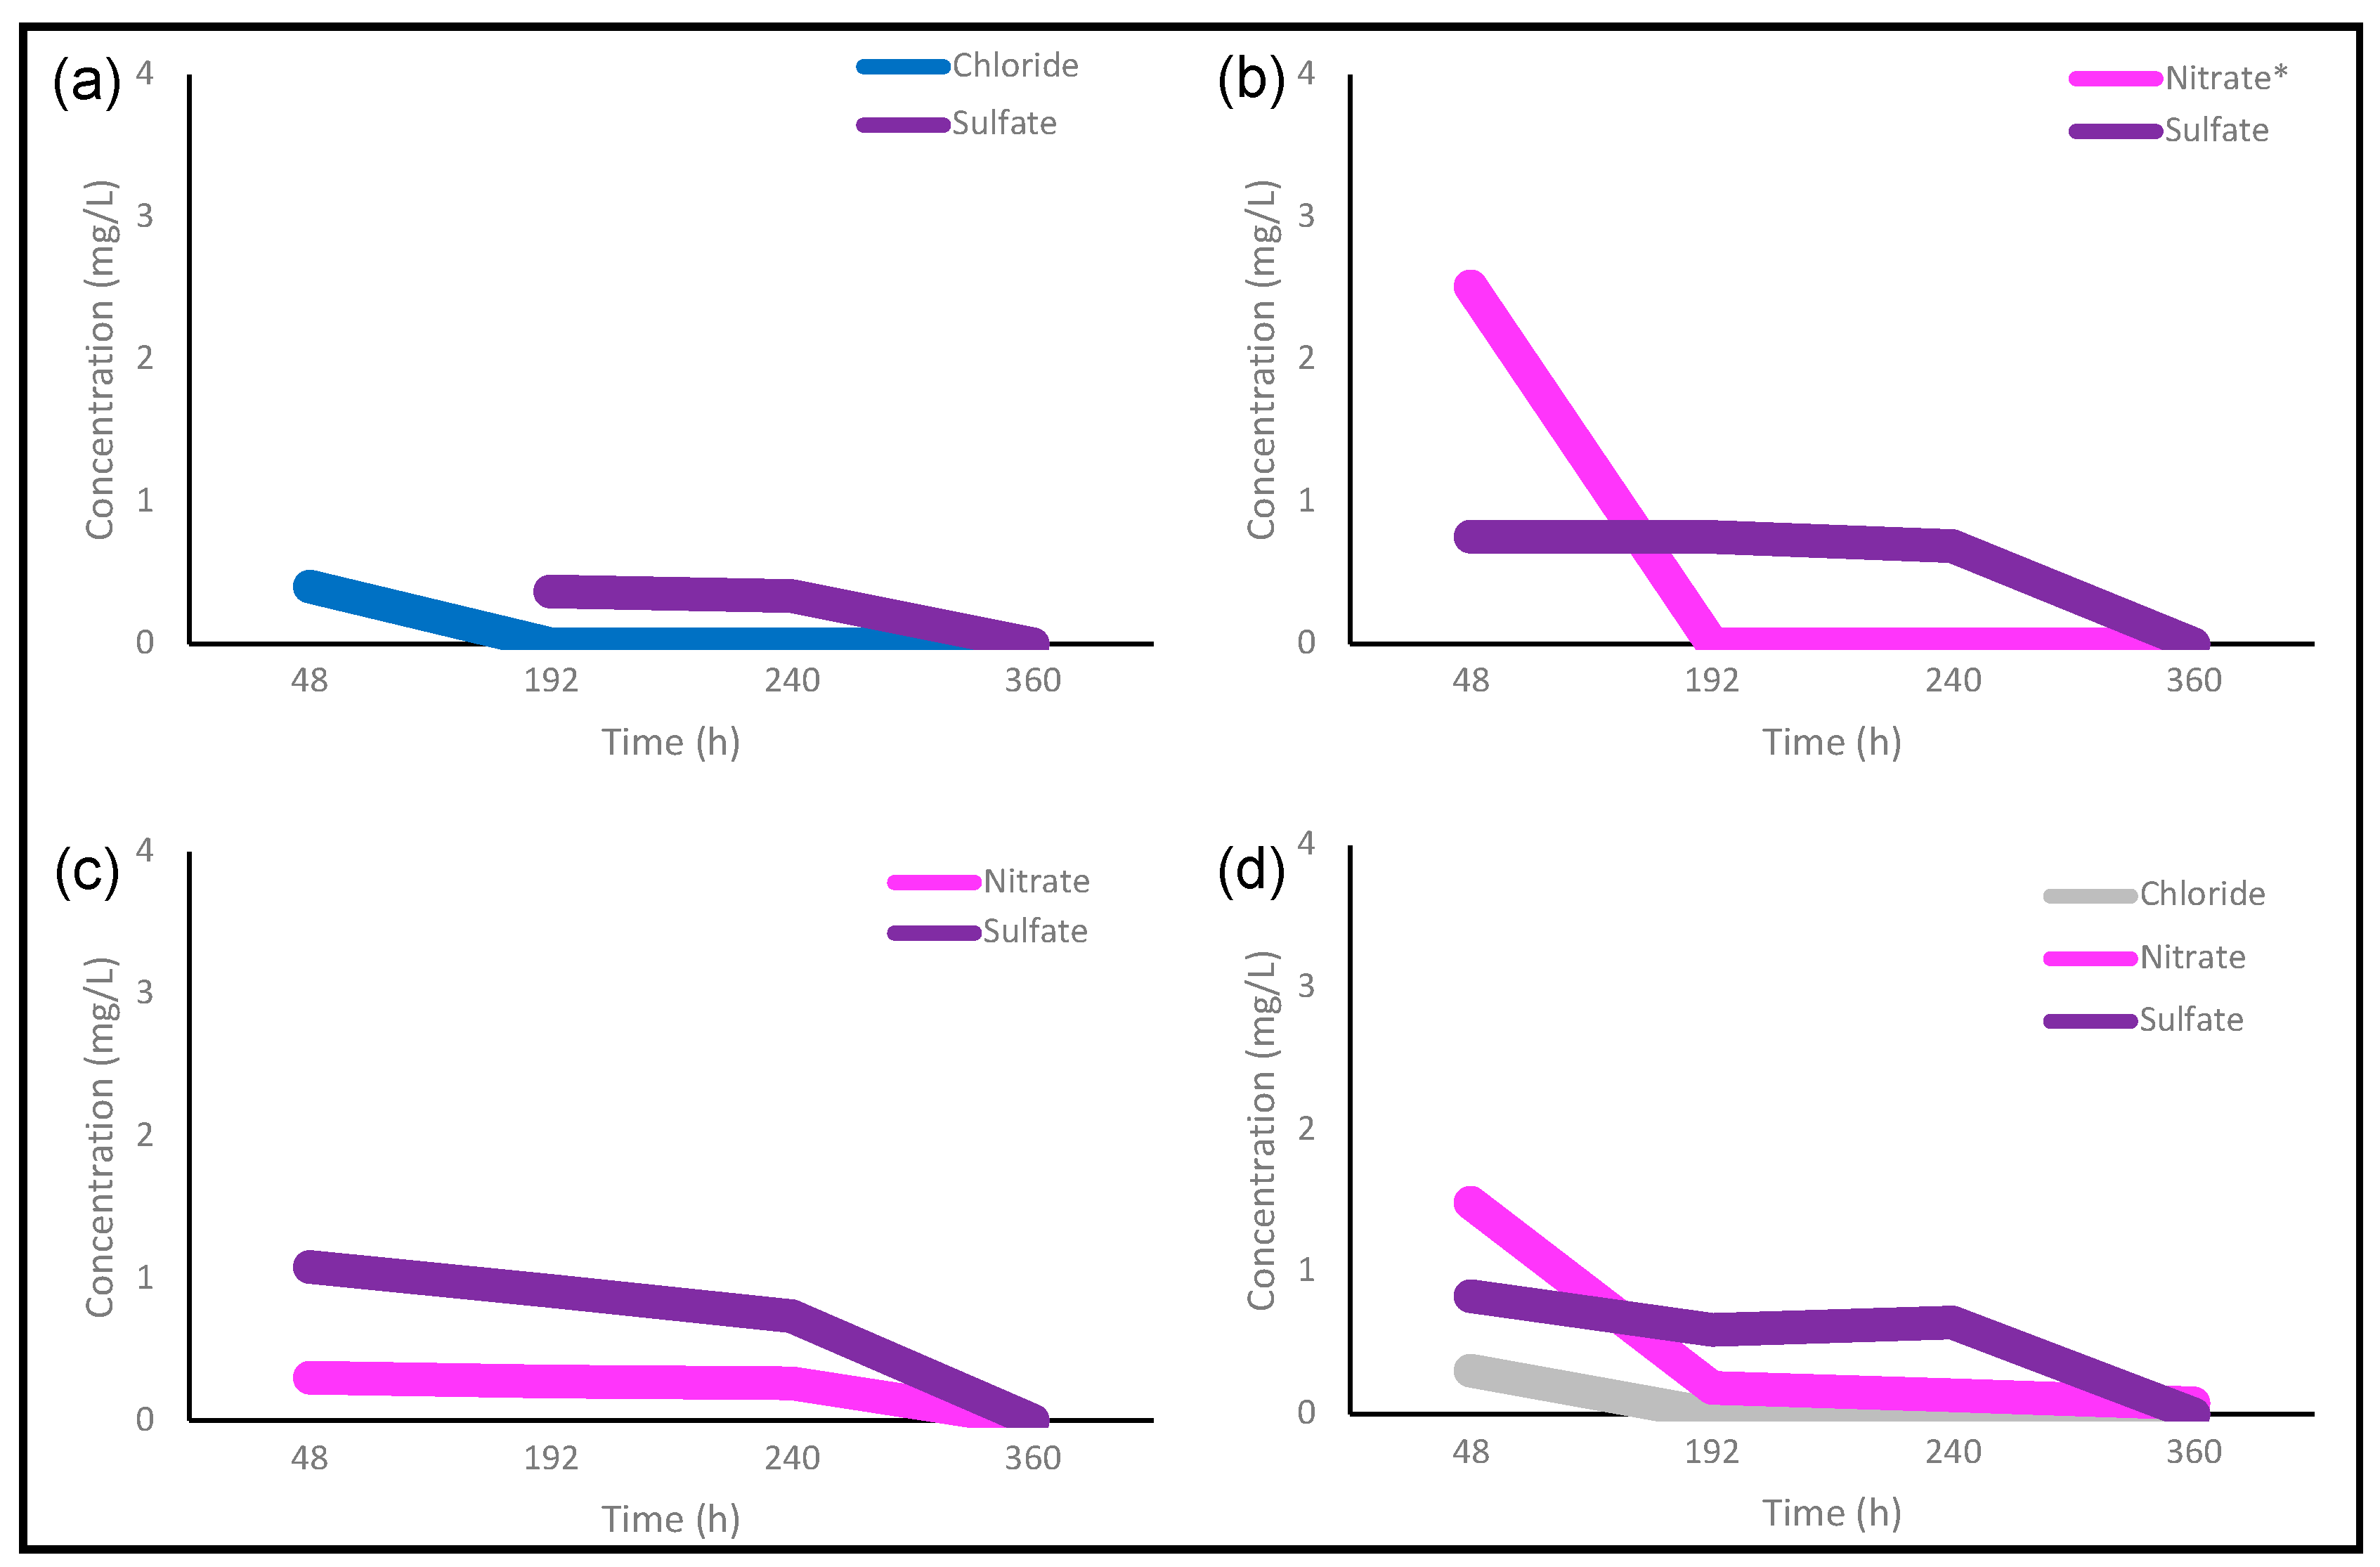
3.1. Carbon Dot Purification
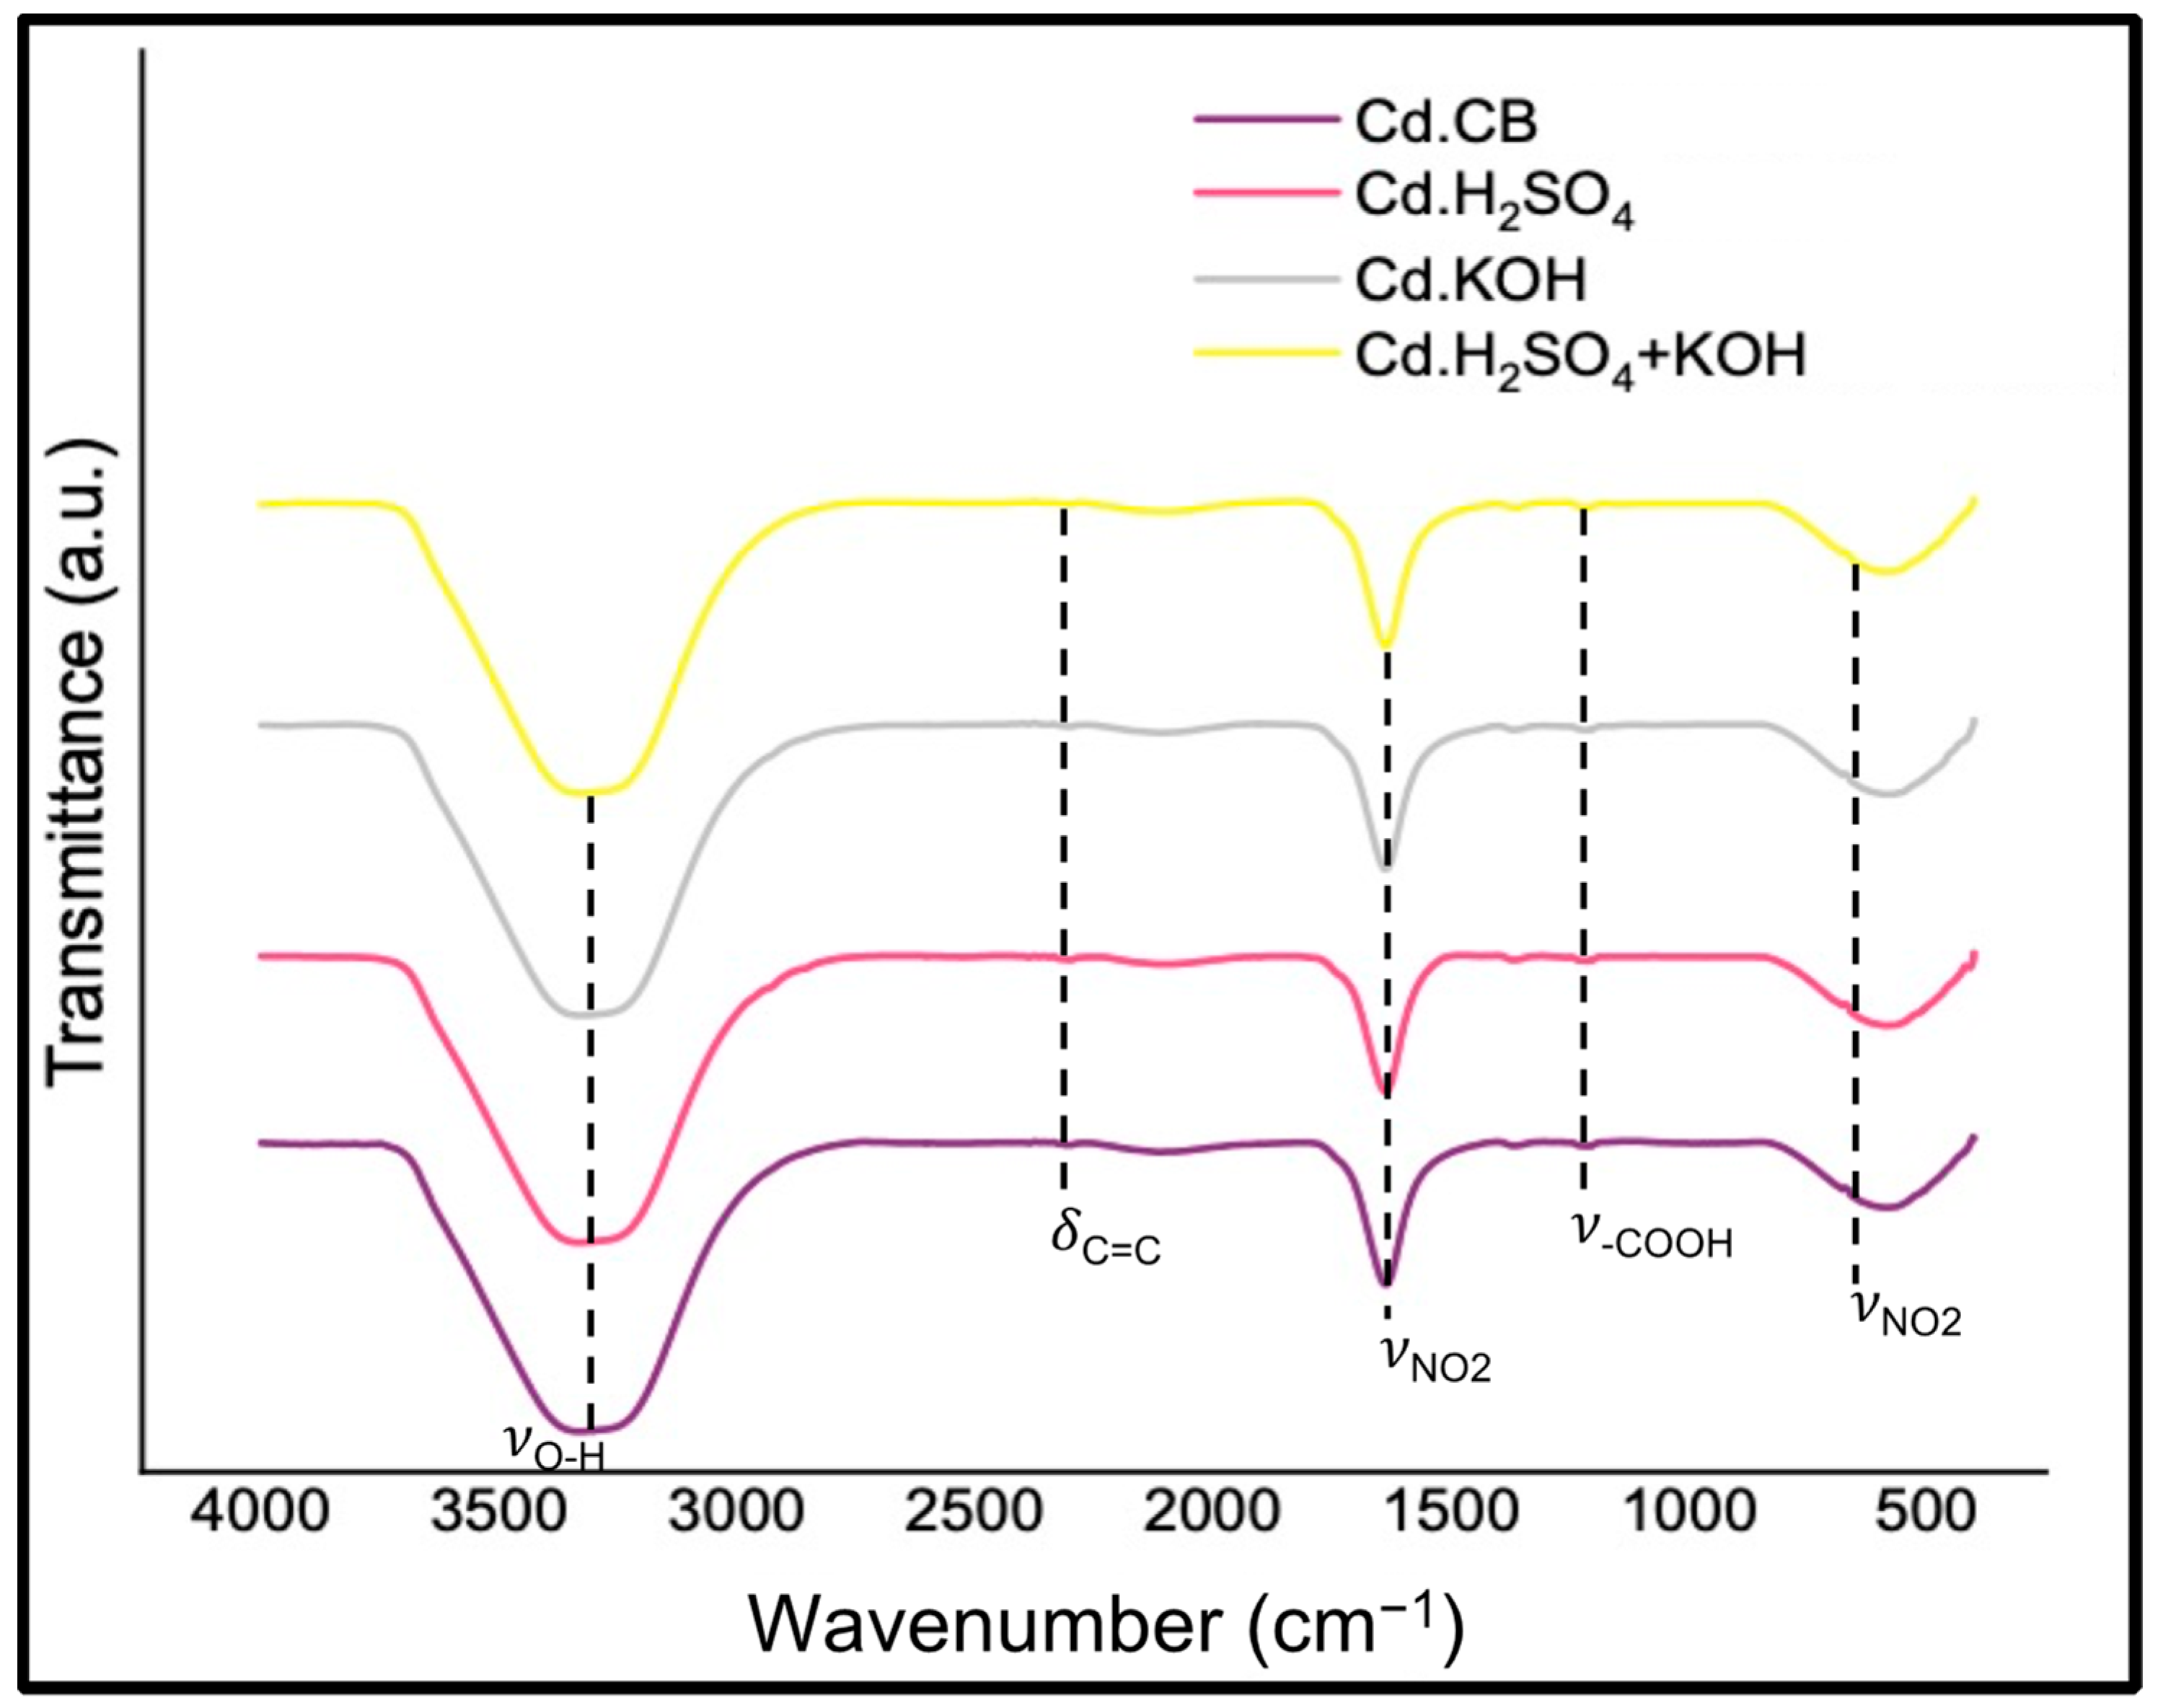
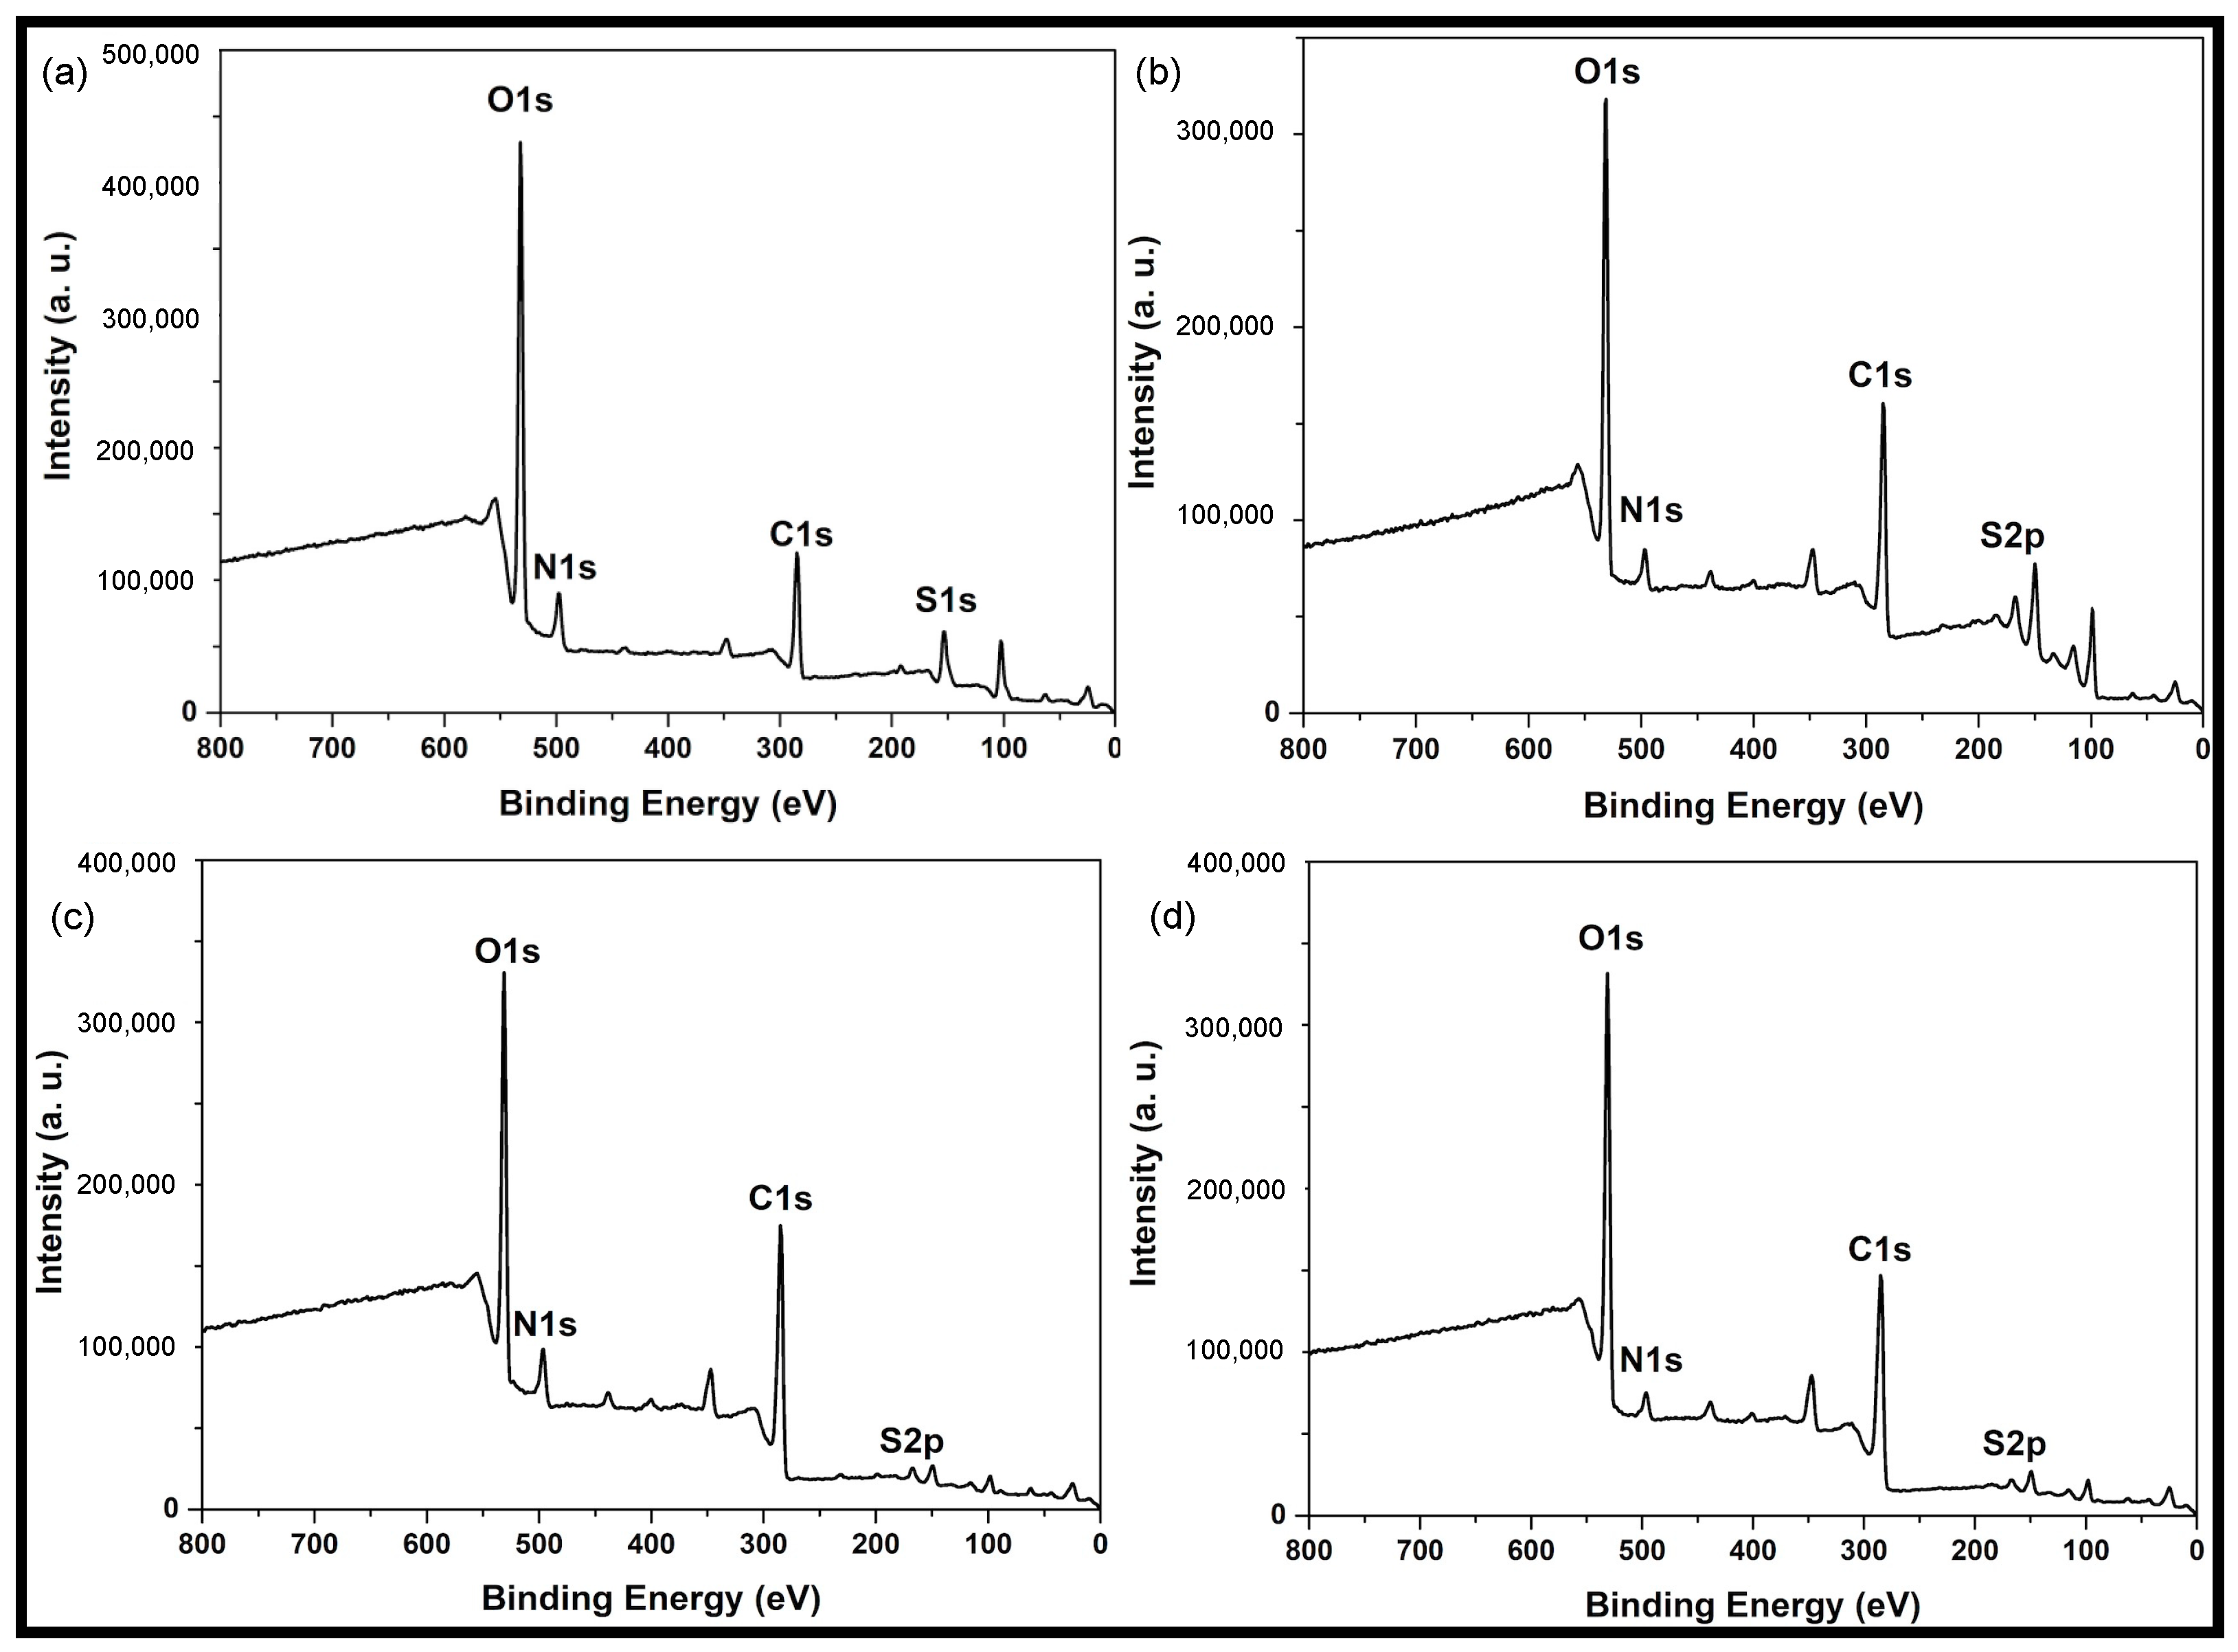
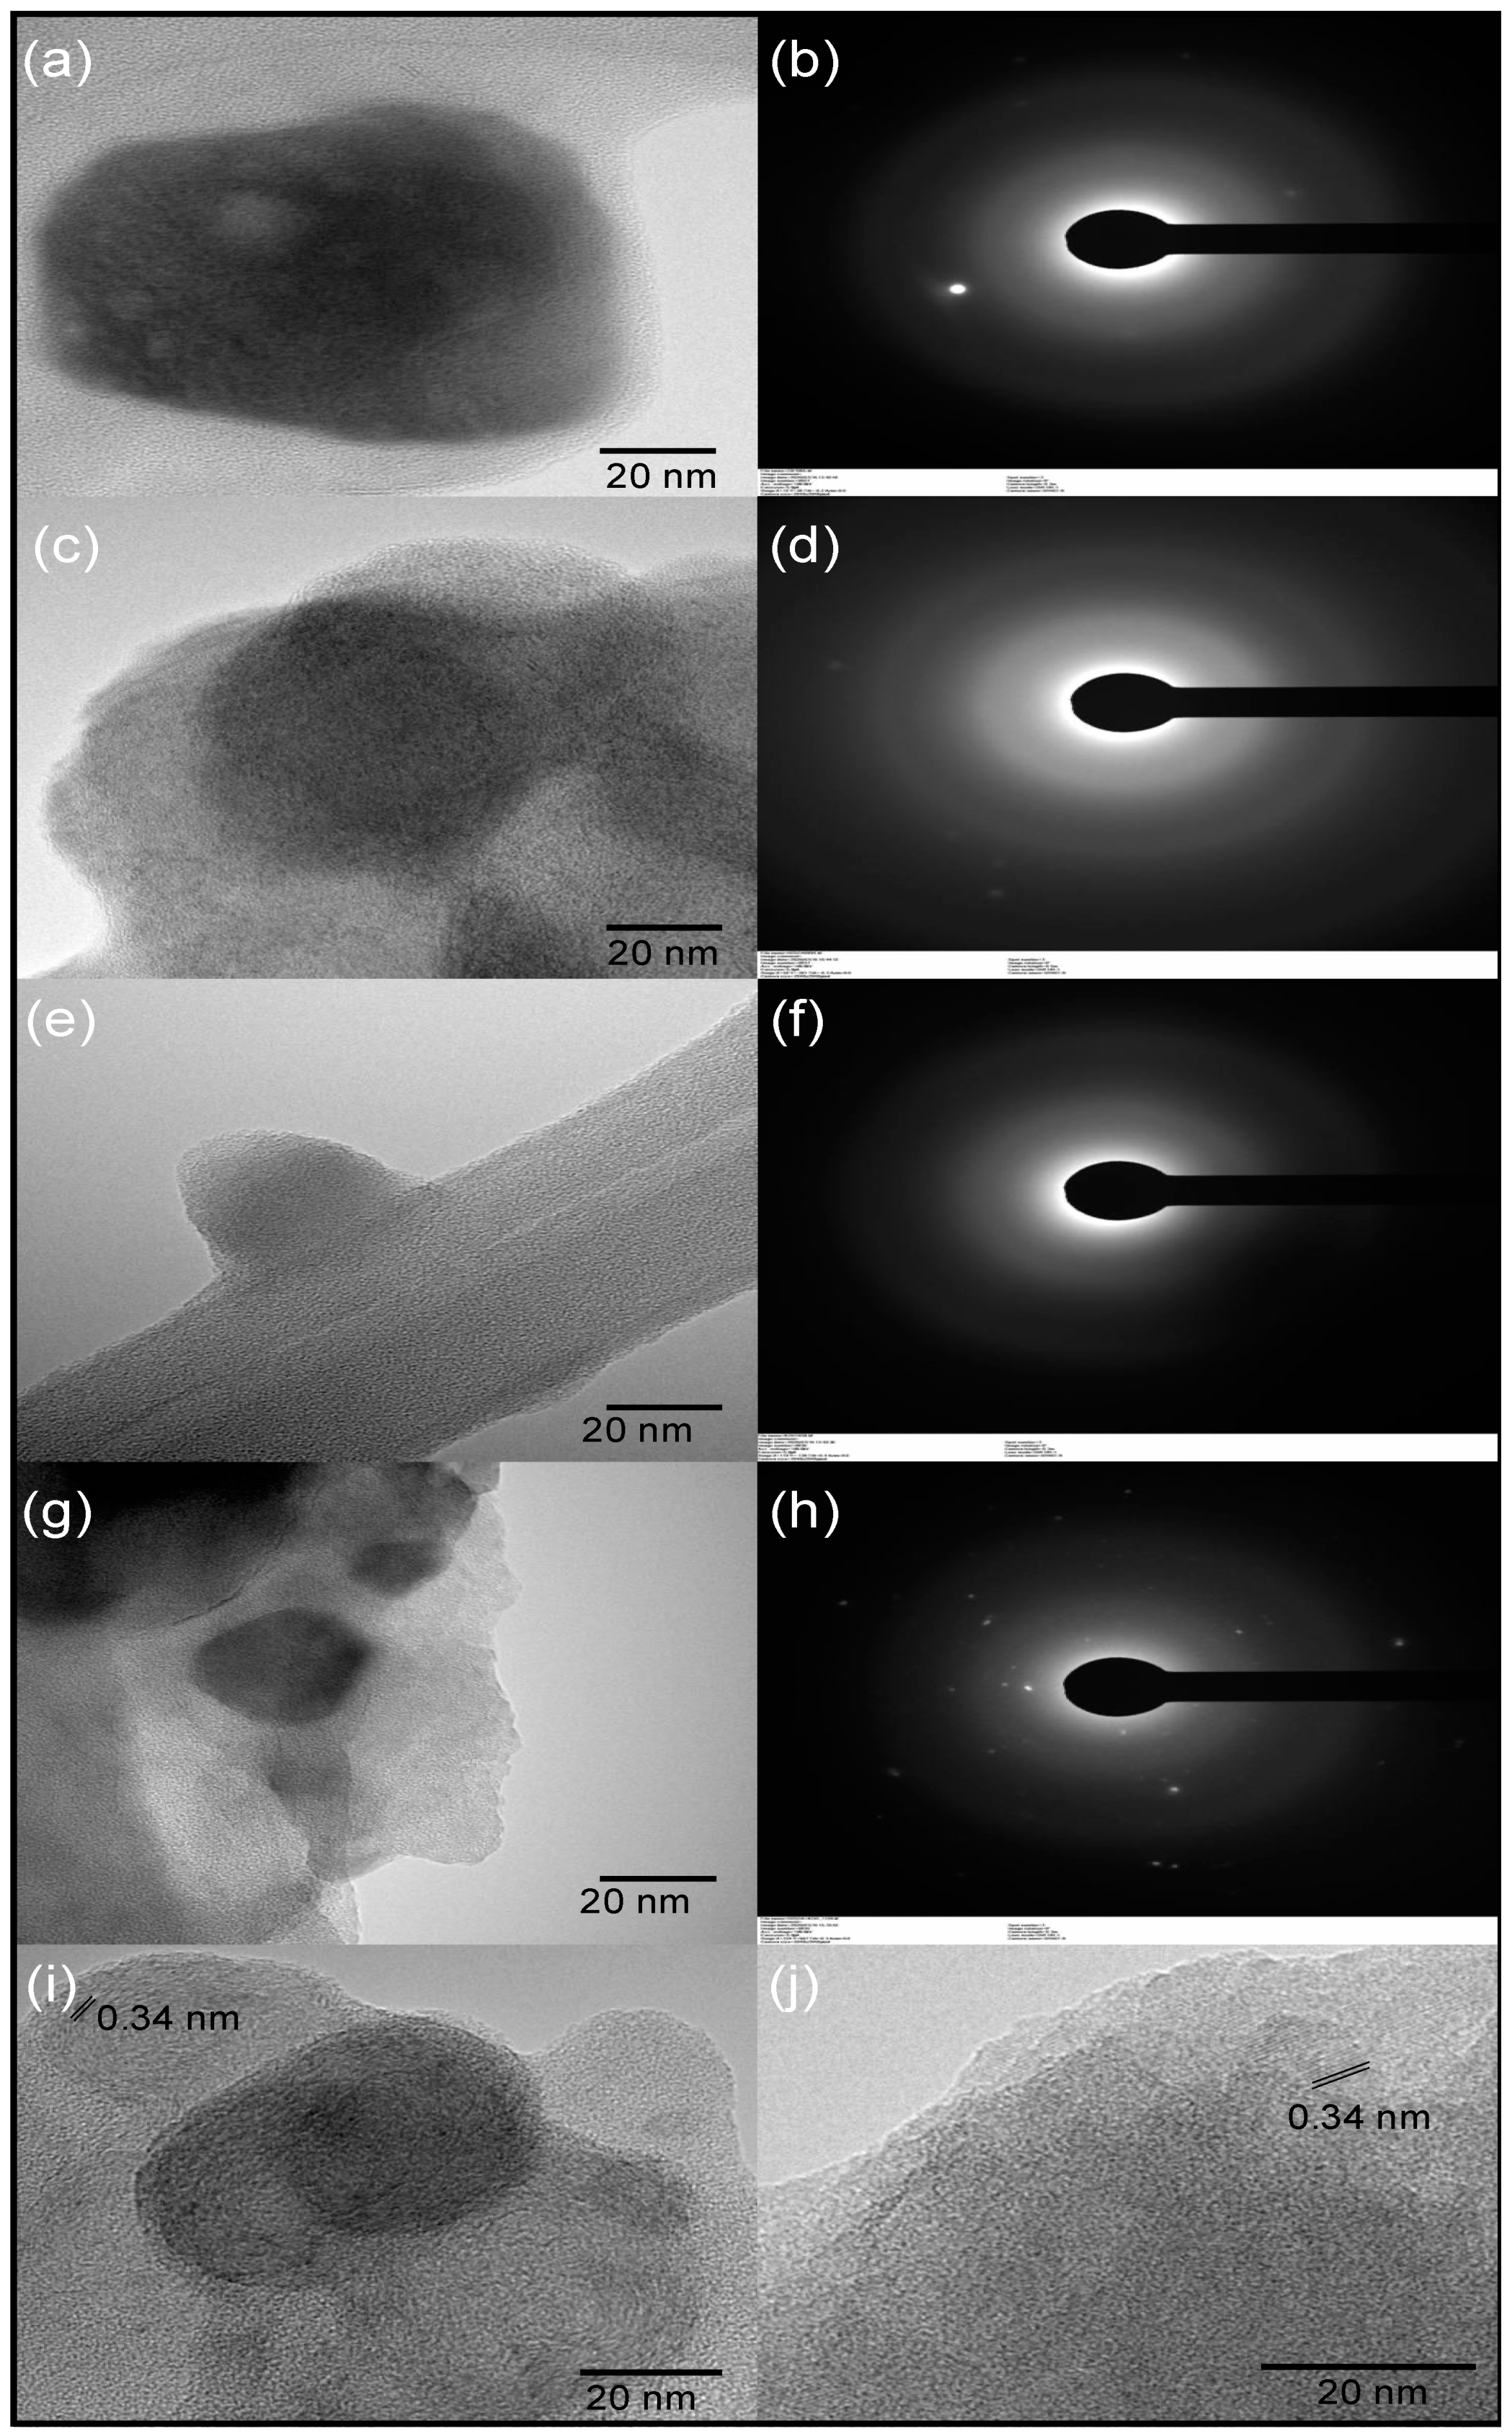
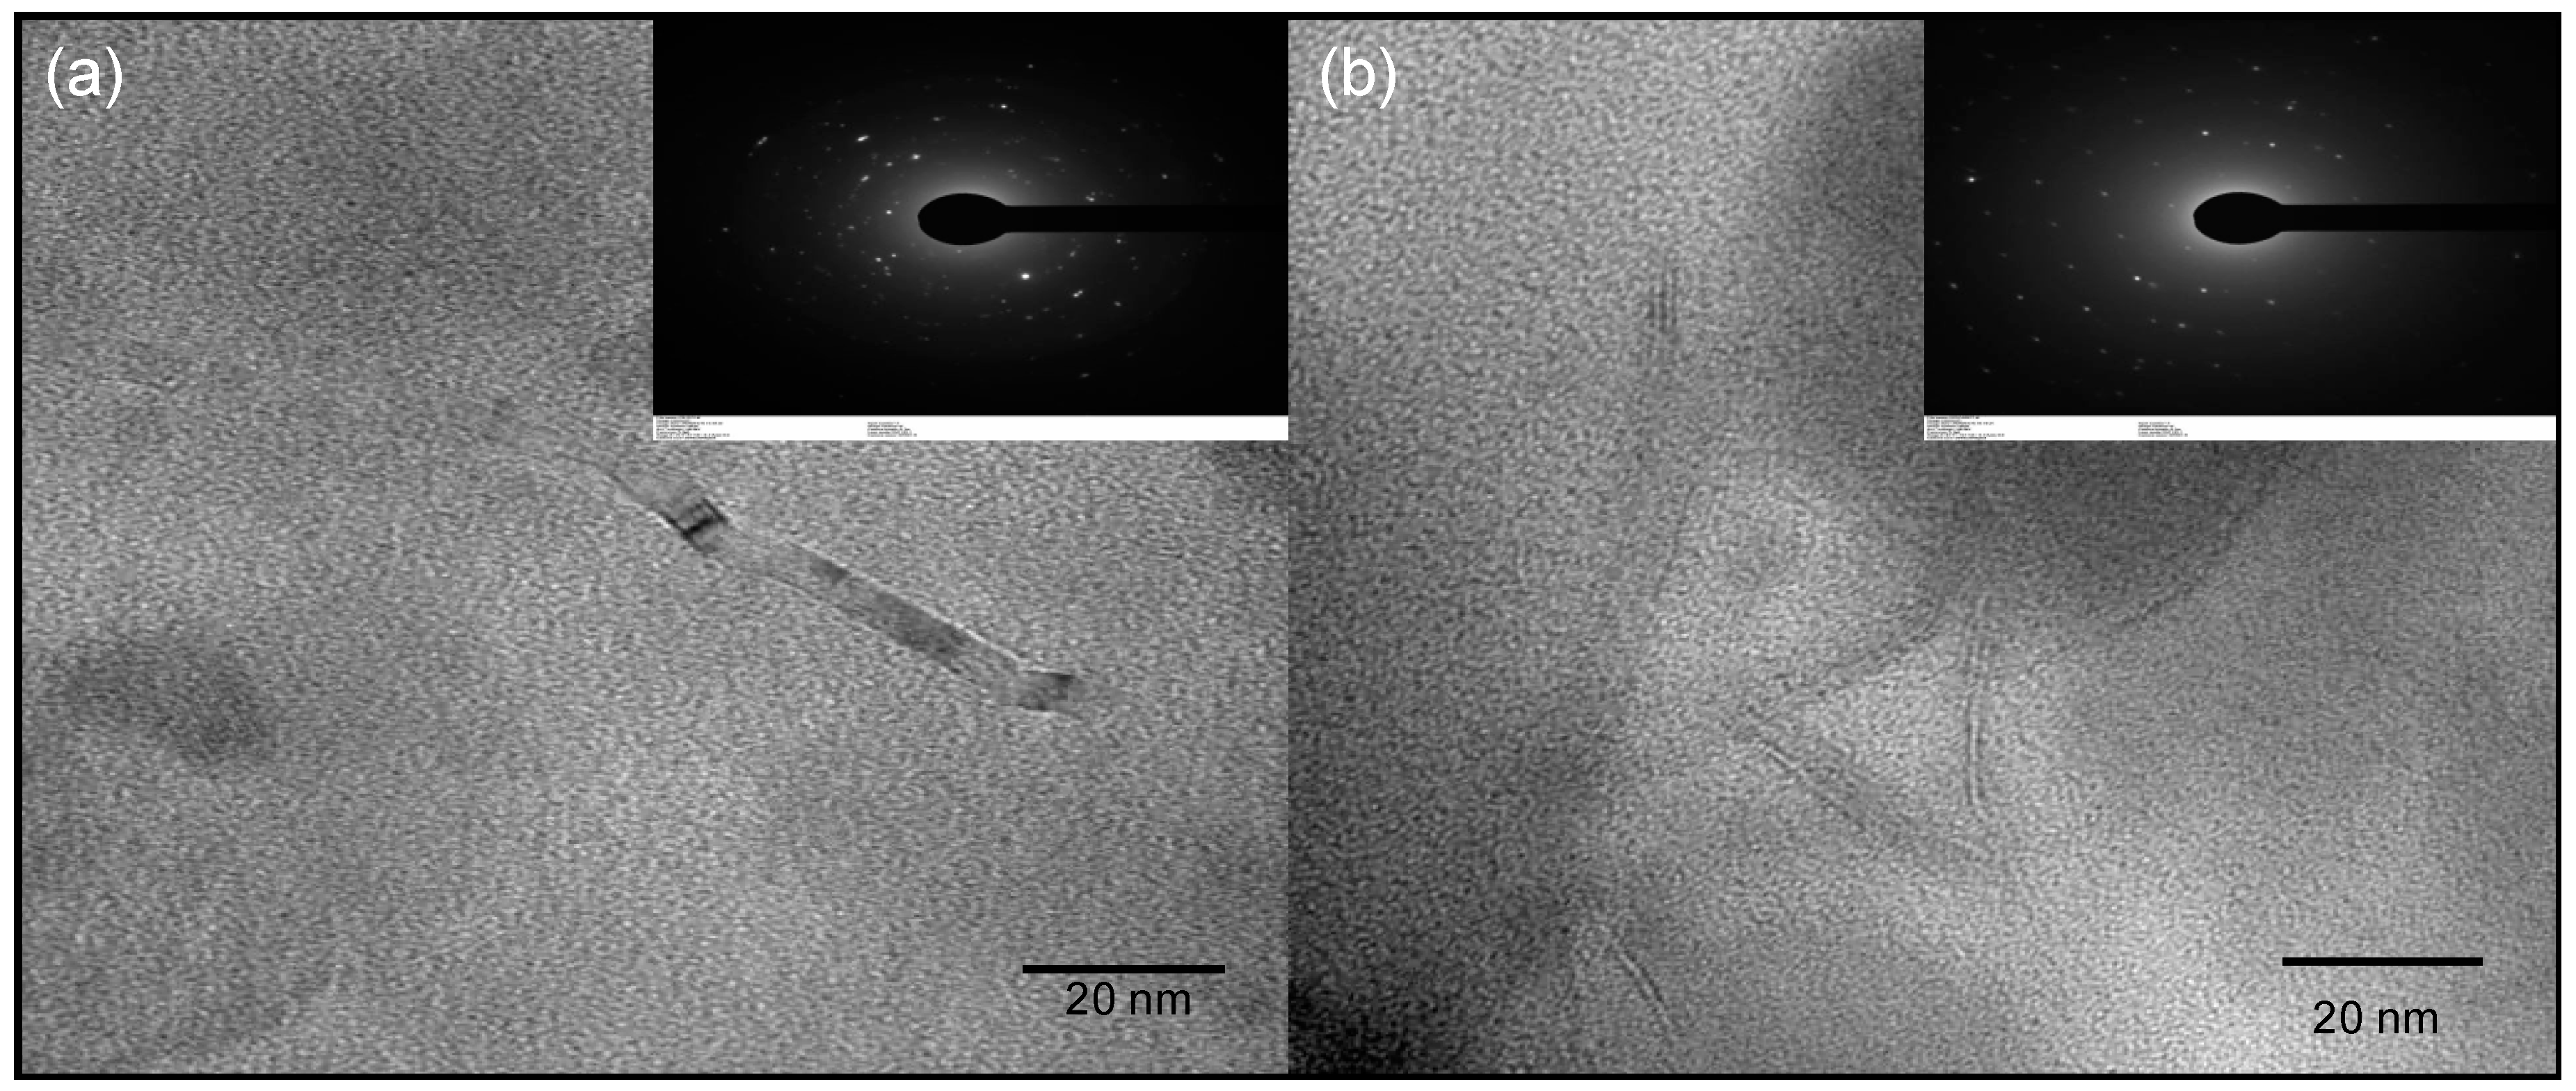
3.2. Carbon Dot Characterization
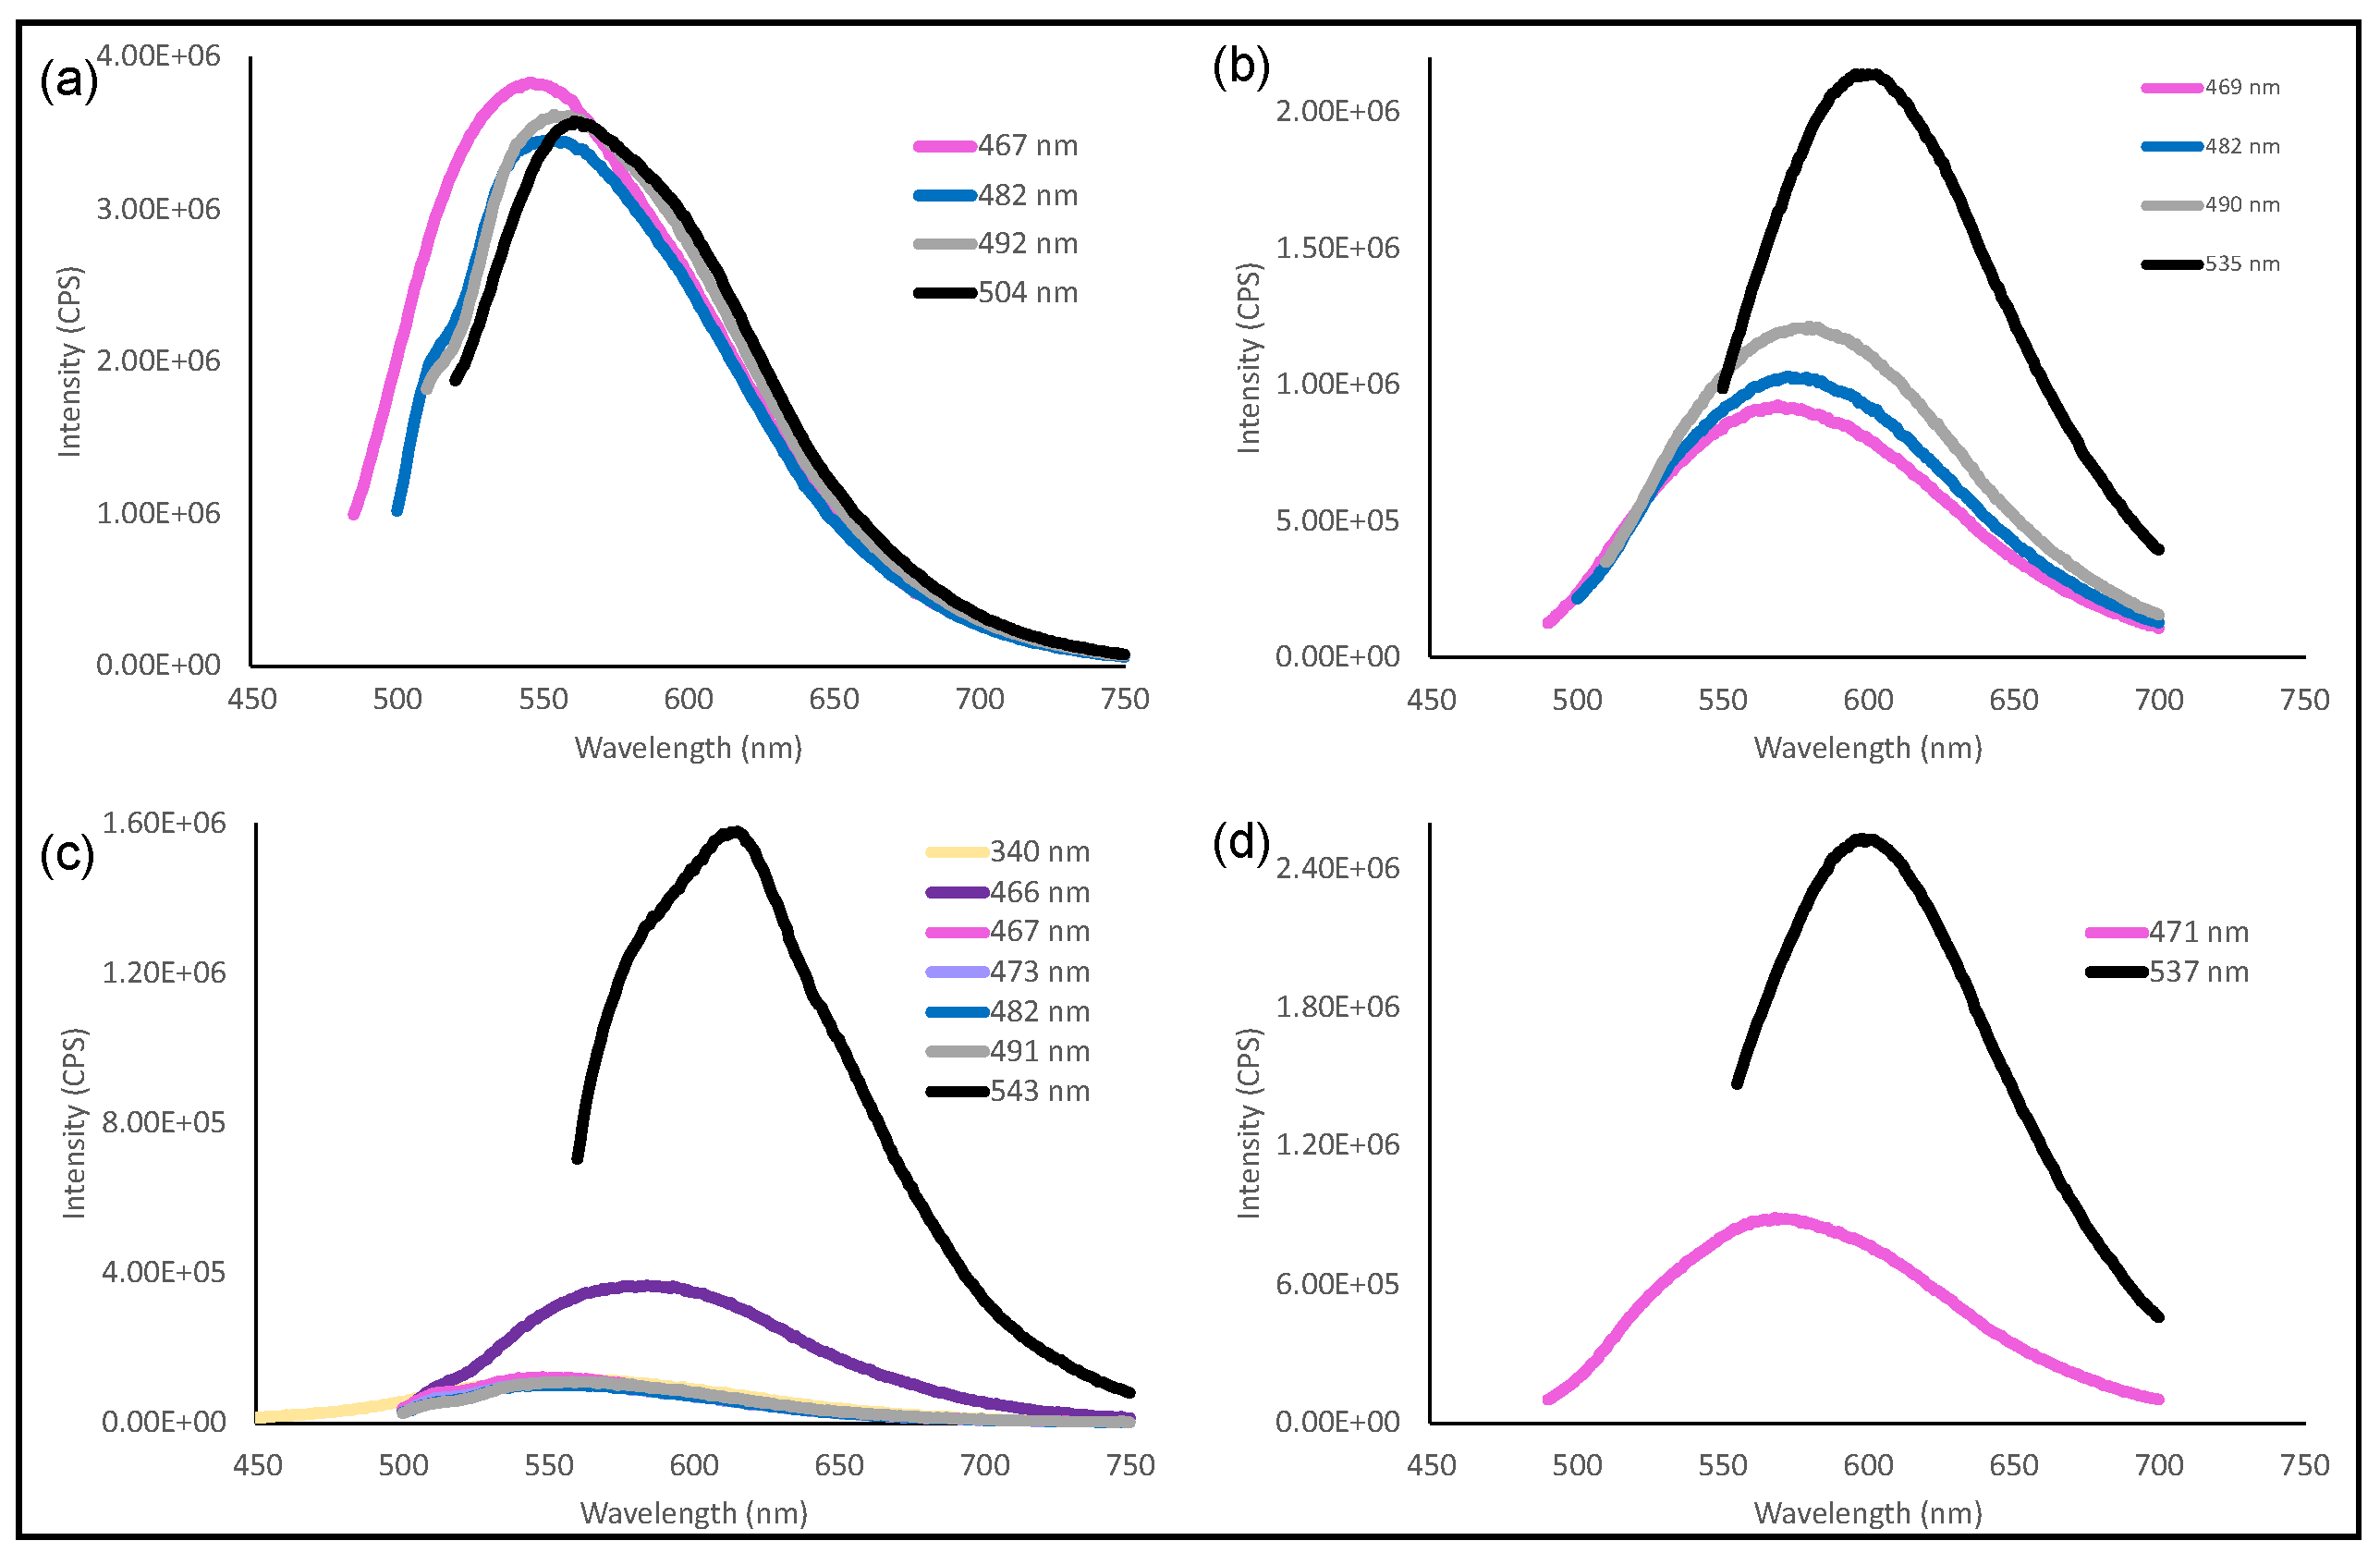
3.3. Photoluminescence (PL)
4. Conclusions
Author Contributions
Funding
Institutional Review Board Statement
Informed Consent Statement
Data Availability Statement
Conflicts of Interest
References
- Xu, X.; Ray, R.; Gu, Y.; Ploehn, H.J.; Gearheart, L.; Raker, K.; Scrivens, W.A. Electrophoretic analysis and purification of fluorescent single-walled carbon nanotube fragments. J. Am. Chem. Soc. 2004, 126, 12736–12737. [Google Scholar] [CrossRef]
- Wang, R.; Lu, K.Q.; Tang, Z.R.; Xu, Y.J. Recent progress in carbon quantum dots: Synthesis, properties and applications in photocatalysis. J. Mater. Chem. A 2017, 5, 3717–3734. [Google Scholar] [CrossRef]
- Yan, F.; Sun, Z.; Zhang, H.; Sun, X.; Jiang, Y.; Bai, Z. The fluorescence mechanism of carbon dots, and methods for tuning their emission color: A review. Microchim. Acta 2019, 186, 583. [Google Scholar] [CrossRef] [PubMed]
- Chatzimitakos, T.; Stalikas, C. Recent Advances in Carbon Dots. C 2019, 5, 41. [Google Scholar] [CrossRef] [Green Version]
- Wang, Y.; Hu, A. Carbon quantum dots: Synthesis, properties and applications. J. Mater. Chem. C Mater. Opt. Electron. Devices 2014, 2, 6921–6939. [Google Scholar] [CrossRef] [Green Version]
- Xu, M.; He, G.; Li, Z.; He, F.; Gao, F.; Su, Y.; Zhang, L.; Yang, Z.; Zhang, Y. A green heterogeneous synthesis of N-doped carbon dots and their photoluminescence applications in solid and aqueous states. Nanoscale 2014, 6, 10307–10315. [Google Scholar] [CrossRef]
- Atabaev, T.S. Doped carbon dots for sensing and bioimaging applications: A minireview. Nanomaterials 2018, 8, 342. [Google Scholar] [CrossRef] [PubMed] [Green Version]
- Brabazon, D.; Pellicer, E.; Zivic, F.; Sort, J.; Baró, M.D.; Grujovic, N.; Choy, K.L. Commercialization of Nanotechnologies—A Case Study Approach; Springer: Berlin/Heidelberg, Germany, 2017; pp. 1–315. [Google Scholar]
- Hoang, V.C.; Hassan, M.; Gomes, V.G. Coal derived carbon nanomaterials—Recent advances in synthesis and applications. Appl. Mater. Today 2018, 12, 342–358. [Google Scholar] [CrossRef]
- Deng, J.; You, Y.; Sahajwalla, V.; Joshi, R.K. Transforming waste into carbon-based nanomaterials. Carbon N. Y. 2016, 96, 105–115. [Google Scholar] [CrossRef]
- Gómez-Hernández, R.; Panecatl-Bernal, Y.; Méndez-Rojas, M.Á. High yield and simple one-step production of carbon black nanoparticles from waste tires. Heliyon 2019, 5, e02139. [Google Scholar] [CrossRef]
- Tang, L.; Ji, R.; Cao, X.; Lin, J.; Jiang, H.; Li, X.; Teng, K.S.; Luk, C.M.; Zeng, S.; Hao, J.; et al. Deep ultraviolet photoluminescence of water-soluble self-passivated graphene quantum dots. ACS Nano 2012, 6, 5102–5110. [Google Scholar] [CrossRef] [PubMed]
- Oztan, C.Y.; Hamawandi, B.; Zhou, Y.; Ballikaya, S.; Toprak, M.S.; Leblanc, R.M.; Coverstone, V.; Celik, E. Thermoelectric performance of Cu2Se doped with rapidly synthesized gel-like carbon dots. J. Alloys Compd. 2021, 864, 157916. [Google Scholar] [CrossRef]
- Sathiskumar, C.; Karthikeyan, S. Recycling of waste tires and its energy storage application of by-products—A review. Sustain. Mater. Technol. 2019, 22, e00125. [Google Scholar] [CrossRef]
- Alsaleh, A.; Sattler, M.L. Waste Tire Pyrolysis: Influential Parameters and Product Properties. Curr. Sustain. Energy Rep. 2014, 1, 129–135. [Google Scholar] [CrossRef] [Green Version]
- Hadi, P.; Yeung, K.Y.; Guo, J.; Wang, H.; McKay, G. Sustainable development of tyre char-based activated carbons with different textural properties for value-added applications. J. Environ. Manag. 2016, 170, 1–7. [Google Scholar] [CrossRef]
- Li, S.Q.; Yao, Q.; Wen, S.E.; Chi, Y.; Yan, J.H. Properties of pyrolytic chars and activated carbons derived from pilot-scale pyrolysis of used tires. J. Air Waste Manag. Assoc. 2005, 55, 1315–1326. [Google Scholar] [CrossRef] [Green Version]
- Martínez, J.D.; Cardona-Uribe, N.; Murillo, R.; García, T.; López, J.M. Carbon black recovery from waste tire pyrolysis by demineralization: Production and application in rubber compounding. Waste Manag. 2019, 85, 574–584. [Google Scholar] [CrossRef] [Green Version]
- Nieto-Márquez, A.; Atanes, E.; Morena, J.; Fernández-Martínez, F.; Valverde, J.L. Upgrading waste tires by chemical activation for the capture of SO2. Fuel Process. Technol. 2016, 144, 274–281. [Google Scholar] [CrossRef]
- Aranda, A.; Murillo, R.; García, T.; Callén, M.S.; Mastral, A.M. Steam activation of tyre pyrolytic carbon black: Kinetic study in a thermobalance. Chem. Eng. J. 2007, 126, 79–85. [Google Scholar] [CrossRef]
- Teng, H.; Lin, Y.C.; Hsu, L.Y. Production of activated carbons from pyrolysis of waste tires impregnated with potassium hydroxide. J. Air Waste Manag. Assoc. 2000, 50, 1940–1946. [Google Scholar] [CrossRef] [Green Version]
- Shilpa; Kumar, R.; Sharma, A. Morphologically tailored activated carbon derived from waste tires as high-performance anode for Li-ion battery. J. Appl. Electrochem. 2018, 48, 1–13. [Google Scholar] [CrossRef]
- Kumar, R.; Bhuvana, T.; Sharma, A. Tire Waste Derived Turbostratic Carbon as an Electrode for a Vanadium Redox Flow Battery. ACS Sustain. Chem. Eng. 2018, 6, 8238–8246. [Google Scholar] [CrossRef]
- Naskar, A.K.; Bi, Z.; Li, Y.; Akato, S.K.; Saha, D.; Chi, M.; Bridges, C.A.; Paranthaman, M.P. Tailored recovery of carbons from waste tires for enhanced performance as anodes in lithium-ion batteries. RSC Adv. 2014, 4, 38213. [Google Scholar] [CrossRef]
- Liu, M.L.; Chen, B.B.; Li, C.M.; Huang, C.Z. Carbon dots: Synthesis, formation mechanism, fluorescence origin and sensing applications. Green Chem. 2019, 21, 449–471. [Google Scholar] [CrossRef]
- Crista, D.M.A.; da Silva, J.C.G.E.; da Silva, L.P. Evaluation of different bottom-up routes for the fabrication of carbon dots. Nanomaterials 2020, 10, 1316. [Google Scholar] [CrossRef]
- Papaioannou, N.; Titirici, M.M.; Sapelkin, A. Investigating the Effect of Reaction Time on Carbon Dot Formation, Structure, and Optical Properties. ACS Omega 2019, 4, 21658–21665. [Google Scholar] [CrossRef] [PubMed] [Green Version]
- Mozdbar, A.; Nouralishahi, A.; Fatemi, S.; Mirakhori, G. The effect of precursor on the optical properties of carbon quantum dots synthesized by hydrothermal/solvothermal method. AIP Conf. Proc. 2018, 1920, 020029. [Google Scholar]
- Chen, C.Y.; Tsai, Y.H.; Chang, C.W. Evaluation of the dialysis time required for carbon dots by HPLC and the properties of carbon dots after HPLC fractionation. New J. Chem. 2019, 43, 6153–6159. [Google Scholar] [CrossRef]
- Essner, J.B.; Kist, J.A.; Polo-Parada, L.; Baker, G.A. Artifacts and Errors Associated with the Ubiquitous Presence of Fluorescent Impurities in Carbon Nanodots. Chem. Mater. 2018, 30, 1878–1887. [Google Scholar] [CrossRef]
- Hinterberger, V.; Damm, C.; Haines, P.; Guldi, D.M.; Peukert, W. Purification and structural elucidation of carbon dots by column chromatography. Nanoscale 2019, 11, 8464–8474. [Google Scholar] [CrossRef]
- Zobir, S.A.M.; Rashid, S.A.; Tan, T. Recent Development on the Synthesis Techniques and Properties of Graphene Derivatives; Elsevier Inc.: Cambridge, UK, 2018. [Google Scholar]
- González-González, R.; González, L.T.; Iglesias-González, S.; González-González, E.; Martinez-Chapa, S.O.; Madou, M.; Alvarez, M.; Mendoza, A. Characterization of Chemically Activated Pyrolytic Carbon Black Derived from Waste Tires as a Candidate for Nanomaterial Precursor. Nanomaterials 2020, 10, 2213. [Google Scholar] [CrossRef]
- Dong, Y.; Zhou, N.; Lin, X.; Lin, J.; Chi, Y.; Chen, G. Extraction of electrochemiluminescent oxidized carbon quantum dots from activated carbon. Chem. Mater. 2010, 22, 5895–5899. [Google Scholar] [CrossRef]
- Khan, W.U.; Wang, D.; Zhang, W.; Tang, Z.; Ma, X.; Ding, X.; Du, S.; Wang, Y. High quantum yield green-emitting carbon dots for Fe(III) detection, biocompatible fluorescent ink and cellular imaging. Sci. Rep. 2017, 7, 14866. [Google Scholar] [CrossRef] [PubMed] [Green Version]
- Qu, S.; Wang, X.; Lu, Q.; Liu, X.; Wang, L. A Biocompatible Fluorescent Ink Based on Water-Soluble Luminescent Carbon Nanodots. Angew. Chem. 2012, 124, 12381–12384. [Google Scholar] [CrossRef]
- Yang, W.; Zhang, H.; Lai, J.; Peng, X.; Hu, Y.; Gu, W.; Ye, L. Carbon dots with red-shifted photoluminescence by fluorine doping for optical bio-imaging. Carbon N. Y. 2018, 128, 78–85. [Google Scholar] [CrossRef]
- Lin, S.; Lin, C.; He, M.; Yuan, R.; Zhang, Y.; Zhou, Y.; Xiang, W.; Liang, X. Solvatochromism of bright carbon dots with tunable long-wavelength emission from green to red and their application as solid-state materials for warm WLEDs. RSC Adv. 2017, 7, 41552–41560. [Google Scholar] [CrossRef] [Green Version]
- Nie, H.; Li, M.; Li, Q.; Liang, S.; Tan, Y.; Sheng, L.; Shi, W.; Zhang, S.X.A. Carbon dots with continuously tunable full-color emission and their application in ratiometric pH sensing. Chem. Mater. 2014, 26, 3104–3112. [Google Scholar] [CrossRef]
- Kim, K.; Chokradjaroen, C.; Saito, N. Solution plasma: New synthesis method of N-doped carbon dots as ultra-sensitive fluorescence detector for 2,4,6-trinitrophenol. Nano Express 2020, 1, 020043. [Google Scholar] [CrossRef]
- Baweja, H.; Jeet, K. Economical and green synthesis of graphene and carbon quantum dots from agricultural waste. Mater. Res. Express 2019, 6, 0850g8. [Google Scholar] [CrossRef]
- Guo, L.; Zhang, Y.; Ruo-Xi, Z. A Simple and Practical Synthetic Method of Carbon Quantum Dots. Asian J. Chem. 2014, 26, 70–73. [Google Scholar] [CrossRef]
- Gupta, A.; Verma, N.C.; Khan, S.; Nandi, C.K. Carbon dots for naked eye colorimetric ultrasensitive arsenic and glutathione detection. Biosens. Bioelectron. 2016, 81, 465–472. [Google Scholar] [CrossRef] [PubMed]
- Qiang, R.; Yang, S.; Hou, K.; Wang, J. Synthesis of carbon quantum dots with green luminescence from potato starch. New J. Chem. 2019, 43, 10826–10833. [Google Scholar] [CrossRef]
- Xu, H.; Yang, X.; Li, G.; Zhao, C.; Liao, X. Green Synthesis of Fluorescent Carbon Dots for Selective Detection of Tartrazine in Food Samples. J. Agric. Food Chem. 2015, 63, 6707–6714. [Google Scholar] [CrossRef]
- Xu, Q.; Pu, P.; Zhao, J.; Dong, C.; Gao, C.; Chen, Y.; Chen, J.; Liu, Y.; Zhou, H. Preparation of highly photoluminescent sulfur-doped carbon dots for Fe(iii) detection. J. Mater. Chem. A 2015, 3, 542–546. [Google Scholar] [CrossRef]
- Zhong, Q.; Chen, Y.; Su, A.; Wang, Y. Synthesis of catalytically active carbon quantum dots and its application for colorimetric detection of glutathione. Sens. Actuators B Chem. 2018, 273, 1098–1102. [Google Scholar] [CrossRef]
- Pooja, D.; Saini, S.; Thakur, A.; Kumar, B.; Tyagi, S.; Nayak, M.K. A “Turn-On” thiol functionalized fluorescent carbon quantum dot based chemosensory system for arsenite detection. J. Hazard. Mater. 2017, 328, 117–126. [Google Scholar]
- Zhang, C.; Song, W.; Sun, G.; Xie, L.; Wang, J.; Li, K.; Sun, C.; Liu, H.; Snape, C.E.; Drage, T. CO2 capture with activated carbon grafted by nitrogenous functional groups. Energy Fuels 2013, 27, 4818–4823. [Google Scholar] [CrossRef]
- Datsyuk, V.; Kalyva, M.; Papagelis, K.; Parthenios, J.; Tasis, D.; Siokou, A.; Kallitsis, I.; Galiotis, C. Chemical oxidation of multiwalled carbon nanotubes. Carbon N. Y. 2008, 46, 833–840. [Google Scholar] [CrossRef]
- El-Hendawy, A.N.A. Influence of HNO3 oxidation on the structure and adsorptive properties of corncob-based activated carbon. Carbon N. Y. 2003, 41, 713–722. [Google Scholar] [CrossRef]
- Moreno-Castilla, C.; López-Ramón, M.V.; Carrasco-Marín, F. Changes in surface chemistry of activated carbons by wet oxidation. Carbon N. Y. 2000, 38, 1995–2001. [Google Scholar] [CrossRef]
- Chingombe, P.; Saha, B.; Wakeman, R.J. Surface modification and characterisation of a coal-based activated carbon. Carbon N. Y. 2005, 43, 3132–3143. [Google Scholar] [CrossRef]
- Salame, I.I.; Bandosz, T.J. Surface chemistry of activated carbons: Combining the results of temperature-programmed desorption, Boehm, and potentiometric titrations. J. Colloid Interface Sci. 2001, 240, 252–258. [Google Scholar] [CrossRef]
- Houshmand, A.; Daud, W.M.A.W.; Shafeeyan, M.S. Exploring potential methods for anchoring amine groups on the surface of activated carbon for CO2 adsorption. Sep. Sci. Technol. 2011, 46, 1098–1112. [Google Scholar] [CrossRef]
- Krishnamoorthy, K.; Veerapandian, M.; Yun, K.; Kim, S.J. The chemical and structural analysis of graphene oxide with different degrees of oxidation. Carbon. N. Y. 2013, 53, 38–49. [Google Scholar] [CrossRef]
- Bokobza, L.; Bruneel, J.-L.; Couzi, M. Raman Spectra of Carbon-Based Materials (from Graphite to Carbon Black) and of Some Silicone Composites. C—J. Carbon Res. 2015, 1, 77–94. [Google Scholar] [CrossRef] [Green Version]
- Wu, J.; Wang, P.; Wang, F.; Fang, Y. Investigation of the microstructures of graphene quantum dots (GQDs) by surface-enhanced Raman spectroscopy. Nanomaterials 2018, 8, 864. [Google Scholar] [CrossRef] [PubMed] [Green Version]
- Bayati, M.; Dai, J.; Zambrana, A.; Rees, C.; Fidalgo de Cortalezzi, M. Effect of water chemistry on the aggregation and photoluminescence behavior of carbon dots. J. Environ. Sci. 2018, 65, 223–235. [Google Scholar] [CrossRef]
- Radhakrishnan, K.; Panneerselvam, P.; Marieeswaran, M. A green synthetic route for the surface-passivation of carbon dots as an effective multifunctional fluorescent sensor for the recognition and detection of toxic metal ions from aqueous solution. Anal. Methods 2019, 11, 490–506. [Google Scholar] [CrossRef]
- Radhakrishnan, K.; Sivanesan, S.; Panneerselvam, P. Turn-On fluorescence sensor based detection of heavy metal ion using carbon dots@graphitic-carbon nitride nanocomposite probe. J. Photochem. Photobiol. A Chem. 2020, 389, 112204. [Google Scholar] [CrossRef]
- Pudza, M.Y.; Abidin, Z.Z.; Rashid, S.A.; Yasin, F.M.; Noor, A.S.M.; Issa, M.A. Eco-friendly sustainable fluorescent carbon dots for the adsorption of heavy metal ions in aqueous environment. Nanomaterials 2020, 10, 315. [Google Scholar] [CrossRef] [Green Version]
- Chen, G.; Wu, S.; Hui, L.; Zhao, Y.; Ye, J.; Tan, Z.; Zeng, W.; Tao, Z.; Yang, L.; Zhu, Y. Assembling carbon quantum dots to a layered carbon for high-density supercapacitor electrodes. Sci. Rep. 2016, 6, 19028. [Google Scholar] [CrossRef]
- Varisco, M.; Zufferey, D.; Ruggi, A.; Zhang, Y.; Erni, R.; Mamula, O. Synthesis of hydrophilic and hydrophobic carbon quantum dots from waste of wine fermentation. R. Soc. Open Sci. 2017, 4, 170900. [Google Scholar] [CrossRef] [PubMed] [Green Version]
- Hagiwara, K.; Uchida, H.; Suzuki, Y.; Hayashita, T.; Torigoe, K.; Kida, T.; Horikoshi, S. Role of alkan-1-ol solvents in the synthesis of yellow luminescent carbon quantum dots (CQDs): Van der Waals force-caused aggregation and agglomeration. RSC Adv. 2020, 10, 14396–14402. [Google Scholar] [CrossRef]
- Pimenta, M.A.; Dresselhaus, G.; Dresselhaus, M.S.; Cançado, L.G.; Jorio, A.; Saito, R. Studying disorder in graphite-based systems by Raman spectroscopy. Phys. Chem. Chem. Phys. 2007, 9, 1276–1291. [Google Scholar] [CrossRef]
- Banna Motejadded Emrooz, H.; Maleki, M.; Shokouhimehr, M. Excellent adsorption of orange acid II on a water fern–derived micro- and mesoporous carbon. J. Taiwan Inst. Chem. Eng. 2019, 102, 99–109. [Google Scholar] [CrossRef]
- Li, J.L.; Kudin, K.N.; McAllister, M.J.; Prud’homme, R.K.; Aksay, I.A.; Car, R. Oxygen-driven unzipping of graphitic materials. Phys. Rev. Lett. 2006, 96, 5–8. [Google Scholar] [CrossRef] [Green Version]
- Wang, G.; Wang, B.; Park, J.; Yang, J.; Shen, X.; Yao, J. Synthesis of enhanced hydrophilic and hydrophobic graphene oxide nanosheets by a solvothermal method. Carbon N. Y. 2009, 47, 68–72. [Google Scholar] [CrossRef]
- Parra, J.; Silva, K.; Valezin, P.; Martins, R.; Gomes, R.; Pereira, R.; de Melo, F.; Morandim-Giannetti, A.; dos Santos, R.; Panzarini, L.C.; et al. Preparation of Fluorescent Carbon-Based Dots from Waste Tire Pyrolysis. J. Braz. Chem. Soc. 2020, 31, 2224–2231. [Google Scholar] [CrossRef]
- Barman, M.K.; Patra, A. Current status and prospects on chemical structure driven photoluminescence behaviour of carbon dots. J. Photochem. Photobiol. C Photochem. Rev. 2018, 37, 1–22. [Google Scholar] [CrossRef]
- Zheng, H.; Wang, Q.; Long, Y.; Zhang, H.; Huang, X.; Zhu, R. Enhancing the luminescence of carbon dots with a reduction pathway. Chem. Commun. 2011, 47, 10650–10652. [Google Scholar] [CrossRef] [PubMed]
- Noor-UI-Ain; Eriksson, M.O.; Schmidt, S.; Asghar, M.; Lin, P.C.; Holtz, P.O.; Syväjärvi, M.; Reza Yazdi, G. Tuning the emission energy of chemically doped graphene quantum dots. Nanomaterials 2016, 6, 198. [Google Scholar] [CrossRef] [Green Version]
- Jin, S.H.; Kim, D.H.; Jun, G.H.; Hong, S.H.; Jeon, S. Tuning the photoluminescence of graphene quantum dots through the charge transfer effect of functional groups. ACS Nano 2013, 7, 1239–1245. [Google Scholar] [CrossRef]
- Zhao, M. Direct Synthesis of Graphene Quantum Dots with Different Fluorescence Properties by Oxidation of Graphene Oxide Using Nitric Acid. Appl. Sci. 2018, 8, 1303. [Google Scholar] [CrossRef] [Green Version]
- Bao, L.; Liu, C.; Zhang, Z.L.; Pang, D.W. Photoluminescence-tunable carbon nanodots: Surface-state energy-gap tuning. Adv. Mater. 2015, 27, 1663–1667. [Google Scholar] [CrossRef] [PubMed]
- Ye, R.; Peng, Z.; Metzger, A.; Lin, J.; Mann, J.A.; Huang, K.; Xiang, C.; Fan, X.; Samuel, E.L.G.; Alemany, L.B.; et al. Bandgap engineering of coal-derived graphene quantum dots. ACS Appl. Mater. Interfaces 2015, 7, 7041–7048. [Google Scholar] [CrossRef]
- Yeh, T.F.; Huang, W.L.; Chung, C.J.; Chiang, I.T.; Chen, L.C.; Chang, H.Y.; Su, W.C.; Cheng, C.; Chen, S.J.; Teng, H. Elucidating Quantum Confinement in Graphene Oxide Dots Based on Excitation-Wavelength-Independent Photoluminescence. J. Phys. Chem. Lett. 2016, 7, 2087–2092. [Google Scholar] [CrossRef]
- Ding, H.; Yu, S.B.; Wei, J.S.; Xiong, H.M. Full-color light-emitting carbon dots with a surface-state-controlled luminescence mechanism. ACS Nano 2016, 10, 484–491. [Google Scholar] [CrossRef] [PubMed]
- Bao, L.; Zhang, Z.L.; Tian, Z.Q.; Zhang, L.; Liu, C.; Lin, Y.; Qi, B.; Pang, D.W. Electrochemical tuning of luminescent carbon nanodots: From preparation to luminescence mechanism. Adv. Mater. 2011, 23, 5801–5806. [Google Scholar] [CrossRef]
- Li, L.; Dong, T. Photoluminescence tuning in carbon dots: Surface passivation or/and functionalization, heteroatom doping. J. Mater. Chem. C 2018, 6, 7944–7970. [Google Scholar] [CrossRef]
- Moreno-Castilla, C.; Carrasco-Marín, F.; Mueden, A. The creation of acid carbon surfaces by treatment with (NH4)2S2O8. Carbon N. Y. 1997, 35, 1619–1626. [Google Scholar] [CrossRef]
- Álvarez-Merino, M.A.; López-Ramón, V.; Moreno-Castilla, C. A study of the static and dynamic adsorption of Zn(II) ions on carbon materials from aqueous solutions. J. Colloid Interface Sci. 2005, 288, 335–341. [Google Scholar] [CrossRef]
- Wu, M.; Zhan, J.; Geng, B.; He, P.; Wu, K.; Wang, L.; Xu, G.; Li, Z.; Yin, L.; Pan, D. Scalable synthesis of organic-soluble carbon quantum dots: Superior optical properties in solvents, solids, and LEDs. Nanoscale 2017, 9, 13195–13202. [Google Scholar] [CrossRef]
- Choi, J.; Kim, N.; Oh, J.W.; Kim, F.S. Bandgap engineering of nanosized carbon dots through electron-accepting functionalization. J. Ind. Eng. Chem. 2018, 65, 104–111. [Google Scholar] [CrossRef]
- Wen, Z.H.; Yin, X.B. Excitation-independent carbon dots, from photoluminescence mechanism to single-color application. RSC Adv. 2016, 6, 27829–27835. [Google Scholar] [CrossRef]
- Zhao, Y.; Liu, X.; Yang, Y.; Kang, L.; Yang, Z.; Liu, W.; Chen, L. Carbon Dots: From Intense Absorption in Visible Range to Excitation-Independent and Excitation-Dependent Photoluminescence. Fuller. Nanotub. Carbon Nanostr. 2015, 23, 922–929. [Google Scholar] [CrossRef]
- Dong, Y.; Pang, H.; Ren, S.; Chen, C.; Chi, Y.; Yu, T. Etching single-wall carbon nanotubes into green and yellow single-layer graphene quantum dots. Carbon N. Y. 2013, 64, 245–251. [Google Scholar] [CrossRef]
- Hu, S.; Trinchi, A.; Atkin, P.; Cole, I. Tunable photoluminescence across the entire visible spectrum from carbon dots excited by white light. Angew. Chem.-Int. Ed. 2015, 54, 2970–2974. [Google Scholar] [CrossRef]
- Demchenko, A. Excitons in Carbonic Nanostructures. C 2019, 5, 71. [Google Scholar] [CrossRef] [Green Version]
- Mishra, K.; Koley, S.; Ghosh, S. Ground-State Heterogeneity along with Fluorescent Byproducts Causes Excitation-Dependent Fluorescence and Time-Dependent Spectral Migration in Citric Acid-Derived Carbon Dots. J. Phys. Chem. Lett. 2019, 10, 335–345. [Google Scholar] [CrossRef]
- Xu, Y.; Wu, M.; Feng, X.Z.; Yin, X.B.; He, X.W.; Zhang, Y.K. Reduced carbon dots versus oxidized carbon dots: Photo- and electrochemiluminescence investigations for selected applications. Chem.-A Eur. J. 2013, 19, 6282–6288. [Google Scholar] [CrossRef]
- Tang, J.; Zhang, J.; Zhang, Y.; Xiao, Y.; Shi, Y.; Chen, Y.; Ding, L.; Xu, W. Influence of Group Modification at the Edges of Carbon Quantum Dots on Fluorescent Emission. Nanoscale Res. Lett. 2019, 14, 241. [Google Scholar] [CrossRef] [PubMed] [Green Version]
- Han, S.; Chang, T.; Zhao, H.; Du, H.; Liu, S.; Wu, B.; Qin, S. Cultivating fluorescent flowers with highly luminescent carbon dots fabricated by a double passivation method. Nanomaterials 2017, 7, 176. [Google Scholar] [CrossRef] [PubMed] [Green Version]


| Carbon Black | H2SO4-Activated Carbon Black | KOH-Activated Carbon Black | H2SO4 + KOH-Activated Carbon Black | |
|---|---|---|---|---|
| Nitrogen (%) | 0.90 | 0.86 | 0.97 | 1.02 |
| Carbon (%) | 79.46 | 86.90 | 70.38 | 60.75 |
| Hydrogen (%) | 0.30 | 0.41 | 0.44 | 0.75 |
| Sulfur (%) | 3.09 | 1.36 | 3.04 | 4.45 |
| Oxygen (%) | 0.70 | 0.97 | 8.79 | 16.06 |
| Surface area (m2/g) | 57 | 302 | 197 | 82 |
| ID/IG | 0.96 | 1.01 | 0.94 | 0.93 |
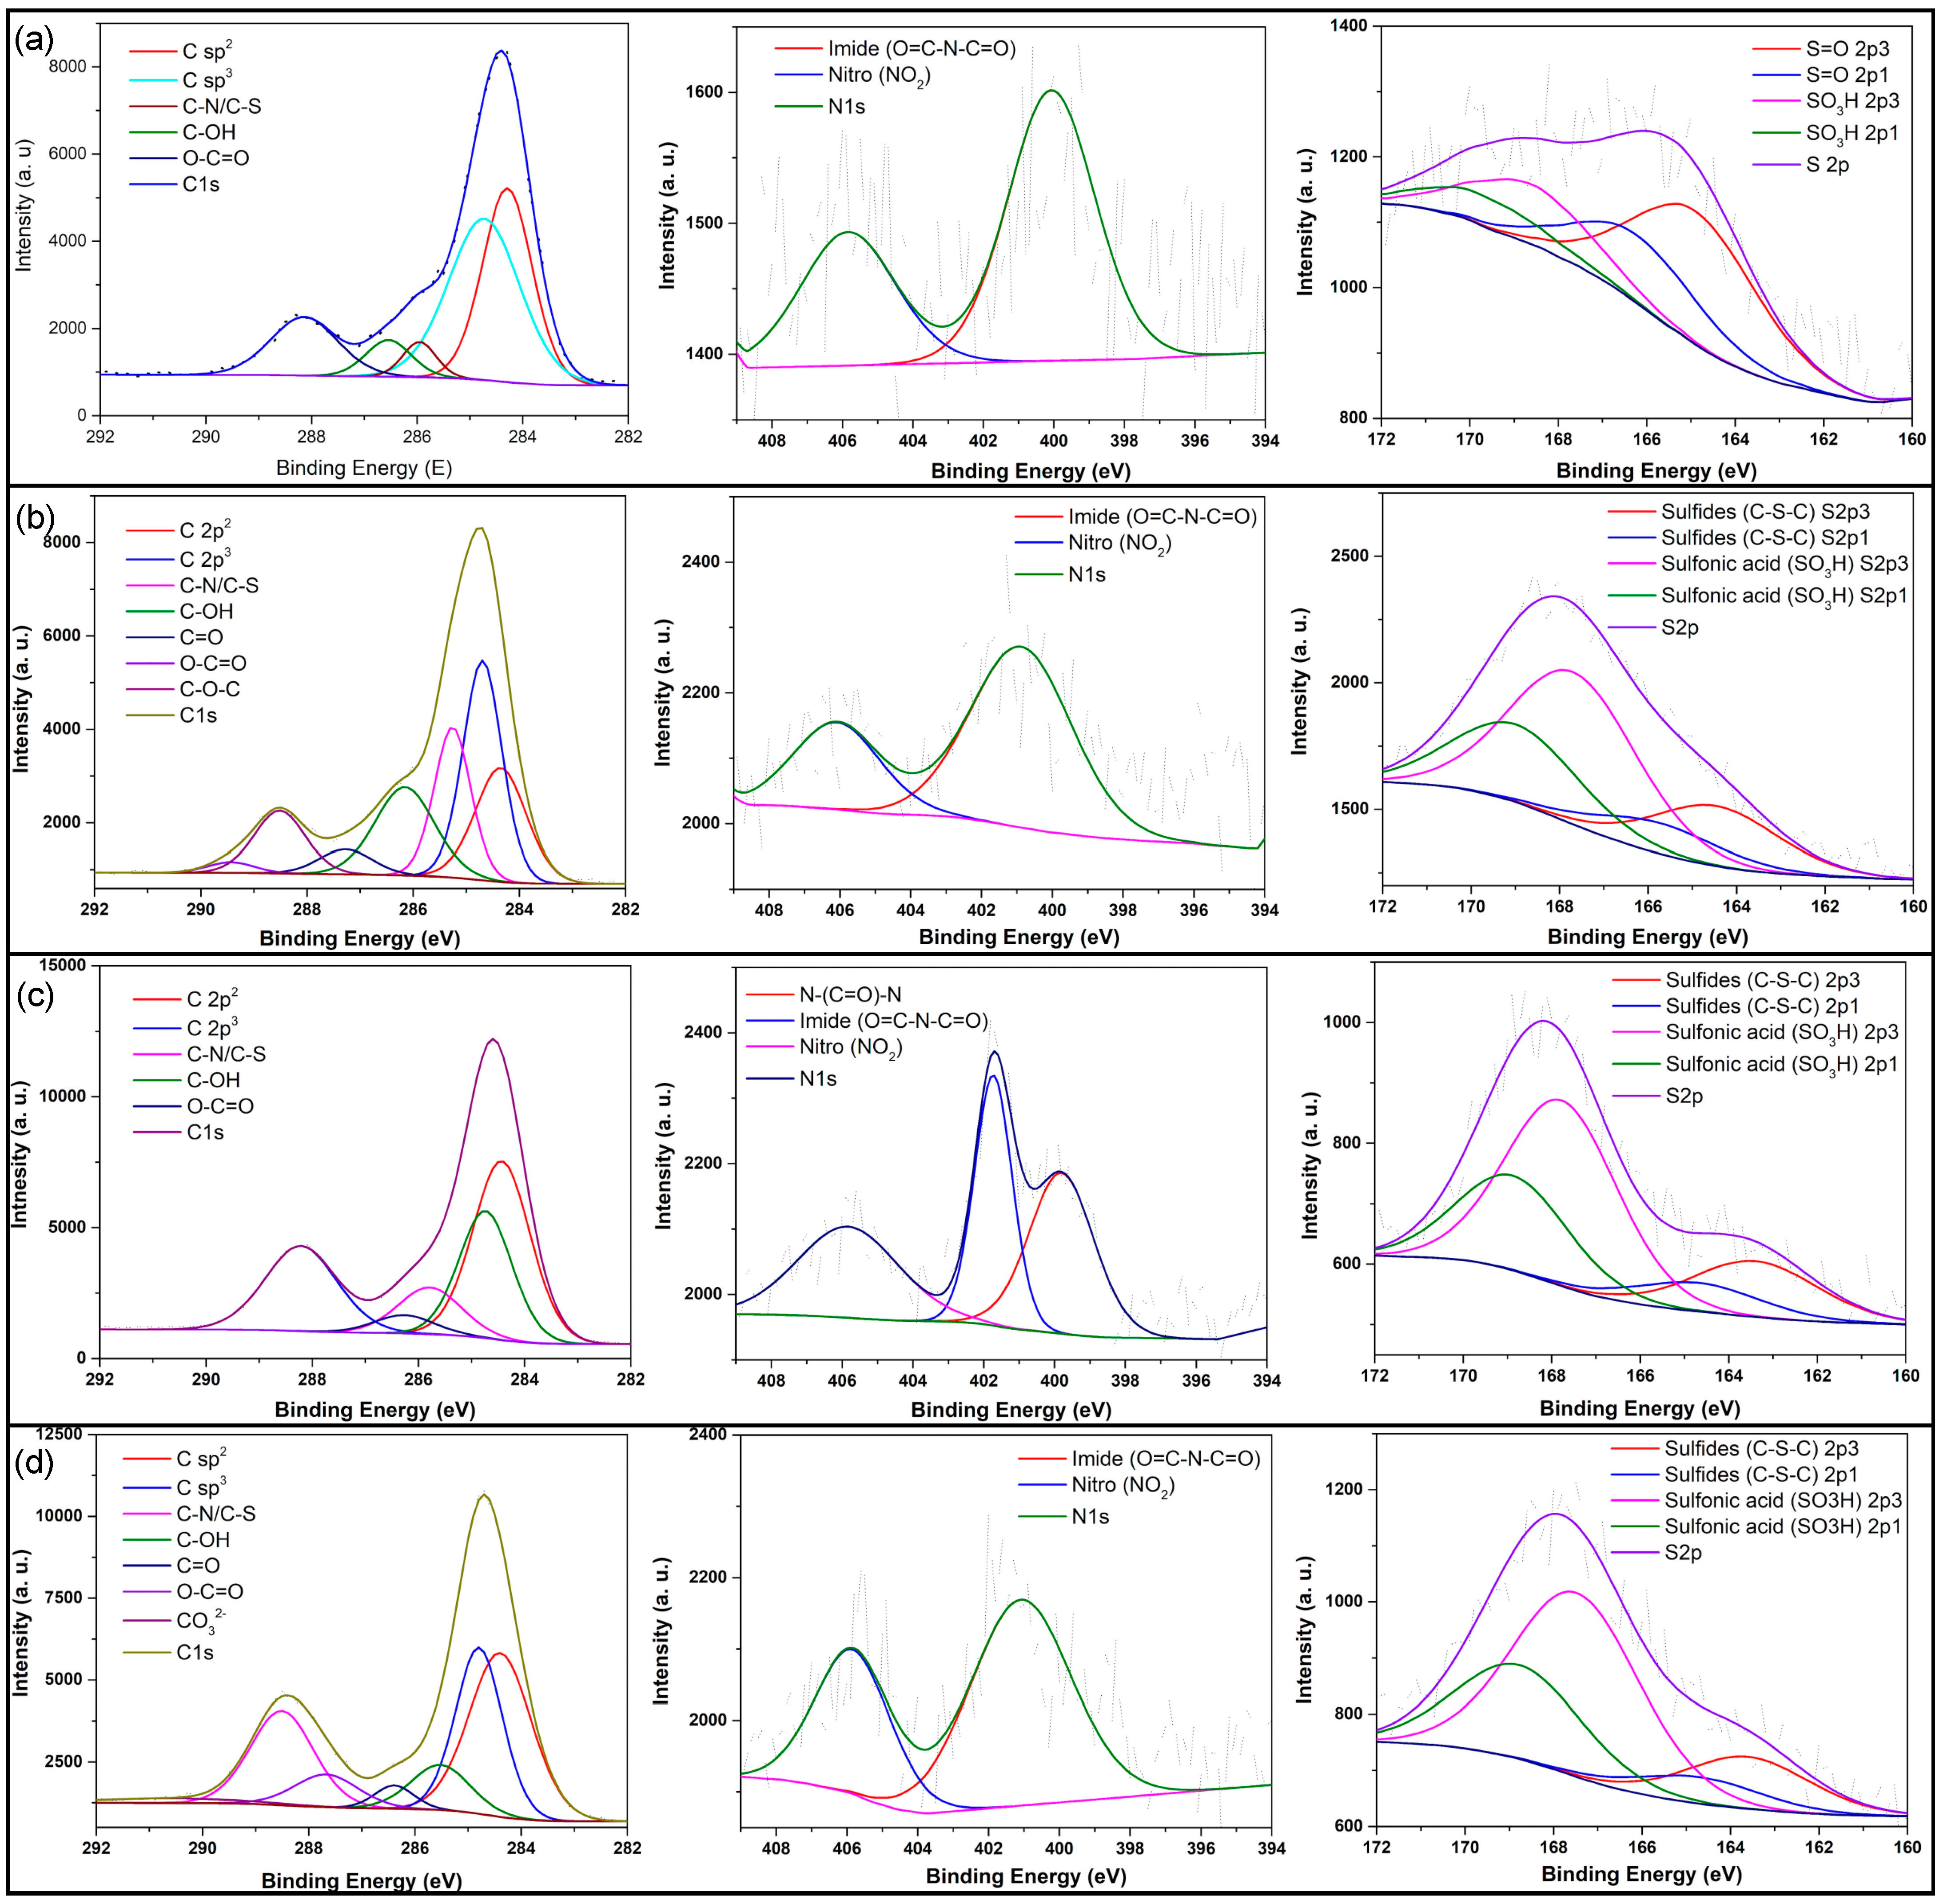
| Components | Atomic % | |||
|---|---|---|---|---|
| Cd.CB | Cd.H2SO4 | Cd.KOH | Cd.H2SO4 + KOH | |
| C 1s | 39.31 | 52.23 | 56.38 | 58.45 |
| C sp2 | 34.47 | 35.47 | 37.69 | 33.56 |
| C sp3 | 41.18 | 33.05 | 24.81 | 25.66 |
| C−N/C−S | 4.25 | 5.26 | 10.9 | 8.82 |
| Hydroxyl (C−OH) | 5.99 | 4.70 | 4.04 | 3.01 |
| Carboxyl (O−C=O) | 14.22 | 10.79 | 22.56 | 19.67 |
| Carbonyl (C=O) | - | 9.82 | - | 6.89 |
| Ether (C−O−C) | - | 0.92 | - | - |
| Carbonate (CO32–) | - | - | - | 2.39 |
| N1s | 0.82 | 1.78 | 1.8 | 2.28 |
| Imide (O=C−N−C=O) | 65.04 | 70.7 | 21.54 | 65.51 |
| Nitro (NO2) | 34.96 | 29.3 | 31.58 | 34.49 |
| N−(C=O)−N | - | - | 35.88 | - |
| S2p | 0.8 | 4.78 | 1.73 | 1.69 |
| Sulfoxides (S=O) | 69.02 | 28.18 | - | - |
| Sulfonic acid (SO3H) | 30.98 | 71.82 | 74.64 | 77.97 |
| Sulfides (C−S−C) | - | - | 25.36 | 22.03 |
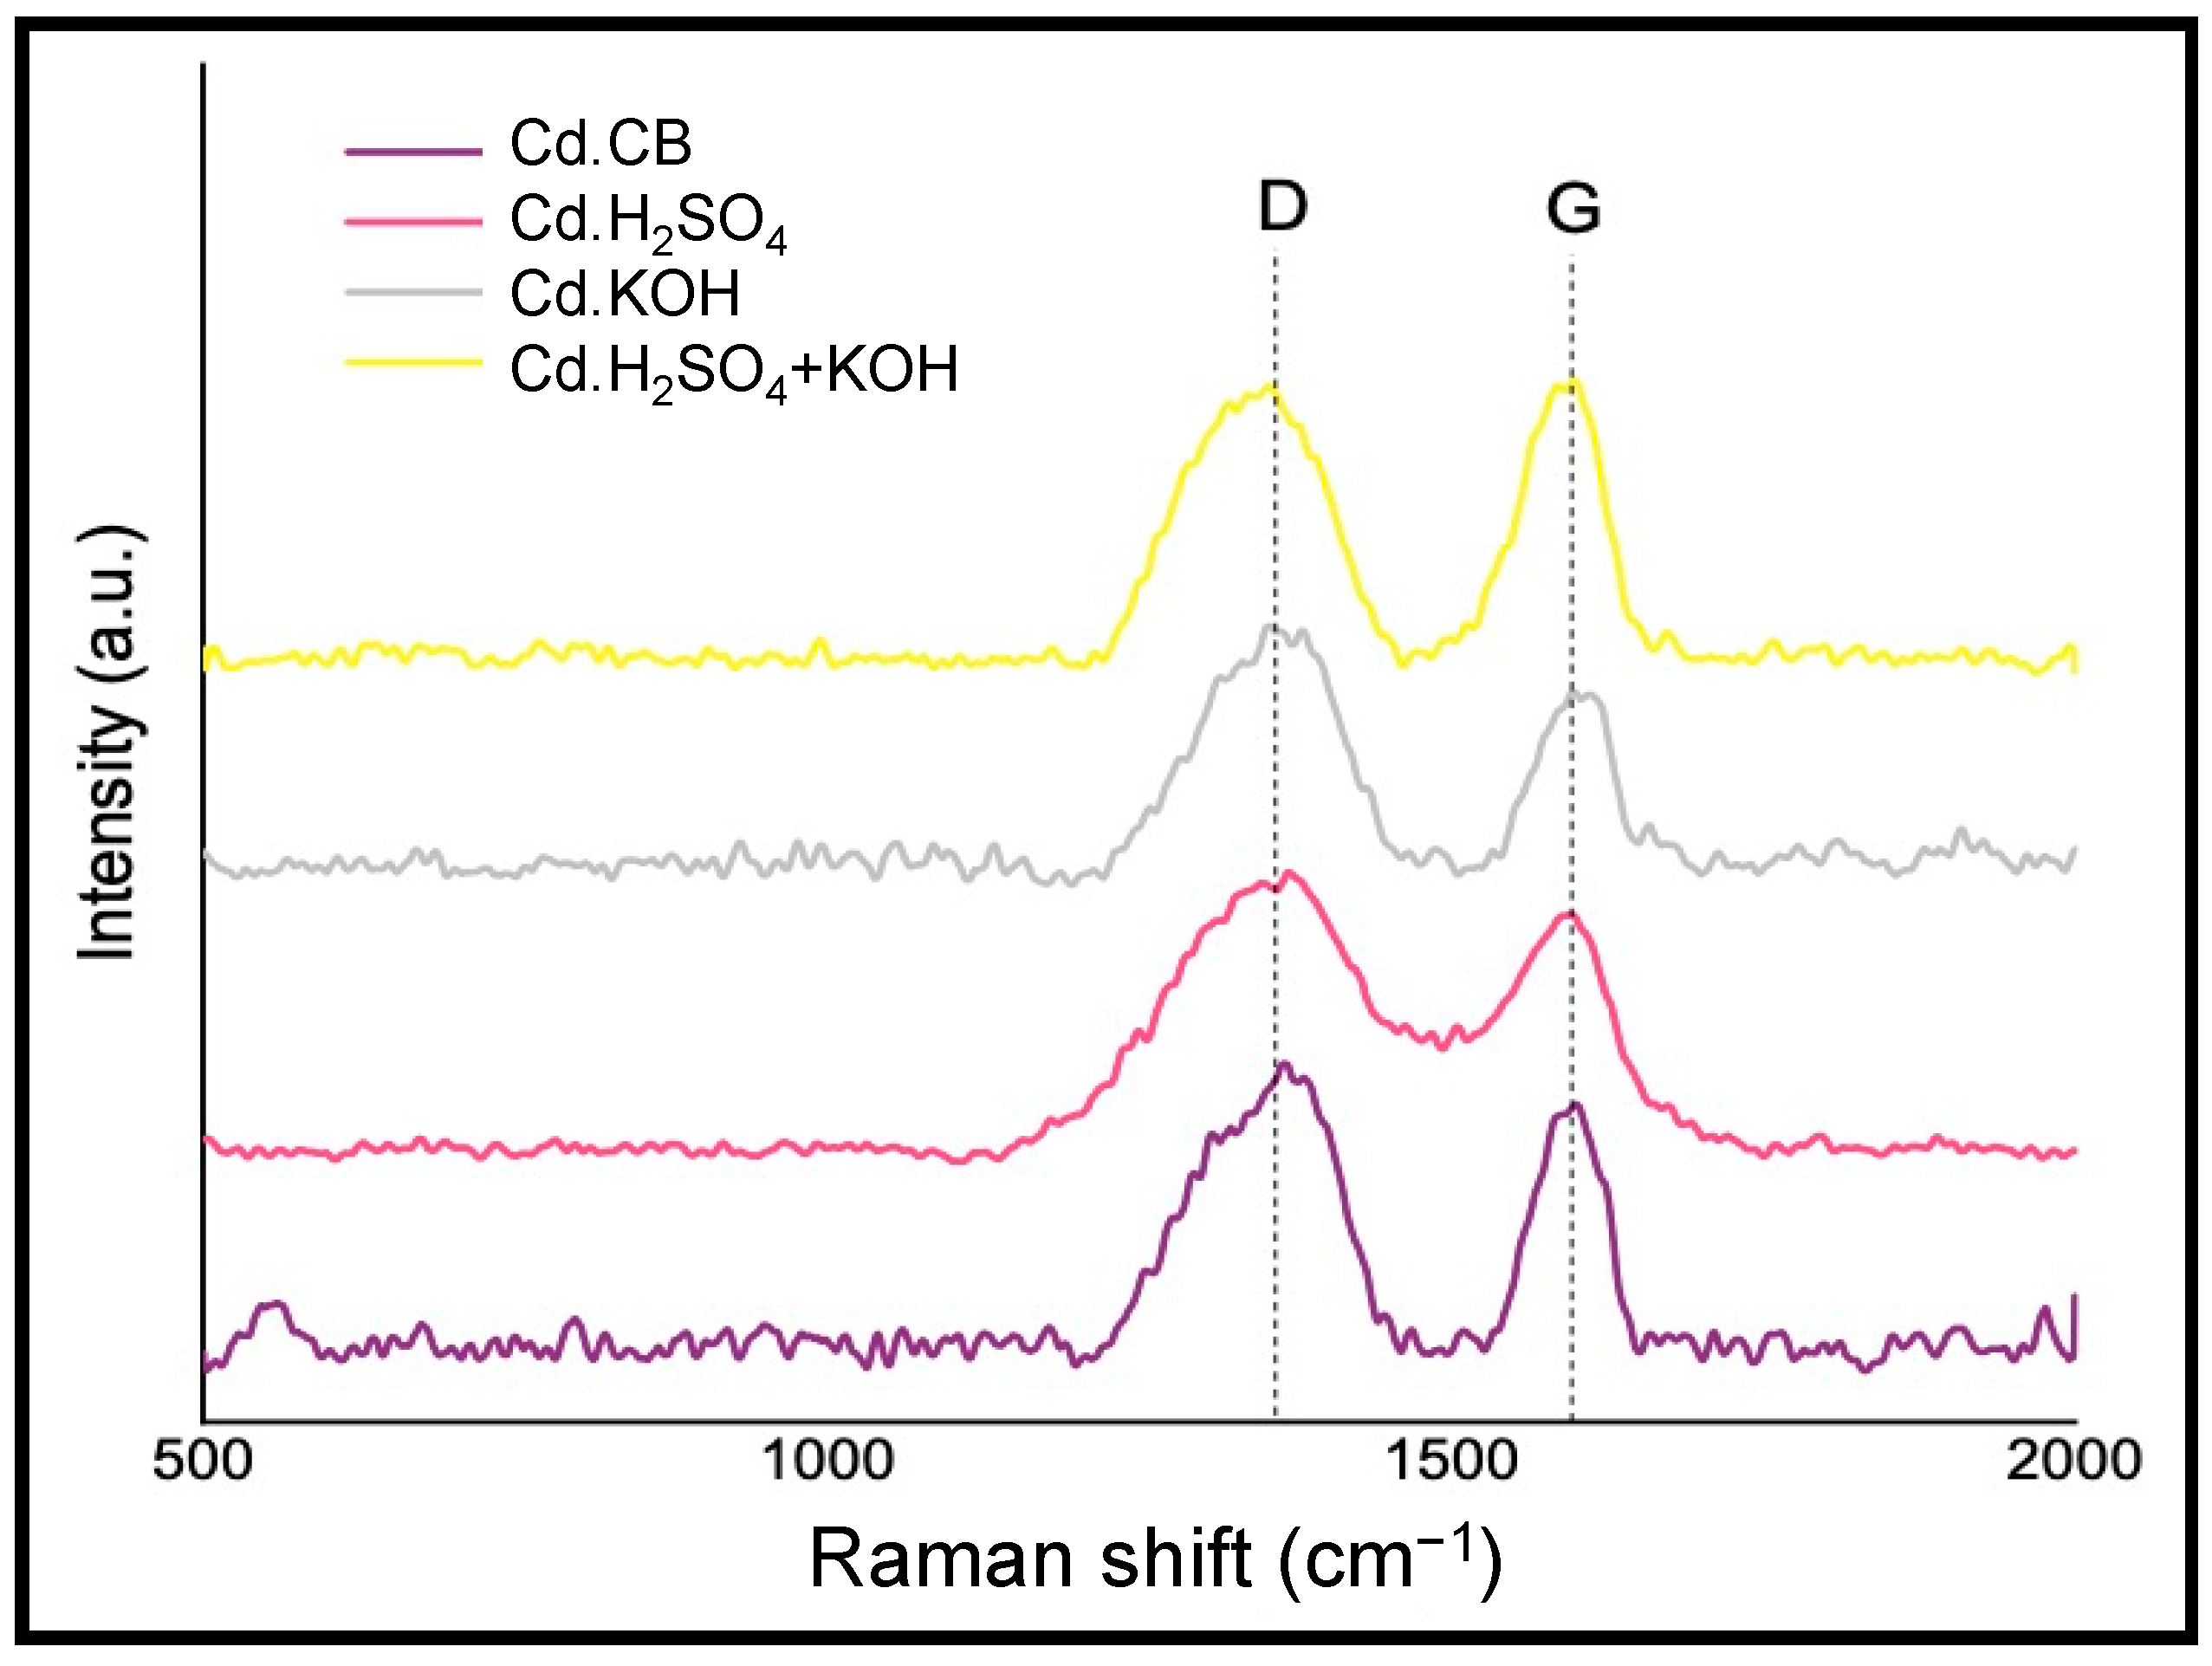
| Cd.CB | Cd.H2SO4 | Cd.KOH | Cd.H2SO4 + KOH | |
|---|---|---|---|---|
| ID/IG | 1.13 | 1.30 | 1.38 | 0.99 |
| D band position (cm−1) | 1355 | 1355 | 1357 | 1341 |
| D band area | 153 | 219 | 121 | 156 |
| D band height | 0.92 | 0.88 | 0.79 | 0.93 |
| D band FWHM | 106 | 158 | 98 | 107 |
| G band position (cm−1) | 1596 | 1588 | 1602 | 1591 |
| G band area | 59 | 88 | 44 | 85 |
| G band height | 0.81 | 0.68 | 0.57 | 0.93 |
| G band FWHM | 106 | 82 | 49 | 58 |
| Sample | ζ Potential (mV) | |||
|---|---|---|---|---|
| Cd.CB | −11.61 | ± | 1.59 | |
| Cd.H2SO4 | −5.20 | ± | 2.60 | A |
| Cd.KOH | −4.22 | ± | 2.17 | A |
| Cd.H2SO4 + KOH | −1.28 | ± | 1.16 | |
Publisher’s Note: MDPI stays neutral with regard to jurisdictional claims in published maps and institutional affiliations. |
© 2022 by the authors. Licensee MDPI, Basel, Switzerland. This article is an open access article distributed under the terms and conditions of the Creative Commons Attribution (CC BY) license (https://creativecommons.org/licenses/by/4.0/).
Share and Cite
González-González, R.B.; González, L.T.; Madou, M.; Leyva-Porras, C.; Martinez-Chapa, S.O.; Mendoza, A. Synthesis, Purification, and Characterization of Carbon Dots from Non-Activated and Activated Pyrolytic Carbon Black. Nanomaterials 2022, 12, 298. https://doi.org/10.3390/nano12030298
González-González RB, González LT, Madou M, Leyva-Porras C, Martinez-Chapa SO, Mendoza A. Synthesis, Purification, and Characterization of Carbon Dots from Non-Activated and Activated Pyrolytic Carbon Black. Nanomaterials. 2022; 12(3):298. https://doi.org/10.3390/nano12030298
Chicago/Turabian StyleGonzález-González, Reyna Berenice, Lucy Teresa González, Marc Madou, César Leyva-Porras, Sergio Omar Martinez-Chapa, and Alberto Mendoza. 2022. "Synthesis, Purification, and Characterization of Carbon Dots from Non-Activated and Activated Pyrolytic Carbon Black" Nanomaterials 12, no. 3: 298. https://doi.org/10.3390/nano12030298
APA StyleGonzález-González, R. B., González, L. T., Madou, M., Leyva-Porras, C., Martinez-Chapa, S. O., & Mendoza, A. (2022). Synthesis, Purification, and Characterization of Carbon Dots from Non-Activated and Activated Pyrolytic Carbon Black. Nanomaterials, 12(3), 298. https://doi.org/10.3390/nano12030298