Article

Visible-Light-Active N-Doped TiO2 Photocatalysts: Synthesis from TiOSO4, Characterization, and Enhancement of Stability Via Surface Modification

by
Nikita Kovalevskiy
1,
Dmitry Svintsitskiy
2,
Svetlana Cherepanova
2,
Stanislav Yakushkin
3,
Oleg Martyanov
3,
Svetlana Selishcheva
4,
Evgeny Gribov
1,
Denis Kozlov
1 and
Dmitry Selishchev
1,*
1
Department of Unconventional Catalytic Processes, Boreskov Institute of Catalysis, Novosibirsk 630090, Russia
2
Department of Heterogeneous Catalysis, Boreskov Institute of Catalysis, Novosibirsk 630090, Russia
3
Department of Physicochemical Methods of Research, Boreskov Institute of Catalysis, Novosibirsk 630090, Russia
4
Engineering Center, Boreskov Institute of Catalysis, Novosibirsk 630090, Russia
*
Author to whom correspondence should be addressed.
Nanomaterials 2022, 12(23), 4146; https://doi.org/10.3390/nano12234146
Submission received: 29 October 2022 / Revised: 18 November 2022 / Accepted: 21 November 2022 / Published: 23 November 2022
(This article belongs to the Special Issue Synthesis of Nanocomposites and Catalysis Applications II)

Abstract

:
This paper describes the chemical engineering aspects for the preparation of highly active and stable nanocomposite photocatalysts based on N-doped TiO2. The synthesis is performed using titanium oxysulfate as a low-cost inorganic precursor and ammonia as a precipitating agent, as well as a source of nitrogen. Mixing the reagents under a control of pH leads to an amorphous titanium oxide hydrate, which can be further successfully converted to nanocrystalline anatase TiO2 through calcination in air at an increased temperature. The as-prepared N-doped TiO2 provides the complete oxidation of volatile organic compounds both under UV and visible light, and the action spectrum of N-doped TiO2 correlates to its absorption spectrum. The key role of paramagnetic nitrogen species in the absorption of visible light and in the visible-light-activity of N-doped TiO2 is shown using the EPR technique. Surface modification of N-doped TiO2 with copper species prevents its intense deactivation under highly powerful radiation and results in a nanocomposite photocatalyst with enhanced activity and stability. The photocatalysts prepared under different conditions are discussed regarding the effects of their characteristics on photocatalytic activity under UV and visible light.

Graphical Abstract

1. Introduction

Currently, heterogeneous photocatalysis using semiconducting nanomaterials is one of the key research areas worldwide, because it is regarded as an efficient method for utilizing solar radiation to carry out useful chemical transformations and store energy [1,2]. Since 1972, when Fujishima and Honda published their study on electrochemical water splitting using a semiconductor electrode [3], titanium dioxide has been a focus of attention as an active and stable material for various photocatalytic reactions [4,5,6]. The great importance of TiO2 as a photocatalyst is also due to the large reserves of titanium minerals in the Earth’s interior and the relatively low cost of its manufacturing.
In an oxygen-containing medium, photocatalytically-active TiO2 can decompose hazardous molecular pollutants under UV light [7,8]. This behavior enables the application of TiO2-mediated photocatalytic oxidation as an efficient and environmentally friendly method for the purification of air and water [9,10,11]. At the same time, a substantial hindrance for the application of TiO2 photocatalysts is that titanium dioxide has a wide band gap (e.g., 3.2 eV for anatase) and can only absorb UV light. The control of mercury, especially in light sources, the high cost of UV light-emitting diodes (UV LEDs) as an alternative to mercury lamps, and the low content (<5%) of UV light in solar radiation requires the development of efficient photocatalysts to carry out photocatalytic reactions under wide-range radiation, including visible light.
Narrow-band semiconductors (e.g., graphitic carbon nitride, silver phosphate, bismuth vanadate, ternary sulfides) exhibit photocatalytic activity under visible light but quantum efficiencies in oxidation reactions over these single-phase materials are commonly not high enough due to surface properties, nonoptimal positions of energy bands, and a high recombination rate of photogenerated charge carriers [12]. For these reasons, the modification of TiO2 to extend its action spectrum to the visible region is still the main way to develop an efficient photocatalyst for the degradation of pollutants [13,14].
The absorption of visible light and photoexcitation of electrons in TiO2-based photocatalysts can be achieved by the sensitization of TiO2 with organic dyes or plasmonic metals; the combination of TiO2 with narrow-band semiconductors can be used to form heterojunctions, as well as TiO2 doping with metals and nonmetals for the creation of additional energy levels in its band gap [15,16,17,18,19]. Creating bulk/surface defects (e.g., reduced states, oxygen vacancies) in semiconducting materials, including TiO2, and tuning their concentrations are also strategies that allow an increase in the absorption of visible light and an enhancement of the photocatalytic activity [20].
Concerning the approaches mentioned above, TiO2 doped with nitrogen can exhibit great activity in the photodegradation of pollutants both under UV and visible light. In 1986, Sato et al. [21] first described an N-doped TiO2 photocatalyst prepared via the precipitation of titanium hydroxide using ammonia solution, which was able to oxidize ethane and CO under visible radiation (λmax = 434 nm). In 2001, Asahi et al. [22] reported the photocatalytic activity of N-doped TiO2 in the degradation of methylene blue and acetaldehyde vapor under similar radiation (436 nm). The authors suggested that nitrogen substitutes oxygen in lattice sites of TiO2, and N 2p orbitals are mixed with O 2p orbitals from the valence band (VB) of TiO2 that narrows its band gap and results in the ability for absorption of visible light. On the other hand, Di Valentin et al. [23,24,25] have shown in a series of studies using computer simulation and EPR techniques that no narrowing of the band gap occurs during TiO2 doping with nitrogen, whereas discrete energy levels appear above the VB of TiO2. The authors reported that nitrogen can substitute O atoms in the lattice sites (i.e., substitutional position) with the formation of N 2p discrete levels located 0.14 eV above the VB or can occupy the interstitial sites (i.e., interstitial position) with the formation of π * NO discrete levels located 0.73 eV above the VB.
The position occupied by nitrogen depends on the preparation method of N-doped TiO2. Various chemical compounds were used as a source of nitrogen during the precipitation of TiO2: ammonium hydroxide [26,27], ammonium chloride [24,28,29], ammonium nitrate [25], nitric acid [25,30], hydrazine [25,31], urea [32,33], diethanolamine [32], and triethylamine [31,32]. A shift of light absorption edge to the visible region compared to pristine TiO2 was observed for all photocatalysts synthesized using the mentioned precursors. The photocatalytic activity of N-doped TiO2 has been commonly investigated in the degradation of organic contaminants in air or water using batch reactors. Data on the visible-light-driven degradation of formic acid [34], acetaldehyde [22], phenol [27], 2-chlorophenol [32], 2,4-dichlorophenol [35], stearic acid [36], methylene blue [28,37,38,39,40], rhodamine B [35], eriochrome black-T [40], phenanthrene [41], dibenzothiophene [42], ethylparaben [43], lindane [44], atrazine [45], mecoprop and clopyralid herbicides [46] have been reported. The ability to decompose organic contaminants under irradiation was demonstrated, but many studies did not provide the data, which can be used for comparison of the results between each other (e.g., quantum efficiencies or data for benchmarks). Additionally, it is difficult to evaluate the steady-state photocatalytic activity in a batch reactor because the concentration of oxidizing contaminant is decreased monotonically during the experiment and, consequently, affects the reaction rate. Experiments in a continuous-flow reactor are preferable to receive valid information on the efficiency of light utilization and the stability of photocatalysts.
Despite the superiority of titanium alkoxide precursors in scientific papers, one of the two main methods for the production of TiO2 in industry is sulfate technology using ilmenite mineral (FeTiO3), which results in the formation of titanium (IV) oxysulfate (TiOSO4) followed by its hydrolysis to titanium (IV) oxide hydrate (TiO2 × nH2O). Little information on the application of inorganic titanium precursors for the preparation of N-doped TiO2 photocatalysts can be found in the literature. It was our motivation to study the preparation of N-doped TiO2 photocatalysts using titanium oxysulfate as a titanium precursor and ammonia as a nitrogen source. In contrast to titanium alkoxide precursors, titanium oxysulfate can be easily dissolved and hydrolyzed in aqueous solutions without organic solvents.
In this study, the preparation of highly active N-doped TiO2 photocatalyst was performed via precipitation from an aqueous solution of titanium oxysulfate using ammonium hydroxide followed by thermal treatment in air. Despite doubts about TiO2 doping with nitrogen during wet synthetic processes [47], we show experimental data that clearly confirm this mechanism of modification in the case of photocatalysts prepared from TiOSO4 using ammonia. The effect of preparation conditions on the characteristics and photocatalytic activity of N-doped TiO2 is discussed. A comparison with commercially available photocatalysts is also made. An approach via the surface modification of N-doped TiO2 with copper species is proposed for the preparation of nanocomposite photocatalysts with an enhanced stability under long-term exposure to power radiation.

2. Materials and Methods

2.1. Chemicals

Ammonium hydroxide solution (NH4OH, 25%) and sodium hydroxide (NaOH, reagent grade) from AO Reachem Inc. (Moscow, Russia), titanium(IV) oxysulfate dihydrate (TiOSO4 × 2H2O, reagent grade) and copper(II) acetate monohydrate (Cu(CH3COO)2 × H2O, 99%) from AO Vekton Inc. (Moscow, Russia), and iron(III) nitrate nonahydrate (Fe(NO3)3 × 9H2O, 98%) from Sigma–Aldrich (St. Louis, MO, USA) were used for the preparation of photocatalysts. Reagent grade acetone (CH3COCH3) from Mosreaktiv LLC (Moscow, Russia) was used as a test organic compound for oxidation during the photocatalytic experiments. Two commercially available powdered TiO2 photocatalysts, namely, TiO2 P25 from Evonik Ind. AG (Essen, Germany) and TiO2 KRONOClean 7000 from KRONOS Worldwide Inc. (Dallas, TX, USA), were employed as the references for benchmarking. These photocatalysts are referred to in this paper as P25 and KC, respectively. All chemicals and materials were used as received from suppliers without further purification.

2.2. Preparation of Photocatalysts

The samples of N-doped TiO2 (TiO2-N) were prepared via the precipitation method using TiOSO4 as a titanium precursor and ammonium hydroxide as a precipitating agent, as well as a source of nitrogen. Before the synthesis, titanium oxysulfate dihydrate (83 g) was suspended in deionized water (600 mL) and stirred for several days. A small amount of undissolved precursor was removed from the reaction solution using a 0.20 µm PTFE membrane filter. A commercial solution of ammonium hydroxide was diluted 10 times with deionized water. In a typical synthesis, prepared solutions of TiOSO4 (ca. 200 mL) and ammonia were simultaneously added dropwise to deionized water (1000 mL) under vigorous stirring. A pH electrode was immersed into the reaction solution to adjust the pH during the precipitation to 7 by tuning the flows of solutions. The white precipitate formed after mixing the reagents was aged in mother liquor for several days. Then, the precipitate was separated by centrifugation at 8000 rpm for 10 min and washed with deionized water. The centrifugation and washing procedures were repeated up to 15 times until the conductivity of washouts became similar to that of pure water. Finally, the precipitate was dried and further calcined in air for 3 h at a certain temperature in the range of 250–600 °C. In addition to TiO2-N, blank TiO2 without added nitrogen was prepared by similar technique but using sodium hydroxide as a precipitating agent. The precipitation was performed at pH = 7 followed by aging and calcination at 350 °C.
One of the prepared TiO2-N samples (350 °C) was further modified with iron or copper species by impregnation with an aqueous solution of iron nitrate (0.15 M) or copper acetate (0.15 M). Typically, an aliquot of iron or copper precursor was added to the suspension of TiO2-N (1 g) in deionized water (10 mL). After vigorous stirring for 1–2 h, the sample was separated by centrifugation at 8000 rpm for 10 min and washed 3 times with deionized water. Finally, it was dried in air at 70 °C. The iron and copper contents were 0.1 and 1% of the mass of TiO2, respectively.

2.3. Characterization Techniques

The phase composition of the photocatalysts was determined by powder X-ray diffraction (XRD) using a D8 Advance diffractometer (Bruker, Billerica, MA, USA) equipped with a CuKα radiation source and a LynxEye position sensitive detector. The data were collected in the 2θ range of 5–75° with a step size of 0.05° and a collection time of 3 s. The average size of TiO2 crystallites and strain values were estimated from the peak profile parameters (i.e., weight and width of Gauss and Lorentz peak components) determined by double-Voigt analysis in the Le Bail fitting method realized in TOPAS software (Bruker, 4.2 version). Lattice constants were also refined with the mentioned TOPAS software. The morphology of the photocatalysts was studied by SEM using an ultrahigh resolution Field-Emission SEM (FE-SEM) Regulus 8230 (Hitachi, Tokyo, Japan) at an accelerating voltage of 30 kV. The surface composition was investigated by X-ray photoelectron spectroscopy (XPS) using an ES300 spectrometer (Kratos Analytical, Manchester, UK) equipped with a MgKα (hν = 1253.6 eV, 170 W) radiation source. The photoelectron lines of Au 4f7/2 (84.0 eV) and Cu 2p3/2 (932.7 eV) from metallic gold and copper foils were used to calibrate the scale of binding energy (BE). The C 1s line (284.8 eV) from carbon deposits was used as an internal reference. Pretreatment of samples was performed for 1 h before the acquisition of survey and precision spectra. The surface composition was also investigated using diffuse reflectance infrared Fourier-transform spectroscopy (DRIFTS). The spectra were collected at room temperature under air exposure using a Vector 22 FTIR spectrometer (Bruker) equipped with an EasiDiffTM accessory from PIKE Technologies Inc. (Madison, WI, USA). No pretreatment of the samples was performed before the analysis.
The textural properties were investigated by adsorption of nitrogen at 77 K using an ASAP 2400 instrument (Micromeritics, Norcross, GA, USA). Before the experiments, the samples were thermally treated in vacuum at 150 °C for 16–24 h. The surface area and average pore diameter were calculated by BET analysis of the measured isotherms, and the pore volume was determined as the total pore volume at P/P0~1. The total content of nitrogen and sulfur in the prepared photocatalysts was measured by CHNS analysis using a Vario EL Cube elemental analyzer from Elementar Analysensysteme GmbH (Langenselbold, Germany). Five independent measurements were made for each sample, and an averaged value of N and S content was calculated.
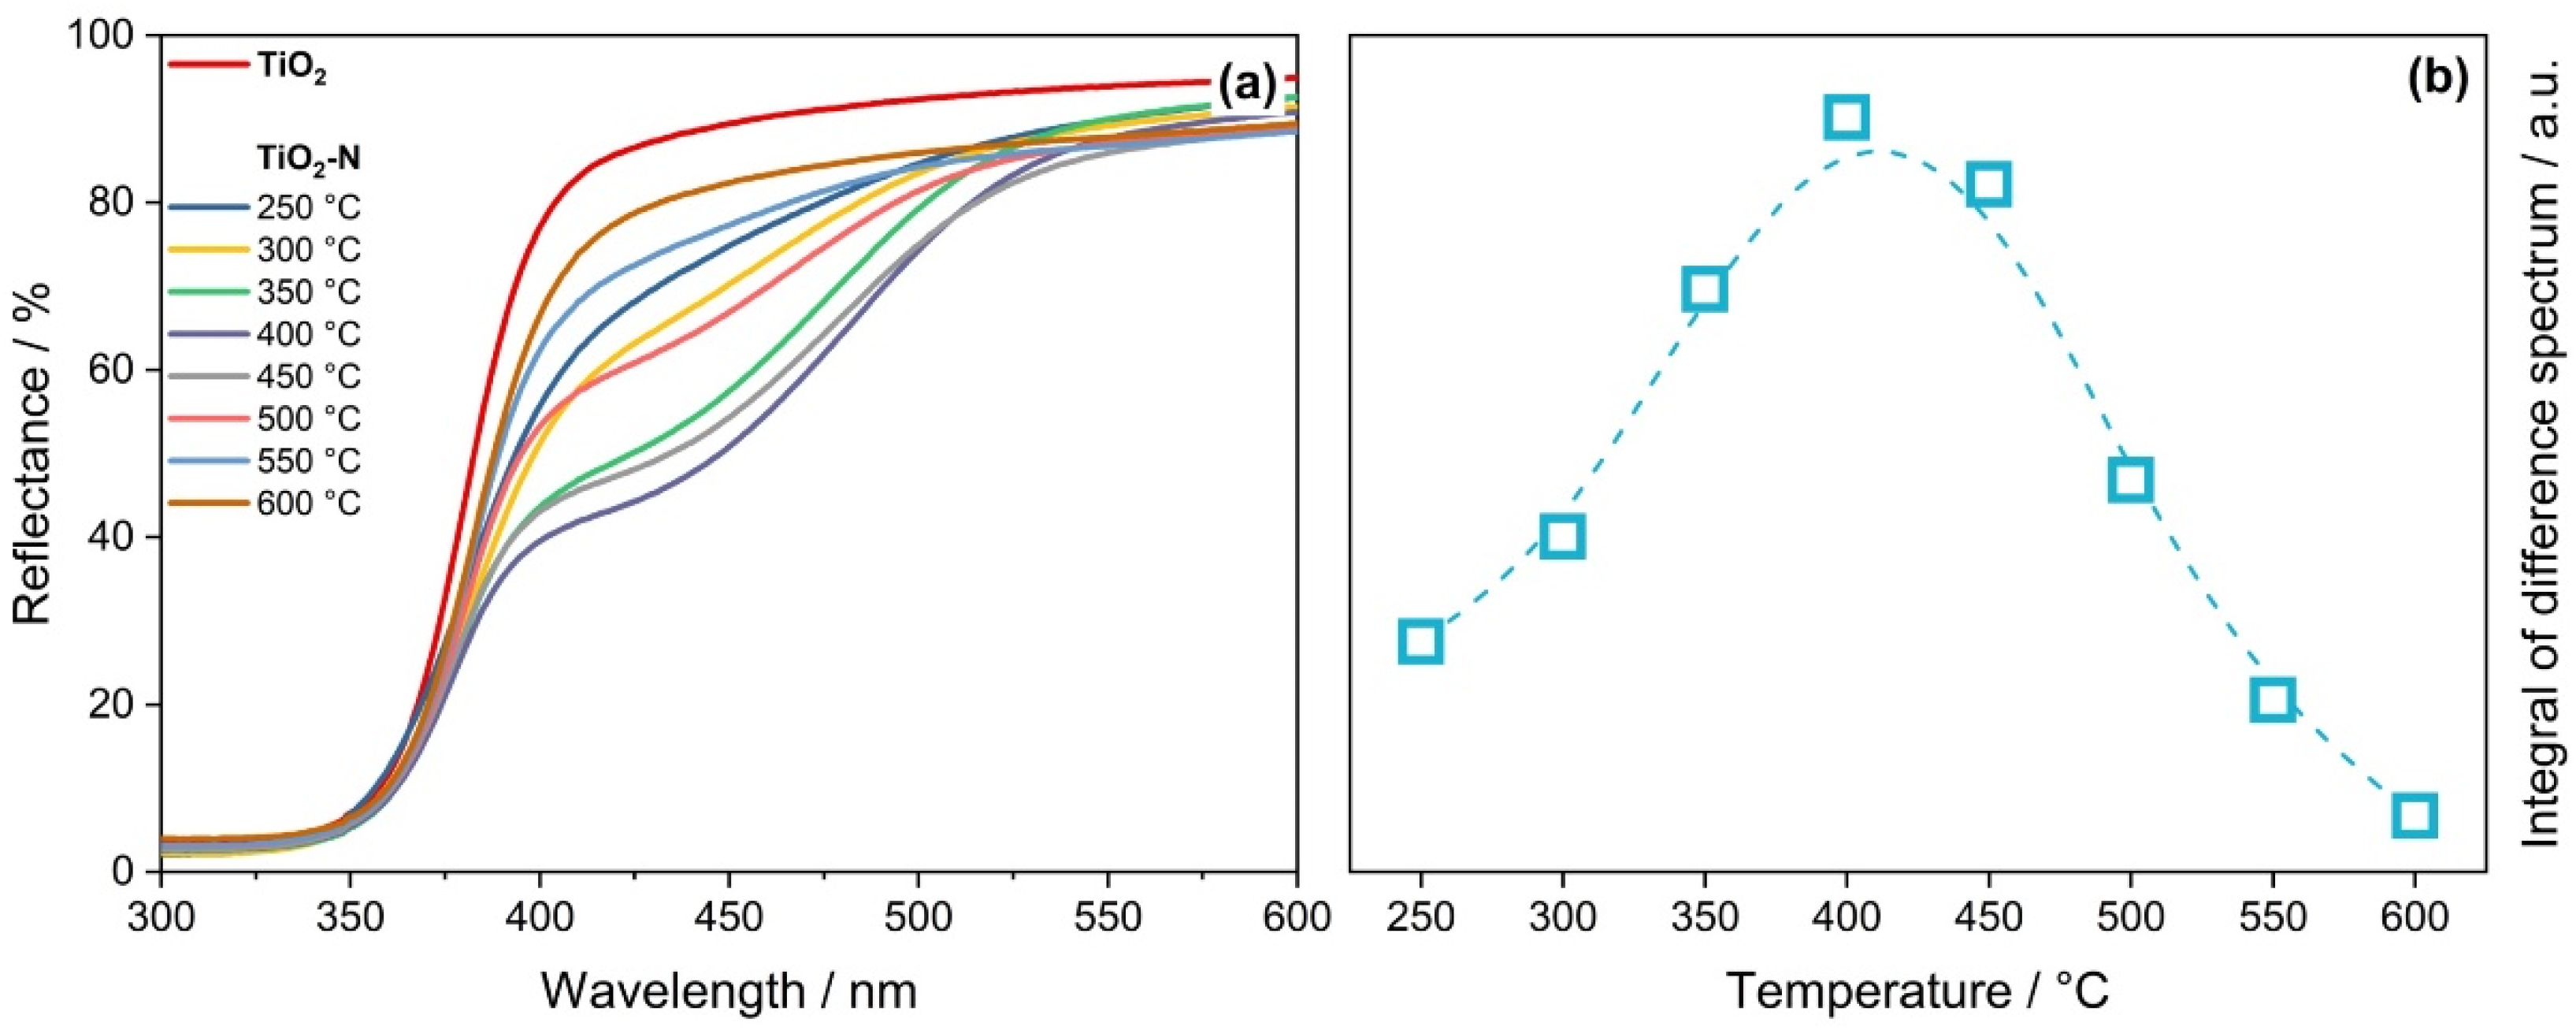
UV–vis diffuse reflectance spectra (DRS) were recorded at room temperature in the range of 250–850 nm with 1 nm of resolution using a Cary 300 UV–vis spectrophotometer from Agilent (Santa Clara, CA, USA) equipped with a DRA-30I diffuse reflectance accessory and special prepacked polytetrafluoroethylene (PTFE) reflectance standard. The optical band gap was estimated using the Tauc method based on the assumption of indirect allowed transitions by plotting ( F ( R ) h ϑ ) 1 2 versus h ϑ and a linear fitting [48]. To analyze the effect of calcination temperature on light absorption in a series of TiO2-N samples, the UV–vis spectrum of the TiO2 sample was subtracted from the spectra of synthesized TiO2-N samples. The received difference spectra were integrated in the region of 380–550 nm, and the integral values were plotted versus the values of calcination temperature used during the synthesis.
Electron paramagnetic resonance (EPR) spectra were recorded using an X-band EleXsys 500 spectrometer (Bruker) equipped with a digital temperature control system ER 4131 VT. The samples for study were placed in a quartz tube at the center of a rectangular TE102 resonator with a magnetic component of the UHF field perpendicular to the direction of the external magnetic field. The blue light (450 nm) was supplied directly to the microwave cavity in the process of spectra registration. The spectra simulation was carried out using the EasySpin software (an open-source software package, 5.2 version) [49].
The samples for photoelectrochemical measurements were prepared via the deposition of TiO2-N on a fluorinated tin oxide (FTO) glass from an aqueous suspension containing NafionTM followed by drying at 50 °C overnight and at 150 °C for 30 min. After that, the sample with a spot area of 2 cm2 was placed in a photoelectrochemical cell and irradiated with UV light (λmax = 365 nm, 10 mW cm−2) or blue light (λmax = 450 nm, 160 mW cm−2) provided by light-emitting diodes (LEDs) through the back side of FTO glass and served as a working electrode. A mercury-sulfate electrode and platinum foil served as reference and counter electrodes, respectively. Before the photoelectrochemical tests, the potential of the mercury-sulfate electrode was measured relative to the reversible hydrogen electrode (RHE). The experiments were carried out at room temperature in 1 M Na2SO4 or 1 M Na2SO4 + 0.82 M CH3OH solution as an electrolyte using an Autolab PGStat 300N potentiostat (Metrohm AG, Herisau, Switzerland). The photocurrent was determined under corresponding radiation by chronoamperometry at a potential of 0.585 V RHE in three light-off cycles.

2.4. Photocatalytic Experiments

The synthesized and reference photocatalysts were tested in the oxidation of acetone vapor in a continuous-flow setup designed for the evaluation of steady-state oxidation rates and stability of photocatalytic performance. The details on the experimental setup and evaluation of photocatalytic activity can be found in our previously published paper [50]. Highly powerful UV (λmax = 371 nm) and blue (λmax = 450 nm) LEDs were used for the irradiation of photocatalysts and evaluation of their activity in the UV and visible regions, respectively. The emission spectra of the LEDs used in this work are shown in Figure S1a,b in the Supplementary Materials. According to the measurements using an ILT 950 spectroradiometer (International Light Technologies Inc., Peabody, MA, USA), the specific irradiance was 9.7 and 164 mW cm−2 for UV and blue light, respectively. The experiments were performed under optimized operational conditions: the area density of the photocatalyst was 19 mg cm−2, the irradiation area was 9.1 cm2, the inlet concentration of acetone was ca. 32 µmol L−1, the reactor temperature was 40 ± 0.1 °C, the relative humidity was 19 ± 1%, and the volume flow rate was 67 ± 1 cm3 min−1.
The setup had a special valve system for the alternate analysis of the inlet and outlet reaction mixtures using an FTIR spectrometer FT-801 (Simex LLC, Novosibirsk, Russia) equipped with an IR long-path gas cell (Infrared Analysis Inc., Anaheim, CA, USA). The quantitative analysis of acetone and CO2 was performed using the Beer–Lambert law by the integration of collected IR spectra in corresponding regions [50]. Figure S1c in the Supplementary Materials shows a typical CO2 concentration profile during the photocatalytic experiment. The photocatalytic activity of the samples was evaluated as the rate of CO2 evolution, resulting from the oxidation of acetone. The CO2 rate was estimated in continuous-flow experiments as the difference in the outlet and inlet CO2 concentrations multiplied by the volume flow rate. After the achievement of a steady-state regime, the CO2 rate was averaged for 30 min. Based on the statistics of many experiments, the total error in measuring the CO2 formation rate using the setup did not exceed 10%. In the tests on stability, the photocatalytic activity of the samples was evaluated for 30 h.
Additionally, the action spectrum of TiO2-N obtained as the dependence of photonic efficiency on the wavelength of excited radiation was also investigated using the mentioned setup. Eighteen LEDs with different basic wavelengths from 365 to 730 nm were used for irradiation of the photocatalyst during the measurement of the action spectrum. The photon flux for each LED was adjusted to the value of ca. 7 × 10¹⁷ s−1 for correct evaluation of efficiency. The photonic efficiency of the photocatalytic reaction can be expressed according to IUPAC recommendations as follows [51]:
ξ = W r q p 0 = 16 3 × W C O 2 × 10 16 7 × 10 17 × 100 %
where   ξ is the photonic efficiency (%), W r is the reaction rate (s−1), q p 0 is the incident photon flux (s−1), W C O 2 is the steady-state rate of CO2 formation measured in the setup (µmol min−1), 7 × 10¹⁷ is the photon flux (s−1), and 16 3 is the conversional factor (16 charge pairs and, consequently, at least 16 photons are required to oxidize 1 molecule of acetone; 3 molecules of CO2 are formed from 1 molecule of acetone during 1 act of reaction). The details on the measurement of action spectra can be found in recently published papers [52,53].

3. Results and Discussion

In this study, we investigated N-doped TiO2 photocatalysts synthesized using titanyl sulfate as the titanium precursor and ammonium hydroxide as a precipitating agent, as well as a source of nitrogen. The results on the state of nitrogen in doped TiO2 and the effect of preparation conditions on the characteristics and photocatalytic activity of materials are discussed first. Then, the effect of Fe and Cu modifiers on the stability of composite photocatalysts is shown.

3.1. Effect of Preparation Conditions on the Characteristics and Photocatalytic Activity of N-Doped TiO2

pH-controlled hydrolysis of TiOSO4 using an aqueous solution of ammonia leads to the precipitation of titanium oxide hydrate. According to the results of XRD analysis, this precipitate was completely amorphous and had no photocatalytic activity under visible light. The corresponding XRD patterns of the samples calcined at different temperatures are shown in Figure 1a.
The peaks, which can be attributed to the crystal phase of anatase, were detected in the patterns only at 250 °C, but the size of crystallites in the corresponding sample was extremely low for quantitative evaluation. The main peaks at 2θ of 25.3°, 37.8°, 48.1°, 53.9°, 55.1°, and 62.8° attributed to the (101), (004), (200), (105), (211), and (204) planes of anatase TiO2 clearly indicate the formation of the anatase phase at an increased temperature (350 °C and higher). The average crystallite size in the sample calcined at 350 °C was estimated to be 16 nm. The SEM micrographs in Figure 1b and c illustrate this statement and show that large particles of synthesized TiO2-N consist of agglomerated nanocrystallites of an oval form.
It should be noted that the consideration of only the size effect during the analysis of XRD patterns did not give accurate fitting of the experimental patterns of synthesized samples (see Figure S2 in the Supplementary Materials). Therefore, the estimation of crystallite size was performed considering the effect of strains according to the Le Bail fitting method. Table 1 shows the estimated strain values that are high enough (ε > 0.001) for all synthesized samples. This fact indicates the presence of microdeformations in the structure of TiO2 nanocrystals that can be associated with impurities. According to CHNS analysis, the synthesized TiO2-N contains nitrogen and sulfur as the main impurities. The content of both elements depended on the preparation conditions (Table 1). The lattice constants (a and c) and, consequently, the volume of the unit cell for this TiO2-N sample substantially differ from the corresponding parameters for the TiO2 sample synthesized without the addition of ammonia (Table S1), which also confirms a key effect of nitrogen impurities.
An increase in the calcination temperature led to an increase in the size of crystallites and the extent of crystallinity because of a decrease in the value of strains (Table 1). A monotonic decrease in the stain values confirms reducing microdeformations in the structure of TiO2 nanocrystals during calcination at higher temperatures. It should be noted that even calcination at the highest temperature (600 °C) did not lead to the transformation of anatase to the rutile phase because no peaks attributed to rutile were detected in the corresponding XRD pattern (Figure 1a). This is a common case for photocatalysts prepared from the TiOSO4 precursor due to the stabilization of the TiO2 surface by strongly bonded sulfates [54]. Typically, much higher temperatures are required for anatase–rutile transformation in this system.
The calcination temperature strongly affected the textural properties of the materials. Table 1 shows that the specific surface area and pore volume of the samples decrease as the calcination temperature increases. In contrast, the average diameter of pores increases as the temperature increases, which agrees with the growth of crystallite sizes. Sintering TiO2 nanoparticles occurs during calcination, which results in the formation of large agglomerates with a lower specific surface area. Table 1 also shows that an increase in the calcination temperature leads to a monotonic decrease in the content of nitrogen estimated using CHNS analysis. This confirms the degradation of nitrogen species due to their oxidation at increased temperatures followed by their removal from the material. At the same time, the sulfur content has a similar value over the whole temperature range (Table 1). Sulfur species are commonly more stable on the surface of TiO2 than nitrogen species due to a higher affinity [55], and much higher temperatures are required for their complete removal.
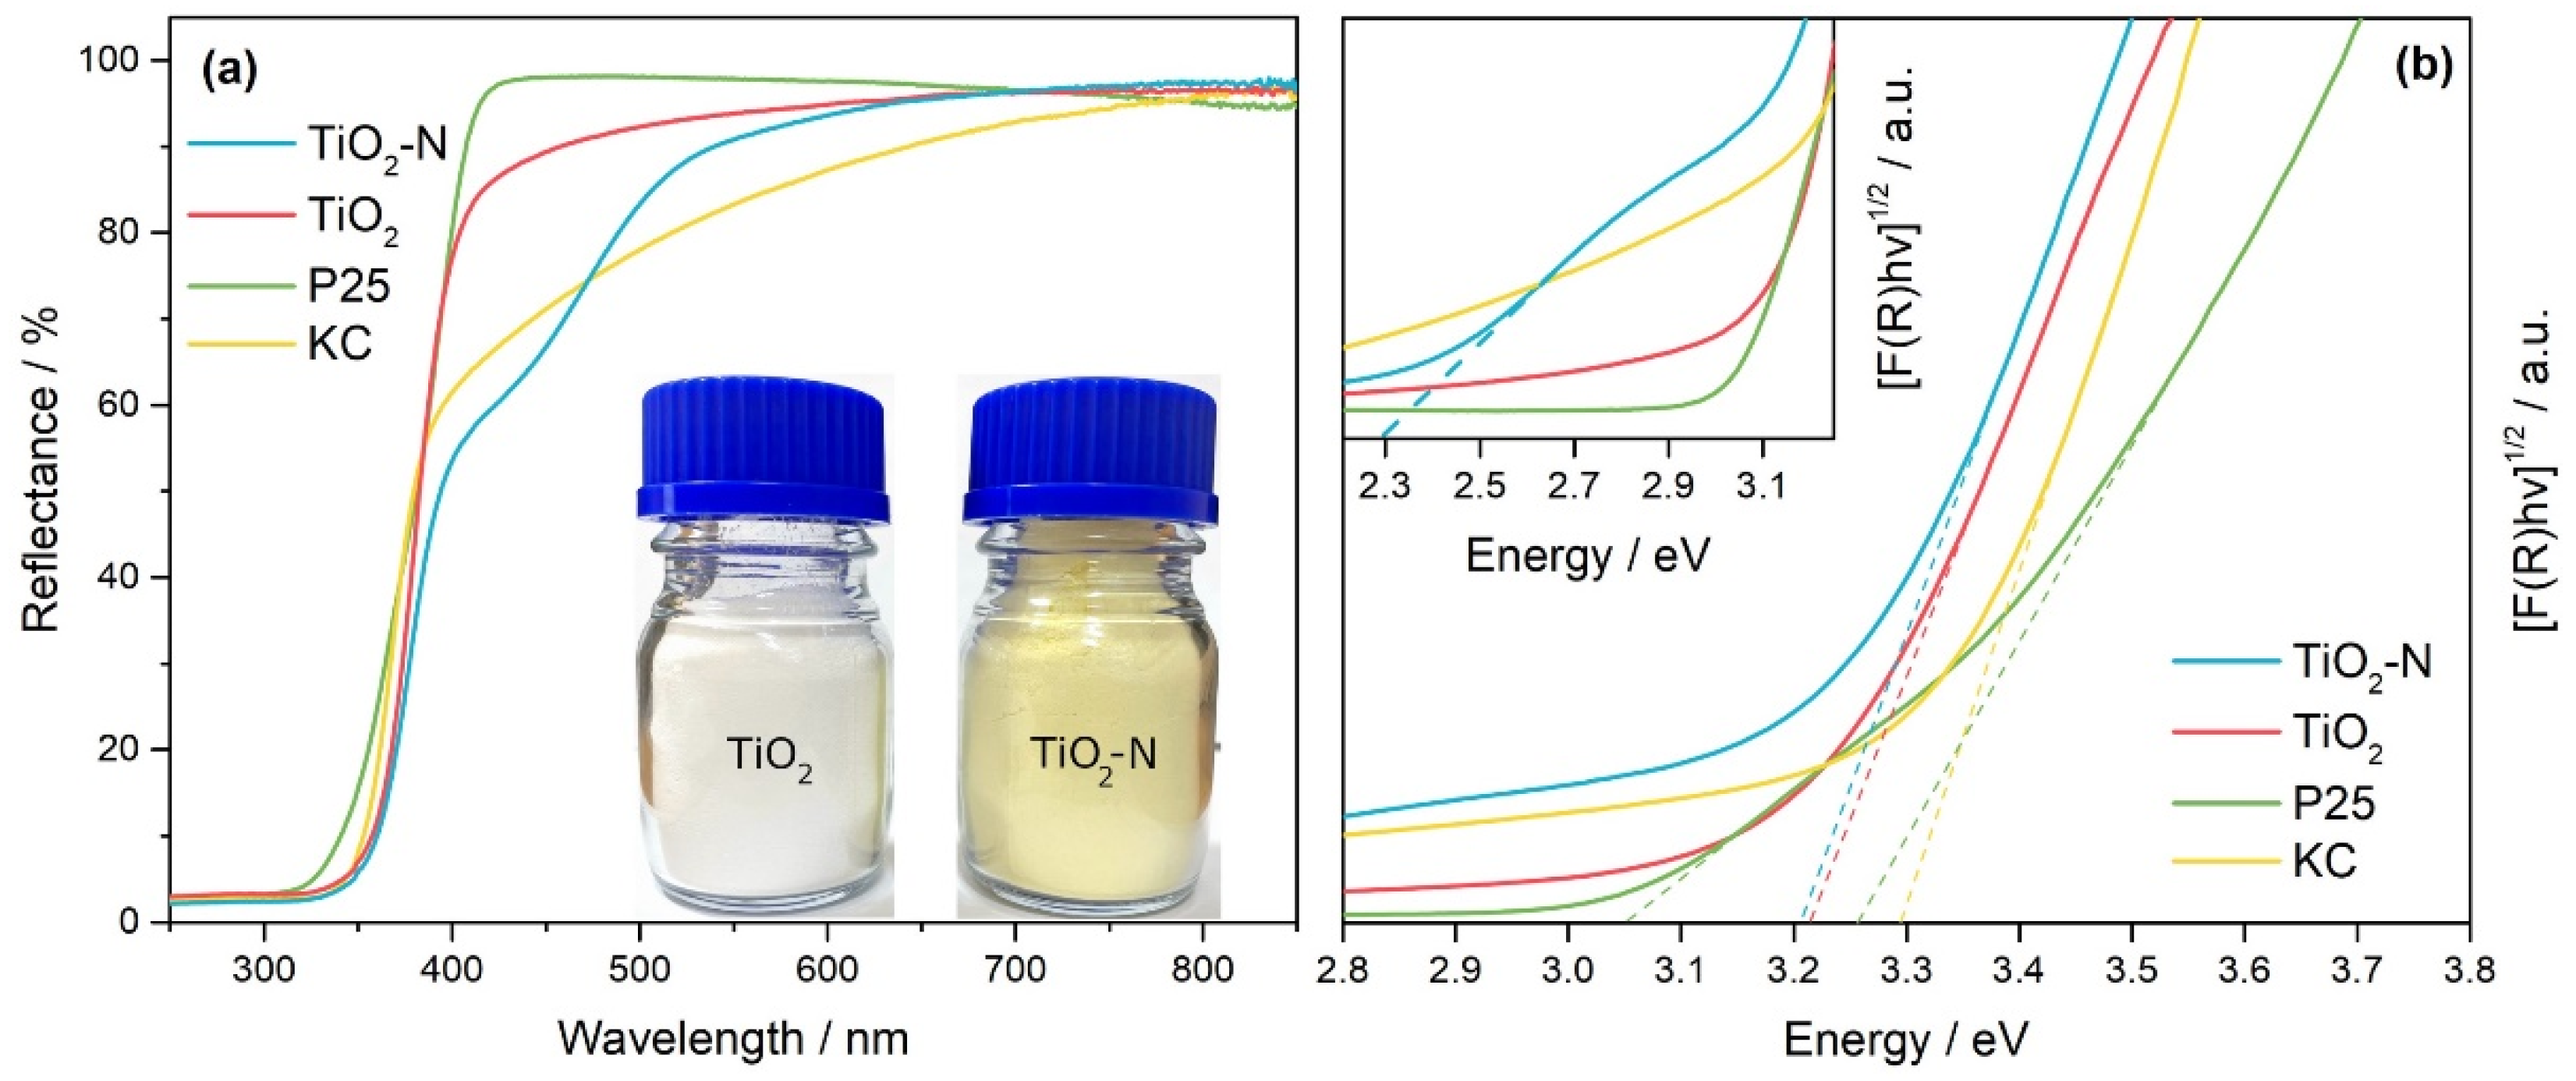
The synthesized samples had a yellow color, which confirms their ability to absorb light in the visible region of the spectrum. The UV–vis spectrum of TiO2-N shows a shoulder of additional absorption in the region of 400–540 nm compared to the fundamental absorption of TiO2 (Figure 2a). This behavior can be attributed to nitrogen impurities in TiO2 rather than sulfur impurities because the TiO2 sample, prepared similarly from the TiOSO4 precursor using NaOH as a precipitating agent, has no absorption in the corresponding region. As expected, the TiO2 sample is white in color, in contrast to TiO2-N (see photographs in Figure 2a).
UV–vis spectra of commercially available TiO2 P25 and TiO2 KC photocatalysts are also shown in Figure 2a for comparison. TiO2 P25 consists of both anatase and rutile crystal phases, and it can absorb radiation with wavelengths up to 410 nm. At the same time, TiO2 KC can absorb light in the visible region up to 750 nm, but its absorption spectrum differs from that of TiO2-N due to another type of modification [56].
The optical band gaps of synthesized and commercial photocatalysts, estimated using the Tauc method, were in the range of 3.2–3.3 eV (Figure 2b, Table 1), which can be attributed to the anatase phase of TiO2. A value of 3.05 eV can also be estimated from the Tauc plot for the TiO2 P25 photocatalyst. This value can be attributed to the rutile phase in the P25 composition. The inset in Figure 2b shows that in the case of TiO2-N we can also estimate the minimum energy required for the photoexcitation of electrons to the CB of TiO2. A linear approximation of the additional absorption shoulder gives a value of 2.3 eV that corresponds to 540 nm. As mentioned above, the absorption of light in the visible region is due to nitrogen impurities, which create additional energy levels in the band gap of TiO2 and, consequently, decrease the minimum energy required for the excitation of electrons.
Figure 3a shows that the calcination temperature strongly affects the UV–vis spectra of synthesized TiO2-N samples. This effect was considered by the integration of difference spectrum between TiO2-N and TiO2. The amount of light absorbed by the TiO2-N samples in the region of 380–550 nm had a dome-shaped dependence on the calcination temperature with a maximum at 400 °C (Figure 3b). This indicates that at low calcination temperatures, the samples absorb a small amount of light, but very high temperatures (550–600 °C) also result in weak light absorption. The samples are to be calcined at an optimal temperature (350–450 °C) to absorb the highest amount of light.
At the same time, Table 1 shows that the band gap and the minimum energy required for photoexcitation of TiO2-N samples have similar values over the whole range of temperatures. This means that the temperature of sample calcination in air has a low impact on the type of doping, but it strongly affects the amount of nitrogen impurities that are responsible for the absorption of visible light.
According to a previously published study [25], the mentioned absorption can result from the nitrogen species, which occupy the interstitial positions in the TiO2 lattice. To verify this hypothesis, X-ray photoelectron spectroscopy was used for the analysis of the nitrogen state in TiO2-N.
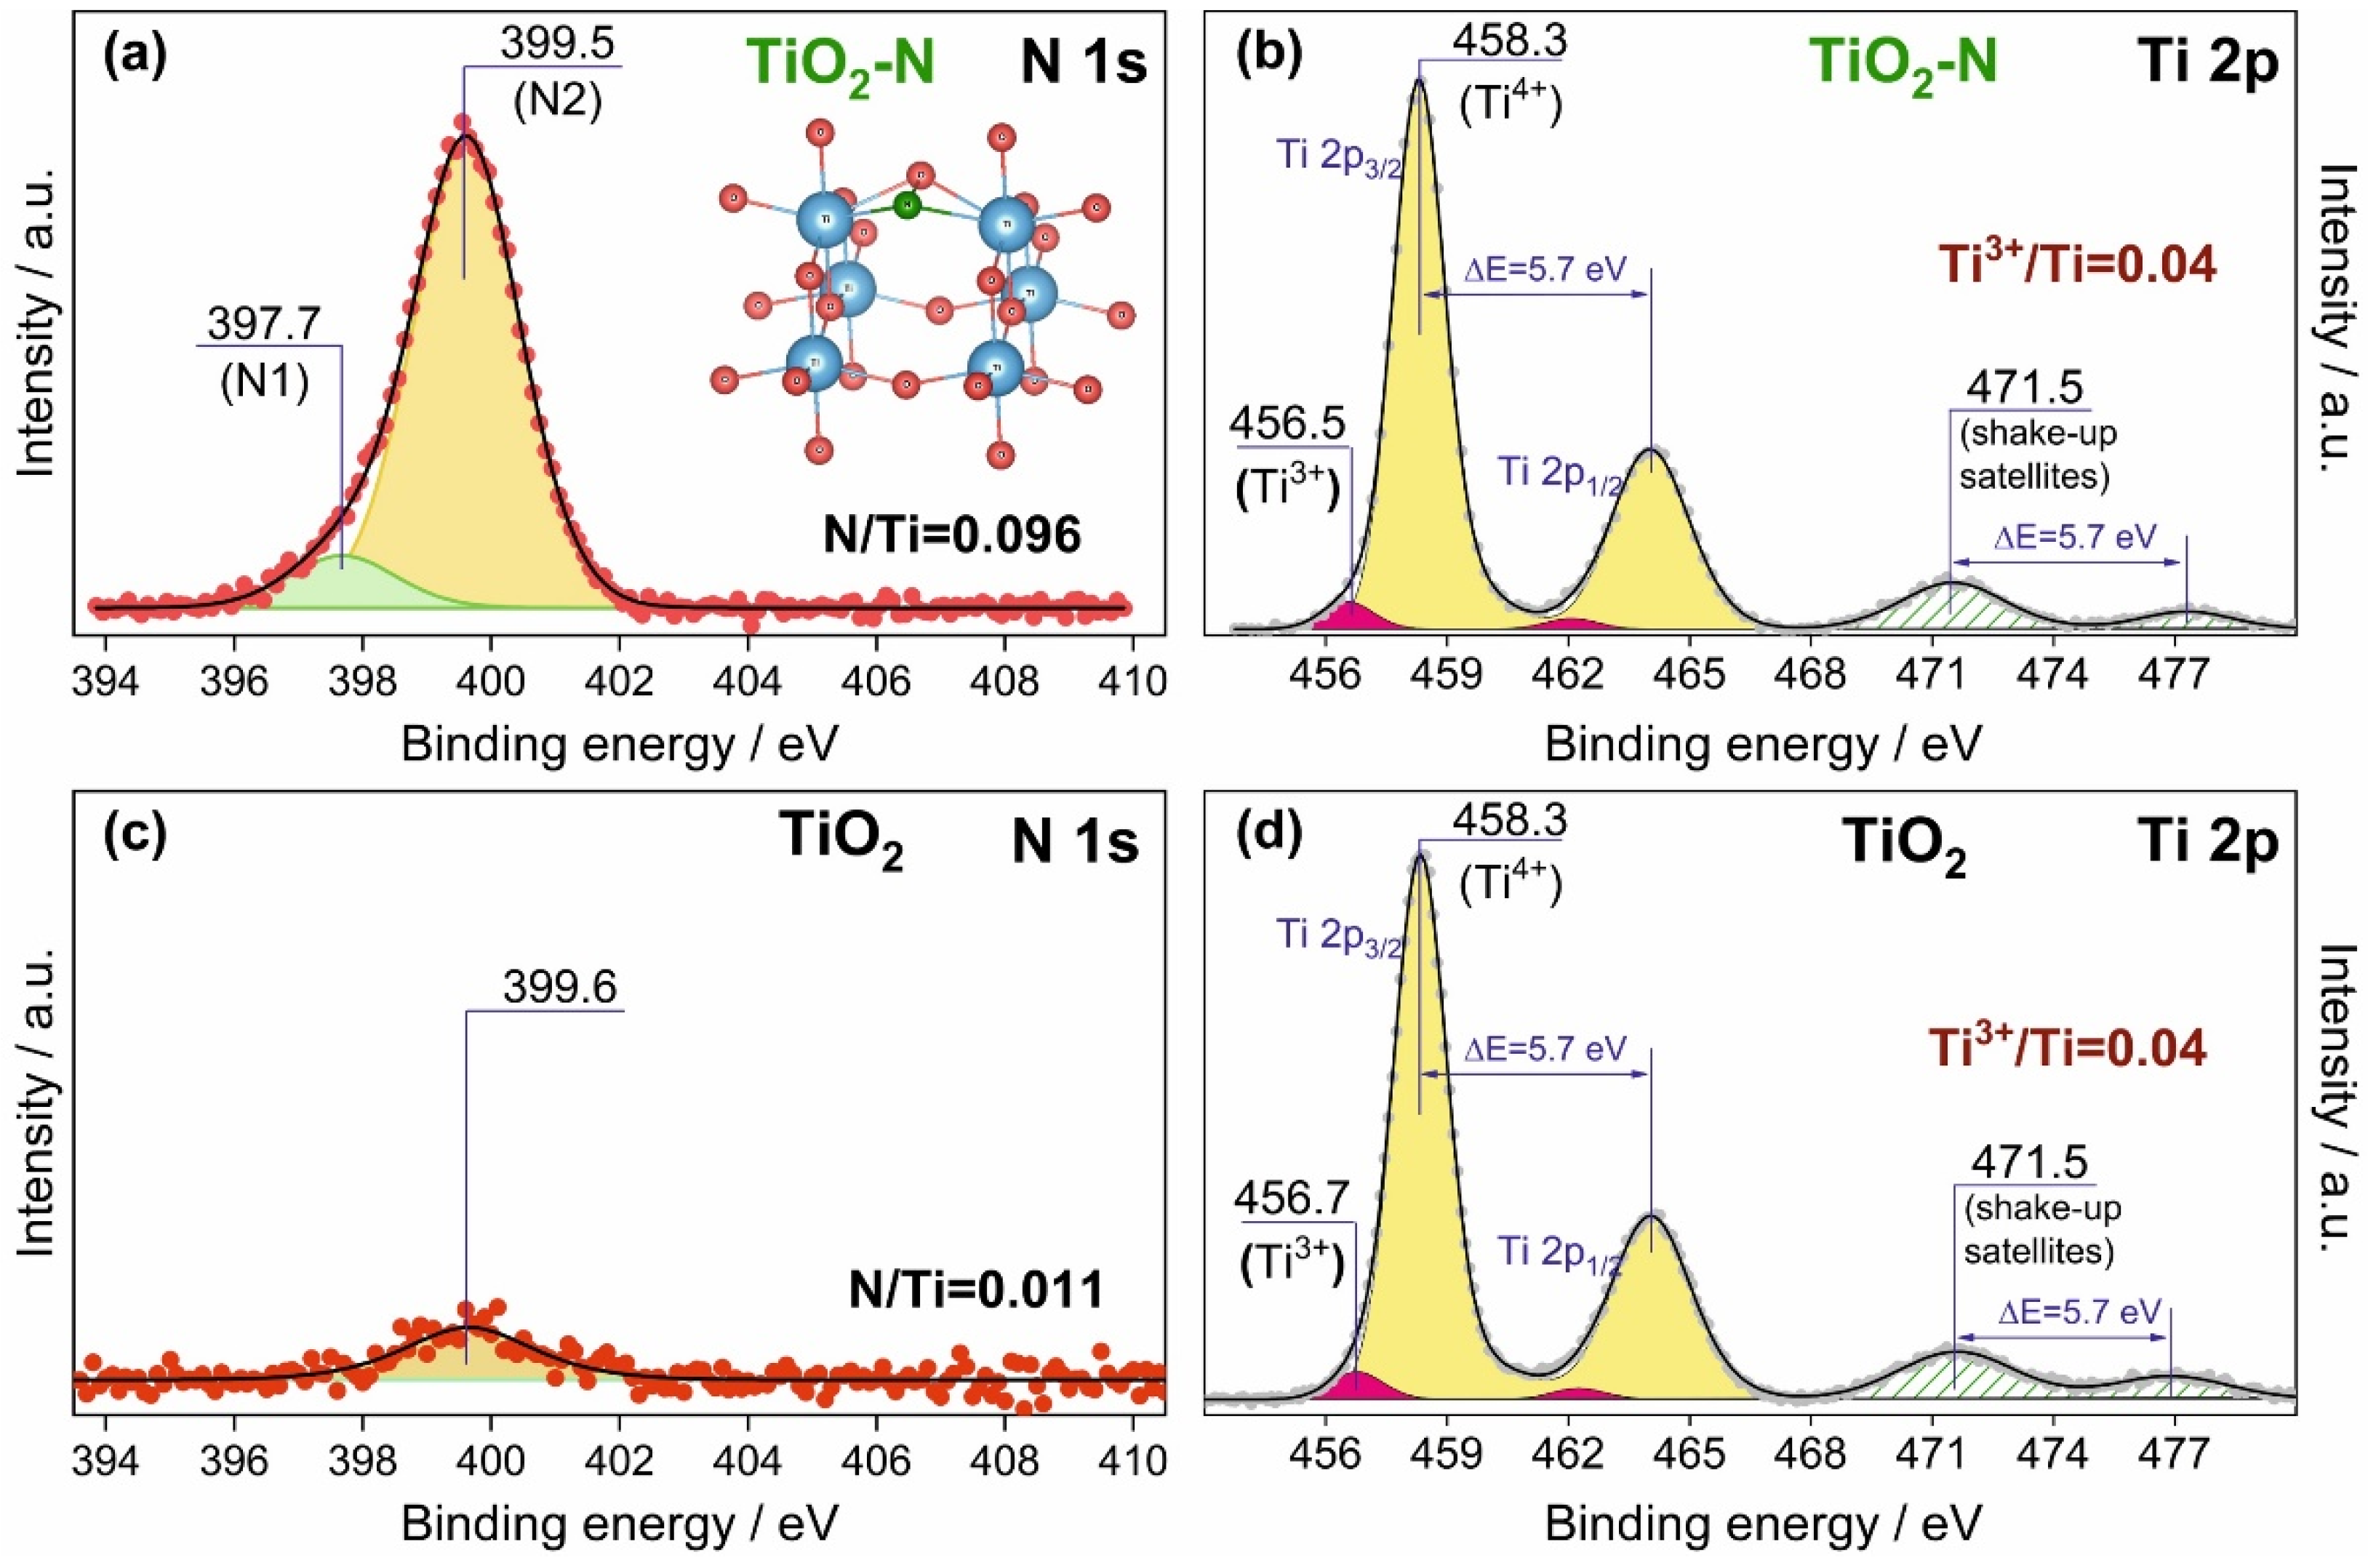
Figure 4a shows a typical photoelectron N 1s spectral region for the synthesized TiO2-N photocatalyst. This N 1s spectrum can be fitted into two components with binding energies (BEs) of 397.7 eV (N1 state) and 399.5 eV (N2 state). The N2 state gives a contribution higher than 90%. Commonly, the BE (N 1s) in the range of 396–398 eV can be attributed to negatively charged forms of nitrogen, which substitute lattice oxygen in the TiO2 structure (i.e., located in the substitutional positions) [57,58,59,60]. A variation in BE for this type of nitrogen can be attributed to the localization of nitrogen (on the surface/in the bulk) [61] and its additional bonding with oxygen [62]. The N2 state with a BE (N 1s) of 399.5 eV might be attributed to weakly charged nitrogen species, which result from the interactions of nitrogen with C, H, O atoms [36,63,64], or to partially oxidized nitrogen located in the interstitial positions of the TiO2 lattice [65,66,67]. According to a computer simulation study [24], the difference between the BE values for nitrogen in substitutional and interstitial positions is 1.6 eV, which is close to the difference between the maximums of N 1s peaks attributed to the N1 and N2 components in our case (ΔE = 1.8 eV). This also supports the interpretation of the detected N1 and N2 states. Notably, the chemical state of nitrogen in nitrites ( NO 2 ) and nitrates ( NO 3 ) is characterized by a BE (N 1s) value higher than 403 eV. In our case, no bands in this region were detected in the N 1s spectrum of TiO2-N, which indicates the absence of nitrites and nitrates on the surface of the studied sample after vacuum treatment. Therefore, XPS analysis of the synthesized TiO2-N photocatalyst shows that nitrogen incorporated into interstitial positions of TiO2 gives the major contribution. It is important to note that a small peak at 399.6 eV was also observed in the N 1s spectral region of the TiO2 sample synthesized without the addition of ammonia (Figure 4c), but this low-intensity signal can appear due to nitrogen species in a support used for fixation of the sample in the spectrometer chamber.
Concerning the chemical state of titanium, the position of the Ti 2p3/2 peak in the photoelectron Ti 2p spectral region (Figure 4b) is characterized by a BE value of 458.3 eV, which corresponds well to the Ti4+ state in TiO2. The Ti 2p spectrum has a doublet structure due to spin-orbit splitting (ΔE = 5.7 eV), and corresponding shake-up satellites with ΔE ~ 13 eV are also observed. An additional component with a BE value of 456.5 eV appeared during the curve fitting of the Ti 2p spectrum and was attributed to traces of reduced Ti species (first, Ti3+) stabilized near structural defects [68,69]. The surface concentration of these Ti3+ species was no more than 4%. The TiO2 sample synthesized using NaOH as the precipitating agent had similar peaks in the Ti 2p spectral region and the same concentration of reduced Ti species (Figure 4d).
In addition to XPS analysis, the prepared photocatalysts were studied using the EPR technique. An EPR signal with a g-factor of 1.99 and dH = 3 mT was observed for the synthesized TiO2 sample, which had no nitrogen impurities. This signal was insensitive to irradiation of the sample with light. Kumar et al. [70] attributed the signal with similar parameters to localized electron centers (such as Ti3+) in the TiO2 lattice. The synthesized TiO2-N sample had the same signal under dark conditions. At the same time, exposure of this sample to blue light in situ during the registration of spectra led to a change in the form of the signal because three narrow lines appeared. This indicates the presence of additional types of paramagnetic centers in TiO2-N. Light allows an increase in the concentration of these centers up to saturation.
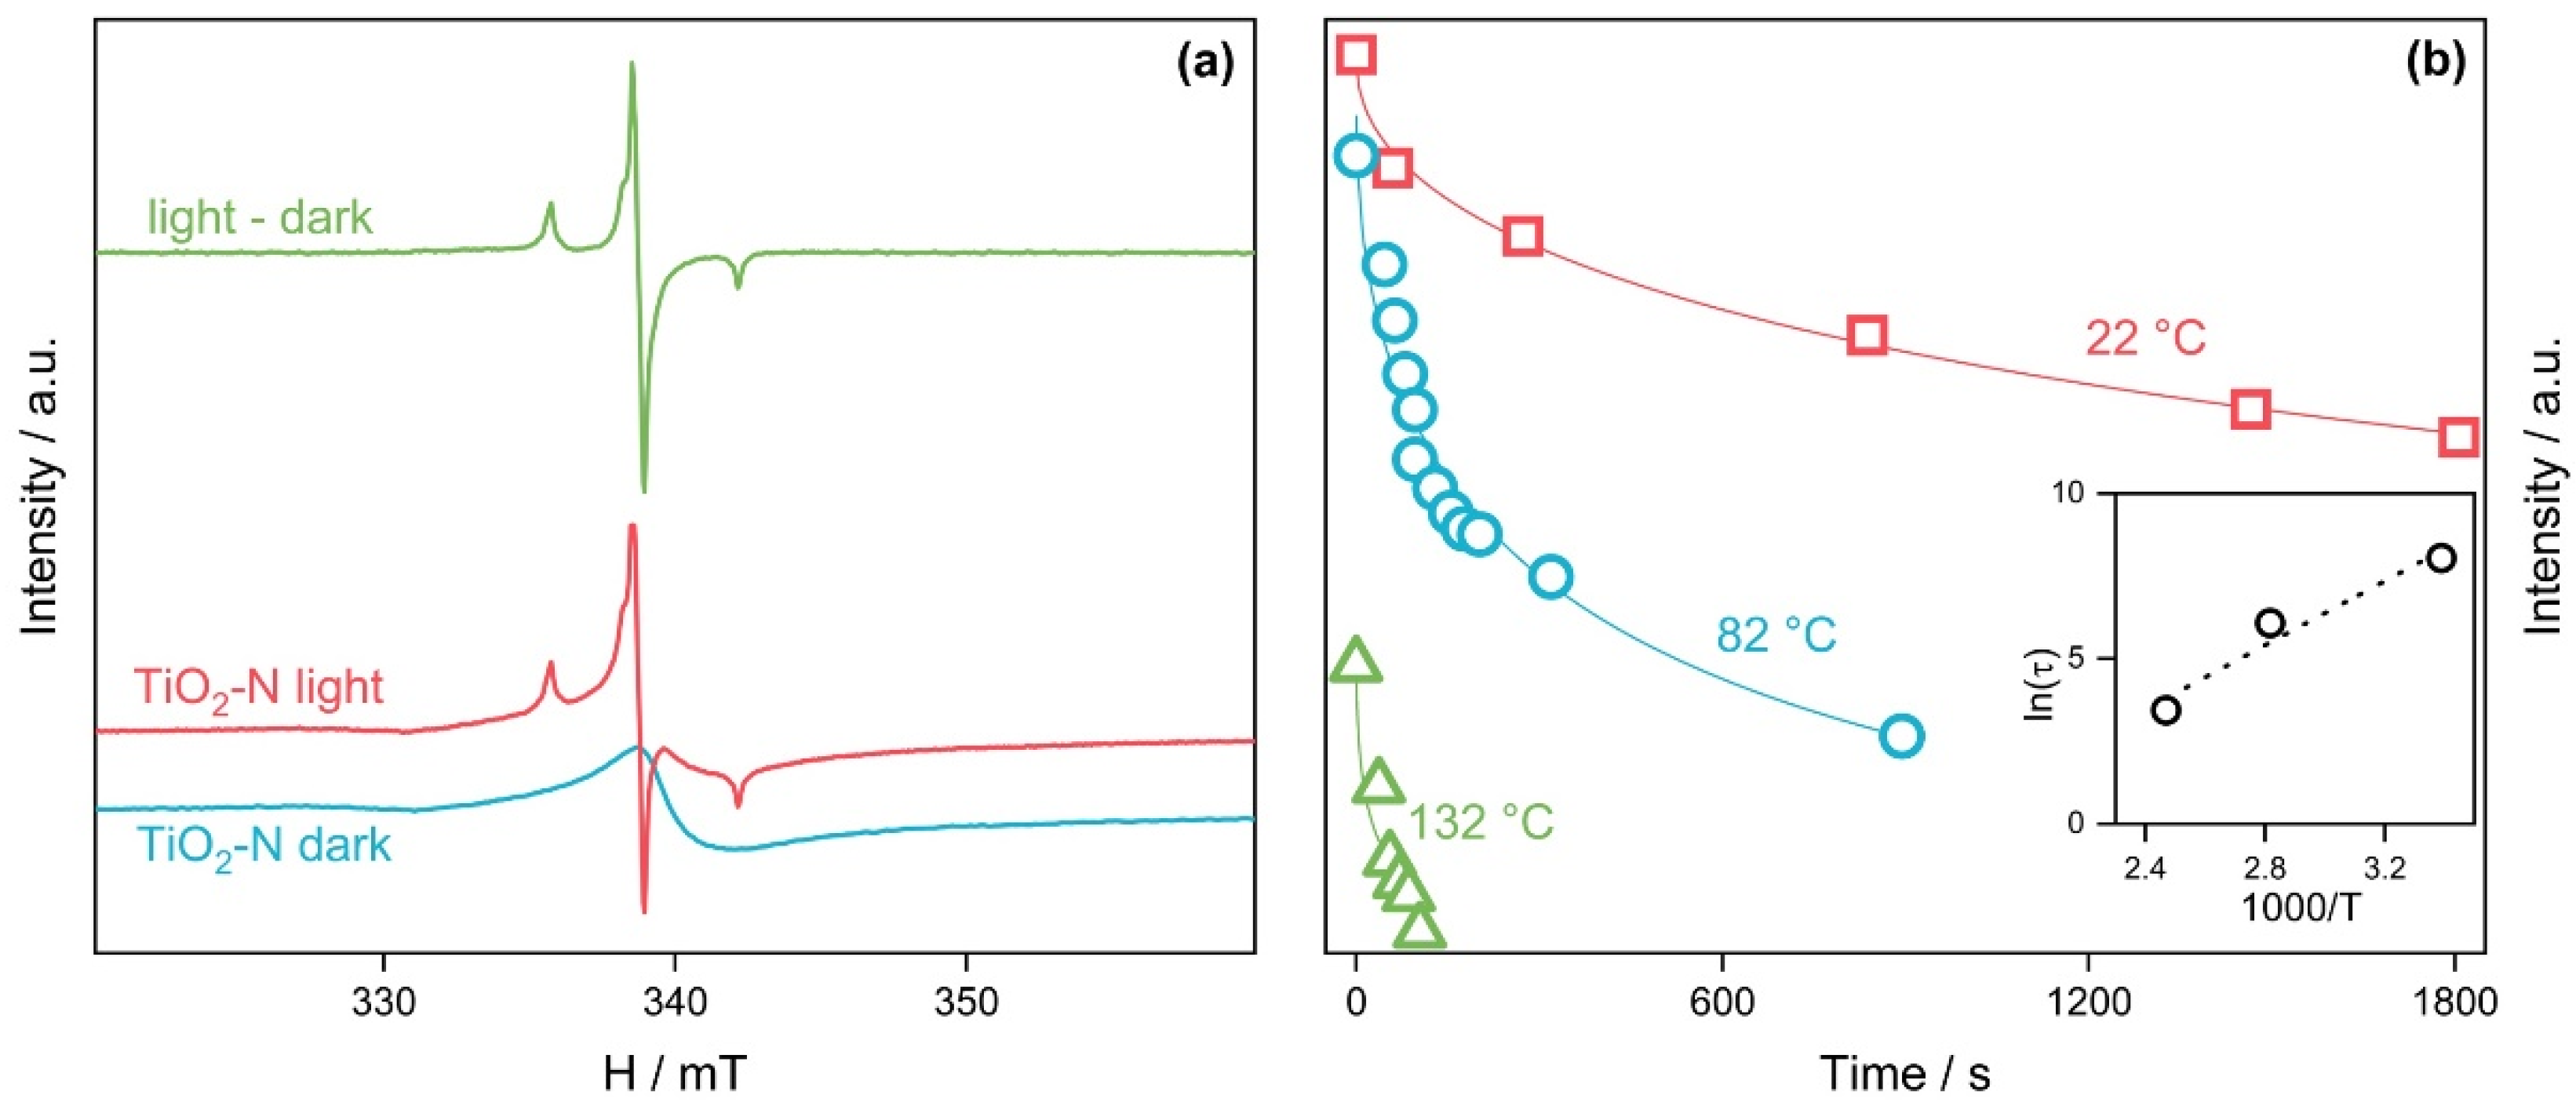
Figure 5a shows the EPR spectra of TiO2-N in the dark and under blue light. A difference spectrum, obtained via the subtraction of the dark spectrum from the spectrum under light, represents three lines with a hyperfine splitting of 3.22 mT that corresponds well to the nucleus of nitrogen. The parameters of the spectrum simulation are shown in Table 2. They agree with the literature data and can be attributed to N-based light-induced paramagnetic species.
It is important to note that the intensity of signals for these paramagnetic species decreased monotonically when the sample was kept in the dark. Figure 5b shows that the rate of decay increases as the temperature of the sample increases. The decay curves were analyzed using the stretched exponential function:
ξ I ( t ) = I 0 + A · e x p ( ( t / τ ) β )
where τ is the average decay time and β is the decay exponent, derived from the fact that the signal decay of photoinduced defects can be characterized by the distribution of time constants rather than a single constant, which is common for amorphous materials [71]. The value of the decay exponent β used in the estimation was 0.5. In this assumption, the lifetime has an activated behavior and can be described as τ ( T ) ~ exp ( Δ E / T ) [72]. A linearization in the Arrhenius coordinates gives an activation energy of 0.42 eV.
Summarizing the data of UV–vis, CHNS, XPS, and EPR techniques, the N-doped TiO2 synthesized from the TiOSO4 precursor using ammonia can absorb visible light due to the oxidized nitrogen species, which are localized in the interstitial positions in the TiO2 lattice.
Figure 6a shows that under UV and blue light irradiation, the synthesized TiO2-N can generate a current with a density up to 15 μA cm−2. These data indicate that photogeneration and interface transfer of charge carriers occur in TiO2-N under exposure to radiation of both spectral regions corresponding to intrinsic and extrinsic absorptions of light. In addition, the visible-light induced photocurrent of TiO2-N doubled when methanol was added to the electrolyte. An increased photocurrent in the presence of methanol can be attributed to an improved pathway of photogenerated holes due to their transfer from TiO2-N to the organic donor of electrons (i.e., methanol), which enhances the separation of charge carriers. The results of photoelectrochemical measurements confirm the formation of charge carriers that can participate in the redox transformations of organic compounds. It is important to note that in addition to an oxidative ability, the synthesized TiO2-N photocatalyst, supported with noble metals, can provide the photocatalytic evolution of molecular hydrogen from water. Details and kinetic curves of hydrogen evolution for TiO2-N supported with several metals are shown in Figure S3 in the Supplementary Materials.
Figure 6b shows the action spectra of TiO2 and TiO2-N samples as a function of photonic efficiency in the reaction of acetone oxidation on the basic wavelength of the LED source used for irradiation of photocatalysts. The spectra obtained correlate well to the absorption spectra of the studied samples (Figure 2a). The TiO2 sample synthesized without ammonia exhibits photocatalytic activity under UV light, while it only slightly utilizes visible light in the region up to 424 nm with extremely low efficiency. The TiO2-N sample exhibits a similar trend in the UV region, but the corresponding values of photonic efficiency are substantially higher than those for the TiO2 sample. For example, the photonic efficiencies of acetone oxidation under an LED with a basic wavelength of 367 nm were 69 and 33% for TiO2-N and TiO2, respectively. The lower activity of the TiO2 sample is probably due to strongly adsorbed Na+ ions, which can remain on the TiO2 surface after synthesis with NaOH. Sodium ions are well known to play the role of sites for the recombination of photogenerated charge carriers. In contrast to TiO2, N-doped TiO2 exhibits activity under visible light with wavelengths up to 525 nm. A local maximum of the activity of TiO2-N is observed at ca. 450 nm. It corresponds to the maximum in its absorption spectrum (Figure 2a). The value of photonic efficiency corresponding to this wavelength is found to be 3.8%.
Therefore, the formation of reactive oxygen species occurs on the irradiated surface of TiO2-N, and the formed species can oxidize adsorbed organic contaminants. Both types of data in Figure 6 show that the efficiency of light utilization by TiO2-N in the visible region is lower than that in the UV region, which is attributed to the region of fundamental absorption in TiO2. As mentioned in the Introduction, the content of UV light in the total solar radiation is low due to many photons corresponding to the visible region. The electricity-to-light efficiency of visible LEDs (e.g., blue LEDs) is substantially higher than the efficiency of UV LEDs. As a result, blue LEDs provide a substantially higher photon flux than UV LEDs at the same electric power. Thus, in the cases of both natural and artificial light sources, a higher number of photons in the visible region compared to the UV region would provide an increased rate of photocatalytic reaction that can minimize the difference in the photocatalytic ability of TiO2-N under UV and visible light despite different values of efficiency. This indicates the potential of TiO2-N for application in visible-light-driven processes.
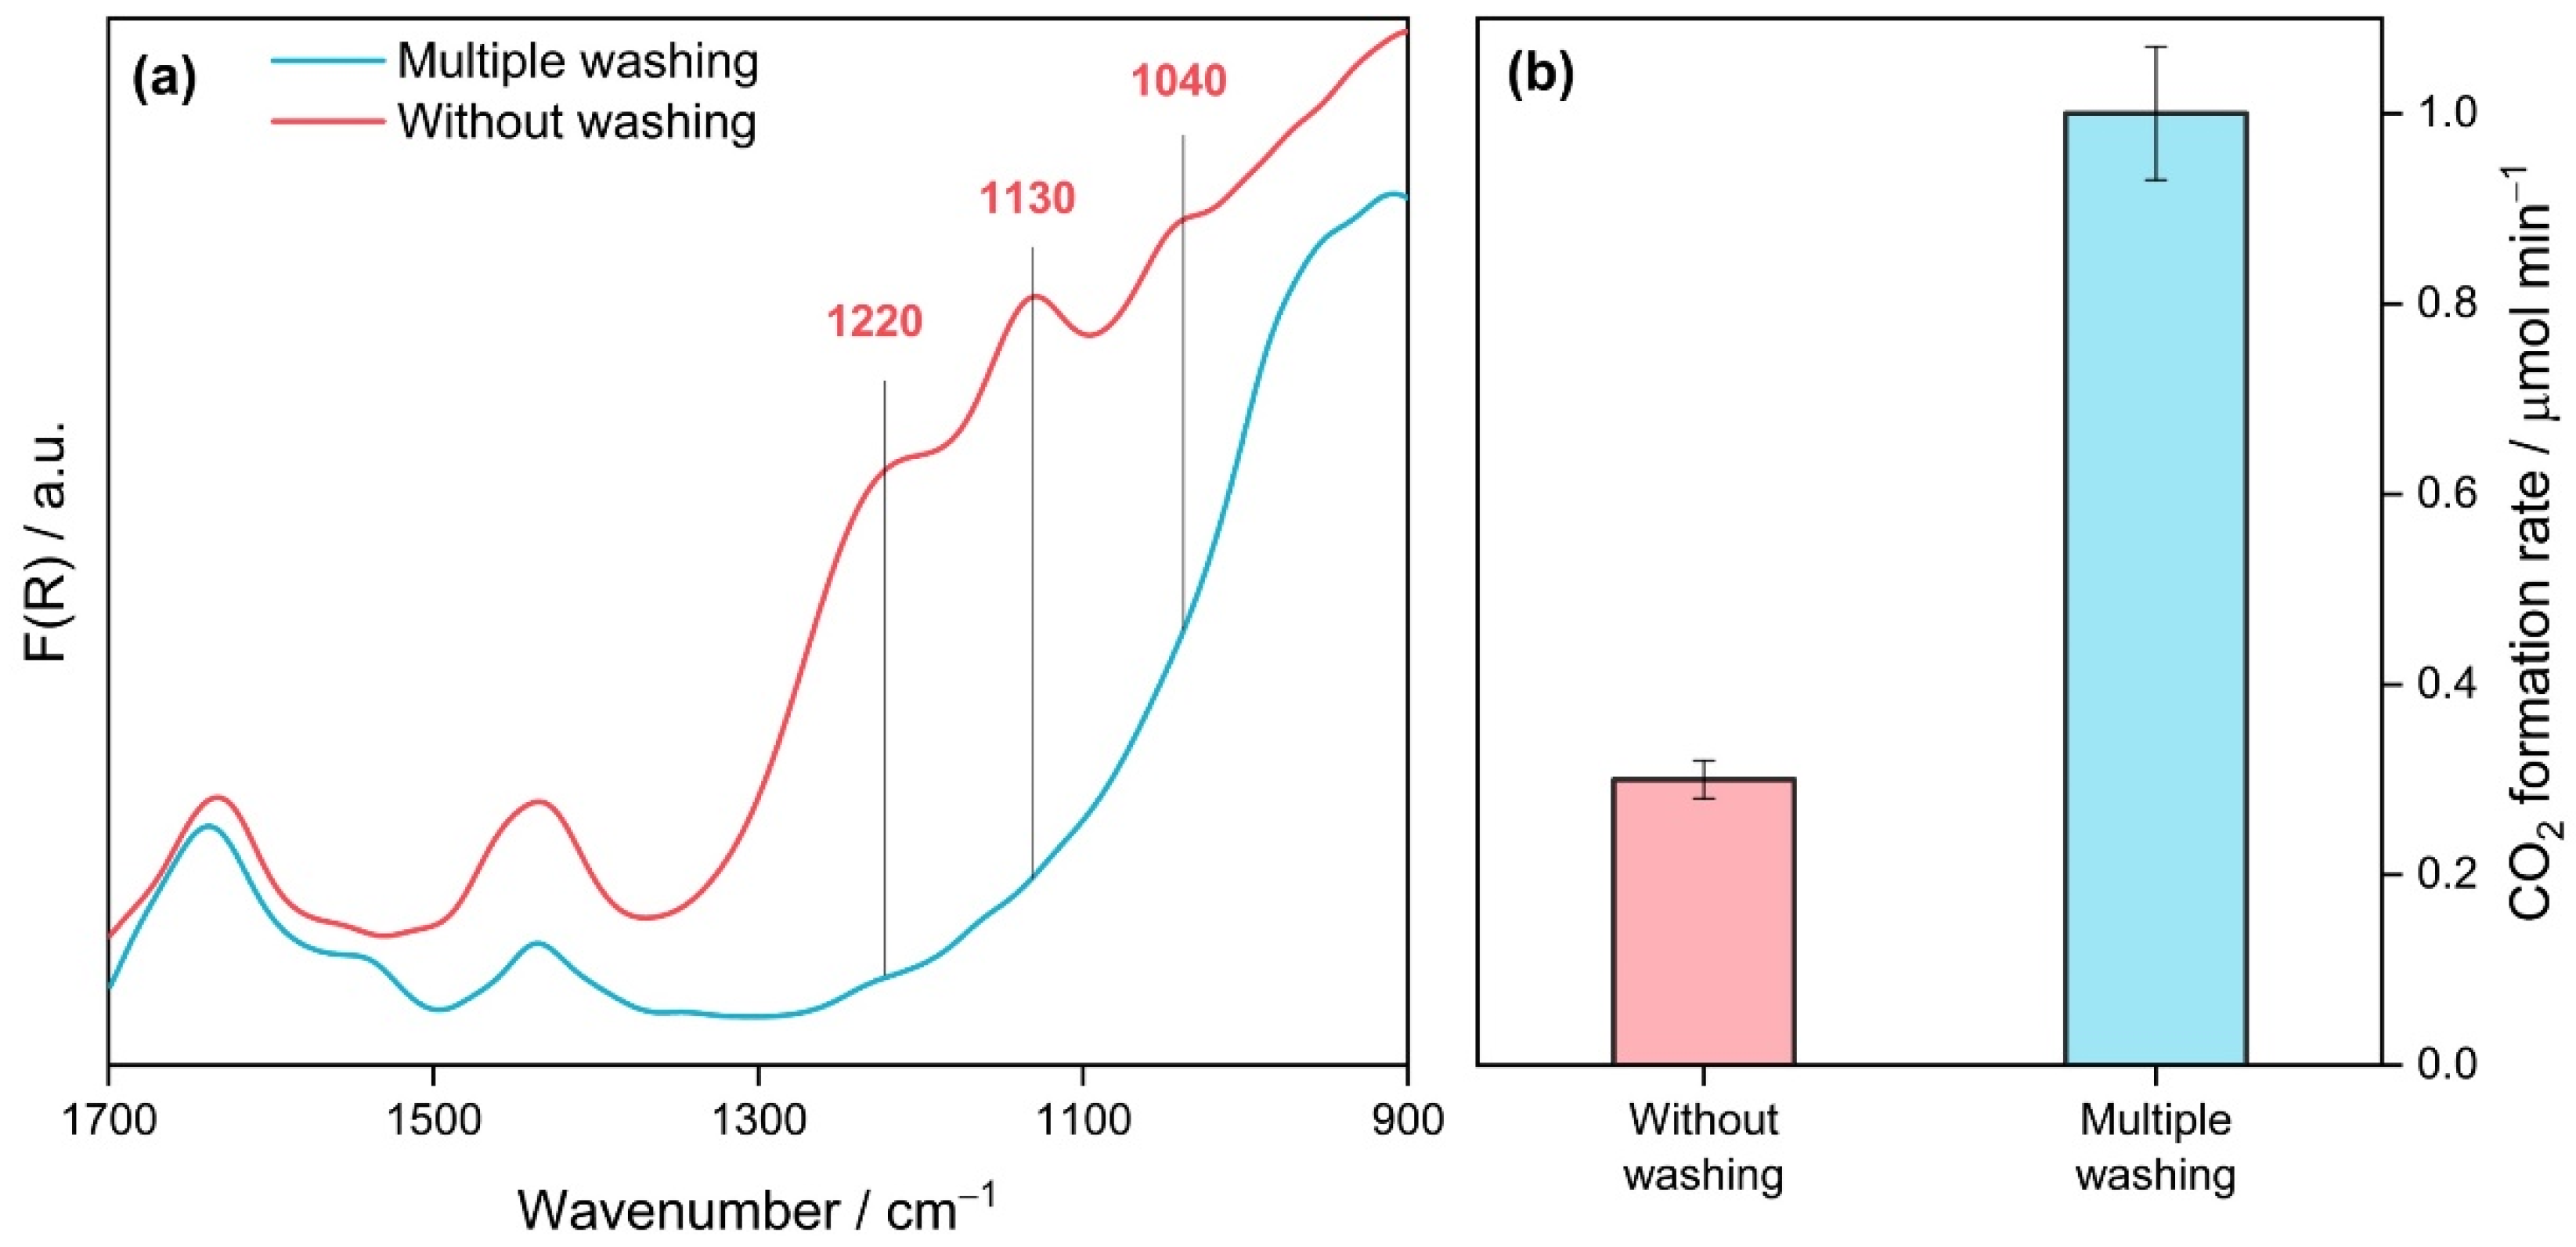
Before considering the effect of preparation conditions, it should be noted that one of the key steps during the synthesis of TiO2-N from the TiOSO4 precursor is washing titanium oxide hydrate after its precipitation due to a high amount of sulfur species in the precursor. For instance, Figure 7a shows the DRIFT spectra of two synthesized TiO2-N samples, which differ in washing procedure, and Figure 7b shows the steady-state photocatalytic activity of these samples in the oxidation of acetone vapor under blue light. Three intense absorption bands in the region of 1000–1300 cm−1 are clearly observed in the DRIFT spectrum of the sample prepared without washing (Figure 7a). These bands can be attributed to sulfates bonded to the surface of TiO2 [73]. This indicates that a high number of sulfates remain on the surface of photocatalysts prepared without or with poor washing because of a high affinity of the SO42−-group for Ti4+ sites [55]. An extremely low activity under visible light was observed for the sample prepared without intermediate washing of the precipitate (Figure 7b).
Otherwise, multiple washes of the precipitate before its calcination at a high temperature resulted in the removal of sulfates from the surface of the sample because the mentioned bands in the DRIFT spectrum vanished (Figure 7a). As shown in Figure 7b, this procedure led to a 3-fold increase in the visible-light activity of this sample. Thus, removing sulfur species after hydrolysis of the TiOSO4 precursor is important for the preparation of highly active photocatalysts using the proposed technique. At the same time, even multiple washed photocatalysts can have a high amount of residual sulfur. According to CHNS analysis, the S content in the final sample can be up to 4 wt.% depending on other preparation conditions, as will be discussed below. This is a reason that the photocatalytic activity of materials prepared from titanium oxysulfate of various suppliers can differ substantially from each other.
The temperature used for the calcination of precipitate formed after hydrolysis of TiOSO4 strongly affects the functional properties of synthesized TiO2-N. As shown in Figure 8a, the photocatalytic activity of TiO2-N samples under UV light increases monotonically as the calcination temperature increases. This behavior can be attributed to an enhancement in the crystallinity of samples that has a strong positive effect. An intense crystallization of TiO2 during the increase in the calcination temperature of samples from 250–300 °C to 350 °C would be a reason for the substantial increase in their activities. As mentioned above, a further increase in the calcination temperature increased the extent of crystallinity, which means a lower number of defects in the crystal lattice of TiO2. Defects in TiO2 are sites where the recombination of electrons and holes occurs. Therefore, a lower number of defects provides a lower rate of recombination and, consequently, a higher rate of photocatalytic reaction [74]. Comparing the best activity of TiO2-N samples under UV light (2.8 µmol min−1) with corresponding data for commercial photocatalysts TiO2 P25 (1.3 µmol min−1) and KC (2.3 µmol min−1) under similar conditions, TiO2-N provides the highest oxidation rate in the studied test reaction. This suggests that the proposed preparation technique facilitates the production of highly active photocatalysts for processes driven under UV light (e.g., for conventional photocatalytic air purifiers equipped with UV light sources).
A different pattern was observed in the case of acetone oxidation under blue light. Figure 8a shows that the visible-light activity of TiO2-N samples has a dome-shaped dependence on the calcination temperature. Similar to UV light, a substantial increase in the activity of samples was observed at a change in calcination temperature from 250–300 °C to 350 °C. This fact correlates with the crystal data of the samples (Figure 1a) and can be attributed to an intense crystallization of TiO2 in the mentioned range of temperatures. The visible-light activity slightly decreased in the temperature range of 350–500 °C, but it finally dropped down at the calcination temperature of 600 °C.
The visible-light activity of TiO2 photocatalysts prepared under reducing conditions is commonly attributed to the reduced states of titanium in the TiO2 lattice (e.g., Ti3+) because the energy levels corresponding to these states are located lower than the CB of TiO2 [75,76,77]. According to the results of XPS and EPR analyses (Figure 4 and Figure 5), the prepared TiO2-N samples contain similar centers. We checked the effect of calcination temperature on the concentration of these centers using the EPR technique. Figure 8b shows a change in the intensity of the EPR signal with a g-factor of 1.99, attributed to Ti3+ centers, when the calcination temperature is changed from 250 °C to 600 °C. This plot clearly indicates that the photocatalytic activity of TiO2-N under visible light does not correlate with the concentration of localized electron centers Ti3+ because the intensity of the mentioned signal after 350 °C has a similar level and does not decrease even at 600 °C. This confirms that the visible-light activity of TiO2-N cannot be attributed completely to the Ti3+ states.
However, the visible-light activity does not also correlate with the total content of nitrogen in the prepared samples. As shown in Table 1, the nitrogen content decreases monotonically from 0.8 wt.% to the limit of detection as the calcination temperature increases from 250 °C to 600 °C. This means that not all nitrogen species in TiO2-N respond to visible-light activity. According to the analysis of DRIFT spectra, the uncalcined TiO2-N sample formed after mixing the reagents contains a large amount of ammonia adsorbed on the surface of TiO2, which results in a high value of nitrogen content as estimated using CHNS analysis. Calcination of the TiO2-N sample leads to the oxidation of ammonia. Various oxidized forms of nitrogen were detected on the surface of samples calcined at a low temperature. A discussion of nitrogen species on the surface of the photocatalyst based on the results of DRIFT analysis is provided in the Supplementary Materials (Figure S4). Therefore, it can be assumed that calcination leads to the transformation of some nitrogen species into a state that can provide a visible-light response and photocatalytic activity under visible light. The actual value of temperature affects the amount of target nitrogen species. This result agrees with the temperature dependence of light absorption shown in Figure 3b.
The EPR technique allows us to identify the paramagnetic nitrogen species. Figure 8b shows that the intensity of the EPR signal, attributed to the N-based light-induced paramagnetic species (see Table 2), also has a dome-shaped dependence on the calcination temperature with a maximum at 350–400 °C, which is similar to the plots of light absorption and visible-light activity mentioned above. A further increase in the calcination temperature leads to a monotonic decrease in the intensity of the EPR signal. For the sample calcined at 600 °C, the intensity decreases by almost two orders of magnitude compared to the maximum value. These data confirm that the nitrogen paramagnetic species respond to the activity of TiO-N photocatalysts under visible light.
Therefore, based on the results of characterization techniques, the existence of an optimum calcination temperature can be attributed to the incorporation of nitrogen in the TiO2 lattice at an increased temperature. This results in the creation of impurity energy levels in the TiO2 band gap and provides the absorption of light in the visible region of the spectrum. When the calcination temperature is too high, nitrogen is oxidized and removed from the structure. This leads to a decrease in the photocatalytic activity under visible light. It can be assumed that Ti3+ centers contribute to the photocatalytic activity under visible light, especially for the samples calcined at high temperatures.
Considering the highest activity of TiO2-N under blue light (1.2 µmol min−1) with the corresponding data for the commercial photocatalysts TiO2 P25 (0.03 µmol min−1) and TiO2 KC (0.07 µmol min−1) under similar conditions, TiO2-N provides the highest oxidation rate in the studied test reaction. This proves that the proposed preparation technique allows the production of highly active N-doped TiO2, which is able to perform photocatalytic processes under both UV and visible light. As additional benchmarks, Table S2 in the Supplementary Materials shows a comparison of the visible-light photocatalytic activity of synthesized TiO2-N with other TiO2-N photocatalysts described in previously published papers.

3.2. Enhancement of Stability Via Surface Modification

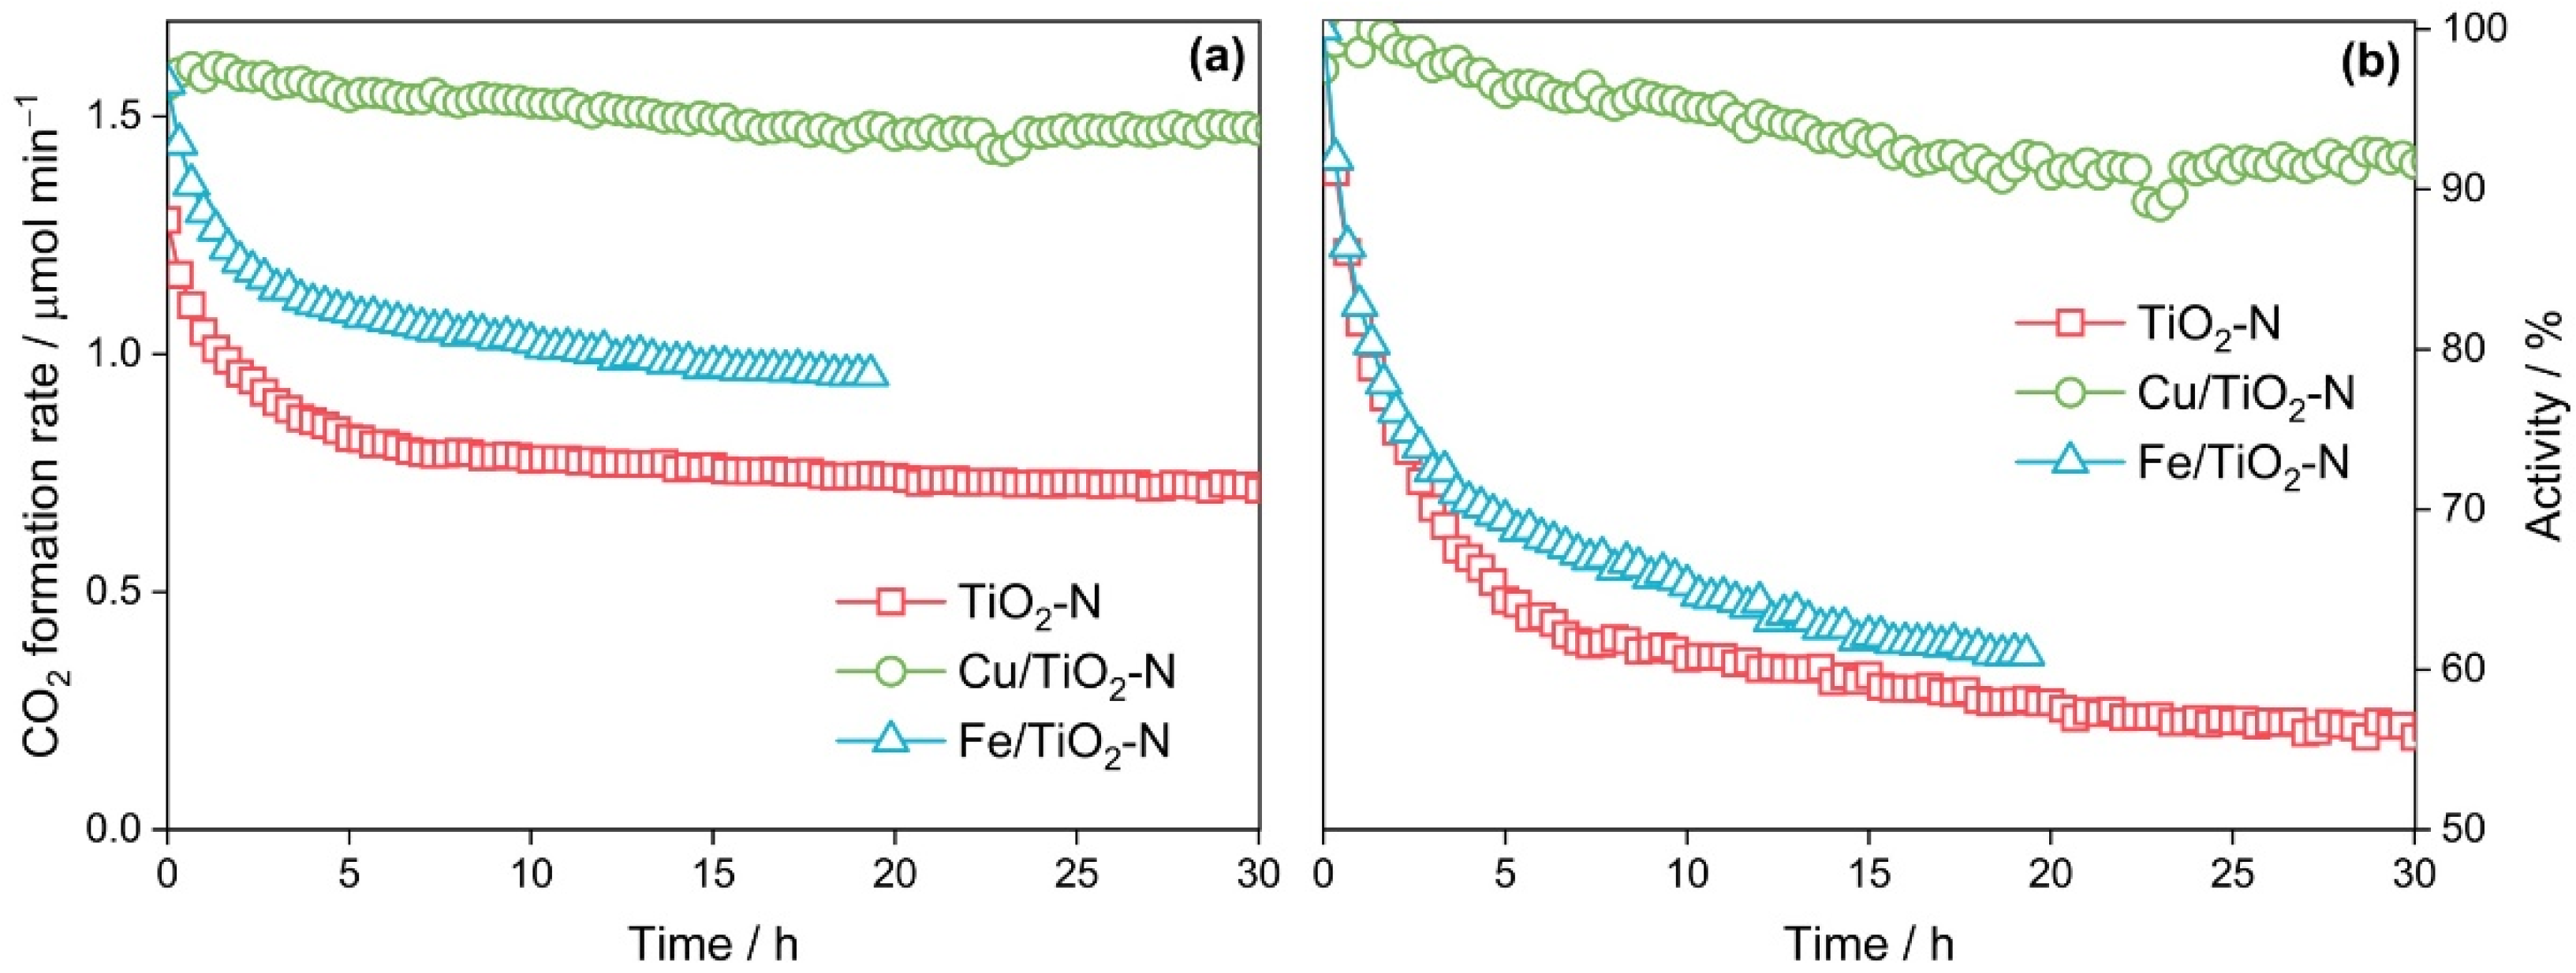
The stability of photocatalysts under long-term irradiation is an important requirement for practical applications. One of the drawbacks of pristine TiO2-N is that its initial activity decreases gradually under long-term exposure to high power radiation. Under the conditions of this study (blue light, 164 mW cm−2), the rate of acetone oxidation over TiO2-N decreased by 40% after irradiation for 6 h and by 5% more after irradiation for an additional 24 h (Figure 9).
According to a previously published study [78], this deactivation occurs due to the degradation of nitrogen species by photogenerated holes, which do not migrate to the surface of the photocatalyst. In our case, this was confirmed by a decrease in the intensity of nitrogen signals in XPS and EPR spectra for the sample studied after the stability test. The intensity of the EPR signal attributed to nitrogen decreased by 66% after the experiment on stability, which indicates a partial degradation of visible-light responsive nitrogen species by the photogenerated holes. However, after the period mentioned above (i.e., 30 h), the visible-light activity of TiO2-N reached a permanent level and did not change substantially under further irradiation.
Recently, we have shown [79] that the combination of TiO2-N with a Bi2WO6 semiconductor can provide a nanocomposite photocatalyst, which maintains a high level of activity even under high power radiation. Herein, we show another example of the modification of TiO2-N to enhance its stability under long-term exposure to power radiation. It is a simple modification of TiO2-N with copper species.
Copper species were deposited on the surface of TiO2-N via the impregnation method. A Cu loading of 1 wt.% was selected as an optimum value based on the results of a preliminary study concerning the effect of Cu content on the activity [80]. Cu-modified TiO2-N was studied using XRD, XPS and EPR techniques. There was no substantial difference between the XRD patterns of the pristine and Cu-modified TiO2-N samples probably due to the low Cu content. Figure 10a,b shows the Cu 2p and Cu LMM spectral regions of the synthesized Cu/TiO2-N sample. The absence of noticeable shake-up satellites in the region of 938–945 eV in the Cu 2p spectrum indicates a reduced state of copper, excluding Cu2+ [81]. The position of the Cu 2p3/2 peak near 932.5 eV indicates the possibility for the presence of copper in the form of Cu0 or Cu1+ [82]. For accurate identification, the modified Auger parameter of copper (α’-Cu) was determined as the sum of the binding energy of the Cu 2p3/2 peak maximum and the kinetic energy of the Cu L3M45M45 maximum. The estimated value of the α’-Cu parameter was 1847.8 eV, which corresponds well to the Cu1+ state [83]. However, the EPR spectra of Cu/TiO2-N in Figure 10c,d show a prominent signal at g = 2.1 corresponding to Cu2+ ions in octahedral coordination [84,85].
A contradiction in the XPS and EPR data may be due to the reduction of copper species under X-ray radiation and the high stability of the Cu1+ state on the surface of TiO2 [86]. The pretreatment of the sample with X-ray radiation for 1 h was necessary to obtain high-quality XPS spectra. This pretreatment could reduce all copper species on the TiO2-N surface to the Cu1+ state, while the vacuum conditions did not allow Cu to be oxidized back to the Cu2+ state. On the other hand, Cu1+ species cannot be detected using the EPR technique because they are diamagnetic. As a result, only the Cu2+ state is detected in the EPR spectra. According to a previously published study [87], many different states of copper (Cu0, CuxO, Cu2+) can be found on the surface of TiO2, and the ratio between these states can be substantially changed under radiation. This confirms the possibility of various copper species on the surface of TiO2-N.
Iron species were used as a counterexample to copper species because it is well known that the energy levels of Fe3+/Fe2+ species grafted at the TiO2 surface are located slightly lower than the CB minimum of TiO2 and, consequently, can participate in the transfer of photogenerated electrons only [88,89]. Fe content of 0.1 wt.% was selected as an optimum value based on the results of a preliminary study concerning the effect of Fe content on the activity (see Figure S5 in the Supplementary Materials). Reversible transfer between the charge states of Fe3+ and Fe2+ commonly occurs in photocatalytic reactions catalyzed by Fe/TiO2 in the presence of oxygen. In our case, XPS analysis of the synthesized Fe/TiO2-N sample shows only the Fe2+ state (see Figure S6 in the Supplementary Materials). This situation is similar to the case of the copper species discussed above. A partial reduction of iron species until the Fe2+ state occurs under X-ray irradiation under vacuum conditions during the analysis. The absence of oxygen prevents the reoxidation of Fe2+ to Fe3+.
Figure 9a shows the effect of TiO2-N modification with iron and copper species on the visible-light activity and stability of the photocatalyst. The surface modification of TiO2-N with iron increased its initial activity by 30%. This effect is commonly attributed to an enhanced separation of charge carriers due to the localization of electrons in Fe species on the surface of the photocatalyst. However, the time dependence of the activity for Fe-modified TiO2-N is similar to that for pristine TiO2-N. The activity of Fe/TiO2-N decreased by 39% after irradiation for 19 h, which is close to the data for TiO2-N (Figure 9b). This behavior can be explained by the fact that iron species can capture electrons from TiO2-N, but they have a low effect on the transfer of photogenerated holes [90]. Therefore, no enhancement in the stability of TiO2-N is observed upon its modification with iron species.
A similar increase in the initial activity of TiO2-N (~30%) was also observed upon modification with copper species. However, in contrast to iron, the visible light activity of Cu-modified TiO2-N did not change substantially during long-term irradiation. The total decrease in the activity after 30 h of irradiation was lower than 10% (Figure 9b). According to the XPS data, no changes in the states of nitrogen and copper were found. According to the EPR data, no changes are also observed for the state of nitrogen paramagnetic species, but the intensity of the corresponding signal decreased compared to the initial value. However, the decrease in the signal intensity was only 33%, which is much lower than the corresponding value (66%) for pristine TiO2-N. The data discussed above allow us to assume that copper species affect the pathway of holes. As a confirmation of this statement, we have previously studied the action spectrum of Cu-grafted TiO2 and showed that this photocatalyst exhibits activity in the region up to 500 nm only, which may indicate interfacial charge transfer from TiO2 to CuxO clusters as the major pathway of photoexcitation in the concerned system under visible light [80]. This means that the energy levels of copper species are located above the VB of TiO2, and they can participate in the interfacial charge transfer from the nitrogen levels in TiO2.
Based on the experimental results and literature data, it can be assumed that copper species enhance the transfer of photogenerated holes and their localization on the surface of TiO2-N, as well as further interfacial transfer to electron donors. If the transfer of holes is considered as the bottleneck of oxidation processes [6], an enhanced hole transfer would improve the rate of the whole process and, consequently, decrease the probability of degradation of the nitrogen species in TiO2.
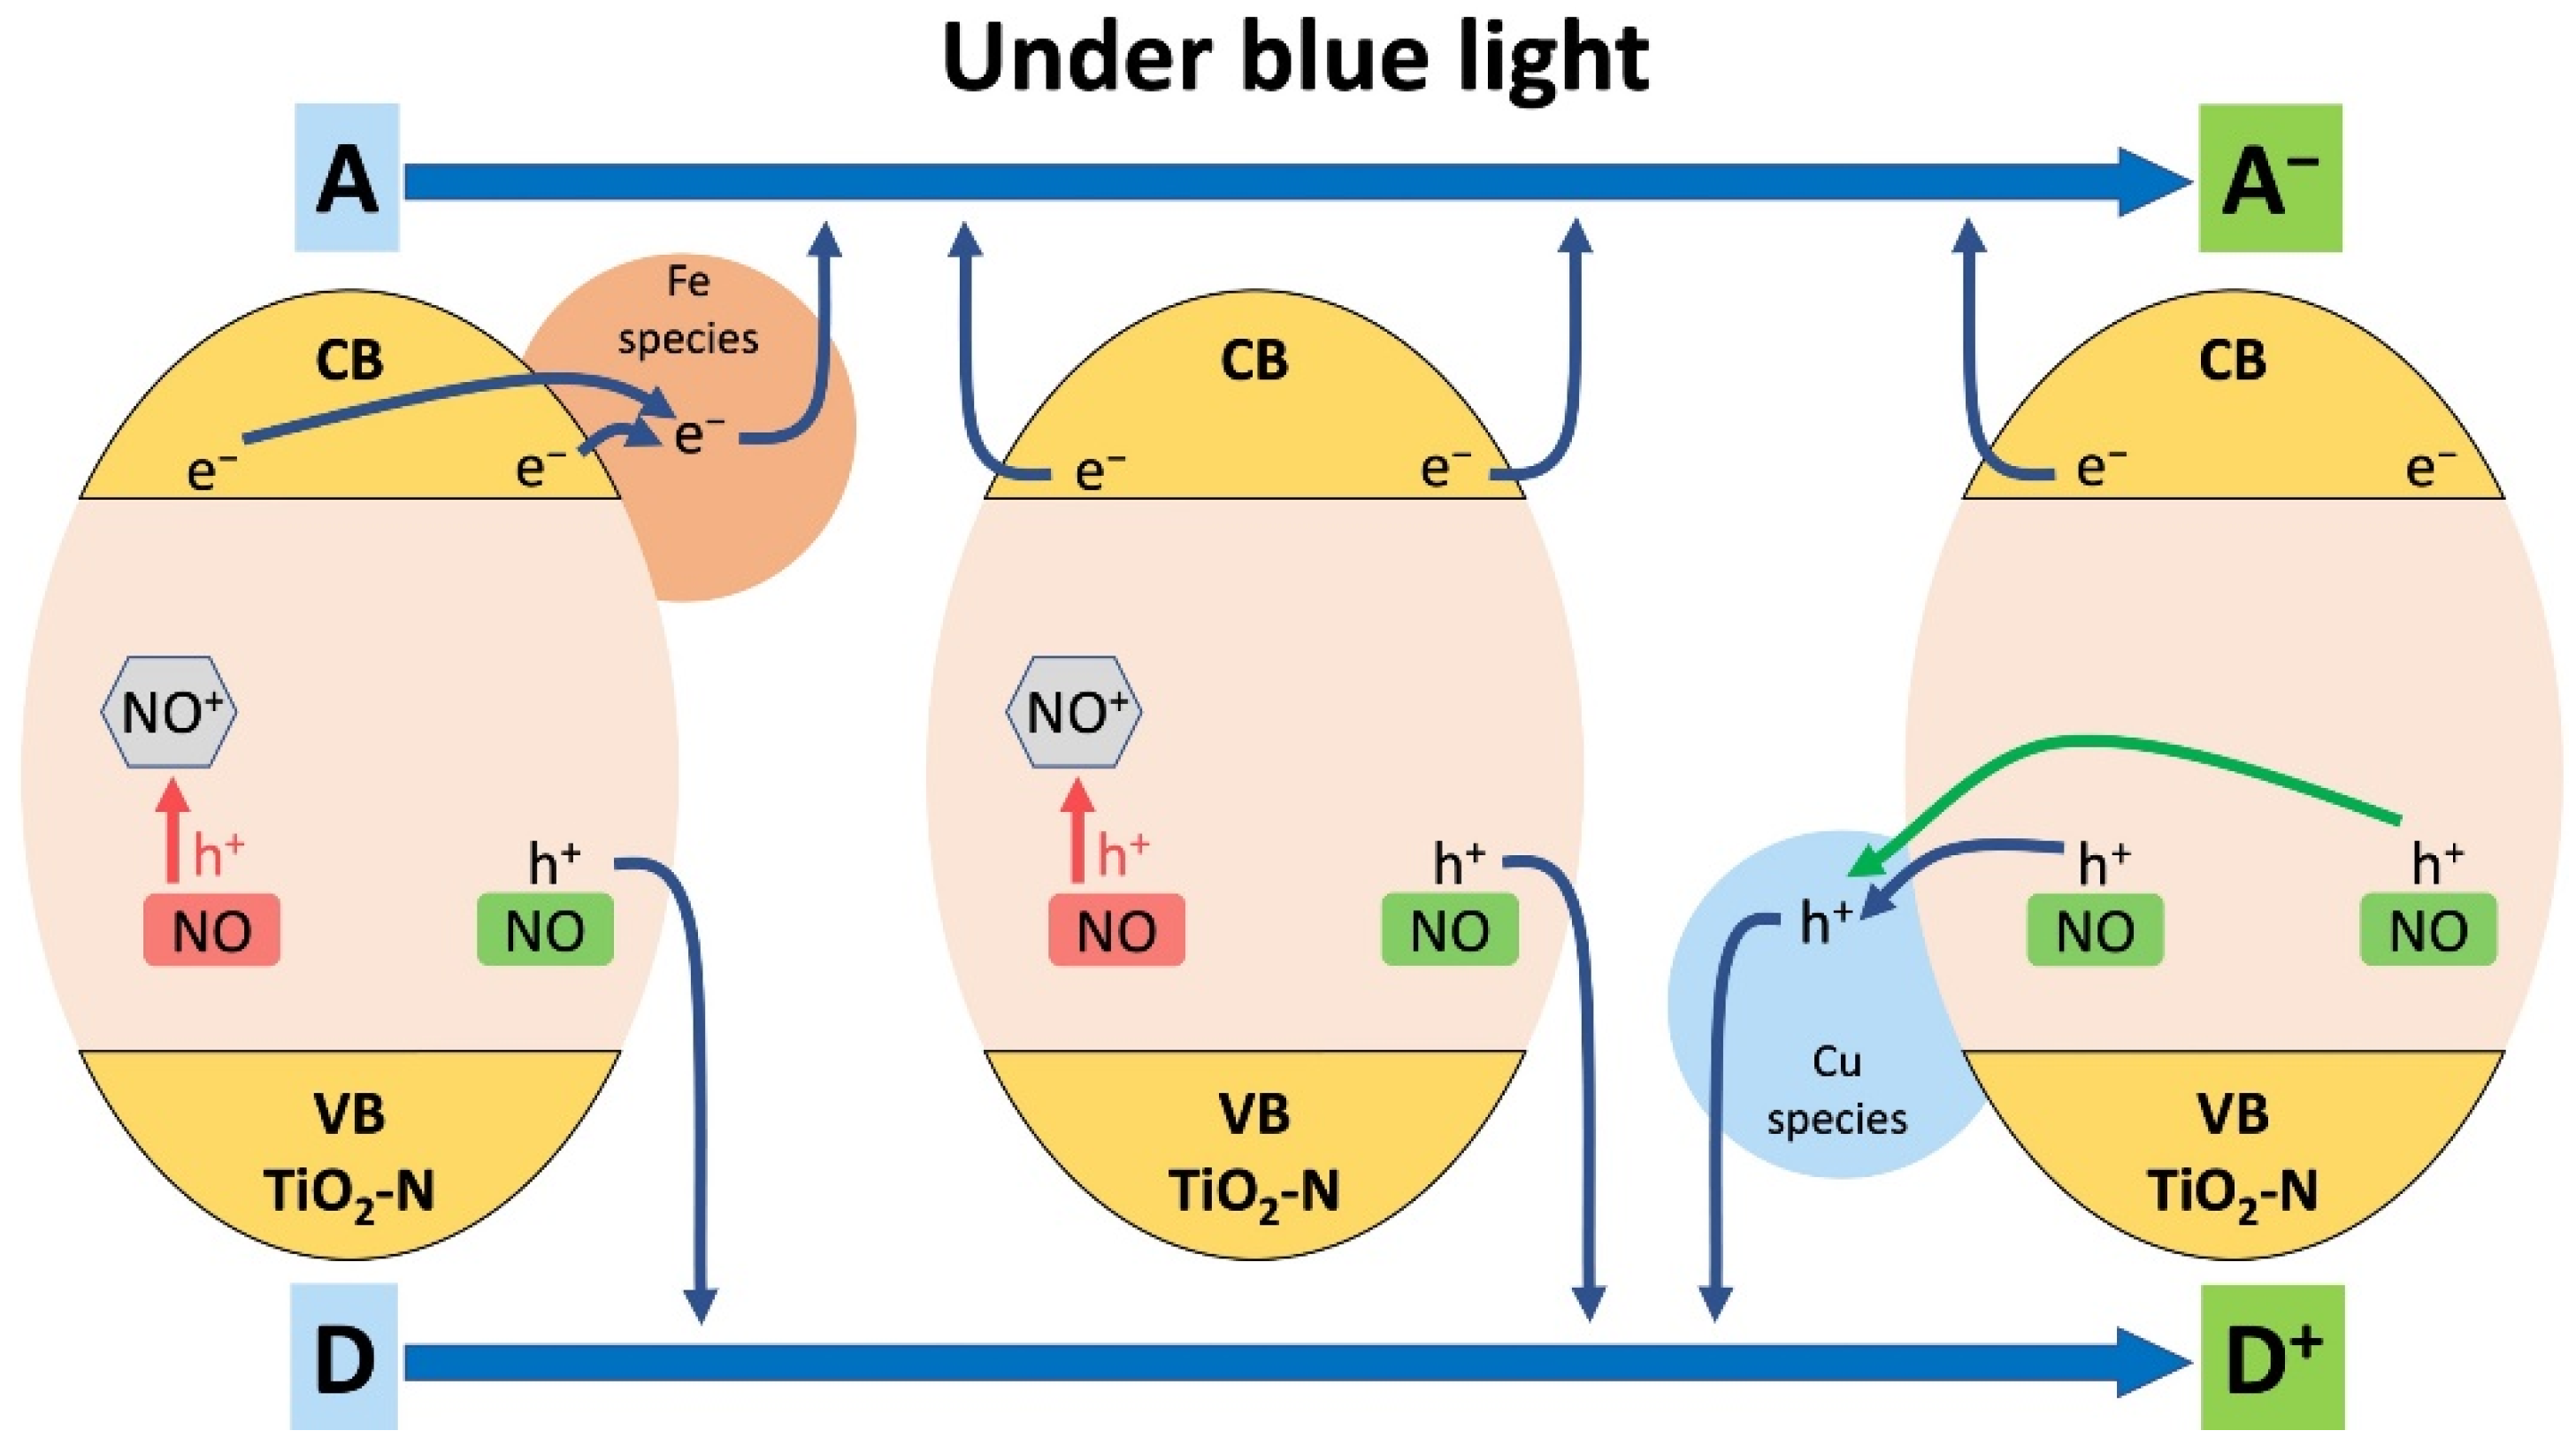
Figure 11 shows the proposed energy diagram, which illustrates the pathways of photogenerated charge carriers for all considered systems. Irradiation of TiO2-N results in excitation of electrons to the CB. These photogenerated electrons can further interact with an acceptor (A), resulting in its reduction (A). In the case of the Fe/TiO2-N system, the electrons can first transfer to the energy levels of Fe species and further interact with the acceptor. The photogenerated holes in both TiO2-N and Fe/TiO2-N systems can interact with a donor (D), resulting in its oxidation (D+). Localization of photogenerated holes in the energy levels of nitrogen species (NO) leads to their partial degradation and conversion to a non-paramagnetic form (NO+). However, in the case of the Cu/TiO2-N system, the photogenerated holes can first transfer to the energy levels of Cu species, thus reducing the degradation of nitrogen species (NO), and further interact with the donor (D), resulting in its oxidation (D+).
Highly active N-doped TiO2 photocatalysts with a visible-light response have potential in the design of nanocomposite materials with other semiconductors, which have a narrower band gap, for better utilization of visible light due to excitation of electrons in both components and realization of interfacial charge transfer according to the heterojunctions of favorable types. In this paper, we proposed a preparation technique that can be applied for the large-scale production of highly active and stable N-doped TiO2 for use in visible-light-driven processes.

4. Conclusions

Titanium oxysulfate (TiOSO4) can be successfully used as a low-cost inorganic precursor for the preparation of highly active photocatalysts sensitive to visible light. A pH-controlled precipitation of TiO2 from an aqueous solution of TiOSO4 using ammonia followed by the calcination of precipitate in air at an increased temperature results in the formation of nanocrystalline anatase, which can absorb radiation in the region up to 540 nm due to the presence of nitrogen impurities in TiO2. The as-prepared N-doped TiO2 photocatalyst can completely oxidize volatile organic compounds under UV and visible light in the corresponding region. The UV-light activity of N-doped TiO2 monotonically increases as the calcination temperature increases, which is attributed to an improvement in the crystallinity of TiO2. Otherwise, the visible-light activity has a dome-shaped dependence on the temperature with a maximum at 350–400 °C due to the removal of nitrogen species from TiO2 at higher temperatures. The absorption of visible light and visible-light activity of the prepared N-doped TiO2 correlate with the concentration of paramagnetic nitrogen species detected using the EPR technique. Residual sulfates on the surface of the photocatalyst can substantially decrease its visible-light activity; therefore, washing the precipitate is a key step during the synthesis of N-doped TiO2 from the TiOSO4 precursor. Copper species on the surface of N-doped TiO2 oppositely increase its activity under visible light and prevent intense deactivation under radiation of a high power that can be attributed to an enhanced transfer of charge carriers.

Supplementary Materials

The following supporting information can be downloaded at: https://www.mdpi.com/article/10.3390/nano12234146/s1, Figure S1: emission spectra of the diodes used for irradiation of photocatalysts (a,b) and a typical CO2 concentration profile during the photocatalytic experiment (c); Figure S2: experimental and fitted XRD patterns of the TiO2-N sample synthesized at 350 °C; Figure S3: photocatalytic evolution of hydrogen from pure water (a) and a methanol–water solution (b) over TiO2-N and TiO2 P25 modified with noble metals; Figure S4: DRIFT spectra of TiO2-N samples calcined at different temperatures in reflectance (a) and Kubelka-Munk (b) modes; Figure S5: effect of Fe content on the visible-light activity of Fe/TiO2-N; Figure S6: photoelectron Fe2p spectral region for 0.3% Fe/TiO2-N sample; Table S1: average crystallite sizes (D), strain values (ε), lattice constants (a and c), volumes of unit cell (V) for TiO2 and TiO2-N samples calcined at different temperatures; Table S2: visible-light activity of TiO2-N toward Aeroxide P25. References [91,92,93,94,95,96,97,98,99,100,101,102,103,104,105,106,107,108,109] are cited in the supplementary materials.

Author Contributions

Conceptualization, methodology, validation, investigation, visualization, writing—original draft preparation, N.K.; investigation, validation, writing—original draft preparation, D.S. (Dmitry Svintsitskiy); investigation, validation, S.C.; investigation, validation, S.Y.; resources, O.M.; investigation, S.S.; investigation, validation, E.G.; resources, supervision, D.K.; conceptualization, validation, resources, visualization, writing—original draft preparation, writing—review and editing, project administration, funding acquisition, D.S. (Dmitry Selishchev). All authors have read and agreed to the published version of the manuscript.

Funding

This study was funded by the Russian Science Foundation, grant number 20-73-10135.

Institutional Review Board Statement

Not applicable.

Informed Consent Statement

Not applicable.

Data Availability Statement

The data presented in this study are available on request from the corresponding author. The data are not publicly available due to privacy.

Acknowledgments

The research was performed using the equipment of the Center of Collective Use “National Center of Catalyst Research” at the Boreskov Institute of Catalysis. The authors thank Evgeny Koshevoy for help with the photoelectrochemical measurements.

Conflicts of Interest

The authors declare no conflict of interest. The funders had no role in the design of the study; in the collection, analyses, or interpretation of data; in the writing of the manuscript, or in the decision to publish the results.

References

  1. Yang, X.; Wang, D. Photocatalysis: From Fundamental Principles to Materials and Applications. ACS Appl. Energy Mater. 2018, 1, 6657–6693. [Google Scholar] [CrossRef]
  2. Cao, S.; Piao, L.; Chen, X. Emerging Photocatalysts for Hydrogen Evolution. Trends Chem. 2020, 2, 57–70. [Google Scholar] [CrossRef]
  3. Fujishima, A.; Honda, K. Electrochemical Photolysis of Water at a Semiconductor Electrode. Nature 1972, 238, 37–38. [Google Scholar] [CrossRef]
  4. Nakata, K.; Fujishima, A. TiO2 Photocatalysis: Design and Applications. J. Photochem. Photobiol. C Photochem. Rev. 2012, 13, 169–189. [Google Scholar] [CrossRef]
  5. Schneider, J.; Matsuoka, M.; Takeuchi, M.; Zhang, J.; Horiuchi, Y.; Anpo, M.; Bahnemann, D.W. Understanding TiO2 Photocatalysis: Mechanisms and Materials. Chem. Rev. 2014, 114, 9919–9986. [Google Scholar] [CrossRef]
  6. Fujishima, A.; Zhang, X.; Tryk, D.A. TiO2 Photocatalysis and Related Surface Phenomena. Surf. Sci. Rep. 2008, 63, 515–582. [Google Scholar] [CrossRef]
  7. Gaya, U.I.; Abdullah, A.H. Heterogeneous Photocatalytic Degradation of Organic Contaminants over Titanium Dioxide: A Review of Fundamentals, Progress and Problems. J. Photochem. Photobiol. C Photochem. Rev. 2008, 9, 1–12. [Google Scholar] [CrossRef]
  8. Selishchev, D.; Svintsitskiy, D.; Kovtunova, L.; Gerasimov, E.; Gladky, A.; Kozlov, D. Surface Modification of TiO2 with Pd Nanoparticles for Enhanced Photocatalytic Oxidation of Benzene Micropollutants. Colloids Surf. A Physicochem. Eng. Asp. 2021, 612, 125959. [Google Scholar] [CrossRef]
  9. Paz, Y. Application of TiO2 Photocatalysis for Air Treatment: Patents’ Overview. Appl. Catal. B 2010, 99, 448–460. [Google Scholar] [CrossRef]
  10. Selishchev, D.S.; Kolinko, P.A.; Kozlov, D.V. Adsorbent as an Essential Participant in Photocatalytic Processes of Water and Air Purification: Computer Simulation Study. Appl. Catal. A Gen. 2010, 377, 140–149. [Google Scholar] [CrossRef]
  11. Friedmann, D.; Mendive, C.; Bahnemann, D. TiO2 for Water Treatment: Parameters Affecting the Kinetics and Mechanisms of Photocatalysis. Appl. Catal. B 2010, 99, 398–406. [Google Scholar] [CrossRef]
  12. Guo, F.; Huang, X.; Chen, Z.; Shi, Y.; Sun, H.; Cheng, X.; Shi, W.; Chen, L. Formation of Unique Hollow ZnSnO3@ZnIn2S4 Core-Shell Heterojunction to Boost Visible-Light-Driven Photocatalytic Water Splitting for Hydrogen Production. J. Colloid Interface Sci. 2021, 602, 889–897. [Google Scholar] [CrossRef] [PubMed]
  13. Weon, S.; He, F.; Choi, W. Status and Challenges in Photocatalytic Nanotechnology for Cleaning Air Polluted with Volatile Organic Compounds: Visible Light Utilization and Catalyst Deactivation. Environ. Sci. Nano 2019, 6, 3185–3214. [Google Scholar] [CrossRef]
  14. Chen, D.; Cheng, Y.; Zhou, N.; Chen, P.; Wang, Y.; Li, K.; Huo, S.; Cheng, P.; Peng, P.; Zhang, R.; et al. Photocatalytic Degradation of Organic Pollutants Using TiO2-Based Photocatalysts: A Review. J. Clean. Prod. 2020, 268, 121725. [Google Scholar] [CrossRef]
  15. Verbruggen, S.W. TiO2 Photocatalysis for the Degradation of Pollutants in Gas Phase: From Morphological Design to Plasmonic Enhancement. J. Photochem. Photobiol. C Photochem. Rev. 2015, 24, 64–82. [Google Scholar] [CrossRef]
  16. Gao, M.; Zhu, L.; Ong, W.L.; Wang, J.; Ho, G.W. Structural Design of TiO2-Based Photocatalyst for H2 Production and Degradation Applications. Catal. Sci. Technol. 2015, 5, 4703–4726. [Google Scholar] [CrossRef]
  17. Chen, X.; Burda, C. The Electronic Origin of the Visible-Light Absorption Properties of C-, N- and S-Doped TiO2 Nanomaterials. J. Am. Chem. Soc. 2008, 130, 5018–5019. [Google Scholar] [CrossRef]
  18. Humayun, M.; Raziq, F.; Khan, A.; Luo, W. Modification Strategies of TiO2 for Potential Applications in Photocatalysis: A Critical Review. Green Chem. Lett. Rev. 2018, 11, 86–102. [Google Scholar] [CrossRef] [Green Version]
  19. Etacheri, V.; di Valentin, C.; Schneider, J.; Bahnemann, D.; Pillai, S.C. Visible-Light Activation of TiO2 Photocatalysts: Advances in Theory and Experiments. J. Photochem. Photobiol. C Photochem. Rev. 2015, 25, 1–29. [Google Scholar] [CrossRef] [Green Version]
  20. Yang, Y.; Fang, W.; Mi, Y.; Yan, J.; Li, X.; Shangguan, W. Enhanced Photocatalytic Overall Water Splitting by Tuning the Relative Concentration Ratio of Bulk Defects to Surface Defects in SrTiO3. Int. J. Hydrog. Energy 2022, in press. [Google Scholar] [CrossRef]
  21. Sato, S. Photocatalytic Activity of NOx-Doped TiO2 in the Visible Light Region. Chem. Phys. Lett. 1986, 123, 126–128. [Google Scholar] [CrossRef]
  22. Asahi, R. Visible-Light Photocatalysis in Nitrogen-Doped Titanium Oxides. Science 2001, 269, 269–271. [Google Scholar] [CrossRef] [PubMed]
  23. di Valentin, C.; Pacchioni, G.; Selloni, A. Origin of the Different Photoactivity of N-Doped Anatase and Rutile TiO2. Phys. Rev. B 2004, 70, 085116. [Google Scholar] [CrossRef]
  24. di Valentin, C.; Pacchioni, G.; Selloni, A.; Livraghi, S.; Giamello, E. Characterization of Paramagnetic Species in N-Doped TiO2 Powders by EPR Spectroscopy and DFT Calculations. J. Phys. Chem. B 2005, 109, 11414–11419. [Google Scholar] [CrossRef]
  25. di Valentin, C.; Finazzi, E.; Pacchioni, G.; Selloni, A.; Livraghi, S.; Paganini, M.C.; Giamello, E. N-Doped TiO2: Theory and Experiment. Chem. Phys. 2007, 339, 44–56. [Google Scholar] [CrossRef]
  26. Sato, S.; Nakamura, R.; Abe, S. Visible-Light Sensitization of TiO2 Photocatalysts by Wet-Method N Doping. Appl. Catal. A Gen. 2005, 284, 131–137. [Google Scholar] [CrossRef]
  27. Zhengpeng, W.; Wenqi, G.; Xiaoting, H.; Weimin, C.; Juhui, J.; Baoxue, Z. Preparation, Characterization and Visible Light Photocatalytic Activity of Nitrogen-Doped TiO2. J. Wuhan Univ. Technol. Mater. Sci. Ed. 2006, 21, 71–77. [Google Scholar] [CrossRef]
  28. Livraghi, S.; Paganini, M.C.; Giamello, E.; Selloni, A.; Di Valentin, C.; Pacchioni, G. Origin of Photoactivity of Nitrogen-Doped Titanium Dioxide under Visible Light. J. Am. Chem. Soc. 2006, 128, 15666–15671. [Google Scholar] [CrossRef]
  29. Huan, Y.; Xuxu, Z.; Zhongyi, Y.; Feng, T.; Fang, B.; Keshan, H. Preparation of Nitrogen-Doped TiO2 Nanoparticle Catalyst and Its Catalytic Activity under Visible Light. Chin. J. Chern. Eng. 2007, 15, 802–807. [Google Scholar]
  30. Cheng, X.; Yu, X.; Xing, Z.; Wan, J. Enhanced Photocatalytic Activity of Nitrogen Doped TiO2 Anatase Nano-Particle under Simulated Sunlight Irradiation. Energy Procedia 2012, 16, 598–605. [Google Scholar] [CrossRef] [Green Version]
  31. Gole, J.L.; Stout, J.D.; Burda, C.; Lou, Y.; Chen, X. Highly Efficient Formation of Visible Light Tunable TiO2-xNx Photocatalysts and Their Transformation at the Nanoscale. J. Phys. Chem. B 2004, 108, 1230–1240. [Google Scholar] [CrossRef]
  32. Ananpattarachai, J.; Kajitvichyanukul, P.; Seraphin, S. Visible Light Absorption Ability and Photocatalytic Oxidation Activity of Various Interstitial N-Doped TiO2 Prepared from Different Nitrogen Dopants. J. Hazard. Mater. 2009, 168, 253–261. [Google Scholar] [CrossRef] [PubMed]
  33. Yuan, J.; Chen, M.; Shi, J.; Shangguan, W. Preparations and Photocatalytic Hydrogen Evolution of N-Doped TiO2 from Urea and Titanium Tetrachloride. Int. J. Hydrog. Energy 2006, 31, 1326–1331. [Google Scholar] [CrossRef]
  34. Mrowetz, M.; Balcerski, W.; Colussi, A.J.; Hoffmann, M.R. Oxidative Power of Nitrogen-Doped TiO2 Photocatalysts under Visible Illumination. J. Phys. Chem. B 2004, 108, 17269–17273. [Google Scholar] [CrossRef]
  35. Cong, Y.; Zhang, J.; Chen, F.; Anpo, M. Synthesis and Characterization of Nitrogen-Doped TiO2 Nanophotocatalyst with High Visible Light Activity. J. Phys. Chem. C 2007, 111, 6976–6982. [Google Scholar] [CrossRef]
  36. Quesada-Cabrera, R.; Sotelo-Vázquez, C.; Quesada-González, M.; Melián, E.P.; Chadwick, N.; Parkin, I.P. On the Apparent Visible-Light and Enhanced UV-Light Photocatalytic Activity of Nitrogen-Doped TiO2 Thin Films. J. Photochem. Photobiol. A Chem. 2017, 333, 49–55. [Google Scholar] [CrossRef] [Green Version]
  37. Sathish, M.; Viswanathan, B.; Viswanath, R.P.; Gopinath, C.S. Synthesis, Characterization, Electronic Structure, and Photocatalytic Activity of Nitrogen-Doped TiO2 Nanocatalyst. Chem. Mater. 2005, 17, 6349–6353. [Google Scholar] [CrossRef]
  38. Sathish, M.; Viswanathan, B.; Viswanath, R.P. Influence of Heteroatom Doping of TiO2 Nanoparticle on the Red Shift and the Related Catalytic Activity. Int. J. Nanosci. 2007, 6, 137–141. [Google Scholar] [CrossRef]
  39. Chainarong, S.; Sikong, L.; Pavasupree, S.; Niyomwas, S. Synthesis and Characterization of Nitrogen-Doped TiO2 Nanomaterials for Photocatalytic Activities under Visible Light. Energy Procedia 2011, 9, 418–427. [Google Scholar] [CrossRef] [Green Version]
  40. Vaiano, V.; Sacco, O.; Sannino, D.; Ciambelli, P. Nanostructured N-Doped TiO2 Coated on Glass Spheres for the Photocatalytic Removal of Organic Dyes under UV or Visible Light Irradiation. Appl. Catal. B 2015, 170, 153–161. [Google Scholar] [CrossRef]
  41. Sirisaksoontorn, W.; Thachepan, S.; Songsasen, A. Photodegradation of Phenanthrene by N-Doped TiO2 Photocatalyst. J. Environ. Sci. Health Part A 2009, 44, 841–846. [Google Scholar] [CrossRef] [PubMed]
  42. Kalantari, K.; Kalbasi, M.; Sohrabi, M.; Royaee, S.J. Synthesis and Characterization of N-Doped TiO2 Nanoparticles and Their Application in Photocatalytic Oxidation of Dibenzothiophene under Visible Light. Ceram. Int. 2016, 42, 14834–14842. [Google Scholar] [CrossRef]
  43. Petala, A.; Frontistis, Z.; Antonopoulou, M.; Konstantinou, I.; Kondarides, D.I.; Mantzavinos, D. Kinetics of Ethyl Paraben Degradation by Simulated Solar Radiation in the Presence of N-Doped TiO2 Catalysts. Water Res. 2015, 81, 157–166. [Google Scholar] [CrossRef] [PubMed]
  44. Senthilnathan, J.; Philip, L. Photocatalytic Degradation of Lindane under UV and Visible Light Using N-Doped TiO2. Chem. Eng. J. 2010, 161, 83–92. [Google Scholar] [CrossRef]
  45. Sacco, O.; Vaiano, V.; Han, C.; Sannino, D.; Dionysiou, D.D. Photocatalytic Removal of Atrazine Using N-Doped TiO2 Supported on Phosphors. Appl. Catal. B 2015, 164, 462–474. [Google Scholar] [CrossRef]
  46. Šojić, D.; Despotović, V.; Abramović, B.; Todorova, N.; Giannakopoulou, T.; Trapalis, C. Photocatalytic Degradation of Mecoprop and Clopyralid in Aqueous Suspensions of Nanostructured N-Doped TiO2. Molecules 2010, 15, 2994–3009. [Google Scholar] [CrossRef] [Green Version]
  47. Rengifo-Herrera, J.A.; Osorio-Vargas, P.; Pulgarin, C. A Critical Review on N-Modified TiO2 Limits to Treat Chemical and Biological Contaminants in Water. Evidence That Enhanced Visible Light Absorption Does Not Lead to Higher Degradation Rates under Whole Solar Light. J. Hazard. Mater. 2022, 425, 127979. [Google Scholar] [CrossRef]
  48. Tauc, J.; Grigorovici, R.; Vancu, A. Optical Properties and Electronic Structure of Amorphous Germanium. Phys. Status Solidi 1966, 15, 627–637. [Google Scholar] [CrossRef]
  49. Stoll, S.; Schweiger, A. EasySpin, a Comprehensive Software Package for Spectral Simulation and Analysis in EPR. J. Magn. Reson. 2006, 178, 42–55. [Google Scholar] [CrossRef]
  50. Lyulyukin, M.; Filippov, T.; Cherepanova, S.; Solovyeva, M.; Prosvirin, I.; Bukhtiyarov, A.; Kozlov, D.; Selishchev, D. Synthesis, Characterization and Visible-Light Photocatalytic Activity of Solid and TiO2-Supported Uranium Oxycompounds. Nanomaterials 2021, 11, 1036. [Google Scholar] [CrossRef]
  51. Braslavsky, S.E.; Braun, A.M.; Cassano, A.E.; Emeline, A.V.; Litter, M.I.; Palmisano, L.; Parmon, V.N.; Serpone, N. Glossary of Terms Used in Photocatalysis and Radiation Catalysis (IUPAC Recommendations 2011). Pure Appl. Chem. 2011, 83, 931–1014. [Google Scholar] [CrossRef]
  52. Lyulyukin, M.; Kovalevskiy, N.; Timofeeva, S.; Gusachenko, E.; Solovyeva, M.; Selishchev, D.; Kozlov, D. Method for Correction of Experimental Action Spectrum Using Actual Overlapping Spectra of Radiation Sources. MethodsX 2021, 8, 101221. [Google Scholar] [CrossRef] [PubMed]
  53. Lyulyukin, M.; Kovalevskiy, N.; Selishchev, D.; Kozlov, D. Correction of Experimental Action Spectra for TiO2 Photocatalysts Measured Using Single-Peak LEDs. J. Photochem. Photobiol. A Chem. 2021, 405, 112981. [Google Scholar] [CrossRef]
  54. Hidalgo, M.C.; Bahnemann, D. Highly Photoactive Supported TiO2 Prepared by Thermal Hydrolysis of TiOSO4: Optimisation of the Method and Comparison with Other Synthetic Routes. Appl. Catal. B 2005, 61, 259–266. [Google Scholar] [CrossRef]
  55. Li, J.G.; Ishigaki, T.; Sun, X. Anatase, Brookite, and Rutile Nanocrystals via Redox Reactions under Mild Hydrothermal Conditions: Phase-Selective Synthesis and Physicochemical Properties. J. Phys. Chem. C 2007, 111, 4969–4976. [Google Scholar] [CrossRef]
  56. Tobaldi, D.M.; Seabra, M.P.; Otero-Irurueta, G.; de Miguel, Y.R.; Ball, R.J.; Singh, M.K.; Pullar, R.C.; Labrincha, J.A. Quantitative XRD Characterisation and Gas-Phase Photocatalytic Activity Testing for Visible-Light (Indoor Applications) of KRONOClean 7000®. RSC Adv. 2015, 5, 102911–102918. [Google Scholar] [CrossRef] [Green Version]
  57. Batalović, K.; Bundaleski, N.; Radaković, J.; Abazović, N.; Mitrić, M.; Silva, R.A.; Savić, M.; Belošević-Čavor, J.; Rakočević, Z.; Rangel, C.M. Modification of N-Doped TiO2 Photocatalysts Using Noble Metals (Pt, Pd)—A Combined XPS and DFT Study. Phys. Chem. Chem. Phys. 2017, 19, 7062–7071. [Google Scholar] [CrossRef] [PubMed]
  58. Hu, L.; Wang, J.; Zhang, J.; Zhang, Q.; Liu, Z. An N-Doped Anatase/Rutile TiO2 Hybrid from Low-Temperature Direct Nitridization: Enhanced Photoactivity under UV-/Visible-Light. RSC Adv. 2013, 4, 420–427. [Google Scholar] [CrossRef]
  59. Cetinorgu-Goldenberg, E.; Burstein, L.; Chayun-Zucker, I.; Avni, R.; Boxman, R.L. Structural and Optical Characteristics of Filtered Vacuum Arc Deposited N:TiOx Thin Films. Thin Solid Film 2013, 537, 28–35. [Google Scholar] [CrossRef]
  60. Lee, S.; Cho, I.S.; Lee, D.K.; Kim, D.W.; Noh, T.H.; Kwak, C.H.; Park, S.; Hong, K.S.; Lee, J.K.; Jung, H.S. Influence of Nitrogen Chemical States on Photocatalytic Activities of Nitrogen-Doped TiO2 Nanoparticles under Visible Light. J. Photochem. Photobiol. A Chem. 2010, 213, 129–135. [Google Scholar] [CrossRef]
  61. Jaeger, D.; Patscheider, J. A Complete and Self-Consistent Evaluation of XPS Spectra of TiN. J. Electron Spectrosc. Relat. Phenom. 2012, 185, 523–534. [Google Scholar] [CrossRef]
  62. Asahi, R.; Morikawa, T. Nitrogen Complex Species and Its Chemical Nature in TiO2 for Visible-Light Sensitized Photocatalysis. Chem. Phys. 2007, 339, 57–63. [Google Scholar] [CrossRef]
  63. Chen, D.; Jiang, Z.; Geng, J.; Wang, Q.; Yang, D. Carbon and Nitrogen Co-Doped TiO2 with Enhanced Visible-Light Photocatalytic Activity. Ind. Eng. Chem. Res. 2007, 46, 2741–2746. [Google Scholar] [CrossRef]
  64. Viswanathan, B.; Krishanmurthy, K.R. Nitrogen Incorporation in TiO2: Does It Make a Visible Light Photo-Active Material? Int. J. Photoenergy 2012, 2012, 1–10. [Google Scholar] [CrossRef] [Green Version]
  65. Liu, S.J.; Ma, Q.; Gao, F.; Song, S.H.; Gao, S. Relationship between N-Doping Induced Point Defects by Annealing in Ammonia and Enhanced Thermal Stability for Anodized Titania Nanotube Arrays. J. Alloys Compd. 2012, 543, 71–78. [Google Scholar] [CrossRef]
  66. Peng, F.; Cai, L.; Yu, H.; Wang, H.; Yang, J. Synthesis and Characterization of Substitutional and Interstitial Nitrogen-Doped Titanium Dioxides with Visible Light Photocatalytic Activity. J. Solid State Chem. 2008, 181, 130–136. [Google Scholar] [CrossRef]
  67. Graciani, J.; Álvarez, L.J.; Rodriguez, J.A.; Sanz, J.F. N Doping of Rutile TiO2 (110) Surface. A Theoretical DFT Study. J. Phys. Chem. C 2008, 112, 2624–2631. [Google Scholar] [CrossRef]
  68. Gobaut, B.; Orgiani, P.; Sambri, A.; di Gennaro, E.; Aruta, C.; Borgatti, F.; Lollobrigida, V.; Céolin, D.; Rueff, J.-P.; Ciancio, R.; et al. Role of Oxygen Deposition Pressure in the Formation of Ti Defect States in TiO2 (001) Anatase Thin Films. ACS Appl. Mater. Interfaces 2017, 9, 23099–23106. [Google Scholar] [CrossRef] [Green Version]
  69. Hashimoto, S.; Tanaka, A. Alteration of Ti 2p XPS Spectrum for Titanium Oxide by Low-Energy Ar Ion Bombardment. Surf. Interface Anal. 2002, 34, 262–265. [Google Scholar] [CrossRef]
  70. Kumar, C.P.; Gopal, N.O.; Wang, T.C.; Wong, M.S.; Ke, S.C. EPR Investigation of TiO2 Nanoparticles with Temperature-Dependent Properties. J. Phys. Chem. B 2006, 110, 5223–5229. [Google Scholar] [CrossRef]
  71. Ahmed, H.; Pepper, M.; Broers, A. Photoinduced Defects in Semiconductors; Cambridge Studies in Semiconductor Physics and Microelectronic Engineering: 4; Cambridge University Press: Cambridge, UK, 1996. [Google Scholar]
  72. Funabiki, H.; Ozawa, K.; Sekiya, T. Electronic State of Nitrogen in Doped Titanium Dioxide. In Proceedings of the 12th International Conference on Excitonic and Photonic Processes in Condensed Matter and Nano Materials (EXCON 2018), Nara City, Japan, 8–13 July 2018; Institute of Physics Publishing: Bristol, UK, 2019; Volume 1220. [Google Scholar]
  73. Yuan, H.; He, J.; Li, R.; Ma, X. Characterization of SO42−/TiO2 and Its Catalytic Activity in the Epoxidation Reaction. Res. Chem. Intermed. 2017, 43, 4353–4368. [Google Scholar] [CrossRef]
  74. Vorontsov, A.V.; Altynnikov, A.A.; Savinov, E.N.; Kurkin, E.N. Correlation of TiO2 Photocatalytic Activity and Diffuse Reflectance Spectra. J. Photochem. Photobiol. A Chem. 2001, 144, 193–196. [Google Scholar] [CrossRef]
  75. di Valentin, C.; Pacchioni, G. Trends in Non-Metal Doping of Anatase TiO2: B, C, N and F. Catal. Today 2013, 206, 12–18. [Google Scholar] [CrossRef]
  76. Xiu, Z.; Guo, M.; Zhao, T.; Pan, K.; Xing, Z.; Li, Z.; Zhou, W. Recent Advances in Ti3+ Self-Doped Nanostructured TiO2 Visible Light Photocatalysts for Environmental and Energy Applications. Chem. Eng. J. 2020, 382, 123011. [Google Scholar] [CrossRef]
  77. Na, S.; Seo, S.; Lee, H. Recent Developments of Advanced Ti3+-Self-Doped TiO2 for Efficient Visible-Light-Driven Photocatalysis. Catalysts 2020, 10, 679. [Google Scholar] [CrossRef]
  78. Chen, X.; Wang, X.; Hou, Y.; Huang, J.; Wu, L.; Fu, X. The Effect of Postnitridation Annealing on the Surface Property and Photocatalytic Performance of N-Doped TiO2 under Visible Light Irradiation. J. Catal. 2008, 255, 59–67. [Google Scholar] [CrossRef]
  79. Kovalevskiy, N.; Cherepanova, S.; Gerasimov, E.; Lyulyukin, M.; Solovyeva, M.; Prosvirin, I.; Kozlov, D.; Selishchev, D. Enhanced Photocatalytic Activity and Stability of Bi2WO6—TiO2-N Nanocomposites in the Oxidation of Volatile Pollutants. Nanomaterials 2022, 12, 359. [Google Scholar] [CrossRef]
  80. Kovalevskiy, N.S.; Lyulyukin, M.N.; Kozlov, D.V.; Selishchev, D.S. Cu-Grafted TiO2 Photocatalysts: Effect of Cu on the Action Spectrum of Composite Materials. Mendeleev Commun. 2021, 31, 644–646. [Google Scholar] [CrossRef]
  81. Schon, G. ESCA Studies of Cu, Cu2O and CuO. Surf. Sci. 1973, 35, 96–108. [Google Scholar] [CrossRef]
  82. Svintsitskiy, D.A.; Stadnichenko, A.I.; Demidov, D.V.; Koscheev, S.V.; Boronin, A.I. Investigation of Oxygen States and Reactivities on a Nanostructured Cupric Oxide Surface. Appl. Surf. Sci. 2011, 257, 8542–8549. [Google Scholar] [CrossRef]
  83. Moulder, J.F.; Stickle, W.F.; Sobol, P.E.; Bomben, K.D. Handbook of X-ray Photoelectron Spectroscopy; Perkin-Elmer Corp: Eden Prairie, MN, USA, 1992. [Google Scholar]
  84. Imagawa, H. ESR Studies of Cupric Ion in Various Oxide Glasses. Phys. Status Solidi 1968, 30, 469–478. [Google Scholar] [CrossRef]
  85. Bagratashvili, V.N.; Bogomolova, L.D.; Jachkin, V.A.; Krasi’nikova, N.A.; Rybaltovskii, A.O.; Tsypina, S.I.; Chutko, E.A. Electron Paramagnetic Resonance of Color Centers in Nanoporous Glasses Impregnated with Copper Beta-Diketonate with the Use of Supercritical Carbon Dioxide. Glass Phys. Chem. 2004, 30, 500–505. [Google Scholar] [CrossRef]
  86. Chen, C.S.; Chen, T.C.; Chen, C.C.; Lai, Y.T.; You, J.H.; Chou, T.M.; Chen, C.H.; Lee, J.F. Effect of Ti3+ on TiO2-Supported Cu Catalysts Used for CO Oxidation. Langmuir 2012, 28, 9996–10006. [Google Scholar] [CrossRef] [PubMed]
  87. Endo-Kimura, M.; Karabiyik, B.; Wang, K.; Wei, Z.; Ohtani, B.; Markowska-Szczupak, A.; Kowalska, E. Vis-Responsive Copper-Modified Titania for Decomposition of Organic Compounds and Microorganisms. Catalysts 2020, 10, 1194. [Google Scholar] [CrossRef]
  88. Nishikawa, M.; Mitani, Y.; Nosaka, Y. Photocatalytic Reaction Mechanism of Fe(III)-Grafted TiO2 Studied by Means of ESR Spectroscopy and Chemiluminescence Photometry. J. Phys. Chem. C 2012, 116, 14900–14907. [Google Scholar] [CrossRef]
  89. Liu, M.; Qiu, X.; Miyauchi, M.; Hashimoto, K. Energy-Level Matching of Fe(III) Ions Grafted at Surface and Doped in Bulk for Efficient Visible-Light Photocatalysts. J. Am. Chem. Soc. 2013, 135, 10064–10072. [Google Scholar] [CrossRef]
  90. Yu, H.; Irie, H.; Shimodaira, Y.; Hosogi, Y.; Kuroda, Y.; Miyauchi, M.; Hashimoto, K. An Efficient Visible-Light-Sensitive Fe(III)-Grafted TiO2 Photocatalyst. J. Phys. Chem. C 2010, 114, 16481–16487. [Google Scholar] [CrossRef]
  91. Jung, S.M.; Grange, P. The investigation of mechanism of SCR reaction on a TiO2-SO42− catalyst by DRIFTS. Appl. Catal. B 2000, 27, L11–L16. [Google Scholar] [CrossRef]
  92. Kolinko, P.A.; Kozlov, D.V. Products distribution during the gas phase photocatalytic oxidation of ammonia over the various titania based photocatalysts. Appl. Catal. B. 2009, 90, 126–131. [Google Scholar] [CrossRef]
  93. Tan, X.; Cheng, G.; Song, X.; Chen, X.; Dai, W.; Fu, X. The promoting effect of visible light on the CO + NO reaction over the Pd/N–TiO2 catalyst. Catal. Sci. Technol. 2019, 9, 3637–3646. [Google Scholar] [CrossRef]
  94. Ramis, G.; Busca, G.; Lorenzelli, V.; Forzatti, P. Fourier transform infrared study of the adsorption and coadsorption of nitric oxide, nitrogen dioxide and ammonia on TiO2 anatase. Appl. Catal. 1990, 64, 243–257. [Google Scholar] [CrossRef]
  95. Jin, R.; Liu, Y.; Wang, Y.; Cen, W.; Wu, Z.; Wang, H.; Weng, X. The role of cerium in the improved SO2 tolerance for NO reduction with NH3 over Mn-Ce/TiO2 catalyst at low temperature. Appl. Catal. B. 2014, 148–149, 582–588. [Google Scholar] [CrossRef]
  96. Kamaei, M.; Rashedi, H.; Dastgheib, S.M.M.; Tasharrofi, S. Comparing Photocatalytic Degradation of Gaseous Ethylbenzene Using N-doped and Pure TiO2 Nano-Catalysts Coated on Glass Beads under Both UV and Visible Light Irradiation. Catalysts 2018, 8, 466. [Google Scholar] [CrossRef] [Green Version]
  97. Belver, C.; Bellod, R.; Stewart, S.J.; Requejo, F.G.; Fernández-García, M. Nitrogen-containing TiO2 photocatalysts: Part 2. Photocatalytic behavior under sunlight excitation. Appl. Catal. B: Environ. 2006, 65, 309–314. [Google Scholar] [CrossRef]
  98. Li, X.; Zhang, G.; Wang, X.; Liu, W.; Yu, K.; Liang, C. Facile synthesis of nitrogen-doped titanium dioxide with enhanced photocatalytic properties. Mater. Res. Express 2019, 6, 115019. [Google Scholar] [CrossRef]
  99. Wang, Z.; Cai, W.; Hong, X.; Zhao, X.; Xu, F.; Cai, C. Photocatalytic degradation of phenol in aqueous nitrogen-doped TiO2 suspensions with various light sources. Appl. Catal. B: Environ. 2005, 57, 223–231. [Google Scholar] [CrossRef]
  100. Yang, G.; Jiang, Z.; Shi, H.; Xiao, T.; Yan, Z. Preparation of highly visible-light active N-doped TiO2 photocatalyst. J. Mater. Chem. 2010, 20, 5301–5309. [Google Scholar] [CrossRef]
  101. Wang, Y.; Zhang, J.; Jin, Z.; Wu, Z.; Zhang, S. Visible light photocatalytic decoloration of methylene blue on novel N-doped TiO2. Chin. Sci. Bull. 2007, 52, 2157–2160. [Google Scholar] [CrossRef]
  102. Khan, T.T.; Bari, G.A.K.M.R.; Kang, H.J.; Lee, T.G.; Park, J.W.; Hwang, H.J.; Hossain, S.M.; Mun, J.S.; Suzuki, N.; Fujishima, A.; et al. Synthesis of N-Doped TiO2 for Efficient Photocatalytic Degradation of Atmospheric NOx. Catalysts 2021, 11, 109. [Google Scholar] [CrossRef]
  103. Ai, H.Y.; Shi, J.W.; Duan, R.X.; Chen, J.W.; Cui, H.J.; Fu, M.L. Sol-gel to prepare nitrogen doped TiO2 nanocrystals with exposed {001} facets and high visible-light photocatalytic performance. Int. J. Photoenergy 2014, 2014, 1–9. [Google Scholar] [CrossRef] [Green Version]
  104. Chen, C.; Bai, H.; Chang, S.M.; Chang, C.; Den, W. Preparation of N-doped TiO2 photocatalyst by atmospheric pressure plasma process for VOCs decomposition under UV and visible light sources. J. Nanoparticle Res. 2006, 9, 365–375. [Google Scholar] [CrossRef]
  105. Liu, S.H.; Tang, W.T.; Lin, W.X. Self-assembled ionic liquid synthesis of nitrogen-doped mesoporous TiO2 for visible-light-responsive hydrogen production. Int. J. Hydrogen Energy 2017, 42, 24006–24013. [Google Scholar] [CrossRef]
  106. Japa, M.; Tantraviwat, D.; Phasayavan, W.; Nattestad, A.; Chen, J.; Inceesungvorn, B. Simple preparation of nitrogen-doped TiO2 and its performance in selective oxidation of benzyl alcohol and benzylamine under visible light. Colloids Surfaces A: Physicochem. Eng. Asp. 2020, 610, 125743. [Google Scholar] [CrossRef]
  107. Bellardita, M.; Addamo, M.; di Paola, A.; Palmisano, L.; Venezia, A.M. Preparation of N-doped TiO2: Characterization and photocatalytic performance under UV and visible light. Phys. Chem. Chem. Phys. 2009, 11, 4084–4093. [Google Scholar] [CrossRef] [PubMed]
  108. Parida, K.M.; Naik, B. Synthesis of mesoporous TiO2−xNx spheres by template free homogeneous co-precipitation method and their photo-catalytic activity under visible light illumination. J. Colloid Interface Sci. 2009, 333, 269–276. [Google Scholar] [CrossRef] [PubMed]
  109. Yamashita, T.; Hayes, P. Analysis of XPS spectra of Fe2+ and Fe3+ ions in oxide materials. Appl. Surf. Sci. 2008, 254, 2441–2449. [Google Scholar] [CrossRef]
Figure 1. XRD patterns of TiO2-N samples calcined at different temperatures (a) and SEM micrographs of the sample calcined at 350 °C (b,c).
Nanomaterials 12 04146 g001
Figure 2. UV–vis DRS spectra (a) and Tauc plots (b) for TiO2-N, TiO2, P25, and KC photocatalysts. The inset in (b) shows an enlarged area of Tauc plots in the range of 2.2–3.25 eV.
Nanomaterials 12 04146 g002
Figure 3. Effect of the calcination temperature on UV–vis DRS spectra of TiO2-N (a) and integral of the difference spectrum between TiO2-N and TiO2 in the region of 380–550 nm (b).
Nanomaterials 12 04146 g003
Figure 4. Photoelectron N 1s (a,c) and Ti 2p (b,d) spectral regions for TiO2-N and TiO2 samples synthesized at 350 °C.
Nanomaterials 12 04146 g004
Figure 5. EPR spectra of TiO2-N in the dark or under light exposure (a) and decay plots for the intensity of the EPR signal at different temperatures (b). The inset in (b) shows the temperature dependence of the average decay time.
Nanomaterials 12 04146 g005
Figure 6. Photocurrent of TiO2-N under UV and visible light (a); action spectra of TiO2-N and TiO2 synthesized at 350 °C (b). The inset in (b) shows an enlarged area of action spectra in the range of 380–620 nm.
Nanomaterials 12 04146 g006
Figure 7. DRIFT spectra (a) and photocatalytic activity (b) of TiO2-N samples (350 °C) with and without intermediate washing of the precipitate.
Nanomaterials 12 04146 g007
Figure 8. Effect of calcination temperature on the photocatalytic activity (a) and intensity of EPR signals (b) of the TiO2-N sample.
Nanomaterials 12 04146 g008
Figure 9. Effect of copper and iron species on the stability of TiO2-N (350 °C) in absolute (a) and relative (b) coordinates.
Nanomaterials 12 04146 g009
Figure 10. Photoelectron Cu 2p (a) and Cu LMM (b) spectral regions for the synthesized Cu/TiO2-N sample; experimental (c) and simulated (d) EPR spectra of Cu/TiO2-N.
Nanomaterials 12 04146 g010
Figure 11. Energy diagram for Fe/TiO2-N (left), TiO2-N (center), and Cu/TiO2-N (right).
Nanomaterials 12 04146 g011
Table 1. Characteristics of the samples calcined at different temperatures.
Calcination Temperature, °CCrystal Size, nmStain Values (ε)Surface Area, m2 g−1Pore Volume, cm3 g−1Pore Diameter, ÅNitrogen Content, wt.%Sulfur Content, wt.%Band Gap, eVMEE **, eV
250n.d. *n.d.3440.59690.8 ± 0.10.14 ± 0.043.222.22
300 0.6 ± 0.20.16 ± 0.063.202.27
350160.00311510.431150.5 ± 0.10.16 ± 0.043.192.32
400 0.4 ± 0.10.16 ± 0.063.172.30
450200.00201130.381360.36 ± 0.030.11 ± 0.033.182.27
500230.0017 0.27 ± 0.030.08 ± 0.013.192.24
550 730.311720.14 ± 0.010.14 ± 0.043.19n.d.
600250.0010 n.d.0.11 ± 0.033.18n.d.
* n.d. = non-detectable. ** MEE = minimum energy required for the photoexcitation of electron.
Table 2. Parameters of individual components in EPR spectra.
Paramagnetic Centerg-Factor ± g-StrainHyperfine Splitting, MHz
Ti3+1.99
N{2.003 ± 0.001;
2.004 ± 0.008;
2.002 ± 0.006}
{2.3; 12.3; 88.9}
Publisher’s Note: MDPI stays neutral with regard to jurisdictional claims in published maps and institutional affiliations.