Abstract
The formation of CaSi2 polycrystalline structures under the postgrowth electron irradiation of epitaxial CaF2/Si(111) films with embedded thin Si layers was studied. The dependence on the electron exposure time was investigated for two types of structures with different film thicknesses. The optimal conditions for the formation of two-dimensional CaSi2 structures were found. Raman spectra of the structures after a 1 min electron irradiation demonstrated only one pronounced peak corresponding to the vibrations of Si atoms in the plane of the calcium-intercalated two-dimensional Si layer. An increase in the exposure time resulted in the transition from two- to three-dimensional CaSi2 structures having more complex Raman spectra with additional peaks typical of bulk CaSi2 crystals. Based on the results of microscopic studies and transport measurements, a model explaining the observed effects was proposed.
1. Introduction
In recent decades, there has been increased interest in the synthesis of graphene-like structures based on silicon. Many works have been devoted to the problem of silicene production and its device applications (see reviews [1,2] and references therein). However, obtaining a two-dimensional material that contains a single silicon layer remains an unsolved problem. The monolayer silicene is expected to have unique properties, such as tunable band gaps [3], a quantum spin Hall effect [4], high-temperature superconductivity [5] and giant magnetoresistance [6]. Despite great progress having been achieved in the epitaxial synthesis of silicene [7,8], its poor air stability makes its device application difficult [9]. Recently, Yaokawa et al. [10] reported the formation of bilayer silicene (BLSi) by treating calcium-intercalated monolayer silicene (CaSi2) with a BF4-based ionic liquid. The bilayer silicenes were sandwiched between planar crystals of CaF2 and/or CaSi2. The authors [10] predicted that BLSi would be more stable in air than monolayer silicene, because it has a low density of dangling bonds. We believe that the CaF2–CaSi2 system is a very prospective basis for future device applications; thus, we focus on CaSi2, an attractive precursor of BLSi. Recently, it was found that calcium-intercalated silicon atomic layers in CaSi2 exhibit electronic properties typical of graphene-like materials [11]. Many scientific groups are currently involved in the research of calcium silicides [12,13,14,15,16,17,18,19,20,21]. A variety of methods has been proposed to produce calcium silicides with different compositions that exhibit semimetallic or semiconducting properties. However, the two-dimensional structures based on calcium silicides have not been obtained. There have been attempts to grow two-dimensional silicon layers on CaF2 using the molecular beam epitaxy method, but up to now, there has been no significant success in this direction. As a rule, in the case of conventional silicon deposition on CaF2, three-dimensional nuclei are formed due to a poor wettability of the silicon on this fluoride [22,23], preventing a two-dimensional layer growth.
Earlier, we proposed a method for CaSi2 synthesis using electron beam irradiation during the growth of CaF2 layers with molecular beam epitaxy (MBE) [19,24,25]. It was assumed that the formation of CaSi2 occurs through the stimulated decomposition of CaF2 into Ca and F [26]. Fluorine is desorbed from the surface, and remaining calcium atoms bind chemically with silicon atoms, which come from the Si substrate at sufficiently high temperatures (>300 °C) under electron irradiation [24]. Calcium silicide produced in this way is a nonhomogeneous three-dimensional material representing a triangular network of elongated crystallites protruding from the surface of the CaF2 film by tens of nanometers. These crystallites are oriented along directions {1–10} and have a characteristic length of ~1 μm. We recently found a way to produce more homogeneous CaSi2 films [27]. The idea is to introduce additional intermediate silicon layers into the growing CaF2 film. In this case, the CaSi2 film growth under simultaneous e-beam irradiation occurs in a layer-by-layer mode. Another opportunity to increase the CaSi2 film homogeneity is postgrowth electron irradiation after CaF2 deposition [25].
In the present paper, we used both of these approaches to obtain a two-dimensional material based on calcium silicide. The electron beam was used to irradiate the surface of an already grown CaF2 film with embedded thin Si layers. By adjusting the time of electronic exposure, the CaF2 film thickness and the temperature of the substrate, it was possible to tune the properties of the material synthesized under an electron beam and obtain two-dimensional CaSi2 regions.
2. Materials and Methods
The experiments were conducted in the “Katun-100” MBE unit equipped with a CaF2 effusion source with a graphite crucible under ultrahigh vacuum conditions. The structures were synthesized on Si (111) substrates with a 100 mm diameter. Before the growth, the silicon substrates underwent a double surface cleaning. After a standard chemical treatment, the protective silicon oxide layer was formed. This protective layer was removed in the MBE chamber at 720 °C in a weak Si flux until the appearance of a 7 × 7 superstructure fixed with reflection high-energy electron diffraction (RHEED), after which a 50 nm thick buffer Si layer was grown at a temperature of 550 °C.
The epitaxial CaF2 film growth was carried out at a deposition rate of ~2 nm/min at a substrate temperature of 550 °C. During the growth, the selected area of the CaF2 film was controlled with RHEED using the following electron beam parameters: an acceleration voltage of 20 keV and a current density of 50 μA/m2. The beam incidence angle was 4°. Two structures of different CaF2 film thicknesses (29 nm and 53 nm) with incorporated Si layers were grown at a temperature of 550 °C (Figure 1). The first structure contained 9 Si layers with a thickness of 0.3 nm (~1 BL of silicon), separated by 2 nm thick CaF2 interlayers. Si layers were grown on a 10 nm thick CaF2 film. The last Si layer was covered with a 3 nm thick CaF2 layer. The rate of Si deposition was ~0.6 nm/min. The second structure contained 1 BL Si layer grown on a 50 nm thick CaF2 film and covered with a 3 nm CaF2 layer. Just after the growth, the already-formed films were exposed to electron irradiation produced with an electron beam used for RHEED under ultrahigh vacuum conditions. The electron exposure times were 1, 2, 4 and 10 min, and each time, the electron beam was moved to a new place on the substrate. The substrate temperature during electron irradiation was kept at 550 °C. As a result, the electron-beam-modified areas were formed on the surface of the grown film. These areas were strips with a metallic luster with a length of 3–4 cm and a width of 2 mm. One of the strips was obtained during the control of the film growth with RHEED, and was used later for testing the Raman measurements. The strips were investigated with energy-dispersive X-ray spectroscopy (EDX), atomic force microscopy (AFM), scanning electron microscopy (SEM) and Raman spectroscopy. The thickness of the grown films was controlled with ellipsometry [28]. The conductivity and magnetoresistance were measured on the strips as functions of the electron irradiation time. Contacts for transport measurements were created through the soldering of silver wires using indium solder. The magnetoresistance and temperature dependences of the conductivity were measured using an SR850 synchronous amplifier in a transport helium Dewar vessel in a magnetic field up to 4 T.
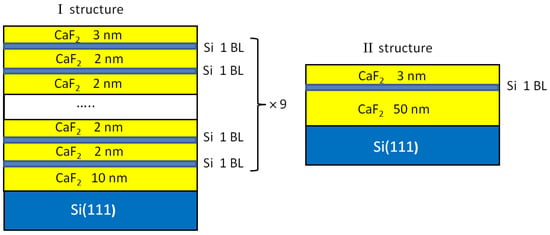
Figure 1.
A schematic representation of two structures under study.
3. Results and Discussion
As a result of studies with SEM (Figure 2) and EDX (Figure 3), it was found that at short electron beam exposure times (1–2 min) on the CaF2 surface, individual microstructures were formed. The size and shape of the obtained structures depended on the thickness of the epitaxial CaF2 films. According to RHEED measurements, these structures were polycrystalline. The RHEED images obtained in analogous experimental conditions were presented in [25].
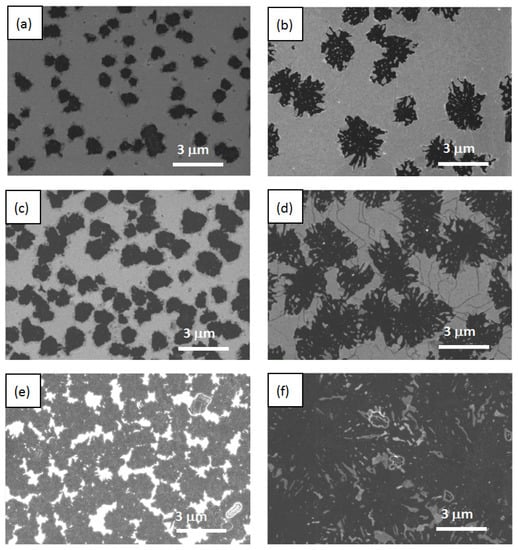
Figure 2.
SEM data obtained for structures with different thicknesses. Left column—29 nm thick film; right column—53 nm thick film. Panels (a,b) correspond to a 2 min exposure time. Panels (c,d) correspond to a 4 min exposure time. Panels (e,f) correspond to a 10 min exposure time.
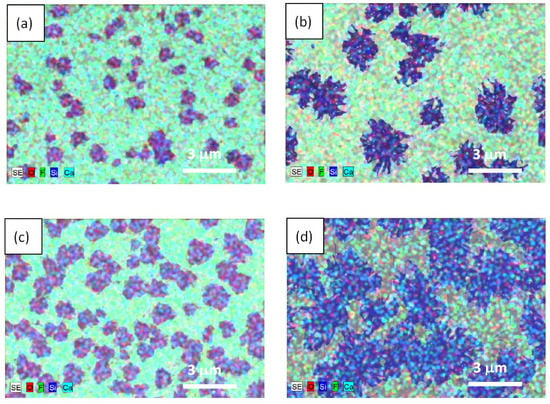
Figure 3.
(a)—Energy-dispersive X-ray spectroscopy data obtained for the structures with different thicknesses of epitaxial films. Left column—29 nm thick film; right column—53 nm thick film. Panels (a,b) correspond to a 2 min exposure time. Panels (c,d) (correspond to a 4 min exposure time.
In the case of a 29 nm thick film, the small structures resembling rounded spots with a characteristic size of ~1 μm formed on the surface (see left panels in Figure 2 and Figure 3). For a 53 nm thick film, larger snowflake-like structures formed several times (see right panels in Figure 2 and Figure 3). The density of the polycrystalline structures on the surface of a 29 nm thick film was a few times higher than that for a 53 nm thick film. In both cases with increasing irradiation times (see from top to bottom panels in Figure 2 and Figure 3), the area occupied by these structures increased. At a 10 min exposure time, for a 53 nm thick film, they overlapped, forming almost a continuous layer (Figure 2f). Combining the results of the EDX and Raman studies (see below), one could conclude that the resulting polycrystalline structures contained Ca and Si.
An analysis of the SEM data revealed another interesting feature of the 53 nm thick film. There was a network of characteristic cracks present on their surface (Figure 2, right panels). They extended from the ray of one snowflake to the ray of another snowflake along the characteristic directions {1–10}, occasionally changing direction to another one. Most likely, they were the result of the plastic relaxation of the film. The longer the time of electronic exposure, the greater the density of these cracks. On the surface of the film with a smaller thickness of 29 nm, such cracks were practically absent. Two reasons could be responsible for the crack formation: the strain in the film due to a difference in the CaSi2 and CaF2 lattice constants and the overpressure of free fluorine produced in the film volume during electron irradiation. The longer the time of electron exposure, the larger the CaSi2 structures incorporated in the CaF2 film. Figure 2d demonstrates the surface of a 53 nm thick sample after a 4 min electron irradiation. In this case, the CaSi2 structures became three-dimensional objects embedded in CaF2 film. They squeezed CaF2 between them and caused the appearance of cracks. The amount of free fluorine stored in the film also increased with exposure time, which could have also led to the film cracking.
The AFM study helped us to understand how snowflakes formed. Figure 4 shows the morphology of the surface after a 1 min electron irradiation for both structures. We could see that craters formed on the film’s surface. The shape and size of the craters were different and consistent with the SEM results. For the first structure, the depth of the crater was close to the thickness of the epitaxial film. The crater walls were formed with broken pieces of the epitaxial film. The total height of the walls from the bottom of the crater was, on average, 130 nm. For the second structure, the craters were flatter, and their depth was approximately two times smaller than the film’s thickness. Such a picture suggested the following interpretation: CaF2 decomposed into calcium and fluorine in the whole volume of the film, since the electron beam at the used energies penetrated the entire depth of the film. Interstitial fluorine atoms could move rapidly along the anion close-packed direction via a replacement sequence [29,30]. Parts of the fluorine atoms came to the surface and were desorbed [31,32]. Fluorine vacancies surrounded by Ca (F centers) diffused to the surface [33,34] and could meet on their way the embedded Si layers. Ca atoms could bind to the Si atoms, and two-dimensional CaSi2 islands (or sections of two-dimensional CaSi2 layers) could form. The remaining parts of the fluorine atoms collected in certain places near the defects, which could be twin boundaries or stacking faults in the CaF2 film. The highest defect density was observed at the CaF2/Si heterointerface, so parts of the fluorine atoms accumulated near the bottom of the film, forming fluorine bubbles (see the detailed study of bubble formation in Ref. [31]). When the critical overpressure was reached, there was an explosion and the formation of a crater. In the following stages, due to the diffusion and electron irradiation, the crater walls flattened, and the material of the walls was distributed around the crater. The crater itself could be filled with some material such as a calcium-silicon compound (see EDX data, Figure 3). As long as the crater was not filled, intense silicon diffusion from the substrate could occur along the crater walls. All this led to the formation of structures resembling snowflakes, which can be seen in Figure 2 and Figure 3. The difference in the size and density of calcium silicide structures observed for samples with different thicknesses could be explained by the different amounts of fluorine produced in the volume of CaF2 films. The amount of fluorine per “nucleation” center, where calcium silicide structures were formed, was several times greater for a 53 nm thick film, so the explosions occurred at an earlier stage, leading to a larger size of calcium silicide crystallites. The density of explosions was lower for the thicker film, because only the larger fluorine bubbles burst through.
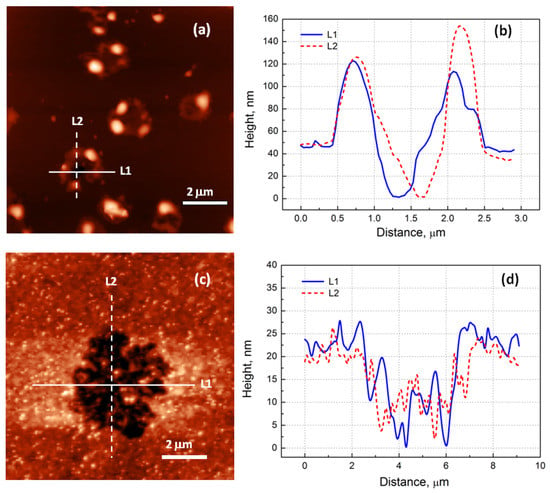
Figure 4.
AFM data obtained after a 1 min electron irradiation: (a)—29 nm thick film; (c)—53 nm thick film. Profiles of surface relief along L1 and L2 directions: (b)—29 nm thick film; (d)—53 nm thick film.
According to the Raman data, a narrow intensive peak at ≈ 419 cm−1 (Figure 5, left panel, spectrum six) was observed for a 29 nm thick film at the minimum irradiation time (1 min). This peak corresponded to vibrations of Si atoms in the plane of the calcium-intercalated two-dimensional Si layer [35] that supported the assumption about the formation of the CaSi2 two-dimensional layer (or its regions). With an increasing irradiation time, the intensity of this peak decreased, and its position slightly shifted to the lower frequencies. At a 10 min irradiation, the peak intensity fell by a factor of three, and the peak position was ≈ 417.5 cm−1 (Figure 5, left panel, spectrum three). At the same time, an additional peak appeared at ≈ 386 cm−1.
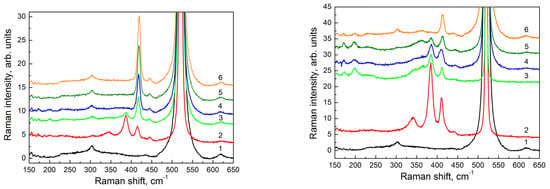
Figure 5.
Raman spectra obtained for structures with different thicknesses of epitaxial films; left panel: 29 nm; right panel: 53 nm. Spectrum (1) corresponds to a Si(111) substrate, spectrum (2) corresponds to a film grown with simultaneous electron irradiation during deposition of CaF2. Other spectra correspond to regions of the films formed with postgrowth electron irradiation with different electron exposure times: (3) 10 min; (4) 4 min; (5) 2 min; (6) 1 min.
An analogous peak with the same position was observed in the Raman spectrum from the CaSi2 film obtained with electron beam irradiation during the growth of CaF2 layers (Figure 5, left panel, spectrum two). This peak corresponded to the vibrations of Si atoms in the direction perpendicular to the plane of a two-dimensional calcium-intercalated Si layer [35]. These changes indicated the appearance of three-dimensional CaSi2 structures in the studied films at sufficiently long irradiation times. For a 53 nm thick film, a peak corresponding to vibrations of Si atoms in the direction perpendicular to the plane of the two-dimensional calcium-intercalated Si layer was already observed in the Raman spectrum of the sample with a 2 min electron irradiation (Figure 5, right panel, spectrum five). The peak amplitude increased with the increasing irradiation time, indicating the appearance of three-dimensional structures at earlier stages of irradiation as compared to a 29 nm thick film.
The conductance measurements of the films under study (Figure 6) were in good agreement with the SEM and EDX data. The conductance increased with the electron exposure time, with the temperature dependence of the conductivity changing from the semiconductor to the metal one. For the same electron irradiation time, the conductance of the thicker sample was always larger than that of the thinner one. Correspondingly, a 53 nm thick sample already exhibited a metallic behavior after a 4-min irradiation, while a 29 nm thick sample behaved like a semiconductor at this irradiation time.
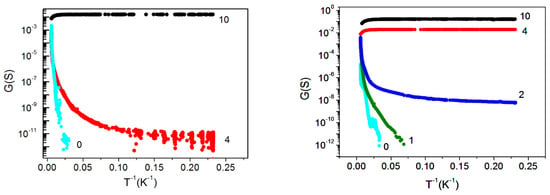
Figure 6.
Temperature dependence of conductivity G for structures with different thicknesses of epitaxial films. Left panel:29 nm thick film; right panel:53 nm thick film. The numbers next to the experimental curves correspond to the electron exposure time measured in minutes.
To understand how the conductivity of the samples with short times of electron irradiation (2 min for a 53 nm thick film and 4 min for a 29 nm thick film) was realized, we needed to take into account that the samples were nonuniform—most likely, they contained metallic clusters of different sizes and densities. As can be seen from the SEM and EDX data (Figure 2 and Figure 3), the distance between visible CaSi2 crystallites at a short irradiation time was quite large for a measurable conductivity. Moreover, as-grown CaF2 film without electron irradiation behaved like an insulator; thus, to explain the observed experimental data, one had to assume that small clusters, not distinguishable with SEM and EDX, were formed between large CaSi2 crystallites. This assumption is supported by a number of works [32,36] showing that electron irradiation causes the near-surface region of CaF2 to become conductive. The results [33] demonstrated that electron irradiation stimulates the formation of F centers, the diffusion of which to the surface leads to its enrichment with calcium. In the near-surface region, metallic colloidal pieces were formed, which provided conductivity. Similar results were obtained after the ultraviolet irradiation of CaF2 film on Si(111) [37]. We supposed that, in our samples with short irradiation times, the conductivity between large CaSi2 crystallites was carried out through transitions between these small metallic clusters. This feature seemed to determine the conductivity behavior with decreasing temperatures in these samples (Figure 6). With an increasing irradiation time, the size and number of CaSi2 crystallites increased, leading to their convergence and overlapping, respectively; film conductivity increased too, going to a metallic one.
Figure 7 demonstrates the magnetoresistance (MR) of the 53 nm thick samples after 4 and 10 min of electron irradiation and the MR of the 29 nm thick sample after 10 min of electron irradiation. One could see that the behavior of MR was qualitatively similar for these samples. In low magnetic fields, we observed a negative MR that crossed over to a positive one as magnetic field B increased. The transition from the negative to the positive MR depended on the sample thickness and the electron irradiation time. The greater the conductivity of the sample, the faster the change in the MR sign. For the less conductive samples (29 nm thick samples), this took place in the stronger fields. A negative MR is usually associated with the suppression of weak localization in the magnetic field [38]. A positive MR in metallic samples is due to the Lorentz deflection of carriers [39].
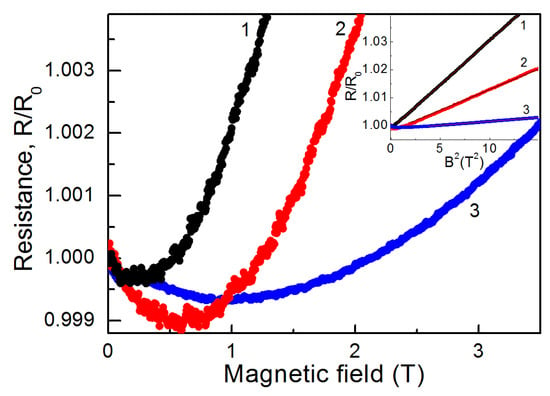
Figure 7.
Magnetoresistance of films formed with postgrowth electron irradiation with different times of electron exposure. Curves 1 and 2 are related to the film with a thickness of 53 nm after electron irradiation for 10 min and 4 min, respectively. Curve 3 corresponds to the film with a thickness of 29 nm after electron irradiation for 10 min.
According to the Kohler rule [40], in this case, R(B)/R(B = 0) ∼ 1 + (μB)2. From the slope of R/R0(B2) dependence (inset to Figure 7), we could estimate the carrier mobility μ. For a 53 nm thick film, μ was found to be ~560 cm2 V−1 s−1 for the sample with a 10 min electron irradiation and ~380 cm2 V−1 s−1 for the sample with a 4 min electron irradiation, correspondingly. For a 29 nm thick sample irradiated for 10 min, μ~ 165 cm2 V−1 s−1.
The obtained results allowed us to reconstruct the scheme of the CaSi2 formation under the electron irradiation of already-grown CaF2 films. The electron irradiation led to a strong excitation of the film atomic system. The bonds between calcium and fluorine atoms broke. One part of the fluorine atoms reached the surface and were desorbed. The other part accumulated near defects and then escaped from the film during the explosions. Fluorine vacancies surrounded by Ca (F centers) diffused to the surface [33] and could meet on their way the embedded Si layers. At this stage calcium atoms, bound with silicon atoms from these layers and formed the two-dimensional CaSi2 regions. In the next stages, after the explosions, the number of Si atoms increased due to diffusion from the substrate along the crater walls, and the three-dimensional CaSi2 crystallites began to form. With an increasing irradiation time, the surface density of polycrystalline structures became larger, and their size increased, finally resulting in the formation of a continuous metallic conducting layer.
4. Conclusions
The obtained results demonstrated that the postgrowth electron irradiation of CaF2 films with embedded thin Si layers could be used to produce CaSi2 structures, including two-dimensional ones. By adjusting the energy of electrons, the time of electron exposure, the thickness of the CaF2 film and the temperature of the substrate, it was possible to find the optimal conditions for the formation of two-dimensional CaSi2 structures under electron beam irradiation. The key point was to prevent the formation of fluorine bubbles, which provided the appearance of three-dimensional CaSi2 structures.
Author Contributions
Conceptualization, A.F.Z., V.A.Z. and A.V.D.; Investigation, A.F.Z., V.A.Z., N.P.S., V.A.V., A.Y.K. and A.V.K.; Methodology, A.Y.K. and A.V.K.; Supervision, A.V.D.; Visualization, A.F.Z. and N.P.S.; Writing—original draft, A.F.Z., V.A.Z. and N.P.S.; Writing—review and editing, A.V.D. All authors have read and agreed to the published version of the manuscript.
Funding
The work was funded by the Russian Science Foundation (grant # 19-12-00070-II).
Institutional Review Board Statement
Not applicable.
Informed Consent Statement
Not applicable.
Data Availability Statement
Data are contained within the article.
Acknowledgments
The authors thank the NSU Multiple-access Center “VTAN” and ISP SB RAS Multiple-access Center “Nanostructures” for the provision of measurement equipment. The authors gratefully acknowledge fruitful discussions with Alexander Deryabin.
Conflicts of Interest
The authors declare no conflict of interest.
References
- Kharadi, M.A.; Malik, G.F.A.; Khanday, F.A.; Shah, K.A.; Mittal, S.; Kaushik, B.K. Review—Silicene: From Material to Device Applications. ECS J. Solid State Sci. Technol. 2020, 9, 115031. [Google Scholar] [CrossRef]
- Nakano, H.; Tetsuka, H.; Spencer, M.J.S.; Morishita, T. Chemical modification of group IV graphene analogs. Sci. Technol. Adv. Mater. 2018, 19, 76. [Google Scholar] [CrossRef] [PubMed]
- Drummond, N.D.; Zólyomi, V.; Fal’ko, V.I. Electrically tunable band gap in silicone. Phys. Rev. B 2012, 85, 075423. [Google Scholar] [CrossRef]
- An, X.-T.; Zhang, Y.-Y.; Liu, J.-J.; Li, S.-S. Quantum spin Hall effect induced by electric field in silicone. Appl. Phys. Lett. 2013, 102, 043113. [Google Scholar] [CrossRef]
- Chen, L.; Feng, B.; Wu, K. Observation of a possible superconducting gap in silicene on Ag(111) surface. Appl. Phys. Lett. 2013, 102, 081602. [Google Scholar] [CrossRef]
- Rachel, S.; Ezawa, M. Giant magnetoresistance and perfect spin filter in silicene, germanene, and stanene. Phys. Rev. B 2014, 89, 195303. [Google Scholar] [CrossRef]
- Lin, C.-L.; Arafune, R.; Kawahara, K.; Tsukahara, N.; Minamitani, E.; Kim, Y.; Takagi, N.; Kawai, M. Structure of Silicene Grown on Ag(111). Appl. Phys. Express 2012, 5, 045802. [Google Scholar] [CrossRef]
- Galbiati, M.; Motta, N.; Crescenzi, M.D.; Camilli, L. Group-IV 2D materials beyond graphene on nonmetal substrates: Challenges, recent progress, and future perspectives. Appl. Phys. Rev. 2019, 6, 041310. [Google Scholar] [CrossRef]
- Molle, A.; Grazianetti, C.; Chiappe, D.; Cinquanta, E.; Cianci, E.; Tallarida, G.; Fanciulli, M. Hindering the Oxidation of Silicene with Non-Reactive Encapsulation. Adv. Funct. Mater. 2013, 23, 4340. [Google Scholar] [CrossRef]
- Yaokawa, R.; Ohsuna, T.; Morishita, T.; Hayasaka, Y.; Spencer, M.J.S.; Nakano, H. Monolayer-to-bilayer transformation of silicenes and their structural analysis. Nat. Commun. 2016, 7, 10657. [Google Scholar] [CrossRef]
- Noguchi, E.; Sugawara, K.; Yaokawa, R.; Hitosugi, T.; Nakano, H.; Takahashi, T. Direct observation of Dirac cone in multilayer silicene intercalation compound CaSi2. Adv. Mater. 2015, 27, 856. [Google Scholar] [CrossRef] [PubMed]
- Galkin, N.G.; Galkin, K.N.; Dotsenko, S.A.; Goroshko, D.L.; Fogarassy, Z.; Pecz, B. The growth processes and crystal structure of Ca silicides films grown by MBE at 500 °C on a Si (001) substrate. Mater. Chem. Phys. 2020, 253, 123380. [Google Scholar] [CrossRef]
- Galkin, N.G.; Galkin, K.N.; Tupkalo, A.V.; Chusovitin, E.A.; Goroshko, D.L.; Fogarassi, Z.; Pecz, B. Semitransparent and conductive CaSi2 films for silicon device applications. Jpn. J. Appl. Phys. 2020, 59, SFFA12. [Google Scholar] [CrossRef]
- Galkin, N.G.; Galkin, K.N.; Tupkalo, A.V.; Fogarassy, Z.; Pecz, B. A low temperature growth of Ca silicides on Si (100) and Si (111) substrates: Formation, structure, optical properties and energy band structure parameters. J. Alloys Compd. 2020, 813, 152101. [Google Scholar] [CrossRef]
- Affronte, M.; Laborde, O.; Olcese, G.L.; Palenzona, A. Low temperature properties of calcium mono-and disilicides. J. Alloys Compd. 1998, 274, 68–73. [Google Scholar] [CrossRef]
- Galkin, N.G.; Galkin, K.N.; Tupkalo, A.V.; Dotsenko, S.A.; Fogarassi, Z.; Pecz, B. Ca Silicide Films on Si (100) and Si (111) Substrates: Structure, Optical and Electrical Properties. Int. J. Nanosci. 2019, 18, 1940014. [Google Scholar] [CrossRef]
- Ohsuna, T.; Ito, K.; Nakano, H. Transformation of CaSi overgrowth domains to the CaSi2 crystal phase via vacuum annealing. Jpn. J. Appl. Phys. 2021, 61, 025506. [Google Scholar] [CrossRef]
- Terada, T.; Ishibe, T.; Katayama, T.; Sato, K.; Nguyen, T.Q.; Nakano, H.; Nakamura, Y. Thermoelectric power factor enhancement of calcium-intercalated layered silicene by introducing metastable phase. Appl. Phys. Express 2021, 14, 115505. [Google Scholar] [CrossRef]
- Kacyuba, A.; Dvurechenskii, A.; Kamaev, G.; Volodin, V.; Krupin, A. Radiation-Induced epitaxial CaSi2 film growth at the molecular-beam epitaxy of CaF2 on Si. Mater. Lett. 2020, 268, 127554. [Google Scholar] [CrossRef]
- Terada, T.; Uematsu, Y.; Ishibe, T.; Naruse, N.; Sato, K.; Nguyen, T.Q.; Kobayashi, E.; Nakano, H.; Nakamura, Y. Giant Enhancement of Seebeck Coefficient by Deformation of Silicene Buckled Structure in Calcium-Intercalated Layered Silicene Film. Adv. Mater. Interfaces 2022, 9, 2101752. [Google Scholar] [CrossRef]
- Ito, K.; Suemasu, T.; Nakano, H. Growth of tr6-CaSi2 thin films on Si (111) substrates. Jpn. J. Appl. Phys. 2018, 57, 120313. [Google Scholar] [CrossRef]
- Wang, C.R.; Muller, B.H.; Bugiel, E.; Hofmann, K.R. Surfactant enhanced growth of thin Si films on CaF2/Si(111). Appl. Surf. Sci. 2003, 211, 203. [Google Scholar] [CrossRef]
- Klust, A.; Grimsehl, M.; Wollschläger, J. Interface-reaction-mediated formation of two-dimensional Si islands on CaF2. Appl. Phys. Lett. 2003, 82, 4483. [Google Scholar] [CrossRef]
- Kacyuba, A.; Dvurechenskii, A.; Kamaev, G.; Volodin, V.; Krupin, A. Crystal structure of thin CaSi2 films grown by radiation induced epitaxy. J. Cryst. Growth 2021, 562, 126080. [Google Scholar] [CrossRef]
- Dvurechenskii, A.V.; Kacyuba, A.V.; Kamaev, G.N.; Volodin, V.A.; Smagina, Z.V. Radiation-Induced Nucleation and Growth of CaSi2 Crystals, Both Directly during the Epitaxial CaF2 Growth and after the CaF2 Film Formation. Nanomaterials 2022, 12, 1407. [Google Scholar] [CrossRef]
- Charles, L.S.; Moddeman, W.E.; Grant, J.T. Electron-beam-induced decomposition of ion bombarded calcium fluoride surfaces. Appl. Phys. Lett. 1981, 52, 6921. [Google Scholar]
- Zinovyev, V.A.; Kacyuba, A.V.; Volodin, V.A.; Zinovieva, A.F.; Cherkova, S.G.; Smagina, Z.V.; Dvurechenskii, A.V.; Krupin, A.Y.; Borodavchenko, O.M.; Zhivulko, V.D.; et al. Atomic Structure and Optical Properties of CaSi2 Layers Grown on CaF2/Si Substrates. Semiconductors 2021, 55, 808. [Google Scholar] [CrossRef]
- Shvets, V.A.; Ryckhlitski, S.V.; Spesivtsev, E.V.; Aulchenko, N.A.; Mikhailov, N.N.; Dvoretsky, S.A.; Sidorov, Y.G.; Smitrnov, R.N. In situ ellipsometry for control of Hg1−x CdxTe nanolayer structures and inhomogeneous layers during MBE growth. Thin Solid Film. 2004, 455–456, 688–694. [Google Scholar] [CrossRef]
- Chadderton, L.T.; Johnson, E.; Wohlenberg, T. A mechanism for the formation of an ordered void array on the anion sublattice in fluorite. Radiat. Eff. 1976, 28, 111. [Google Scholar] [CrossRef]
- Foster, A.S.; Trevethan, T.; Shluger, A.L. Structure and diffusion of intrinsic defects, adsorbed hydrogen, and water molecules at the surface of alkali-earth fluorides calculated using density functional theory. Phys. Rev. B 2009, 80, 115421. [Google Scholar] [CrossRef]
- Zanetti, R.; Bleloch, A.L.; Grimshaw, M.P.; Jones, G.A.C. The effect of grain size on fluorine gas bubble formation in calcium fluoride during electron-beam irradiation. Philos. Mag. Lett. 1994, 69, 285. [Google Scholar] [CrossRef]
- Bouzidi, S.; Angot, T.; Langlais, V.; Debever, J.M.; Sporken, R.; Longueville, J.L.; Thiry, P.A. Inverse-photoemission spectroscopy of electron irradiated epitaxial CaF2 on Si(111). Surf. Sci. 1994, 307–309, 1038. [Google Scholar] [CrossRef]
- Reichling, M.; Wilson, R.M.; Bennewitz, R.; Williams, R.T.; Gogoll, S.; Stenzel, E.; Matthias, E. Surface colloid evolution during low-energy electron irradiation of CaF2(111). Surf. Sci. 1996, 366, 531. [Google Scholar] [CrossRef]
- Loubriel, G.M.; Green, T.A.; Richards, P.M.; Albridge, R.G.; Cherry, D.W.; Cole, R.K.; Haglund, R.F.; Hudson, L.T.; Mendenhall, M.H.; Newns, D.M.; et al. Role of F-Center Diffusion in the Electron-Stimulated Desorption of Metal Atoms from Alkali Halides. Phys. Rev. Lett. 1986, 57, 1781. [Google Scholar] [CrossRef] [PubMed]
- Castillo, S.M.; Tang, Z.; Litvinchuk, A.P.; Guloy, A.M. Lattice Dynamics of the Rhombohedral Polymorphs of CaSi2. Inorg. Chem. 2016, 55, 10203. [Google Scholar] [CrossRef] [PubMed]
- Huisinga, M.; Puchin, V.E.; Reichling, M. Photoemission from pure and electron irradiated CaF2. Nucl. Instrum. Methods Phys. Res. B 1998, 141, 528. [Google Scholar] [CrossRef]
- Karlsson, U.O.; Himpsel, F.J.; Morar, J.F.; McFeely, F.R.; Rieger, D.; Yarmoff, J.A. Formation of a New Ordered Structure of CaF2/Si(111) by Ultraviolet Irradiation. Phys. Rev. Lett. 1986, 57, 1247. [Google Scholar] [CrossRef]
- Bergmann, G. Weak localization in thin films. Phys. Rep. 1984, 107, 1. [Google Scholar] [CrossRef]
- Nguen, V.L. Two-dimensional hopping conduction in a magnetic field. Sov. Phys.—Semicond. 1984, 18, 207. [Google Scholar]
- Ziman, J.M. Electrons and Phonons: The Theory of Transport Phenomena in Solids; Clarendon Press: Oxford, UK, 1960. [Google Scholar]
Publisher’s Note: MDPI stays neutral with regard to jurisdictional claims in published maps and institutional affiliations. |
© 2022 by the authors. Licensee MDPI, Basel, Switzerland. This article is an open access article distributed under the terms and conditions of the Creative Commons Attribution (CC BY) license (https://creativecommons.org/licenses/by/4.0/).