Article

Stability and Free Radical Production for CO2 and H2 in Air Nanobubbles in Ethanol Aqueous Solution

1
School of Chemistry and Chemical Engineering, College of Resources, Environment and Materials, Guangxi University, Nanning 530004, China
2
Algae Biomass Energy System R&D Center (ABES), University of Tsukuba, Tsukuba 305-8572, Japan
3
Faculty of Medicine, University of Tsukuba, Tsukuba 305-8575, Japan
4
School of Nuclear Science and Technology, University of South China, Hengyang City 421001, China
5
Graduate School of Engineering, The University of Tokyo, Bunkyo 113-8656, Japan
6
Ecole Nationale Supérieure de Géologie, Geo Ressources UMR 7359 CNRS, University of Lorraine, 2 Rue du Doyen Marcel Roubault, BP 10162, 54505 Vandoeuvre-lès-Nancy, France
7
Waste Science & Technology, Luleå University of Technology, SE 971 87 Luleå, Sweden
*
Author to whom correspondence should be addressed.
Nanomaterials 2022, 12(2), 237; https://doi.org/10.3390/nano12020237
Submission received: 22 November 2021 / Revised: 7 January 2022 / Accepted: 10 January 2022 / Published: 12 January 2022
(This article belongs to the Section Environmental Nanoscience and Nanotechnology)

Abstract

:
In this study, 8% hydrogen (H2) in argon (Ar) and carbon dioxide (CO2) gas nanobubbles was produced at 10, 30, and 50 vol.% of ethanol aqueous solution by the high-speed agitation method with gas. They became stable for a long period (for instance, 20 days), having a high negative zeta potential (−40 to −50 mV) at alkaline near pH 9, especially for 10 vol.% of ethanol aqueous solution. The extended Derjaguin, Landau, Verwey, and Overbeek (DLVO) theory was used to evaluate the nanobubble stability. When the nanobubble in ethanol alkaline aqueous solution changed to an acidic pH of around 5, the zeta potential of nanobubbles was almost zero and the decrease in the number of nanobubbles was identified by the particle trajectory method (Nano site). The collapsed nanobubbles at zero charge were detected thanks to the presence of few free radicals using G-CYPMPO spin trap reagent in electron spin resonance (ESR) spectroscopy. The free radicals produced were superoxide anions at collapsed 8%H2 in Ar nanobubbles and hydroxyl radicals at collapsed CO2 nanobubbles. On the other hand, the collapse of mixed CO2 and H2 in Ar nanobubble showed no free radicals. The possible presence of long-term stable nanobubbles and the absence of free radicals for mixed H2 and CO2 nanobubble would be useful to understand the beverage quality.

Graphical Abstract

1. Introduction

There have been many reports on bulk nanobubbles or nanoparticles in ethanol aqueous solution. In this research, the object of nanobubbles in ethanol solution was hydrogen in argon and carbon dioxide gas nanobubbles. However, there are some reports on the exsistence of imputities in bulk ethanol nanobubbles. Therefore, they were first introduced and then the other reports on the stability of nanobubbles in ethanol were discussed.
The structure and properties of ethanol aqueous solutions were reported in the literature [1,2,3,4]. For nanobubble production in ethanol aqueous solution, some works have reported existing impurities. Rak and Sedlák, 2020 showed the existence of hydrophobic impurities in mixtures [5]. Alheshibri and Craig, 2019 reported that the ethanol–water mixture was found to produce only positively buoyant ethanol and water particles, with a mean density of 0.91 ± 0.01 g/cm3. Resonant mass measurements suggested that suspended ethanol and water particles produced by mixing water and organic solvent had a higher density than a bubble, but smaller than ambient water [6]. The bulk nanobubbles adsorb impurities and concentrate them on their interfaces with bubbles [7]. The nucleation dynamics during the water–ethanol–water exchange was reported as follows: within 4 min after the exchange, the bubbles nucleated and formed a stable population, and the tracer particles concentrated near the nanobubbles as a result of Brownian motion [8]. The low concentration nanobubble at 108/mL was produced from saturated CO2 at 1 atm. The solutions scattered light for a long period (days) after mixing, and scattering objects originated from water-insoluble impurities in 20 vol.% ethanol [9]. A small amount of hydrophobic material was dissolved in the commercial ethanol, and the hydrophobic organic nanodroplets in the alcohol–water substitution method were often misunderstood to be nanobubbles [10].
Jadiv and Barigou, 2020 reported that, in a water and ethanol mixture, the nano- materials generated by hydrodynamic cavitation and ultrasound cavitation were not ethanol droplets, and the amount of dissolved gas directly affected the number and stability of nanobubbles generated [11]. The maximum value in the adsorption isotherm of ethanol is expected to form a monolayer of ethanol [12]. The direct arrangement of ethanol molecules can be induced by these interfaces owing to the amphiphilic properties of ethanol molecules and the stabilization of bulk nanobubbles [13,14]. Tan et al., 2021 reported the surface and bulk nanobubbles, and they were thermodynamically stable [15]. Chen et al., 2021 reported that, in the air bubble composition in the ethanol aqueous solution, ethanol molecules were preferentially oriented at the ethanal–water interface, and their orientation apparently did not vary with alcohol concentration, while water molecules were arranged to maximize the hydrogen bonding between the oriented alcohol and the adjacent water molecules [16]. When the ethanol was added to water, the ethanol dissolved rapidly, and the dissolved air in ethanol diffused slowly. Therefore, the local supersaturation of air in the solution formed tiny bubbles [13,17]. Chen et al., 2021 described that the observed “colloidal particles” in their ethanol–water solution prepared by a controllable bulk mixing method were nanobubbles rather than contaminant particles [16]. There are many models for nanobubbles; however, the charge stabilization model can provide reasonable and consistent explanations for the three properties (i.e., 100 to 1000 nm radii, the strict maximum limit for the bubble size, and the increase in implied radius with the ionic concentration) claimed by the dynamic light scattering (DLS) experiments [18]. Although ethanol is important for the formation of nanobubbles, the addition of excess ethanol higher than 20 vol.% may cause the nanobubbles to disappear. This result is consistent with the change in the long-range hydrophobic force with ethanol contents [19]. The long-range attraction between hydrophobic surfaces is due to bridging of sub-micron bubbles. Sun et al., 2021 suggested that it is impossible to judge whether the nanoparticles are nanobubbles according to a single condition. Thus, researchers should combine multiple physical properties (i.e., volume change, density, zeta potential, and refractive index of nanoparticles) to verify the presence of nanobubbles. In addition, a better understanding of interface theory can help researchers to distinguish them. It is suggested that the growth or contraction of bulk nanobubbles can change the surface tension, which can be altered by the interfacial adsorption of pollutants. Therefore, the most important thing is to avoid the interference of pollutants [20].
Hydroxyl radical production is well-known for the Fenton reaction [21], while nanobubbles in a solution that does not contain ferrous ions are discussed. First, Takahashi et al., 2007 reported on the hydroxyl radical (∙OH) generation from collapsing microbubbles [22], and his group then reported that ∙OH was produced in both cases of air (oxygen microbubbles and nitrogen microbubbles) in the acidic condition at pH 2 and 3 [23]. Moreover, the microbubbles on ozonized water indicated the production of ∙OH by the collapse of the microbubbles [24]. In 2021, they reported that ∙OH was generated from the collapsing microbubbles under strongly acidic conditions without any dynamic stimulus such as ultrasound or a large pressure difference [25]. Liu et al., 2016 reported that ·OH and superoxide ion (·O2) can be produced in an aqueous solution with bulk nanobubbles, and investigated the germination processes for plant seeds [26]. The ·OH could be generated directly from bursting nanobubbles or simple hypoxic sediment/water oxygenation [27].
On the other hand, the free radical could not be generated by the self-collapse of air micro/nano bubbles in pure water produced by fiber membrane filter, and the ·OH peak was observed with a weak supersonic wave [28]. The results of the numerical simulations suggested that no ·OH was produced from a dissolving nanobubble. It was suggested that the signals reported experimentally did not originate in ∙OH, but rather in H2O2 produced during hydrodynamic cavitation in the production of bulk nanobubbles [26]. The radical production by ultrasonic wave irradiation becomes more important to produce the radicals, especially ∙OH in water, by comparing no irradiation and irradiation [29]. Fujita et al., 2021 reported the ∙OH scavenging and the ·O2 diminishing by mixing the CO2 nanobubbles after hydrogen nanobubble blowing in water and alcohol aqueous solution [30]. As described above, the ethanol and water solutions containing nanobubbles have various characteristics and there is a possibility to produce the free radicals. Soda drinks with carbon dioxide need long stability and the prevention of free radical production in consideration of our health.
In this study, the characteristics of hydrogen in argon and carbon dioxide nanobubbles in ethanol aqueous solution were investigated from the point of view of stability for 20 days of nanobubbles according to the surface charge on bubbles and radical production by controlling the bubble surface charge to near zero by changing pH and with the application of small ultrasonic wave and ultraviolet irradiation. When the absolute value of zeta potential of nanobubbles is low, there is a possibility of the collapse of nanobubbles by Brownian motion and the production of the free radical. The presence or absence of the free radical is useful to know the beverage quality, among others.

2. Materials and Methods

2.1. Materials

Deionized (DI) water with a resistivity of 18.2 MΩ·cm prepared by the Classic Water Purification System from Hitech instruments CO., Ltd. (Shanghai, China) was used. Ethanol with a purity higher than 99.7% produced by Guangdong Guanghua Sci-Tech Co., Ltd., Guangzhou, Guangdong, China was used. The ethanol percentages of ethanol aqueous solution mixtures were 0, 10, 30, and 50 vol%. The gases of 8% H2 in Ar and CO2 were supplied from a tank produced by Guangdong Huate Gas Co., Ltd., Guangzhou, Guangdong, China. The pH adjusters of ethanol aqueous solution were sodium hydroxide (NaOH) aqueous solution (Guangdong Guanghua Sci-Tech Co., Ltd., Guangzhou, Guangdong, China) and hydrochloric acid (HCl) aqueous solution (Chengdu Chron Chemicals Co., Ltd., Qionglai, China). The solubility of H2 gas [31] and CO2 gas [32] in ethanol was about 100 times in H2 and 10 times in CO2 larger than those gases in water.

2.2. Methods

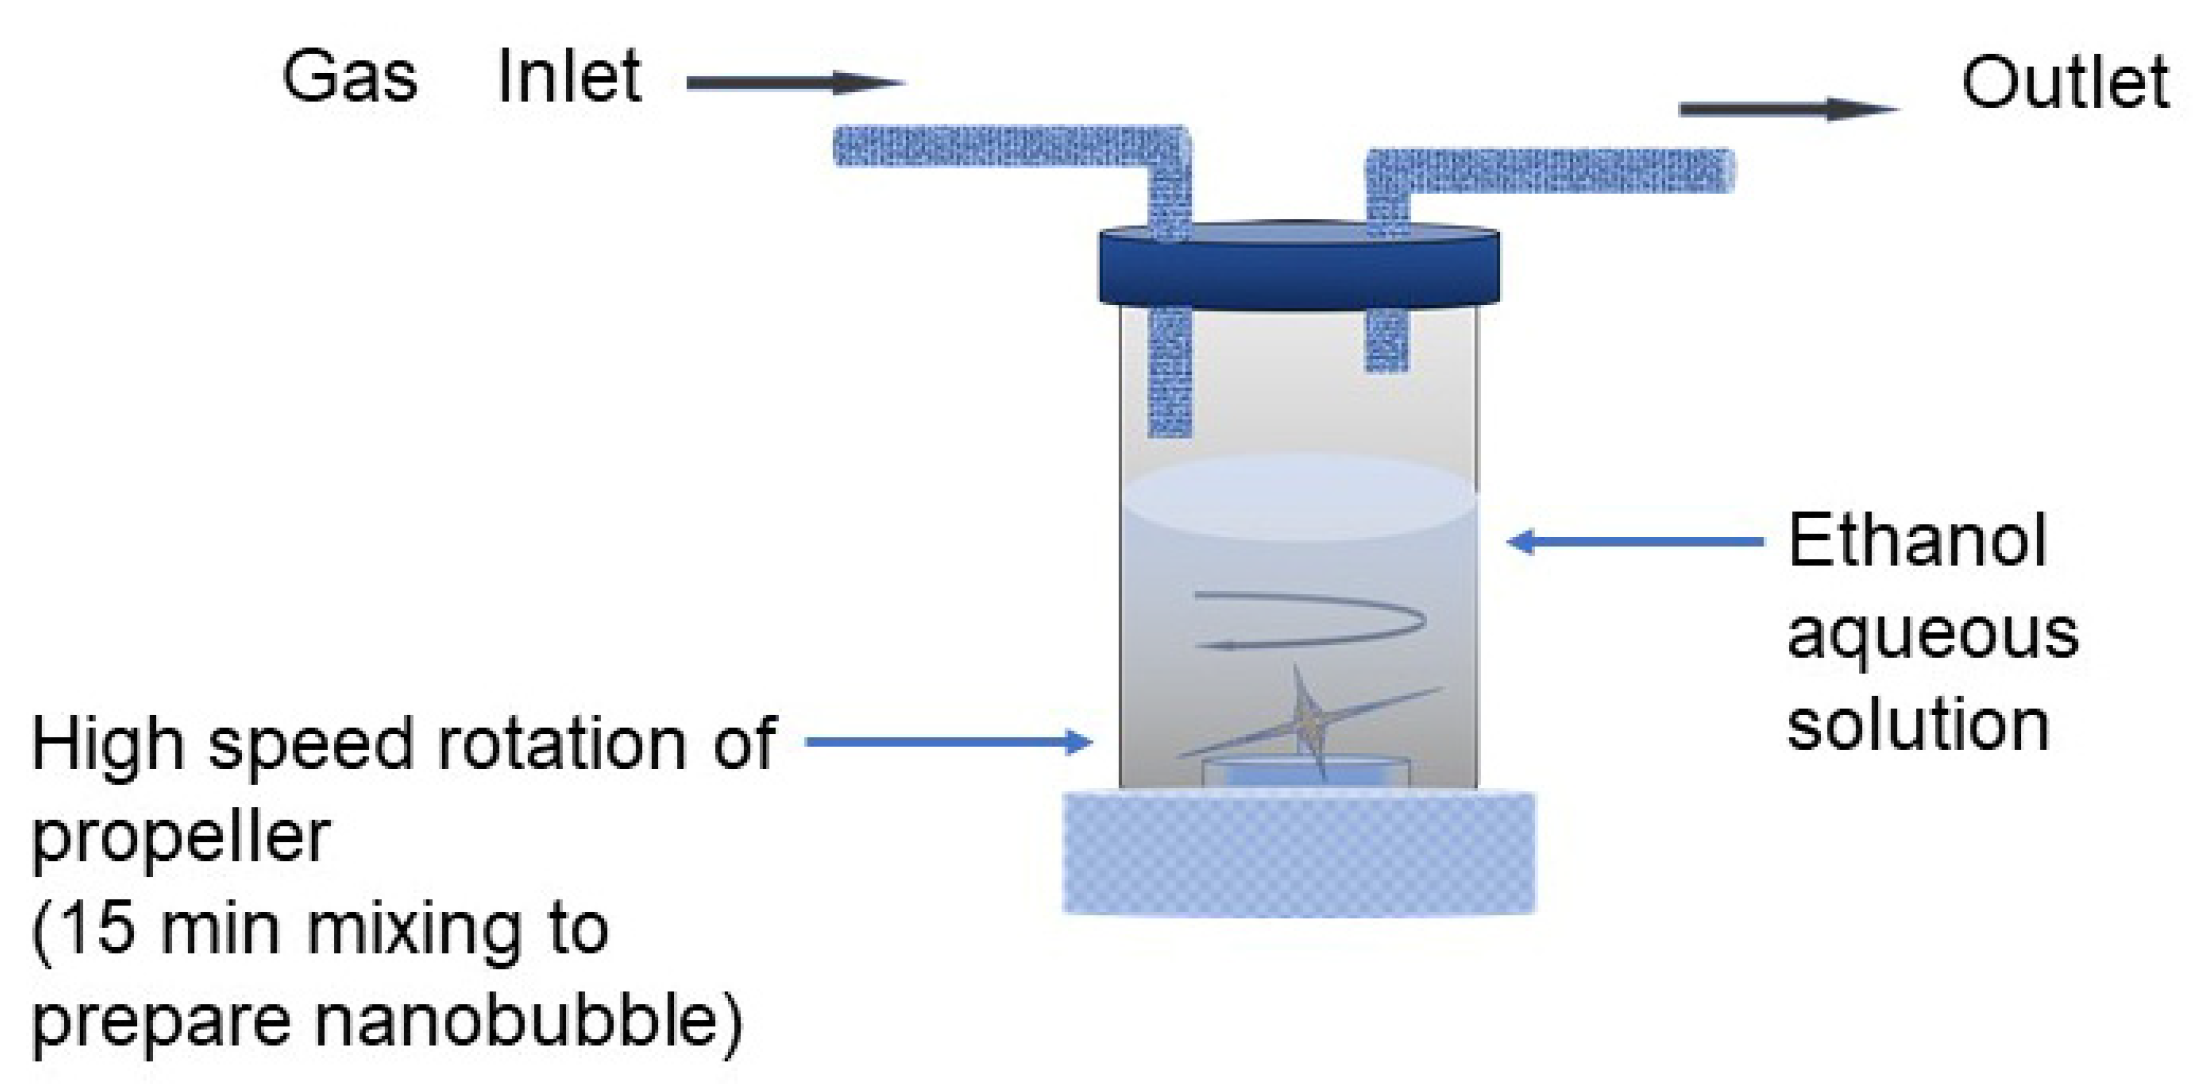
2.2.1. Nanobubble Preparation and Measurements

The nanobubbles were prepared using mechanical high-speed cavitation equipment (self-made equipment), as shown in Figure 1. The gases of 8% in Ar and CO2 were fed from the gas tank through the gas inlet, and the propeller mixing speed was 20,000 rpm using a 7.2 cm diameter of the blade. The gas mixture nanobubbles were prepared by initially blowing 8% H2 in Ar gas and then CO2 gas.
There are several bulk nanobubble preparation methods, such as the utilization of high-speed cavitation, pressure difference with circulation, ultrasonic wave, and passing ultrafine pores [33,34]. In this study, the equipment shown in Figure 1 was utilized to produce a large amount of nanobubbles in liquid in a fast manner. There are some methods to measure the nanobubble size; for example, dynamic light scattering (DLS), particle trajectory, resonant mass, and laser diffraction methods [34]. In particular, it was convenient to measure the particle/bubble size distribution by the DLS and particle trajectory methods discussed in previous studies of this group [35]. In this study, the nanobubble size distribution was measured by the DLS system (NanoBook Omni, Brookhaven Instruments, Holtsville, NY, USA). The nanobubble number density was obtained through outsourcing from NanoSight, NS300, Malvern (Worcestershire, UK). The zeta potential values were measured through the micro-electrophoresis method by the phase analysis light scattering method (NanoBrook Omni, Brookhaven Instruments, Holstville, NY, USA.).

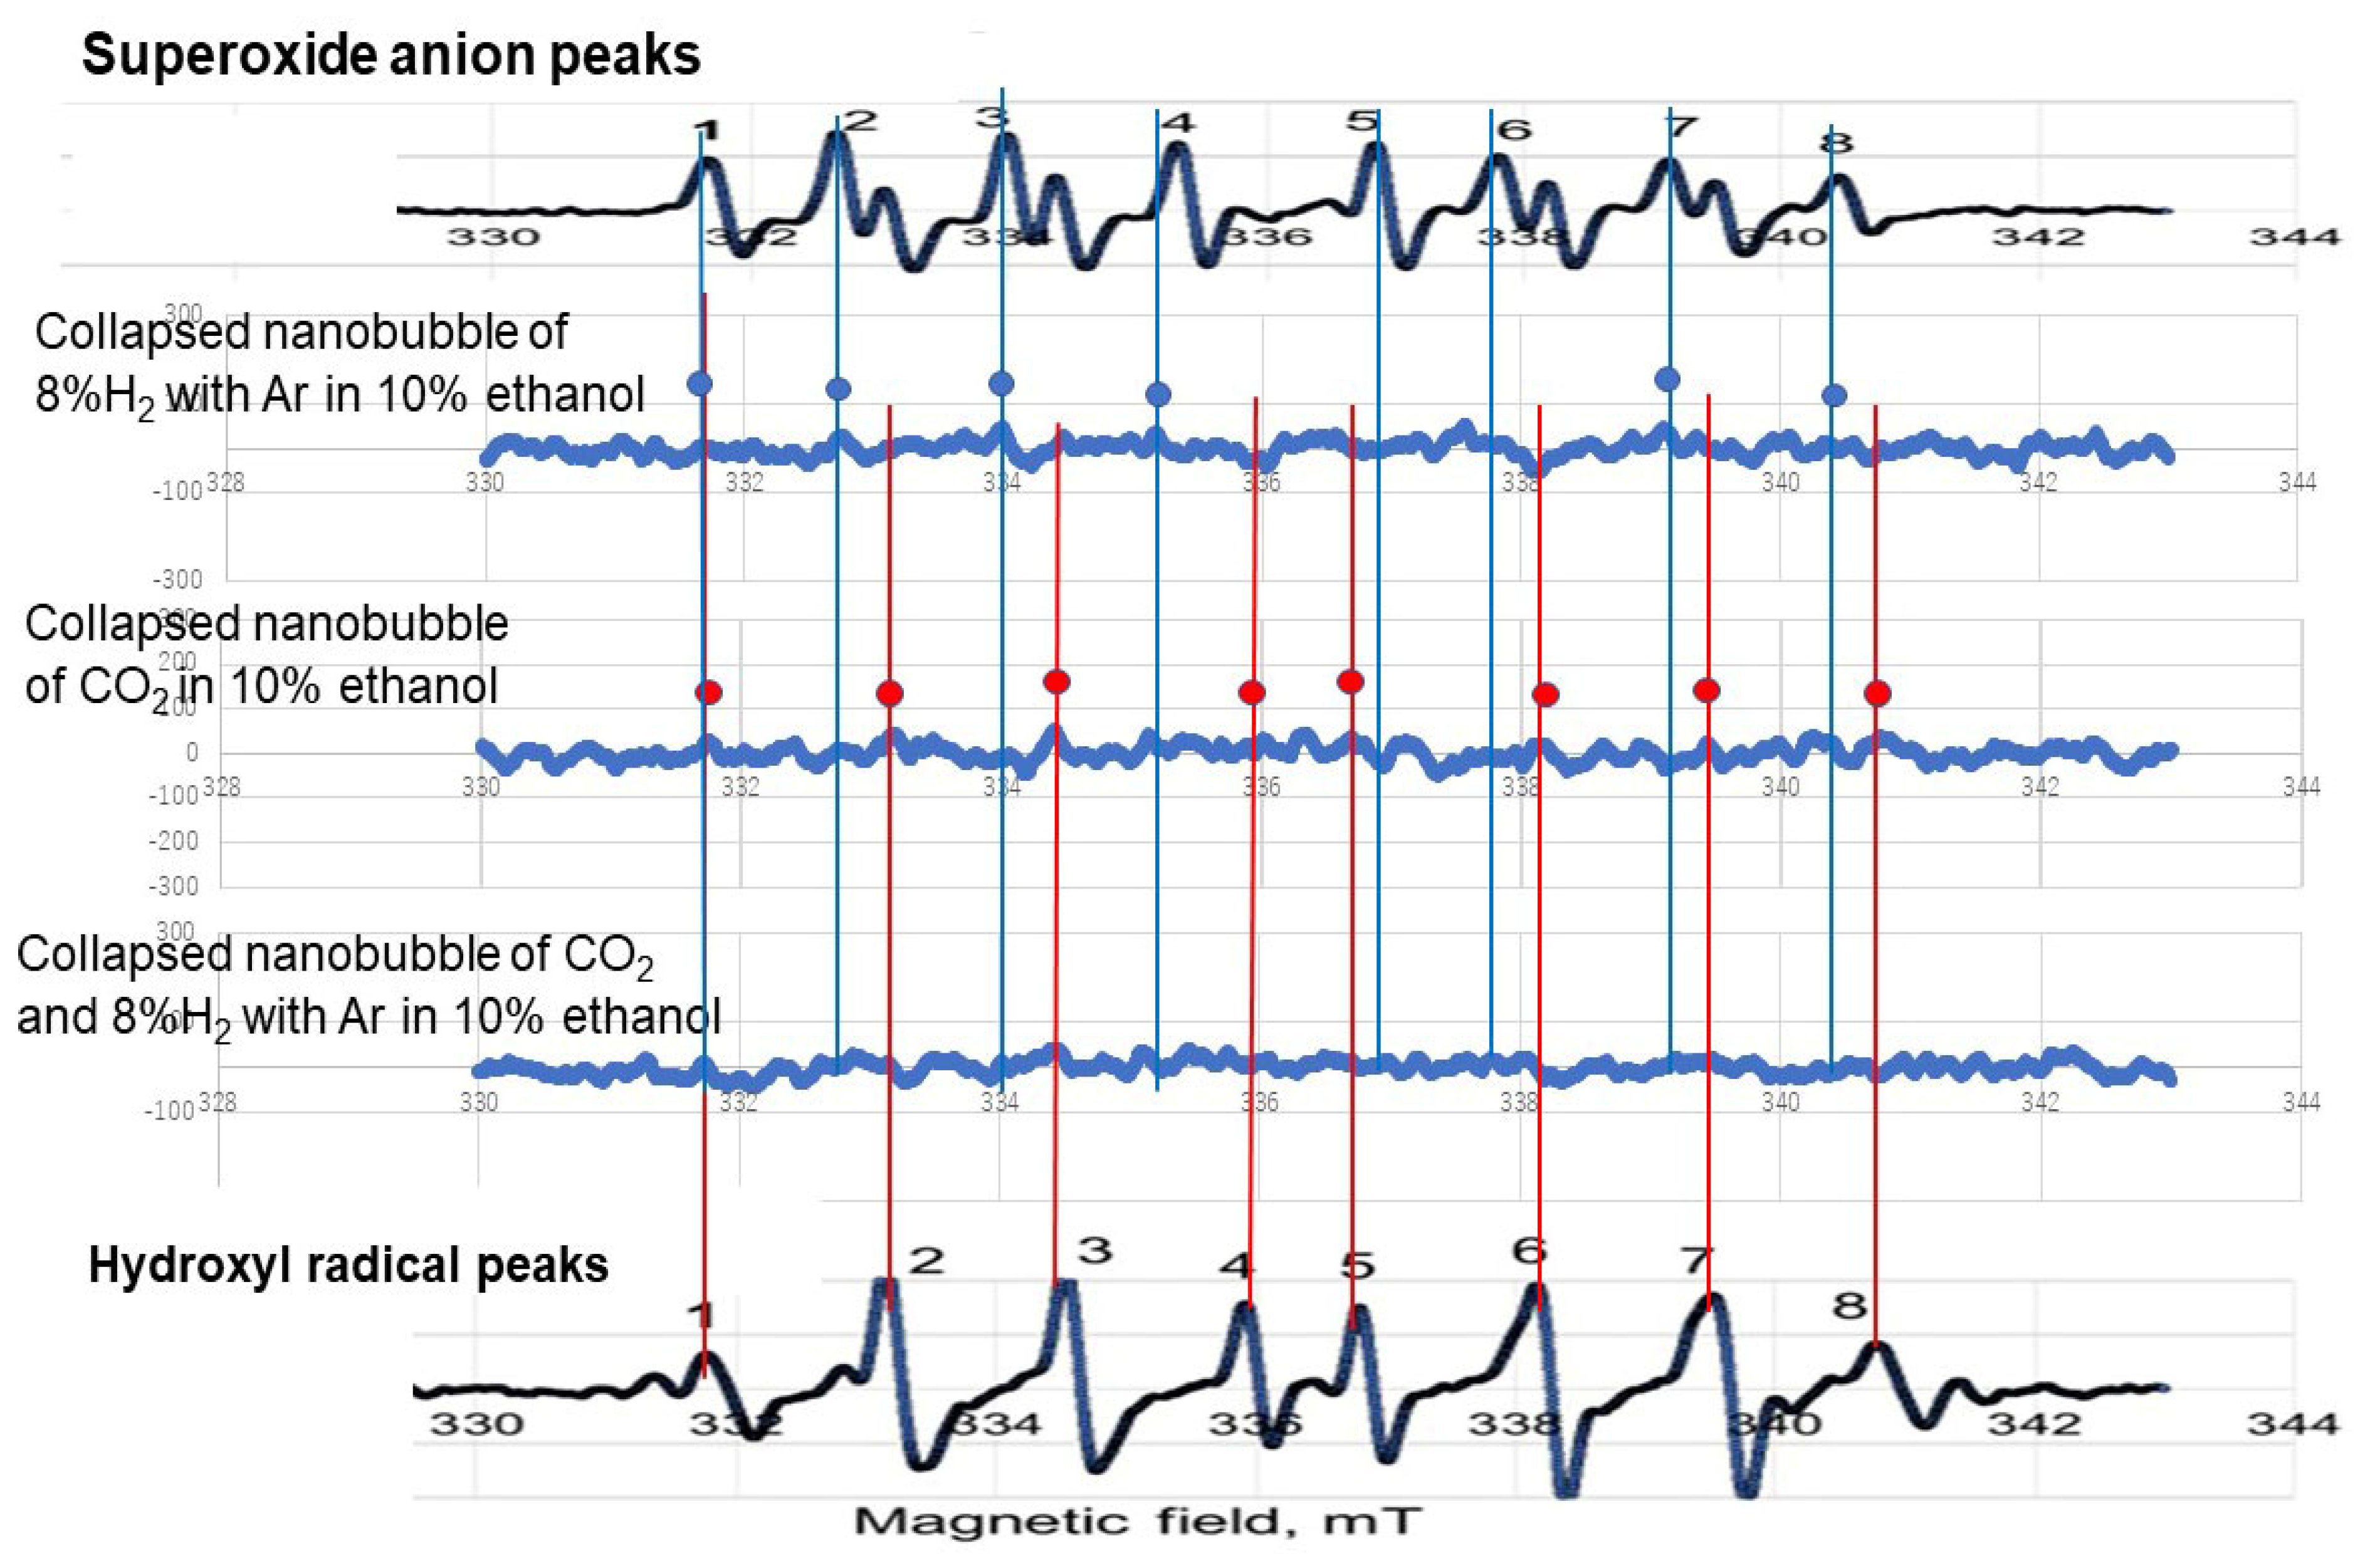
2.2.2. Radical Preparation and Measurement by ESR

The solution pH was adjusted to pH 9 for the three kinds of nanobubbles (i.e., 8% H2 in Ar, CO2, and a mixture of CO2 after 8% H2 in Ar) in ethanol aqueous solutions, and they were kept for 20 days. After 20 days, the pH of ethanol aqueous solutions was decreased to pH 5 by adding HCl aqueous solution, and the solutions were set in the ultrasonic wave vessel (SIBATA SCIENTIFIC TECHNOLOGY, Tokyo, Japan, SU, 40 kHz, 500 W) for 30 s; then, rapidly, the radicals were measured. The produced radicals were measured by the following procedure. A spin-trapping reagent, sc-5-(5,5-dimethyl-2-oxo-1,3,2-dioxapho-sphinan-2-yl)-5 methyl-1-pyrroline N-oxide (G-CYPMPO)24, was used by adding its solution. G-CYPMPO could spin-trap ·OH in UV (4 W, OHM ELECTRIC INC., Tokyo, Japan) illuminated condition and ·O2 [36,37,38]. A JEOL JES-TE25X ESR spectrometer (Tokyo, Japan) was used to obtain ESR spectra of free radicals of ·OH and ·O2. The measured peaks produced by nanobubble collapse were compared with eight kinds of peak positions of standard ·OH and ·O2.

3. Results and Discussion

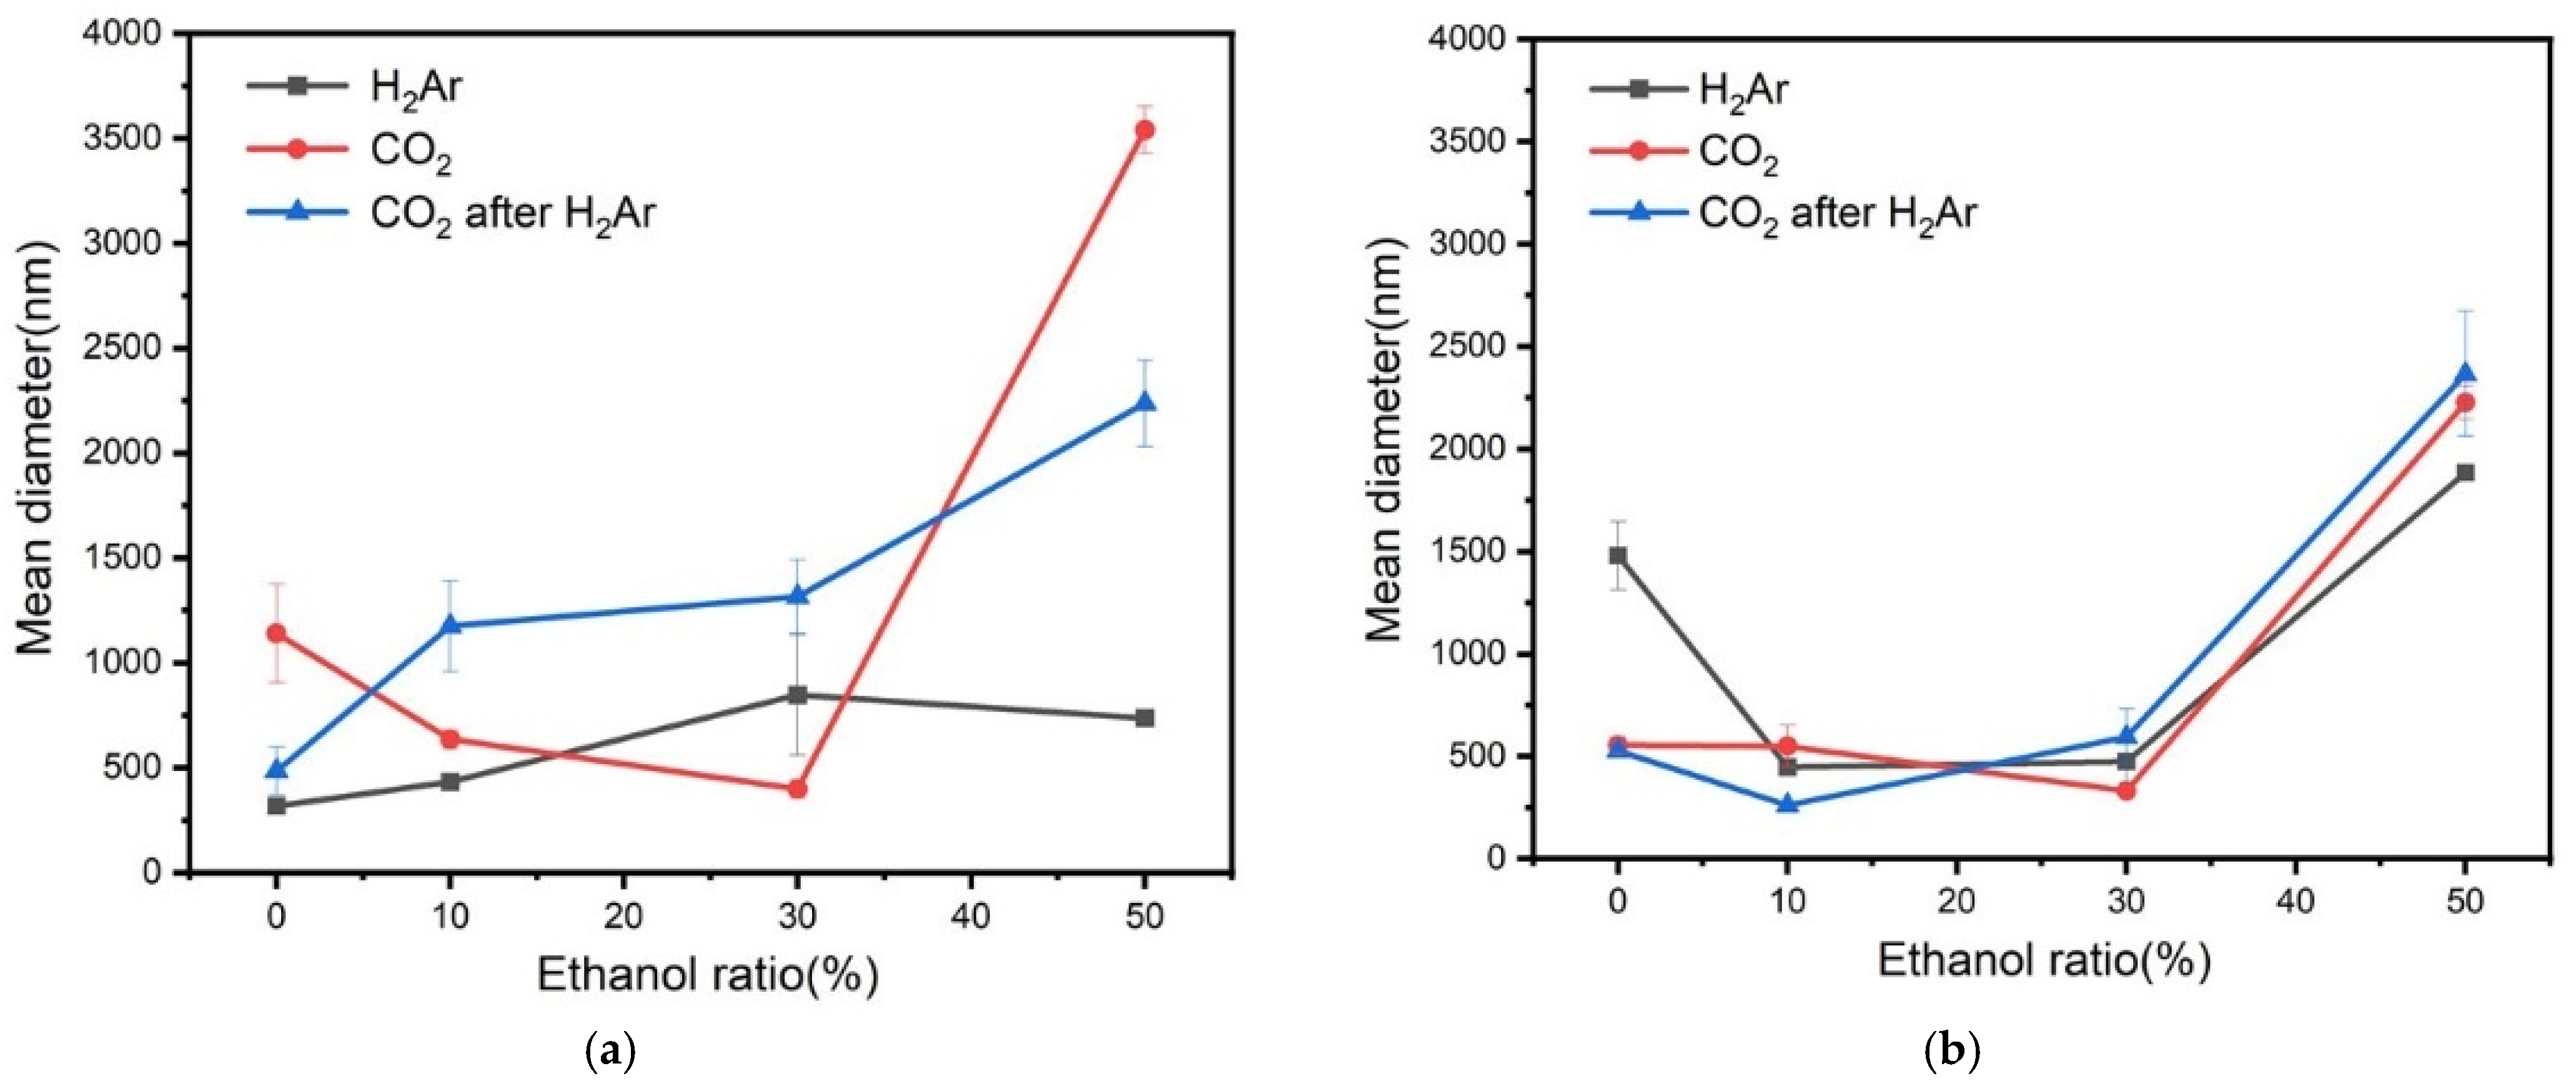
3.1. Determination of Diameter of Nanobubbles

The stability of nanobubbles in water was reported in the literature [35], and there are reports on the stabilization of bubbles by ion adsorption [39]. The nanobubbles displaying a higher absolute zeta potential value showed a good stability and constant nanobubble diameter for a long period. On the other hand, with a low zeta potential value, the nanobubble size quickly increased and disappeared. The zeta potentials of 8% H2 in Ar, CO2, and the mixture of 8% H2 in Ar and CO2 gas nanobubbles in water as a function of pH are shown in Figure 2 [35], where the isoelectric point (IEP) is in between 5 and 6. As shown in Figure 2, in the ethanol aqueous solution of less than 50 vol%, the zeta potentials of nanobubbles are also close to zero at pH 5. To maintain the stability of nanobubbles, the pH of ethanol aqueous solution containing nanobubbles can be adjusted to assign higher absolute zeta potential values on the bubble surface, for instance, at alkaline pH 9 or acidic pH 3. In this experiment, pH 9 was selected to examine the stability of bubbles and fits with the water quality standard pH (from 6.5 to 9.5 in EU directive [40]). The nanobubble stability was also evaluated by extended DLVO theory calculation, which will be discussed in the following Section 3.3.
When CO2 nanobubbles are added in 8% H2 in Ar nanobubbles containing aqueous solution, the CO2 solubility is high in aqueous solution and HCO3 ion is produced according to the acidity constant. The HCO3 ions are adsorbed on the positively charged bubbles. While in the alkaline region, CO32− ion is also produced according to equilibrium constant; however, anions are not adsorbed on the negatively charged bubbles. This agreed with the CO2 solubility phenomena explained in the literature [35].
The nanobubble mean diameters at pH 9 after 1 and 20 days are shown in Figure 3. The diameters of 8% H2 in Ar nanobubbles in ethanol aqueous solutions with various ethanol vol.% in the first day by controlling pH 9 are small and do not change significantly (between 300 and 750 nm). On the other hand, CO2 and CO2 after 8% H2 in Ar had noticeably large diameters at 50 vol.% ethanol aqueous solution (2000–3500 nm). The CO2 nanobubbles undergo mass loss at a higher pH, corresponding to the mass transfer process owing to the concentration gradient at the surrounding nanobubbles, and their mean diameter decreased [41]. Figure 3 shows that the CO2 diameter decreased after 20 days, in 0 vol.% (from 1300 to 600 nm) and 50 vol.% ethanol (from 3500 to 2200 nm). The nanobubble size at the CO2 after 8% H2 in Ar was larger at 10 and 30 vol% ethanol on the first day (1300 nm) than at 20 days (250–600 nm). It can be explained by Ostwald ripening [42], increasing the nanobubble size, and the size decreased after 20 days. After 20 days, the three kinds of nanobubble mean diameters existed from 300 to 600 nm in 10 and 30 vol% ethanol aqueous solution.

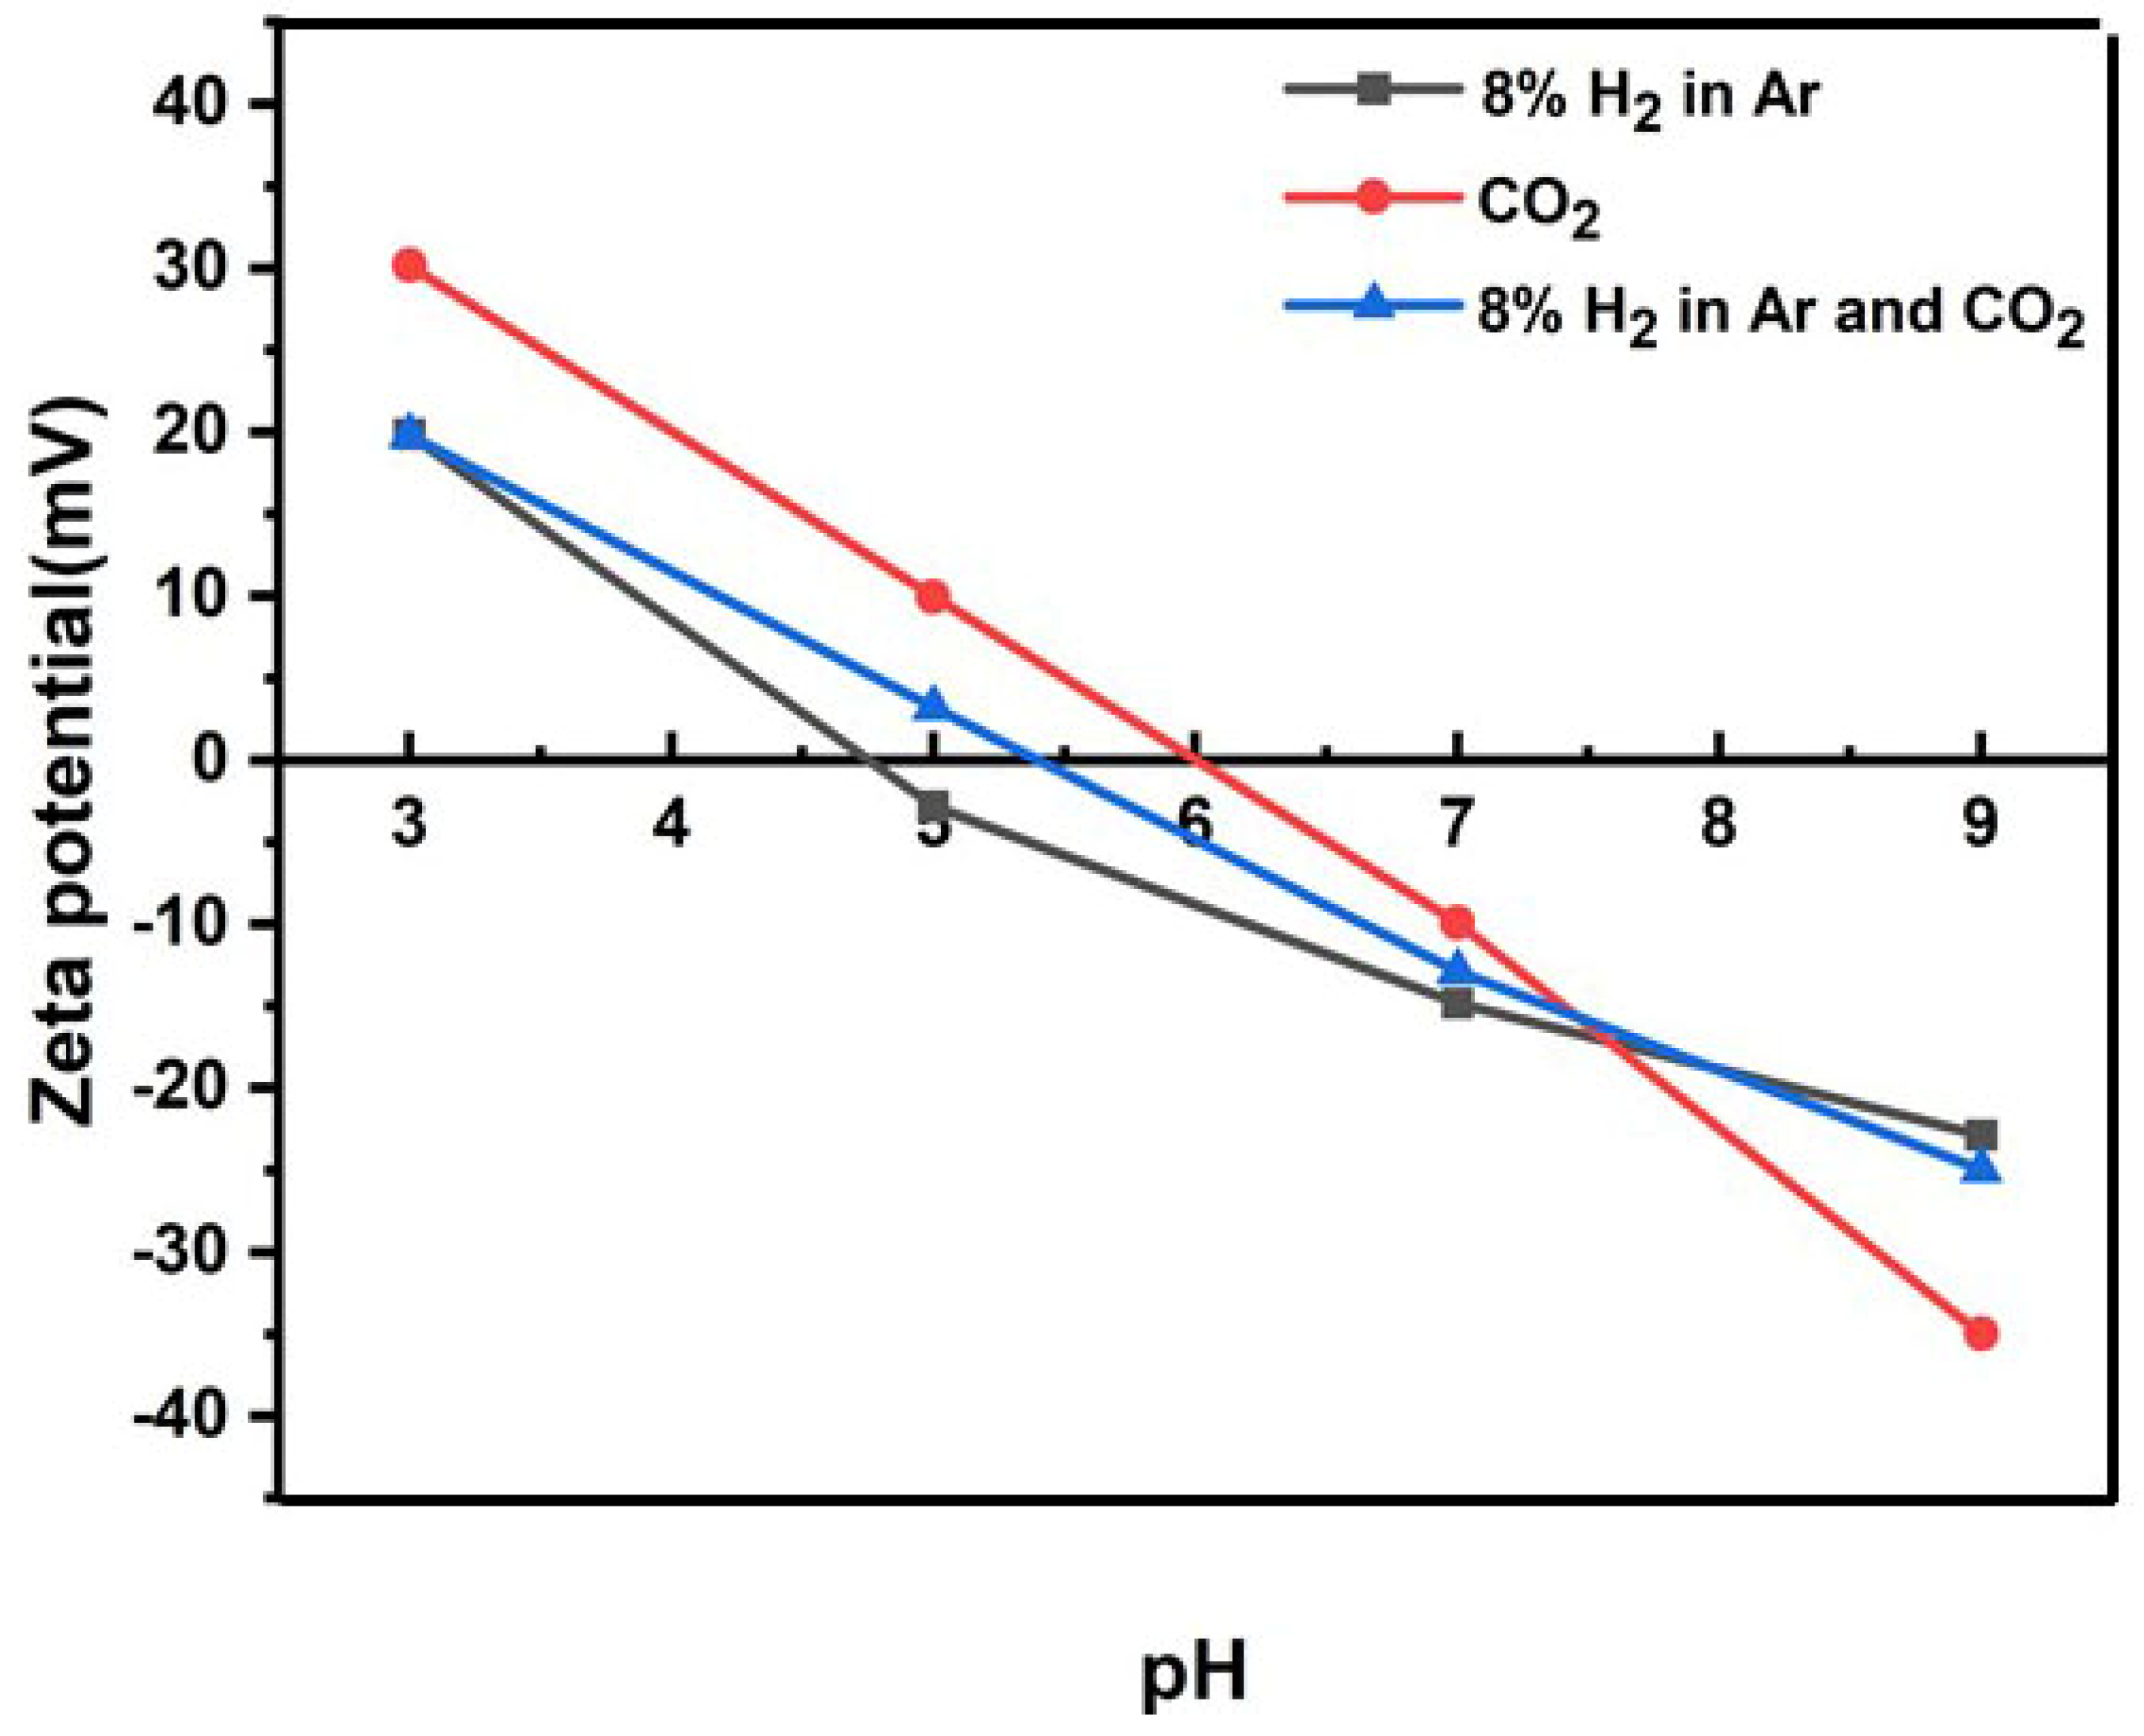
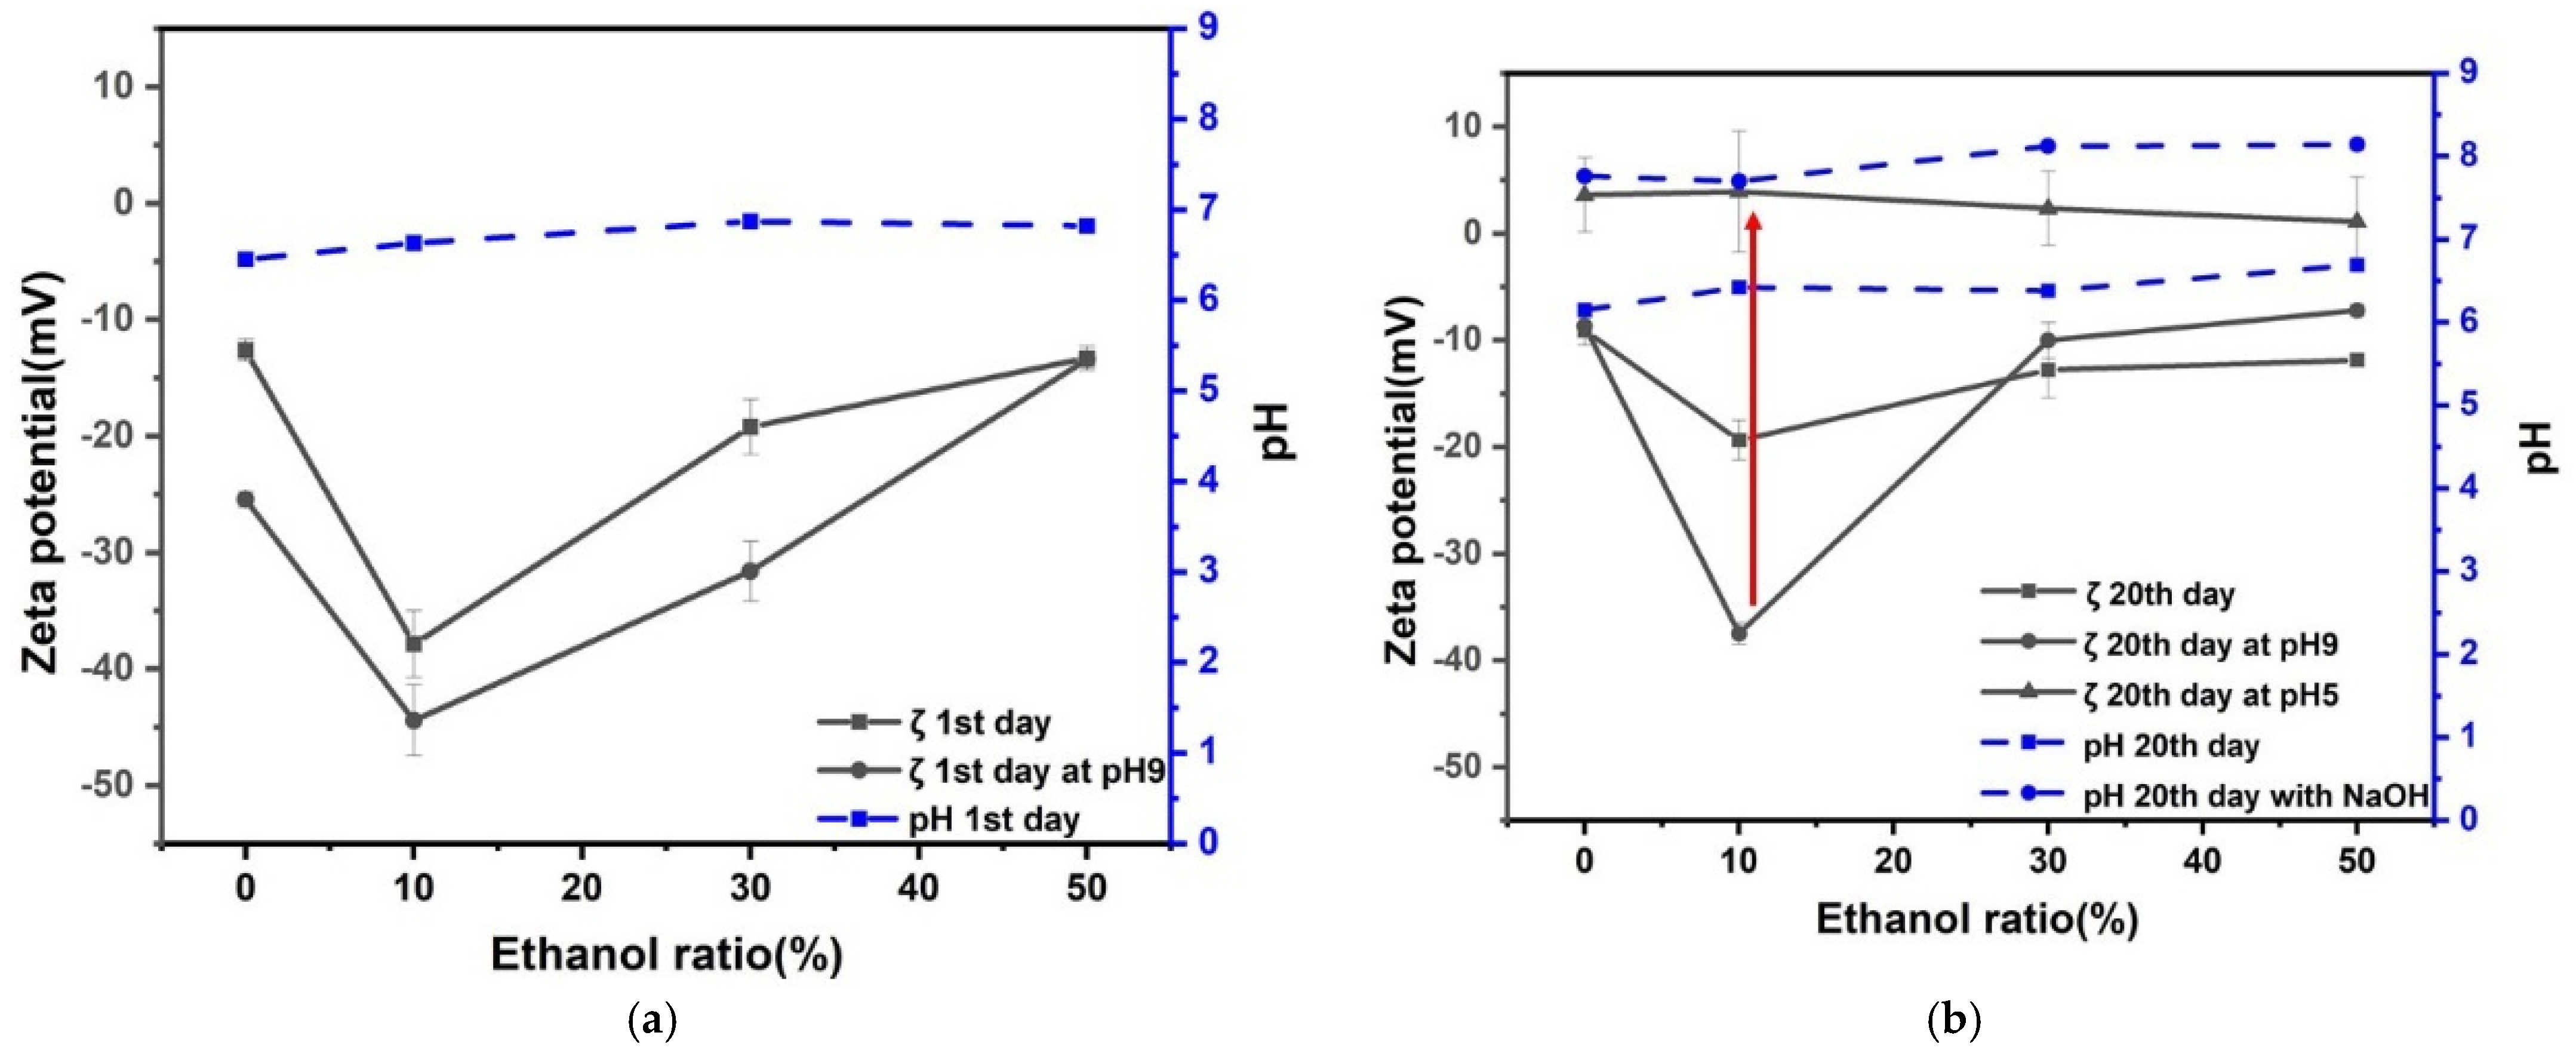
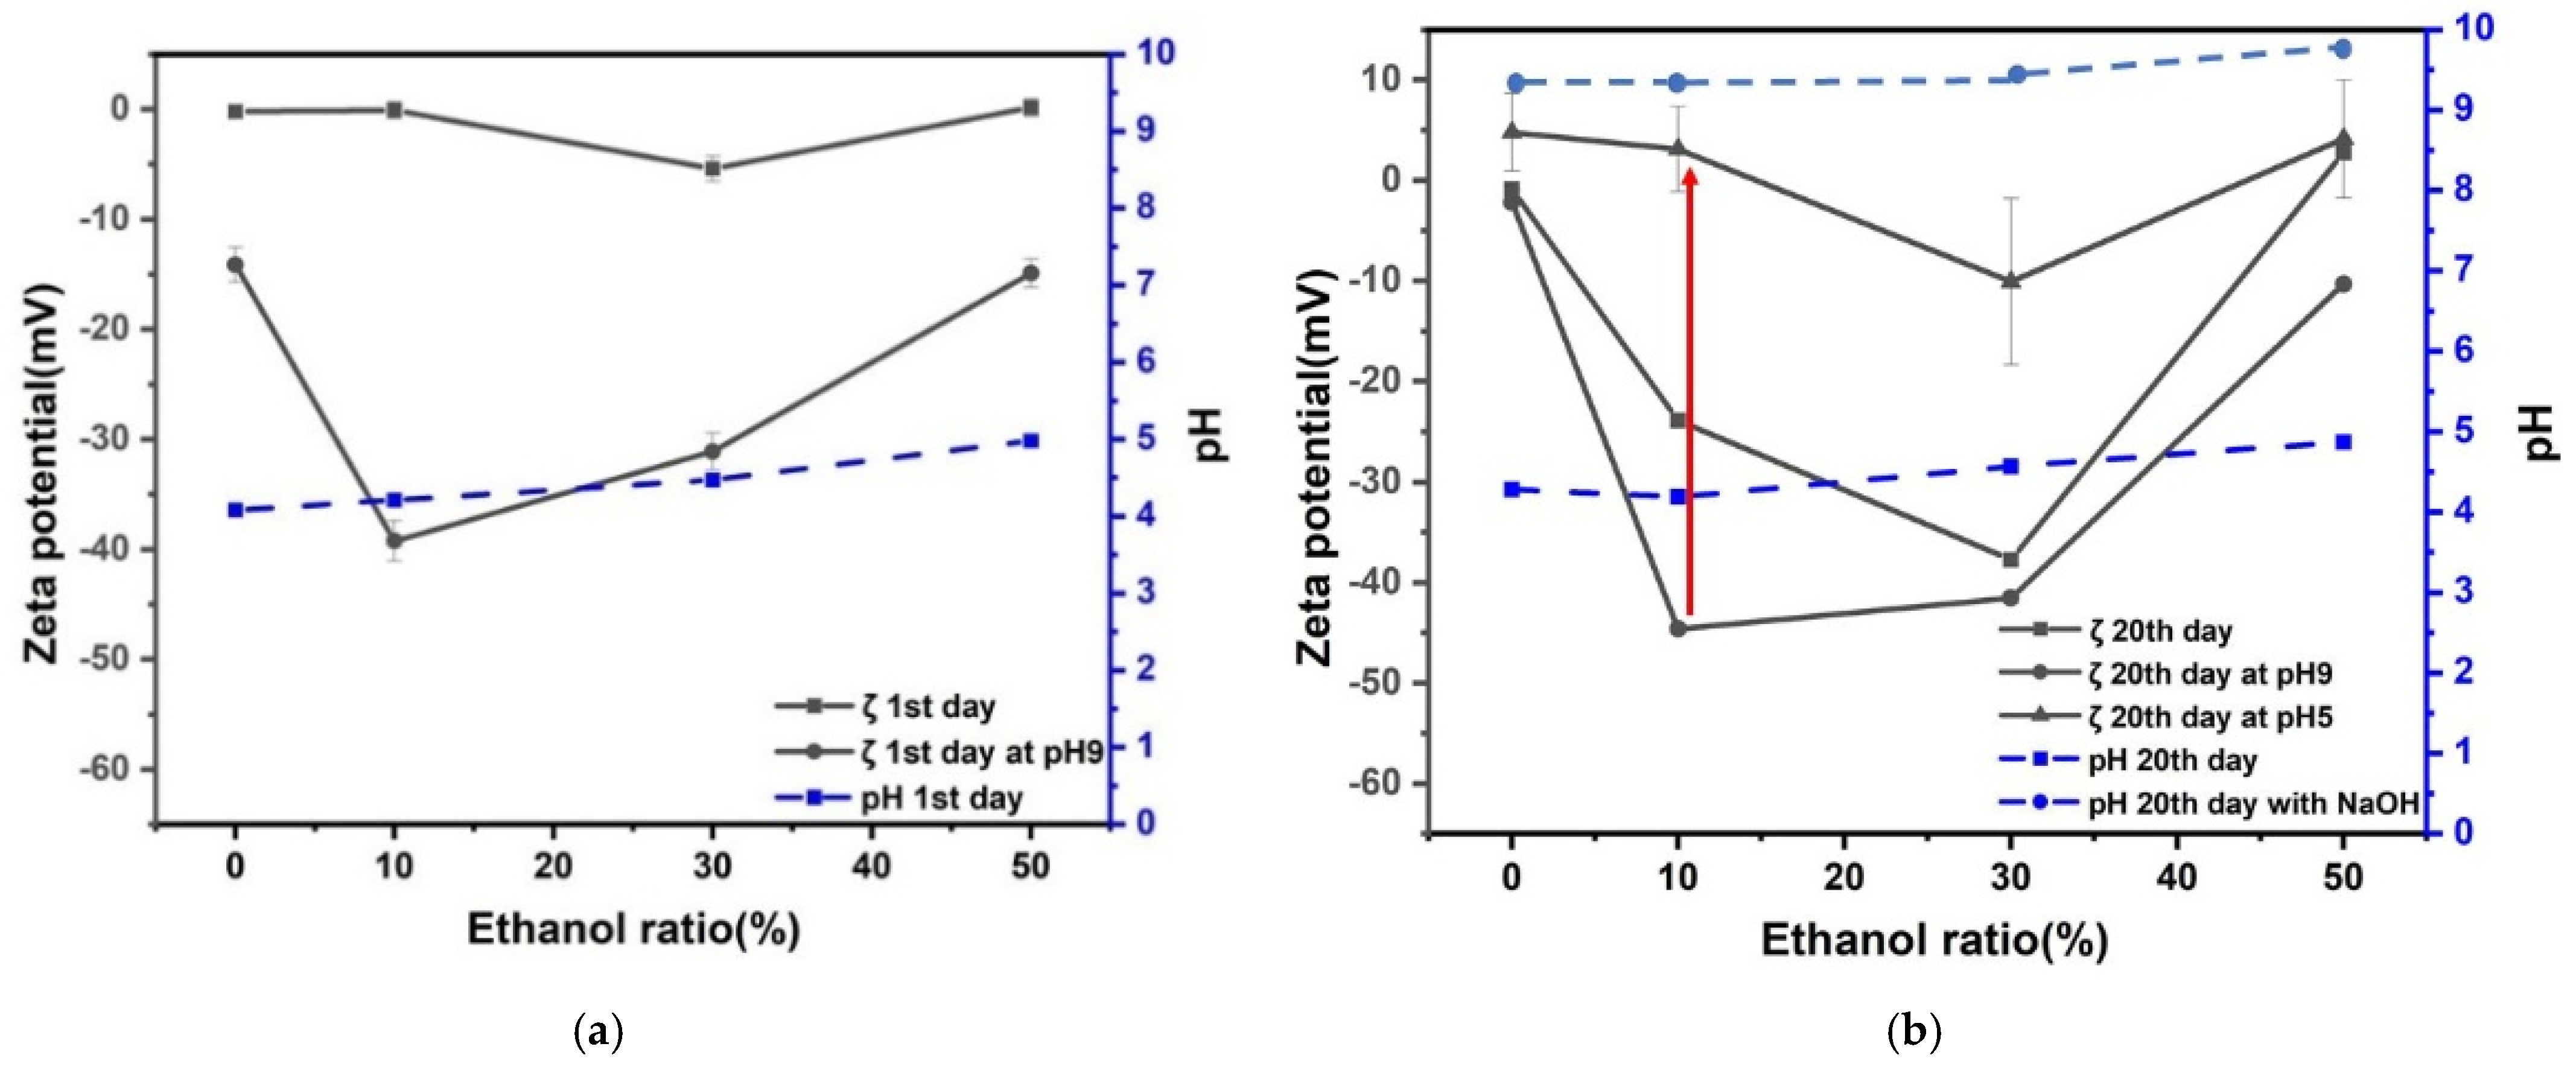
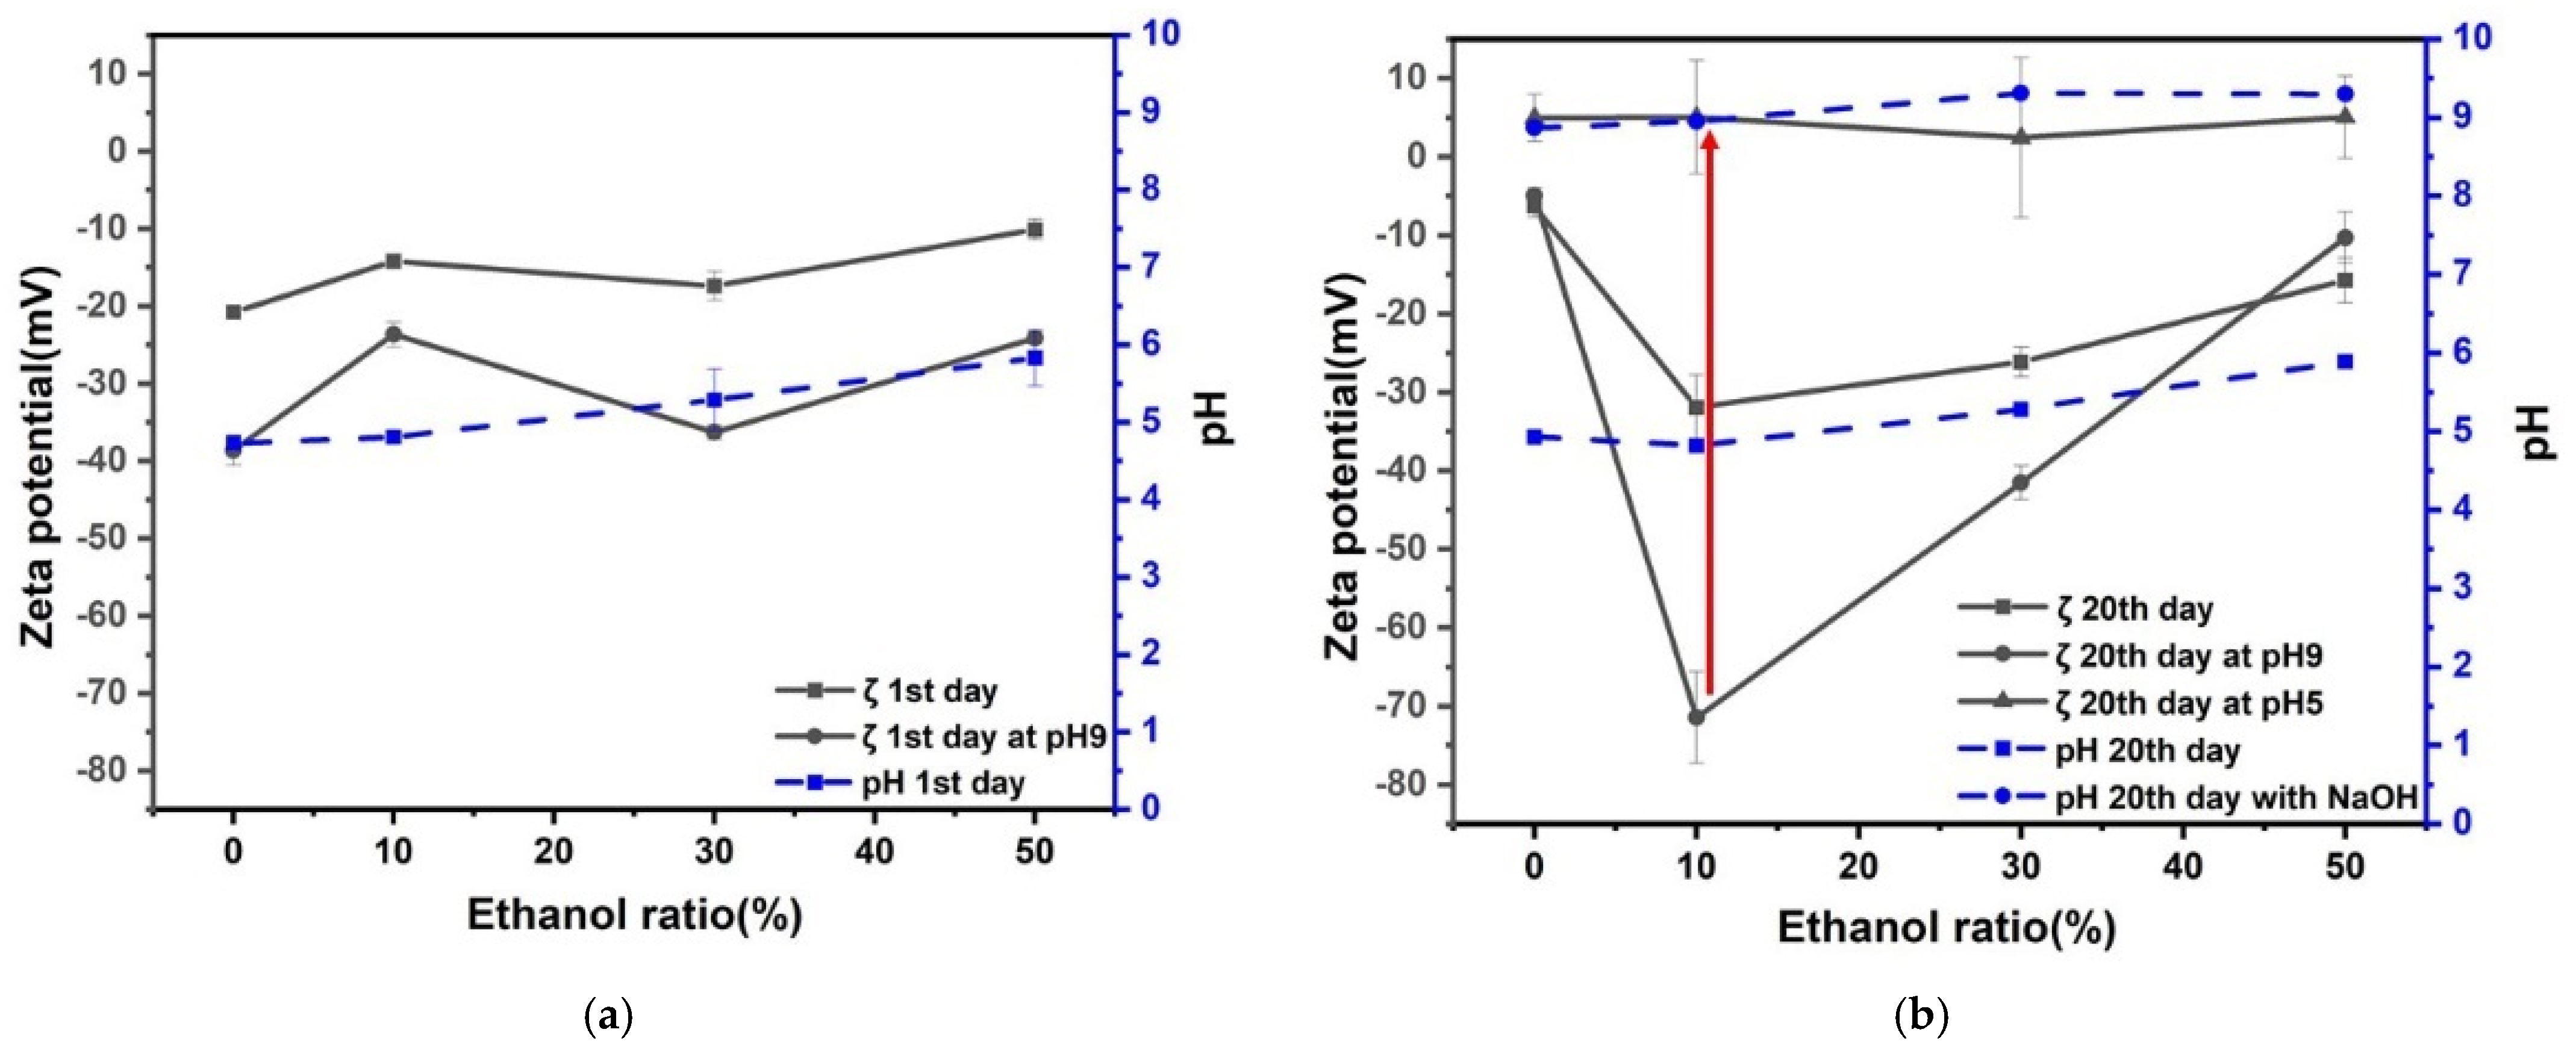
3.2. Effect of Ethanol Ratio in Zeta Potential and pH of Nanobubbles

Zeta potential and pH for 8% H2 in Ar nanobubble solution as a function of ethanol percentage in ethanol aqueous solution mixture after 1 and 20 days are shown in Figure 4. The natural pH of nanobubble solutions was around pH 6 to 7 after 1 and 20 days. Once the solution pH was adjusted to pH 9 by adding NaOH aqueous solution after the first day; it decreased to pH around 8 after 20 days, and the absolute value of the negative zeta potential decreased. The hydrogen solubility in ethanol is explained by Henry’s law [31]. The pH solutions at around pH 8 were adjusted to 5 by adding HCl aqueous solution. The zeta potential of 8% H2 in Ar nanobubbles at pH 5 was positive of a few mV, regardless of ethanol percentage. In particular, the zeta potential deviation was the largest (between −45 and 5 mV) at 10 vol% ethanol aqueous solution during the above-mentioned conditioning procedures. Thus, the radical production by 8% H2 in Ar nanobubbles in 10 vol% ethanol aqueous solution was investigated by changing the pH from 9 to 5 after 20 days, and the results will be discussed in Section 3.5.
Zeta potential and pH of CO2 nanobubble solution as a function of ethanol percentage in ethanol aqueous solution mixtures after 1 and 20 days are shown in Figure 5. The natural pH of nanobubble solutions was around pH 4 to 5 after 1 and 20 days. Once the solution pH was adjusted to pH 9 by adding NaOH aqueous solution on the first day, the solution pH increased to between 9 and 10 after 20 days, and the absolute value of negative zeta potential increased 5 to 10 mV at 10 to 30 vol% ethanol aqueous solution. Our results agreed with the literature. The pH of the aqueous solution containing CO2 gas nanobubbles slightly increased after several days compared with the pH under the initial condition [35]. Dalmolin et al. [32] showed that the CO2 solubility in ethanol aqueous solution increased by increasing the ethanol mole fraction and pressure and decreasing the temperature.
The pH of solutions with pH around 8 were adjusted to pH 5 by adding HCl aqueous solution. The zeta potential of CO2 nanobubbles at pH 5 was a few negative mV. In particular, the zeta potential deviation was the largest (between −45 and 5 mV) at 10 vol% ethanol aqueous solution during the above-mentioned conditioning procedures. This can be explained by the bubble collapse. Therefore, the radical production by CO2 nanobubbles in 10 vol% ethanol aqueous solution was investigated by changing the pH from 9 to 5 after 20 days, and the results will be discussed in Section 3.5.
Zeta potential and pH of the mixture of CO2 and 8% H2 in Ar nanobubble solution as a function of ethanol percentage in ethanol aqueous solution mixtures after 1 and 20 days are shown in Figure 6. The natural pH of nanobubble solutions was around pH 5 to 6 after 1 and 20 days. On the other hand, once the solution pH was adjusted to pH 9 by adding NaOH aqueous solution on the first day, the solution pH increased to between 9 and 9.5 after 20 days, and the absolute value of negative zeta potential increased from 10 to 30 vol.% ethanol aqueous solution (−40 to −50 mV).
The pH of the solutions at around pH 9 were adjusted to pH 5 by adding HCl aqueous solution. The zeta potential of nanobubbles at pH 5 was slightly positive (i.e., about 5 mV), regardless of ethanol percentage. In particular, the zeta potential deviation was the largest (between −50 and 5 mV) at 10 vol% of ethanol aqueous solution during the above-mentioned conditioning procedures, similar to other results shown in Figure 4 and Figure 5. The radical production by CO2 and 8% H2 in Ar nanobubbles in ethanol aqueous solution was investigated by changing the pH from 9 to 5 after 20 days, and the results will be discussed in Section 3.5.
The three kinds of well stabilized nanobubbles (8%H2 in Ar, CO2, and CO2 after 8%H2 in Ar) at pH 9 in the 10 vol.% ethanol solution displayed decreases in the zeta potential to near zero when adjusting pH to 5, and during such pH adjustment, there was a possibility to produce the radicals originated from the nanobubble collapse. This point will be further discussed in the following Section 3.3 (nanobubble stability), Section 3.4 (nanobubble number), and Section 3.5 (radical production).

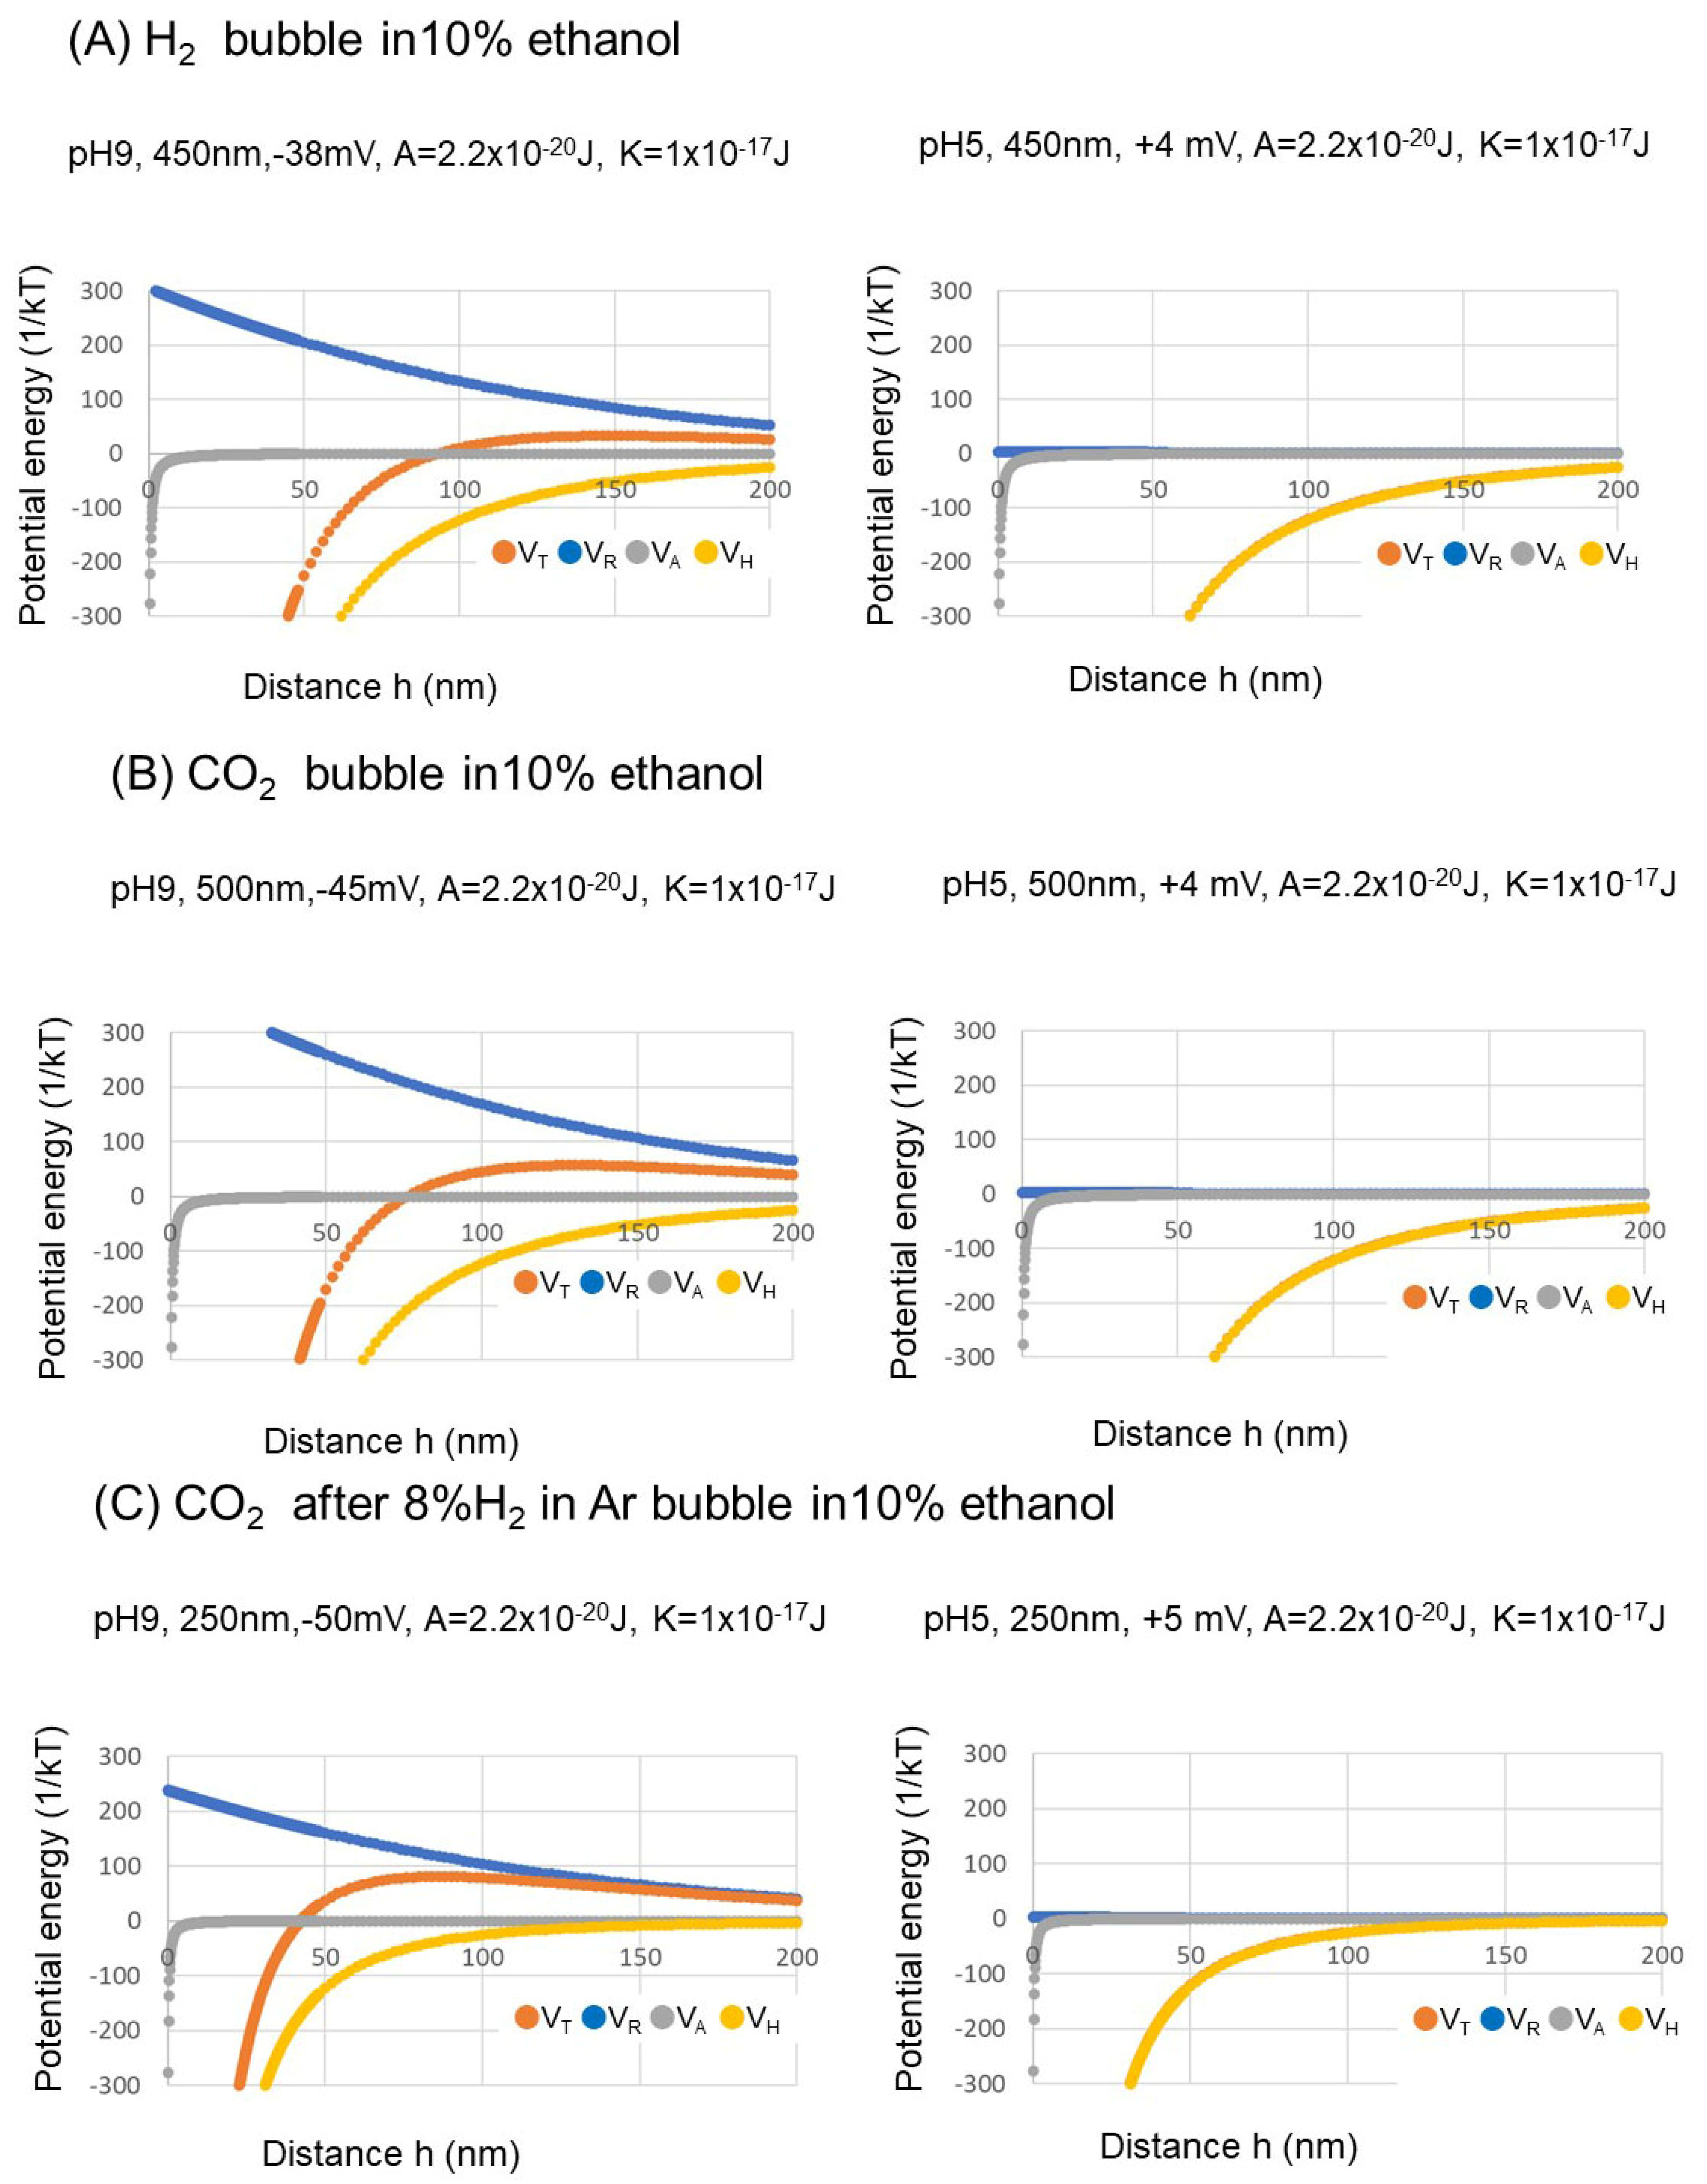
3.3. Nanobubble Stability Evaluation Using Extended DLVO Theory

Among many kinds of stabilization models for nanobubbles, Tan et al., 2021 suggested that the charge stabilization model can provide reasonable and consistent explanations [15].
In this study, bubble stabilization was evaluated by the extended DLVO theory using our experimental results of bubble size (Figure 3) and zeta potential (Figure 4, Figure 5 and Figure 6). Two bubble interactions can be expressed by extended DLVO theory [35,43,44]. Here, the extended DLVO theory is utilized as qualitative analysis. When two same radii (a) of nanobubbles are set at the surface-to-surface distance (h) between them in the ethanol aqueous solution, the total potential energy (VT) can be the sum of van der Waals interaction energy (VA), hydrophobic interaction energy (VH), and the electrostatic interaction energy (VR). VT is described in Equations (1) and (2), normalized by the absolute temperature (T) and Boltzmann constant (kB).
V   T k B T = V A + V H + V R k B T
V A + V H = A + K 6 2 a 2 h 4 a + h + 2 a 2 2 a + h 2 + l n h 4 a + h 2 a + h 2
where the Hamaker constant is A and hydrophobic constant is K.
The Hamaker constant A for air in water (air-water-air value) is 3.7 × 10⁻²⁰ J [45]. As the Hamaker constant A is proportional to the surface tension of solvent, 2.2 × 10⁻²⁰, 1.7 × 10⁻²⁰, and 1.4 × 10⁻²⁰ J were used as A for air in 10, 30, and 50 vol.% ethanol aqueous solution, respectively. Hydrophobic constant K was estimated at 10−17 J in the absence of salt and 10−19 J in a 1 mM NaCl aqueous solution [44]. In a 1 M ethanol aqueous solution, K is about 3 to 7 × 10⁻¹⁷ J, which is 3 to 7 times larger than K in water [46]. In this article, at 10 vol.% ethanol aqueous solution at pH 9 and 0.01 mM, 1 × 10⁻¹⁷ J was used as K.
When the surface charge of nanobubbles is Ψ , κ   is the Debye–Hückel parameter; ϵ r   and   ϵ o are relative permeability and space permeability, respectively; and V R is shown in Equations (3) and (4).
  V R = π ϵ r ϵ o a ψ 2 l n 1 + exp κ h 1 exp κ h + l n 1 exp 2 κ h
κ = 2 π z 2 e 2 ε r ϵ o k T
where n is the concentration of anions or cations in the solution and is equal to 1000 NAC (NA is the Avogadro’s number and C is concentration in mol/L), z is the valence of ion, e is the electron charge, and the thickness of the electric double layer of the nanobubble is Debye length = 1/ κ .
The total potential energy based on electrostatic interaction energy, van der Waals interaction energy, and hydrophobic interaction energy as a function of the bubble distance at pH 9 and pH 5 of three kinds of gas nanobubbles (i.e., 8%H2 in Ar, CO2, and CO2 after 8%H2 in Ar)) is shown in Figure 7. The total potential energy barriers at pH 9 of three types of nanobubbles exist with a high negative zeta potential. The various potential energies in the −38, −45, and −50 mV zeta potential of 8% H2 in Ar, CO2, and CO2 after 8% H2 in Ar nanobubbles at pH 9 are shown (A, B, C) in Figure 7, respectively. The extended DLVO theory was utilized as qualitative explanation between the bubble’s stability in this paper. The retardation in van der Waals potential can be estimated at least at a longer separation distance than about 15 nm according to Israelachvili, 1985 [47]. Between hydrophobic surfaces, very-long-range attraction can be observed in Figure 7, as also reported for separation [48].
The long-distance hydrophobic forces are evident. In contrast, the total potential is larger than 20 kBT at more than 100 nm distance and maintains the stability of bubbles owing to the strong repulsion explained by high electrostatic interaction energy. The maximum total potential energy VT 15 kBT would be the boundary to determine coagulation or dispersion [49]. The total potential energy barrier appeared at 8% H2 in Ar, CO2, and CO2 and 8% H2 in Ar nanobubbles at 10 vol.% ethanol aqueous solution at pH 9 (Figure 7). On the other hand, at pH 5, the absolute zeta potential value becomes less than 5 mV for three kinds of gas nanobubbles and total potential energy barrier disappeared owing to negligible electrostatic repulsion (VR, Figure 7). Therefore, at pH 5, nanobubbles would break owing to the low bubble surface charge, and thus make larger bubbles by bubble coalescence. Zhang et al., 2011 suggested that a higher than 20 vol.% ethanol solution may remove the nanobubbles and cause them to disappear, and is related to the long-range hydrophobic force with ethanol contents [18]. At 50 vol.% ethanol aqueous solution, the zeta potentials for three kinds of nanobubbles initially controlled at pH 9 were about −10 mV after 20 days, and bubble size was large—around 2000 nm—as shown in Figure 3, and not stable.

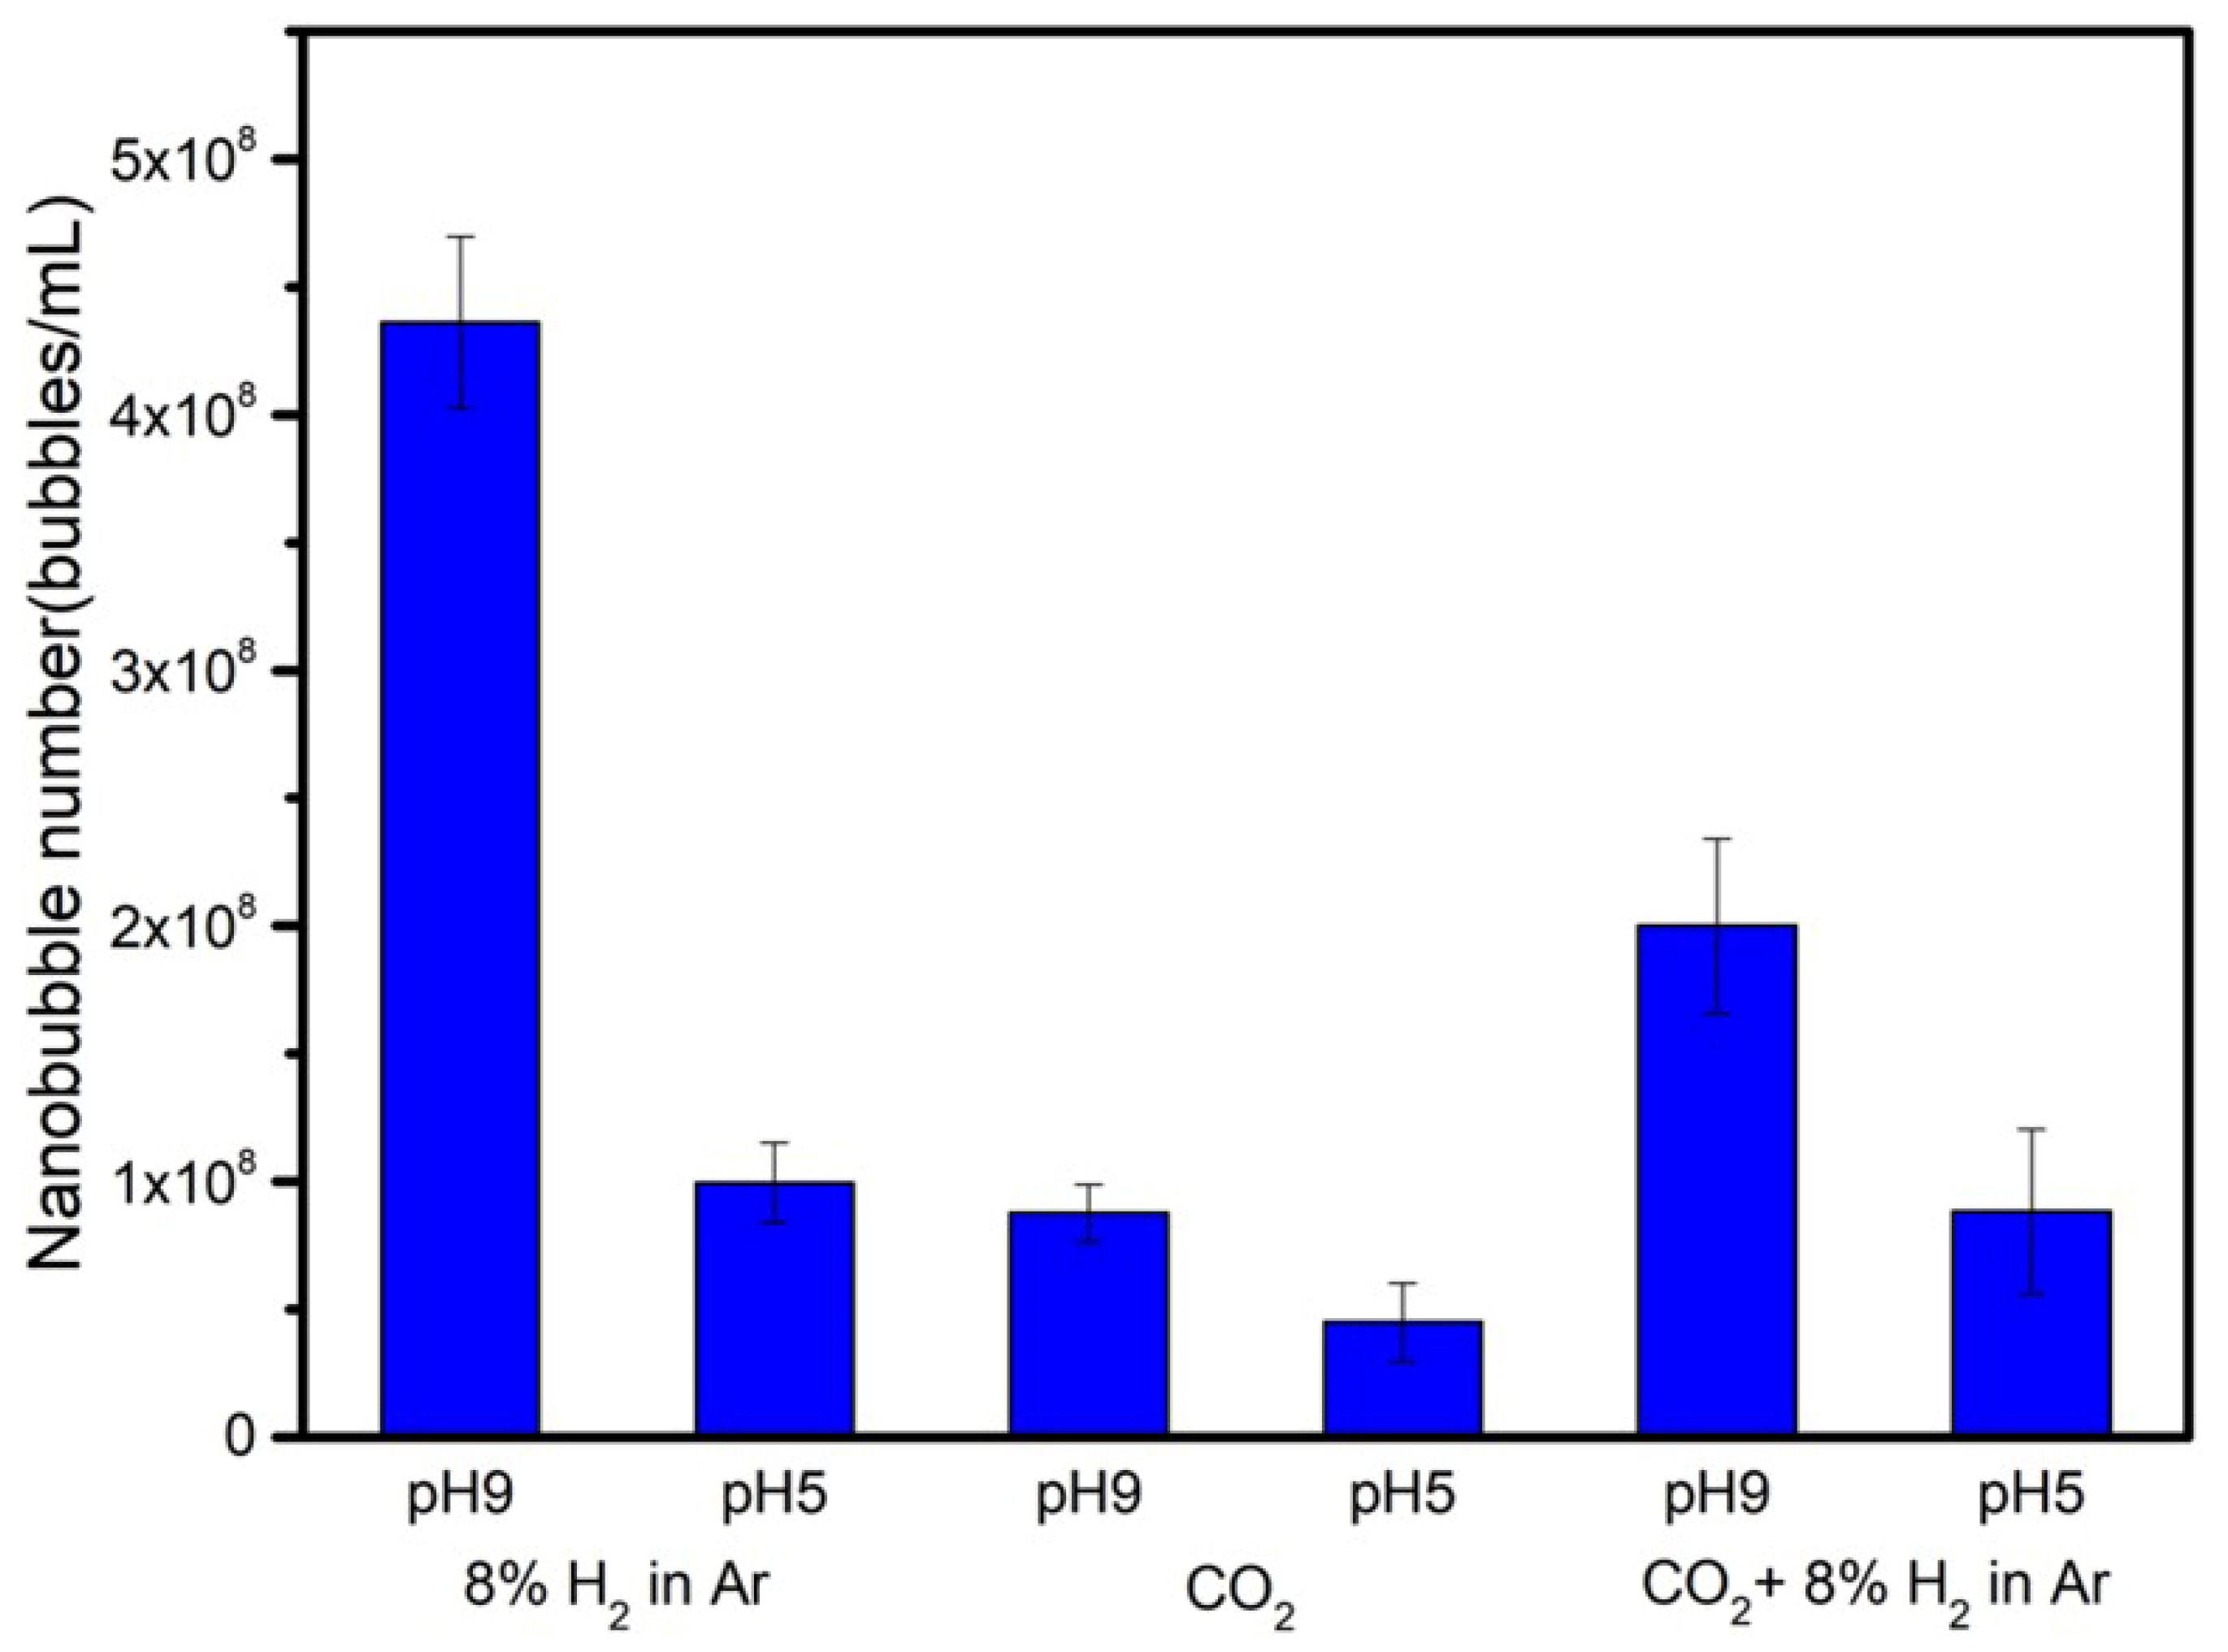
3.4. Number of Nanobubbles

The nanobubble numbers for three kinds of gas (8% H2 in Ar, CO2, and CO2 after 8% H2 in Ar) in 10 vol.% ethanol aqueous solution mixtures were investigated at pH 9 and pH 5 by nano site after 20 days, and the results are shown in Figure 8. The nanobubble number decreases from pH 9 to pH 5 for each nanobubble solution. In particular, the nanobubble number of 8%H2 in Ar decreased the largest from 4 × 10⁸ to 1 × 10⁸ bubbles/mL. As the nanobubble number decreased from pH 9 to pH 5, the nanobubbles became larger by their coalescence and were broken. When the nanobubbles were broken, there was a possibility to produce radicals. Takahashi et al., 2021, reported that ∙OH was generated from the collapsing microbubbles, including oxygen with 2 vol% ozone in 1 mM FeSO4 aqueous solution under strongly acidic conditions without ultrasound or a large pressure difference [25]. The following Section 3.5 will report and discuss the experimental results on radical observation as a function of solution pH.

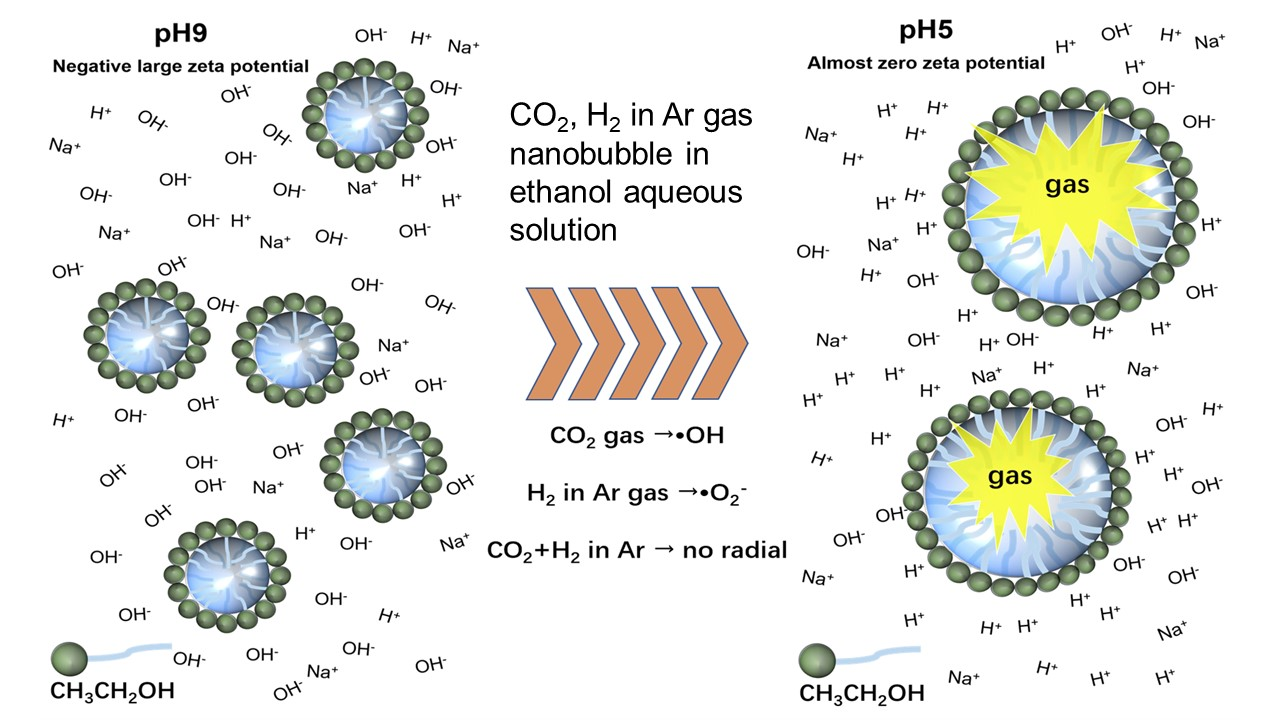
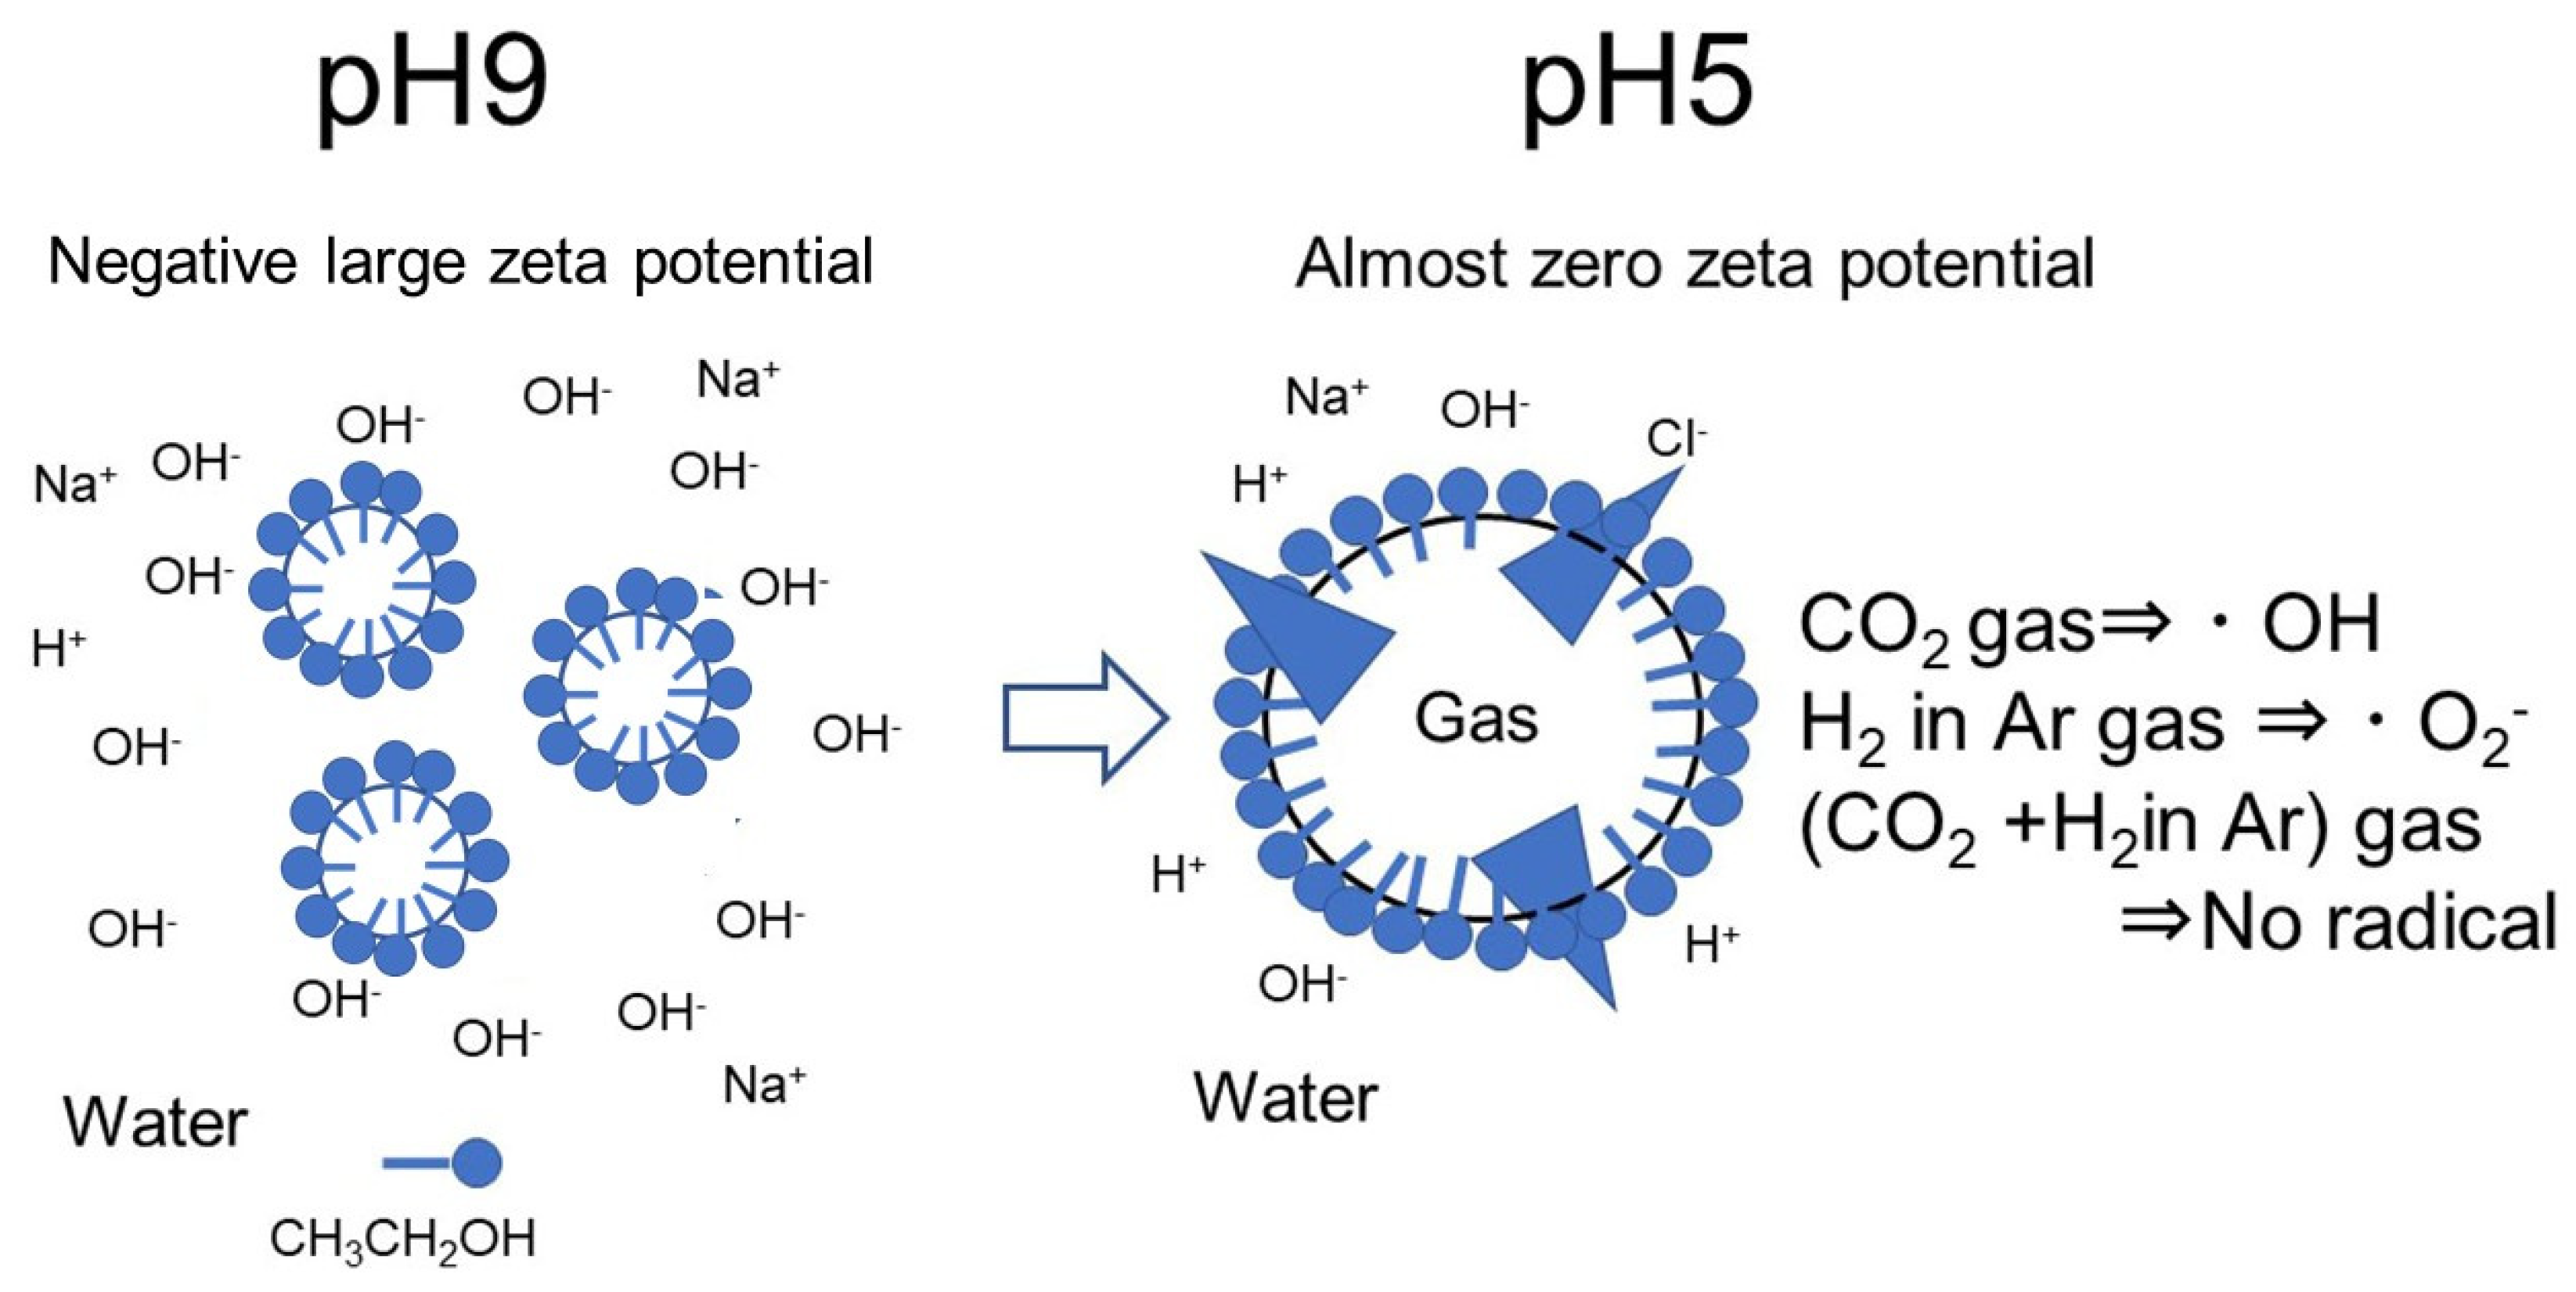
3.5. Radical Observation by Changing the pH

Figure 9 shows the two standard data points (i.e., superoxide anion on the top, hydroxyl radical on the bottom) and three data points from our gas bubble solutions (i.e., 8% H2 in Ar, CO2, and CO2 after 8% H2 in Ar). The ·O2 and ·OH and standard eight peaks by spin trap reagent G-CYPMPO appear under different magnetic fields [38]. They are plotted in the top and bottom of Figure 9, respectively. The peaks appearing of 8% H2 with Ar, CO2, and the mixture of CO2 and 8% H2 with Ar nanobubbles in 10% ethanol aqueous solutions are plotted as the second, third, and fourth curves from the top in Figure 9, respectively. The peaks corresponding ·O2 and ·OH are marked by blue and red circles, respectively. In this experiment, small peaks were observed in each position owing to smaller nanobubble numbers after 20 days passed.
Radical observation by changing the solution pH from 9 to 5 of three kinds of gas nanobubbles in 10 vol.% ethanol aqueous solution mixture is shown in Figure 9. The pH of the 8% H2 in Ar nanobubbles by changing to 5 (second data point from the top) showed a small amount of superoxide anion peaks. The reaction is considered as Equation (5):
2H2O + H2 → ·O2 + 3H2
The CO2 nanobubbles, by changing to pH 5 (third data point from the top), showed a small amount of hydroxyl radical peaks. The reaction is shown as follows:
2OH + CO2 → ·OH + HCO3
On the other hand, the mixture of CO2 and 8% H2 in Ar (fourth data point from the top) showed neither ·O2 nor ·OH peaks.
2H2O + H2 → ·O2 + 3H2 → 2·OH + 2H2
2·OH + 2H2 + 2CO2 → 2·CO3H + 2H2 → 2H2CO3 +H2
When the acid was added to the nanobubble solution, 8% H2 in Ar nanobubble solution produces ·O2, while the CO2 nanobubble solution produced ·OH. On the other hand, the gas mixture (8% H2 in Ar and CO2) nanobubbles were prepared by 8% H2 in Ar gas blowing followed by CO2 gas blowing. At first, the reaction in Equation (7) occurred, and then the reaction in Equation (8) occurred and reduced the radicals. This reaction agreed with the literature. The existing ·OH and ·O2 scavenging was reported by blowing CO2 nanobubbles after blowing H2 nanobubbles [30].
The formation of a monolayer by ethanol [12] and the arrangement of ethanol molecules on interfaces stabilize the bulk nanobubbles [13,14]. The water molecules were arranged to maximize the hydrogen bonding between the oriented ethanol and the adjacent water molecules [16]. Our model of nanobubble increases with coagulation by changing pH from 9 to 5; therefore, the bubble becomes easily breakable, and the production of radicals is shown in Figure 10. Here, the weak ultrasonic wave and ultraviolet light are irradiated. There is a report that the ∙OH peak was observed with a weak supersonic wave [28]. Moreover, ∙OH was generated from the collapsing microbubbles under strongly acidic conditions without any dynamic stimulus such as ultrasound [25]. The CO2 nanobubbles after 8% H2 in Ar nanobubbles can exist in 10 vol.% ethanol aqueous solution mixture at pH 9 for a long period such as 20 days (Figure 3). The alkaline 10 vol.% ethanol aqueous solution with CO2 nanobubbles after 8% H2 in Ar nanobubble did not show noticeable free radicals by changing the pH to acidic (i.e., pH 5). The phenomena studied and discussed in this article would be useful to prepare a soda alcohol beverage, among others.

4. Conclusions

The 8% hydrogen (H2) in argon (Ar) and carbon dioxide (CO2) gas nanobubbles with ethanol were produced at 10, 30, and 50 vol.% ethanol aqueous solution by the high speed agitation method with gas injection, and the main findings were as follows:
  • The prepared nanobubbles were stable for 20 days owing to a high negative zeta potential at alkaline pH 9.
  • When the pH of ethanol alkaline aqueous solution with nanobubbles was adjusted to acidic at around pH 5, the zeta potential of nanobubbles was almost zero. The numbers of nanobubble decreased at almost zero charge (pH 5) were identified by measuring their numbers using the particle trajectory method (Nano site).
  • The extended Derjaguin, Landau, Verwey, and Overbeek (DLVO) theory was used to evaluate the nanobubble stability (repulsion between bubbles) in alkaline conditions, and its instability (attraction between bubbles) in acidic conditions.
The collapsed nanobubbles at zero charge generated slight free radicals detected using G-CYPMPO spin trap reagent in electron spin resonance (ESR) spectroscopy. The produced free radicals were superoxide anions at collapsed 8% H2 in Ar nanobubbles and hydroxyl radicals at collapsed CO2 nanobubbles. On the other hand, the collapsed mixed CO2 and H2 in Ar nanobubbles showed no free radicals.
Based on this study, a schematic model of nanobubble breakage and the production of radicals by changing solution pH was proposed. These phenomena and their understanding would be useful to formulate healthy beverages, for example.

Author Contributions

Conceptualization, Z.H. and T.F.; methodology, H.K. and H.M.; validation, H.K. and H.M.; investigation, C.H., K.W., and A.O.; resources, Z.H. and G.D.; data curation, Y.W.; writing—original draft preparation, Z.H. and T.F.; writing—review and editing, G.D. and A.O. supervision, T.F.; project administration, Y.W., C.H., and K.W. All authors have read and agreed to the published version of the manuscript.

Funding

This research was funded by the Natural Science Foundation of China, grant number NSFC (21976039).

Data Availability Statement

The data presented in this study are available on request from the corresponding author.

Acknowledgments

We acknowledge the useful information for this research received by Chikara Suzuki (Bell Packe Co., Ltd., Tokyo, Japan) and Kazuaki Tasaka (Innovridge Co., Ltd., Tokyo, Japan).

Conflicts of Interest

The authors declare no conflict of interest.

References

  1. Asenbaum, A.; Pruner, C.; Wilhelm, E.; Mijakovic, M.; Zoranic, L.; Sokolic, F.; Kezic, B.; Perera, A. Structural changes in ethanol–water mixtures: Ultrasonics, Brillouin scattering and molecular dynamics studies. Vib. Spectrosc. 2012, 60, 102–106. [Google Scholar] [CrossRef]
  2. Gereben, O.; Pusztai, L. Hydrogen bond connectivities in water–ethanol mixtures: On the influence of the H-bond definition. J. Mol. Liq. 2016, 220, 836–841. [Google Scholar] [CrossRef]
  3. Gereben, O. Ring structure analysis of ethanol–water mixtures. J. Mol. Liq. 2015, 211, 812–820. [Google Scholar] [CrossRef]
  4. Dolenko, T.A.; Burikov, S.A.; Dolenko, S.A.; Efitorov, A.O.; Plastinin, I.V.; Yuzhakov, V.I.; Patsaeva, S.V. Raman Spectroscopy of Water–Ethanol Solutions: The Estimation of Hydrogen Bonding Energy and the Appearance of Clathrate-like Structures in Solutions. J. Phys. Chem. A 2015, 119, 10806–10815. [Google Scholar] [CrossRef]
  5. Rak, D.; Sedlák, M. Comment on “Bulk Nanobubbles or Not Nanobubbles: That is the Question”. Langmuir 2020, 36, 15618–15621. [Google Scholar] [CrossRef] [PubMed]
  6. Alheshibri, M.; Craig, V.S. Generation of nanoparticles upon mixing ethanol and water; Nanobubbles or Not? J. Colloid Interface Sci. 2019, 542, 136–143. [Google Scholar] [CrossRef]
  7. Alheshibri, M.; Al Baroot, A.; Shui, L.; Zhang, M. Nanobubbles and nanoparticles. Curr. Opin. Colloid Interface Sci. 2021, 55, 101470. [Google Scholar] [CrossRef]
  8. Chan, C.U.; Ohl, C.-D. Total-Internal-Reflection-Fluorescence Microscopy for the Study of Nanobubble Dynamics. Phys. Rev. Lett. 2012, 109, 174501. [Google Scholar] [CrossRef]
  9. Häbich, A.; Ducker, W.; Dunstan, D.; Zhang, X. Do Stable Nanobubbles Exist in Mixtures of Organic Solvents and Water? J. Phys. Chem. B 2010, 114, 6962–6967. [Google Scholar] [CrossRef] [PubMed]
  10. Rak, D.; Ovadová, M.; Sedlak, M. (Non)Existence of Bulk Nanobubbles: The Role of Ultrasonic Cavitation and Organic Solutes in Water. J. Phys. Chem. Lett. 2019, 10, 4215–4221. [Google Scholar] [CrossRef]
  11. Jadhav, A.J.; Barigou, M. Bulk Nanobubbles or Not Nanobubbles: That is the Question. Langmuir 2020, 36, 1699–1708. [Google Scholar] [CrossRef] [Green Version]
  12. Yano, Y.F. Correlation between surface and bulk structures of alcohol–water mixtures. J. Colloid Interface Sci. 2005, 284, 255–259. [Google Scholar] [CrossRef] [PubMed]
  13. Millare, J.C.; Basilia, B.A. Dispersion and electrokinetics of scattered objects in ethanol-water mixtures. Fluid Phase Equilibria 2019, 481, 44–54. [Google Scholar] [CrossRef]
  14. Nirmalkar, N.; Pacek, A.W.; Barigou, M. On the Existence and Stability of Bulk Nanobubbles. Langmuir 2018, 34, 10964–10973. [Google Scholar] [CrossRef] [PubMed]
  15. Tan, B.H.; An, H.; Ohl, C.-D. Stability of surface and bulk nanobubbles. Curr. Opin. Colloid Interface Sci. 2021, 53, 101428. [Google Scholar] [CrossRef]
  16. Chen, N.; Wen, Z.; Li, X.; Ye, Z.; Ren, D.; Xu, J.; Chen, Q.; Ma, S. Controllable preparation and formation mechanism of mono-dispersed bulk nanobubbles in dilute ethanol-water solutions. Colloids Surf. A Physicochem. Eng. Asp. 2021, 616, 126372. [Google Scholar] [CrossRef]
  17. Qiu, J.; Zou, Z.; Wang, S.; Wang, X.; Wang, L.; Dong, Y.; Zhao, H.; Zhang, L.; Hu, J. Formation and Stability of Bulk Nanobubbles Generated by Ethanol-Water Exchange. ChemPhysChem 2017, 18, 1345–1350. [Google Scholar] [CrossRef] [PubMed]
  18. Zhang, X.; Wu, H.Z.; Zhang, D.X.; Li, G.; Hu, J. Nanobubbles at the interface of hopg and ethanol solution. Int. J. Nanosci. 2011, 4, 399–407. [Google Scholar] [CrossRef]
  19. Parker, J.L.; Claesson, P.M.; Attard, P. Bubbles, cavities, and the long-ranged attraction between hydrophobic surfaces. J. Phys. Chem. 1994, 98, 8468–8480. [Google Scholar] [CrossRef]
  20. Sun, L.; Zhang, F.; Guo, X.; Qiao, Z.; Zhu, Y.; Jin, N.; Cui, Y.; Yang, W. Research progress on bulk nanobubbles. Particuology 2021, 60, 99–106. [Google Scholar] [CrossRef]
  21. Yu, G.-H.; Kuzyakov, Y. Fenton chemistry and reactive oxygen species in soil: Abiotic mechanisms of biotic processes, controls and consequences for carbon and nutrient cycling. Earth-Sci. Rev. 2021, 214, 103525. [Google Scholar] [CrossRef]
  22. Takahashi, M.; Chiba, K.; Li, P. Free-Radical Generation from Collapsing Microbubbles in the Absence of a Dynamic Stimulus. J. Phys. Chem. B 2007, 111, 1343–1347. [Google Scholar] [CrossRef] [PubMed]
  23. Li, P.; Takahashi, M.; Chiba, K. Degradation of phenol by the collapse of microbubbles. Chemosphere 2009, 75, 1371–1375. [Google Scholar] [CrossRef]
  24. Takahashi, M.; Ishikawa, H.; Asano, T.; Horibe, H. Effect of Microbubbles on Ozonized Water for Photoresist Removal. J. Phys. Chem. C 2012, 116, 12578–12583. [Google Scholar] [CrossRef]
  25. Takahashi, M.; Shirai, Y.; Sugawa, S. Free-Radical Generation from Bulk Nanobubbles in Aqueous Electrolyte Solutions: ESR Spin-Trap Observation of Microbubble-Treated Water. Langmuir 2021, 37, 5005–5011. [Google Scholar] [CrossRef] [PubMed]
  26. Liu, S.; Oshita, S.; Kawabata, S.; Makino, Y.; Yoshimoto, T. Identification of ROS Produced by Nanobubbles and Their Positive and Negative Effects on Vegetable Seed Germination. Langmuir 2016, 32, 11295–11302. [Google Scholar] [CrossRef]
  27. Tang, Y.; Zhang, M.; Zhang, J.; Lyu, T.; Cooper, M.; Pan, G. Reducing arsenic toxicity using the interfacial oxygen nanobubble technology for sediment remediation. Water Res. 2021, 205, 117657. [Google Scholar] [CrossRef] [PubMed]
  28. Tada, K.; Maeda, M.; Nishiuchi, Y.; Nagahara, J.; Hata, T.; Zhuowei, Z.; Yoshida, Y.; Watanabe, S.; Ohmori, M. ESR Measurement of Hydroxyl Radicals in Micro-nanobubble Water. Chem. Lett. 2014, 43, 1907–1908. [Google Scholar] [CrossRef]
  29. Ahmed, A.K.A.; Shi, X.; Hua, L.; Manzueta, L.; Qing, W.; Marhaba, T.; Zhang, W. Influences of Air, Oxygen, Nitrogen, and Carbon Dioxide Nanobubbles on Seed Germination and Plant Growth. J. Agric. Food Chem. 2018, 66, 5117–5124. [Google Scholar] [CrossRef] [PubMed]
  30. Fujita, T.; Kurokawa, H.; Han, Z.; Zhou, Y.; Matsui, H.; Ponou, J.; Dodbiba, G.; He, C.; Wei, Y. Free radical degradation in aqueous solution by blowing hydrogen and carbon dioxide nanobubbles. Sci. Rep. 2021, 11, 3068. [Google Scholar] [CrossRef] [PubMed]
  31. Safamirzaei, M.; Modarress, H.; Mohsen-Nia, M. Modeling the hydrogen solubility in methanol, ethanol, 1-propanol and 1-butanol. Fluid Phase Equilibria 2010, 289, 32–39. [Google Scholar] [CrossRef]
  32. Dalmolin, I.; Skovroinski, E.; Biasi, A.; Corazza, M.L.; Dariva, C.; Oliveira, J.V. Solubility of carbon dioxide in binary and ternary mixtures with ethanol and water. Fluid Phase Equilibria 2006, 245, 193–200. [Google Scholar] [CrossRef]
  33. Agarwal, A.; Ng, W.J.; Liu, Y. Principle and applications of microbubble and nanobubble technology for water treatment. Chemosphere 2011, 84, 1175–1180. [Google Scholar] [CrossRef] [PubMed]
  34. Li, C.; Zhang, H. A review of bulk nanobubbles and their roles in flotation of fine particles. Powder Technol. 2021, 395, 618–633. [Google Scholar] [CrossRef]
  35. Zhou, Y.; Han, Z.; He, C.; Feng, Q.; Wang, K.; Wang, Y.; Luo, N.; Dodbiba, G.; Wei, Y.; Otsuki, A.; et al. Long-Term Stability of Different Kinds of Gas Nanobubbles in Deionized and Salt Water. Materials 2021, 14, 1808. [Google Scholar] [CrossRef] [PubMed]
  36. Oka, T.; Yamashita, S.; Midorikawa, M.; Saiki, S.; Muroya, Y.; Kamibayashi, M.; Yamashita, M.; Anzai, K.; Katsumura, Y. Spin-Trapping Reactions of a Novel Gauchetype Radical Trapper G-CYPMPO. Anal. Chem. 2011, 83, 9600–9604. [Google Scholar] [CrossRef]
  37. Kamibayashi, M.; Oowada, S.; Kameda, H.; Okada, T.; Inanami, O.; Ohta, S.; Ozawa, T.; Makino, K.; Kotake, Y. Synthesis and characterization of a practically better DEPMPO-type spin trap, 5-(2,2-dimethyl-1,3-propoxy cyclophosphoryl)-5-methyl-1-pyrrolineN-oxide (CYPMPO). Free Radic. Res. 2006, 40, 1166–1172. [Google Scholar] [CrossRef]
  38. Sueishi, Y.; Kamogawa, E.; Nakamura, H.; Ukai, M.; Kunieda, M.; Okada, T.; Shimmei, M.; Kotake, Y. Kinetic Evaluation of Spin Trapping Rate Constants of New CYPMPO-type Spin Traps for Superoxide and Other Free Radicals. Z. Phys. Chem. 2015, 229, 317–326. [Google Scholar] [CrossRef]
  39. Ma, X.; Li, M.; Pfeiffer, P.; Eisener, J.; Ohl, C.-D.; Sun, C. Ion adsorption stabilizes bulk nanobubbles. J. Colloid Interface Sci. 2021, 606, 1380–1394. [Google Scholar] [CrossRef]
  40. European Commission. Drinking Water Directive, Drinking Water Legislation—Environment—European Commission; European Commission: Brussels, Belgium, 2021; Available online: https://european-union.europa.eu/select-language?destination=/node/1 (accessed on 18 November 2021).
  41. Cerrón-Calle, G.A.; Magdaleno, A.L.; Graf, J.C.; Apul, O.G.; Garcia-Segura, S. Elucidating CO2 nanobubble interfacial reactivity and impacts on water chemistry. J. Colloid Interface Sci. 2021, 607, 720–728. [Google Scholar] [CrossRef]
  42. Zheng, X.; Jang, J. Hydraulic Properties of Porous Media Saturated with Nanoparticle-Stabilized Air-Water Foam. Sustainability 2016, 8, 1317. [Google Scholar] [CrossRef] [Green Version]
  43. Yoon, R.-H.; Aksoy, B. Hydrophobic Forces in Thin Water Films Stabilized by Dodecylammonium Chloride. J. Colloid Interface Sci. 1999, 211, 1–10. [Google Scholar] [CrossRef] [PubMed]
  44. Wang, L.; Yoon, R.-H. Hydrophobic Forces in the Foam Films Stabilized by Sodium Dodecyl Sulfate: Effect of Electrolyte. Langmuir 2004, 20, 11457–11464. [Google Scholar] [CrossRef] [PubMed]
  45. Prieve, D.C. Intermolecular and surface forces with applications to colloidal and biological systems. J. Colloid Interface Sci. 1987, 116, 300. [Google Scholar] [CrossRef]
  46. Wiącek, A.; Chibowski, E. Application of an extended DLVO theory for the calculation of the interactions between emulsified oil droplets in alcohol solutions. Colloids Surf. B Biointerfaces 1999, 14, 19–26. [Google Scholar] [CrossRef]
  47. Israelachvili, J.N. Intermolecular and Surface Forces with Application to Colloidal and Biological Systems; Academic Press: Cambridge, MA, USA, 1985; p. 17. [Google Scholar]
  48. Tuinier, R.; Rieger, J.; de Kruif, C. Depletion-induced phase separation in colloid–polymer mixtures. Adv. Colloid Interface Sci. 2003, 103, 1–31. [Google Scholar] [CrossRef] [Green Version]
  49. Otsuki, A.; Bryant, G. Characterization of the interactions within fine particle mixtures in highly concentrated suspensions for advanced particle processing. Adv. Colloid Interface Sci. 2015, 226, 37–43. [Google Scholar] [CrossRef] [PubMed]
Figure 1. Preparation method of nanobubbles.
Nanomaterials 12 00237 g001
Figure 2. Zeta potential as a function of pH for 8% H2 in Ar, CO2, and a mixture of 8% H2 in Ar and CO2 gas nanobubble in water [35].
Nanomaterials 12 00237 g002
Figure 3. Mean diameter of several nanobubbles in ethanol aqueous solution at pH 9 after (a) 1 and (b) 20 days.
Nanomaterials 12 00237 g003
Figure 4. Zeta potential and pH for 8% H2 in Ar nanobubbles as a function of ethanol percentage of ethanol aqueous solution mixtures after: (a) 1 day and (b) 20 days.
Nanomaterials 12 00237 g004
Figure 5. Zeta potential and pH for CO2 nanobubble solution as a function of ethanol percentage of ethanol aqueous solution mixtures after: (a) 1 day and (b) 20 days.
Nanomaterials 12 00237 g005
Figure 6. Zeta potential and pH of CO2 after 8% H2 in Ar nanobubble solution as a function of ethanol percentage of ethanol aqueous solution mixtures after: (a) 1 day and (b) 20 days.
Nanomaterials 12 00237 g006
Figure 7. Total potential energy (VT), electrostatic interaction energy (VR), van der Waals interaction energy (VA), and hydrophobic interaction energy (VH) as a function of the surface-to-surface distance between two nanobubbles at pH 9 and pH 5 of three kinds of gas nanobubbles in 10 vol.% ethanol aqueous solution.
Nanomaterials 12 00237 g007
Figure 8. Nanobubble numbers at pH 9 and pH 5 for 8% H2 in Ar, CO2, and CO2 after 8% H2 in Ar in 10 vol.% ethanol aqueous solution mixture after 20 days.
Nanomaterials 12 00237 g008
Figure 9. Radical observation by changing pH from 9 to 5 of three kinds of gas nanobubbles (i.e., 8% H2 in Ar, CO2, and CO2 after 8% H2 in Ar) in 10 vol.% ethanol aqueous solution mixture.
Nanomaterials 12 00237 g009
Figure 10. Model of nanobubble breakage by changing pH from 9 to 5 and the production of radicals by decreasing the bubble zeta potential absolute value.
Nanomaterials 12 00237 g010
Publisher’s Note: MDPI stays neutral with regard to jurisdictional claims in published maps and institutional affiliations.

