Article

Conductometric ppb-Level CO Sensors Based on In2O3 Nanofibers Co-Modified with Au and Pd Species

1
State Key Laboratory of Integrated Optoelectronics, Jilin Key Laboratory of Gas Sensors, College of Electronic Science and Engineering, Jilin University, 2699 Qianjin Street, Changchun 130012, China
2
College of Communication Engineering, Jilin University, Changchun 130022, China
3
School of Physics and Electronic Information Engineering, Henan Polytechnic University, Jiaozuo 454003, China
4
International Center of Future Science, Jilin University, Changchun 130012, China
*
Authors to whom correspondence should be addressed.
Nanomaterials 2022, 12(19), 3267; https://doi.org/10.3390/nano12193267
Submission received: 12 August 2022 / Revised: 11 September 2022 / Accepted: 14 September 2022 / Published: 20 September 2022
(This article belongs to the Special Issue Semiconductor Metal Oxide Nanomaterials for Gas Sensing Applications)

Abstract

:
Carbon monoxide (CO) is one of the most toxic gases to human life. Therefore, the effective monitoring of it down to ppb level is of great significance. Herein, a series of In2O3 nanofibers modified with Au or Pd species or simultaneous Au and Pd species have been prepared by electrospinning combined with a calcination process. The as-obtained samples are applied for the detection of CO. Gas-sensing investigations indicate that 2 at% Au and 2 at% Pd-co-modified In2O3 nanofibers exhibit the highest response (21.7) to 100 ppm CO at 180 °C, and the response value is ~8.5 times higher than that of pure In2O3 nanofibers. More importantly, the detection limit to CO is about 200 ppb with a response value of 1.23, and is obviously lower than that (6 ppm) of pure In2O3 nanofibers. In addition, the sensor also shows good stability within 19 days. These demonstrate that co-modifying In2O3 nanofibers with suitable amounts of Pd and Au species might be a meaningful strategy for the development of high-performance carbon monoxide gas sensors.

1. Introduction

The incomplete combustion of fuel in a closed environment, such as home stoves, engines, and fires, will inevitably produce CO, which has extremely higher affinity to human hemoglobin compared with O2, and threatens the safety of human life [1]. Currently, the number of poisoning incidents caused by CO is about 15,000 per year [2]. Therefore, it is urgent and meaningful to develop high-performance CO gas sensors with high response and low detection limit.
CO sensors based on metal oxide gas sensors have obvious cross-response to various reducing or combustible gases such as H2 and CH4, especially H2. During the use of fuel-cell vehicles using H2 as fuel, excessive CO will cause poisoning of the fuel cells and affect the operation of the vehicle [3]. In order to ensure the normal movement of fuel-cell vehicles, it is urgent to improve the selectivity of CO sensors to other combustible gases. Metal oxide semiconductors, such as SnO2 [4], In2O3 [5], and ZnO [6], have been mostly investigated for CO detection. Among them, In2O3 showed excellent selectivity for detecting CO compared with other oxides [7,8]. However, unmodified In2O3 has poor response to CO [9] and requires further modification to improve its sensing performance [5]. Au, Pd, and Pt [8] and their compounds are currently the most commonly used modified noble metals due to their excellent catalytic and electrical properties. Yin et al. synthesized SnO2 loaded with Au, Pd, and Pt by a sol-gel method. The results show that the loading of Au and Pd can enhance the selectivity of CO to H2, while the loading of Pt can enhance the selectivity of H2 to CO [8]. This indicates that the modification of Au and PdO can effectively improve the detection performance of gas sensors for CO, especially regarding selectivity. Hung et al. used Au-modified ZnO thin films to obtain a 6.4 response to 20 ppm CO at 250 °C [9]. Although the modification of Au can improve the response of the sensor to CO, the operating temperature of gas sensors is higher, to some degree. Wang et al. prepared PdO/SnO2 nanoparticles with optimal working temperature (OWT) at a low temperature of 100 °C, and the sensors exhibited good selectivity to CO [10]. This indicates that PdO modification can not only improve the selectivity of CO against H2, but can also effectively lower the OWT. In summary, Au might have the ability to adsorb more CO but with low catalytic effect, and a higher working temperature was necessary to obtain the maximal gas response. PdO species might have an excellent catalytic effect to CO [11,12], and can oxidize CO to CO2 at low temperatures or even room temperature [13]. Therefore, it is possible to fully utilize these two noble metals to obtain high-performance CO gas sensors with high response, good selectivity, and low OWT. However, only Pd–Au alloy has been used as modifying content for detecting CO, and the gas-sensing performance was not ideal [4]. As far as we know, an In2O3 gas sensor co-modified by Au and Pd has never been studied. Inspired by these ideas, we try to utilize the good selectivity of In2O3 combined with the co-modification of Au and PdO for the development of high-performance CO gas sensors.
Electrospinning technology has been widely used in the preparation of gas-sensing materials due to its unique one-dimensional structure with high electron mobility [14]. In this paper, In2O3 nanofibers were prepared by electrospinning and combined with the different properties of Au and PdO, two noble metals, and the modification effects of Au, PdO, and Au@PdO on CO were studied. Gas-sensing studies have shown that the co-modification of Au and PdO can not only greatly improve the gas response and selectivity to CO, but can also reduce the detection limit with a faster response speed. Such improvements in gas-sensing performance may be related to the combination of the adsorption ability of Au and the catalytic effect of PdO towards CO gas.

2. Experimental Section

2.1. Preparation of Pure In2O3, PdO-Modified In2O3, Au-Modified In2O3, and Au and PdO-Co-Modified In2O3 Nanofibers

All of the reagents were analytical grade and were used as received without further purification. In2O3 nanofibers with different Au and Pd modifying concentrations were synthesized by an electrospinning method, and then were calcinated in air to obtain the final products [15]. Firstly, solution A was prepared by dissolving 1 mmol In2O3∙4.5H2O and a certain dose of HAuCl4 and PdCl2 in a mixture solution containing 4 mL absolute ethanol and 4 mL N, N-Dimethylformamide (DMF), followed by continuous stirring at room temperature on a magnetic mixer for 20 min. The atomic ratios of ln, Au, and Pd in the six solutions A were 1:0:0:, 1:0.02:0, 1:0:0.02, 1:0.01:0.01, 1:0.02:0.02, and 1:0.04:0.04, respectively. After that, 1 g polyvinylpyrrolidone (PVP, Mw = 1,300,000 g/mol) was slowly added to solution A with a water bath for 5 h at 50 °C to obtain solution B. Subsequently, solution B was poured into a 5 mL plastic syringe for electrostatic spinning. The principles and use of typical electrostatic spinning equipment has been described in our previous work [15]. The related parameters were as follows: an electrostatic pressure of 17 kV was applied between the metal needle and collector with a distance of 15 cm, and the feed rate was controlled at 0.02 mL/h. The white as-spun precursor on aluminum foil was collected after 2 h, followed by calcination in a muffle furnace at 450 °C for 2 h with a heating rate of 2 °C/min. The samples were labeled as pure In2O3, Au2-In2O3, Pd2-In2O3, Au1Pd1-In2O3, Au2Pd2-In2O3, and Au4Pd4-In2O3 nanofibers.

2.2. Characterization

The X-ray powder diffraction (XRD) patterns of six groups of samples were analyzed using a X-ray diffractometer (XRD, Smartlab, Rigaku Corporation, Tokyo, Japan) in the 2θ range of 25°–80°. The morphology and size of the six groups of samples were observed by field emission scanning electron microscopy (SEM, Merlin Compact, Carl Zeiss NTS GmbH, Oberkochen, Germany) at an accelerating voltage of 15 kV. Further microscopic surface probing of pure In2O3 and Au2Pd2-In2O3 nanofibers was performed using a transmission electron microscope (TEM, Titan G260-300, FEI, Hillsboro, OR, USA) facility at an accelerating voltage of 200 kV. The sample binding energies and O 1s were analyzed by X-ray photoelectron spectroscopy (XPS, ESCALAB 250Xi, Thermo Scientifific K-Alpha, Waltham, MA, USA) using a Mg Kα (1358.6 eV) X-ray source.

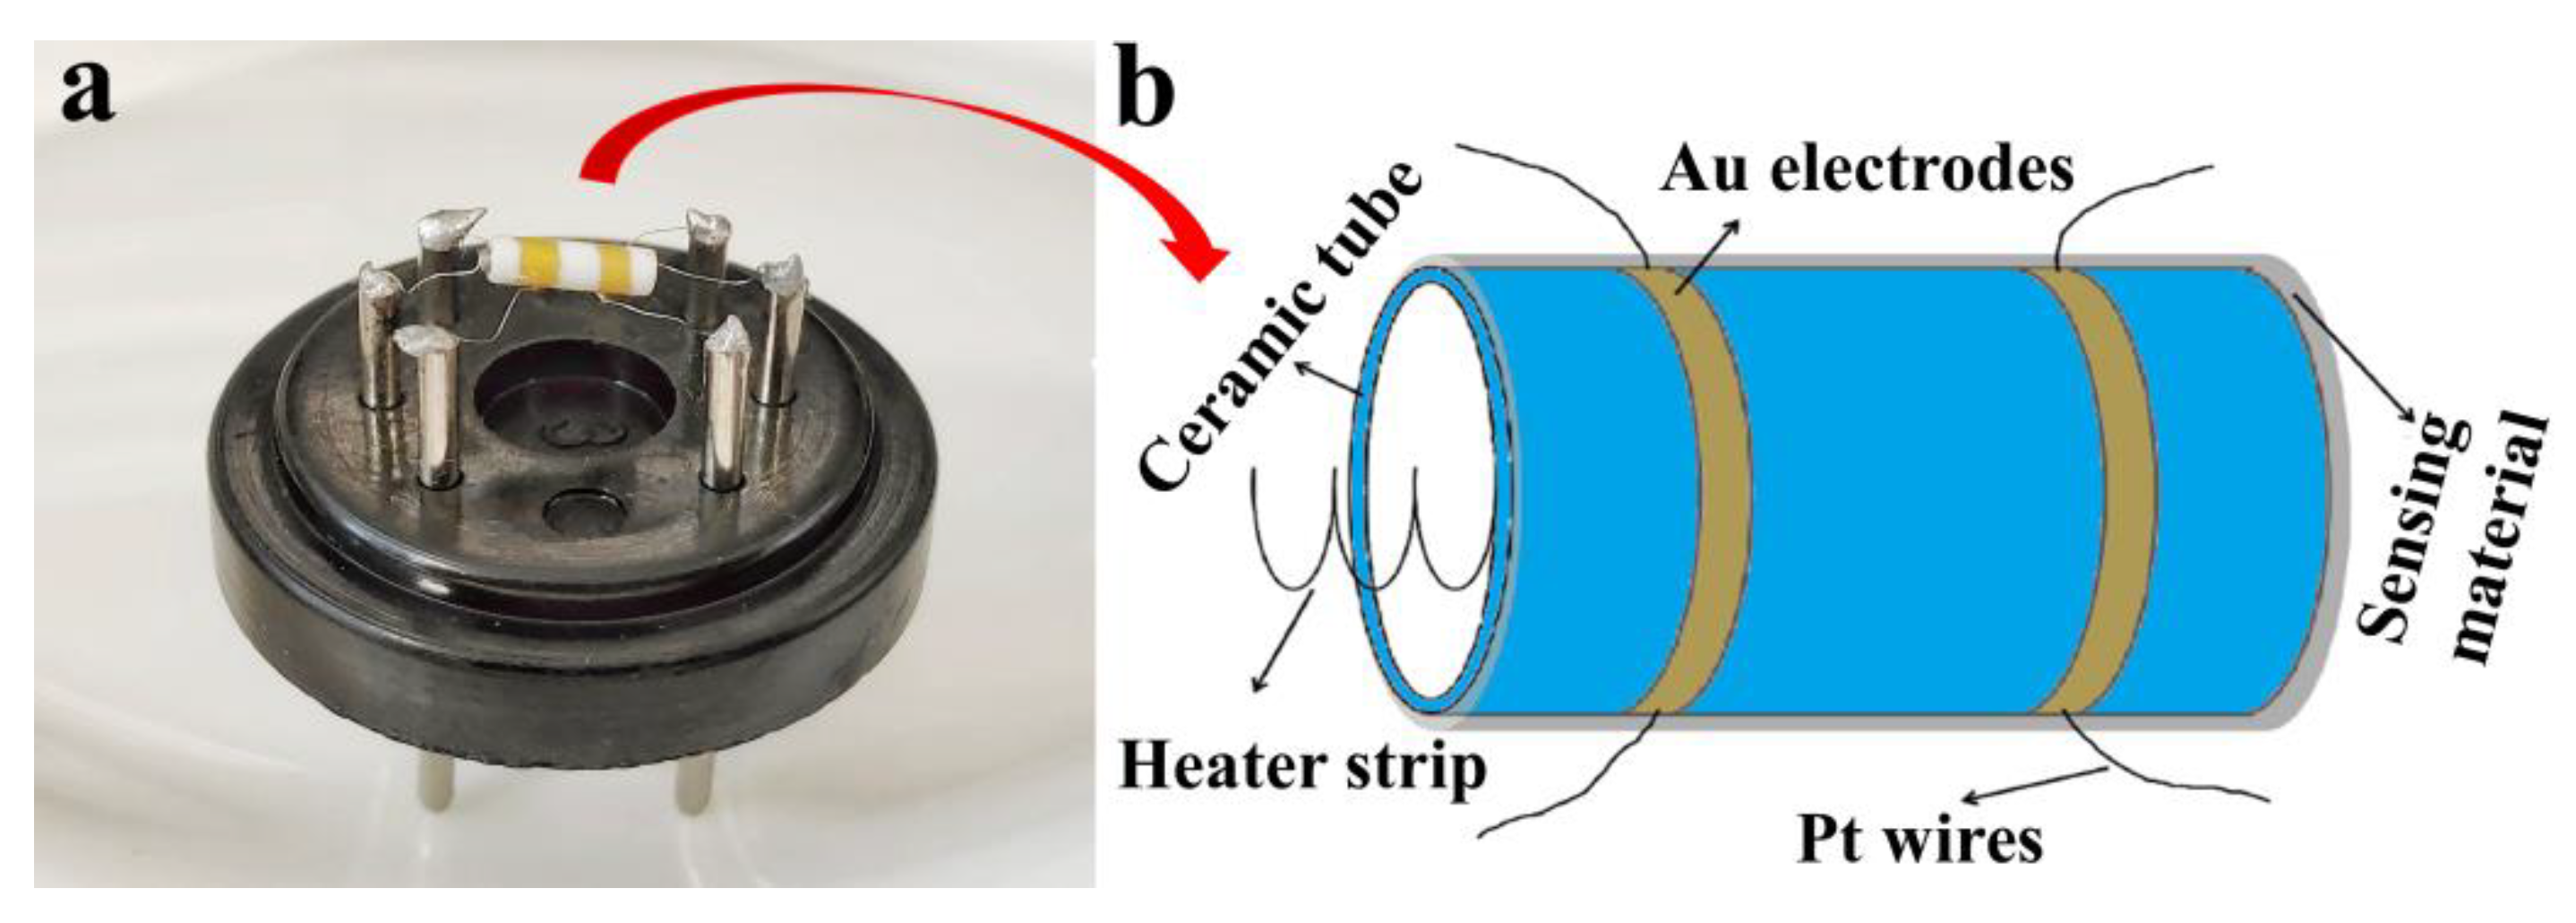
2.3. Fabrication and Measurement of Gas Sensor

The traditional hexapod ceramic tube was used to make the sensor device. The actual image of the hexapod ceramic tube gas sensor and the illustration of the ceramic tube gold electrode are shown in Figure 1. The fabrication and testing process of the device has been introduced in detail in the previous study [16]. The sensor was aged for 48 h at an aging current of 100 mA under a laboratory environment (~25 °C, ~35% RH). The sensor was placed in a gas cylinder filled with air and the gas to be measured, and a Fluke (8846A) meter was used to detect the change in the resistance value at both ends of the Au electrode. The humidity test was carried out in a humidity chamber (Shanghai ESPC Environmental Equipment Company, Shanghai, China), and the temperature of the humidity chamber was always controlled at 25 °C. The gas response (S) is defined as the ratio of the stable resistance (Ra) in air to the stable resistance (Rg) in the gas being measured (S = Ra/Rg). Furthermore, response and recovery times are defined as the time required for a 90% change in the sensor resistance.

3. Results and Discussion

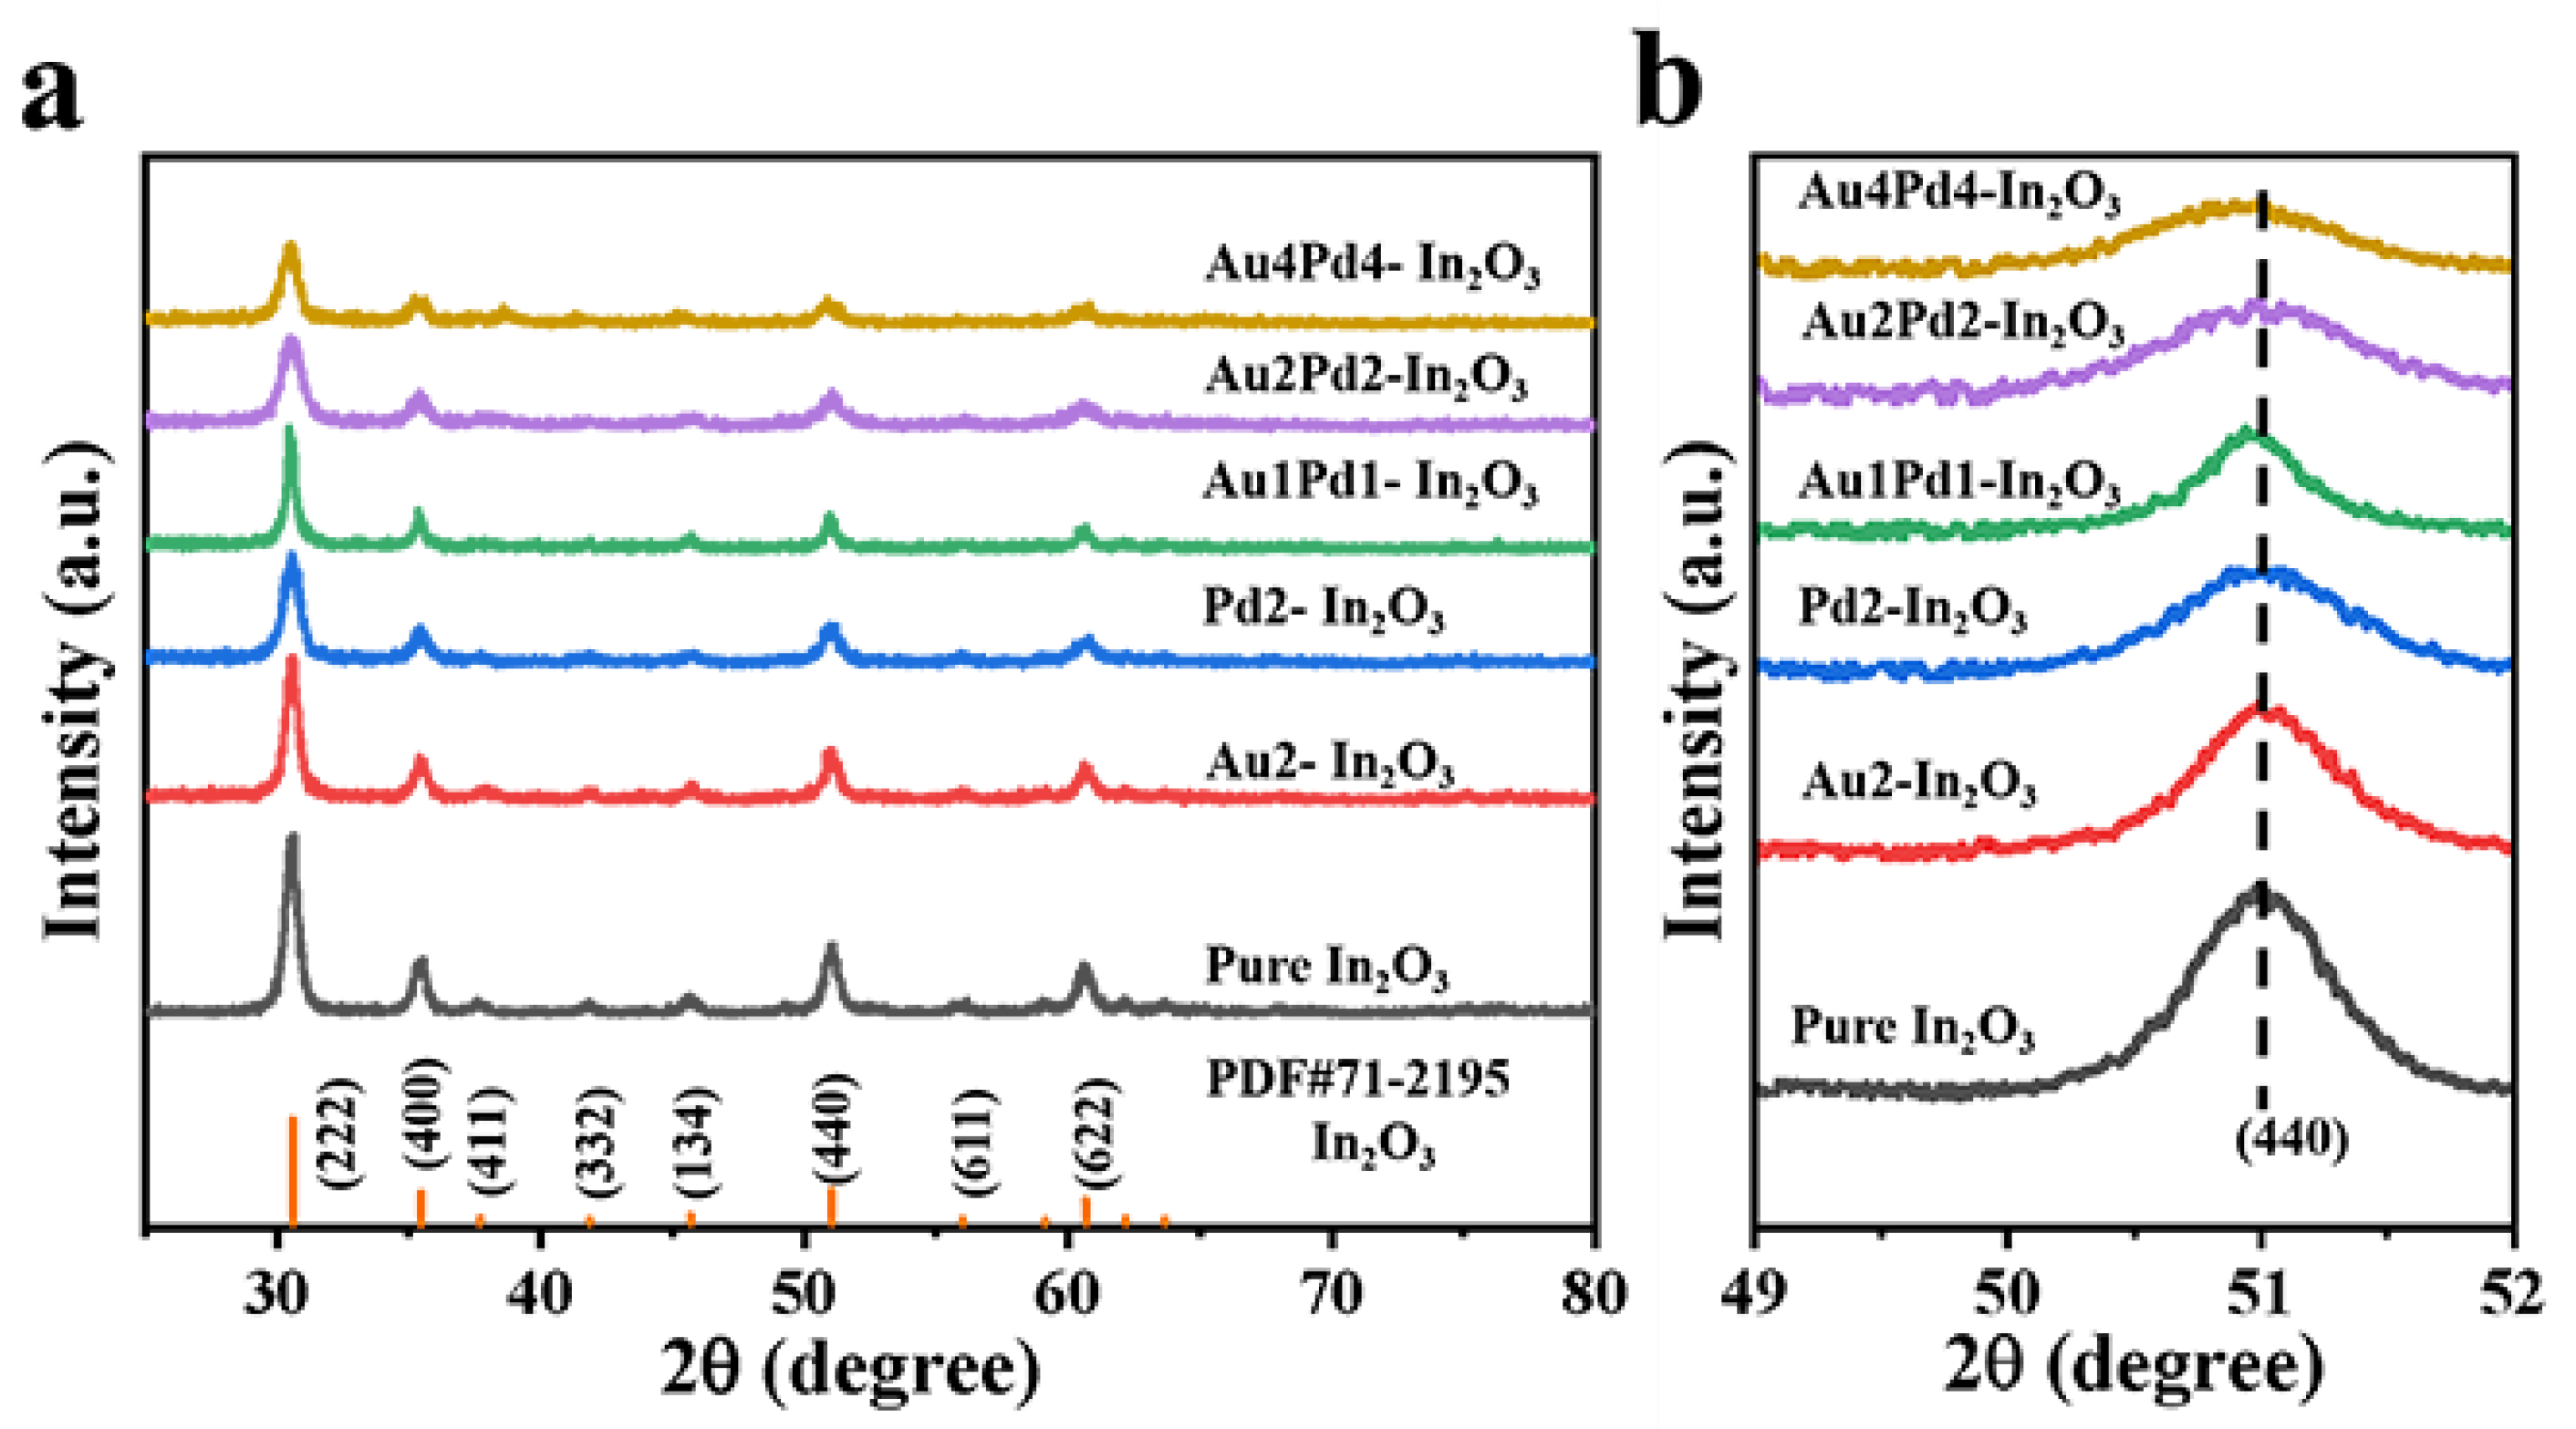
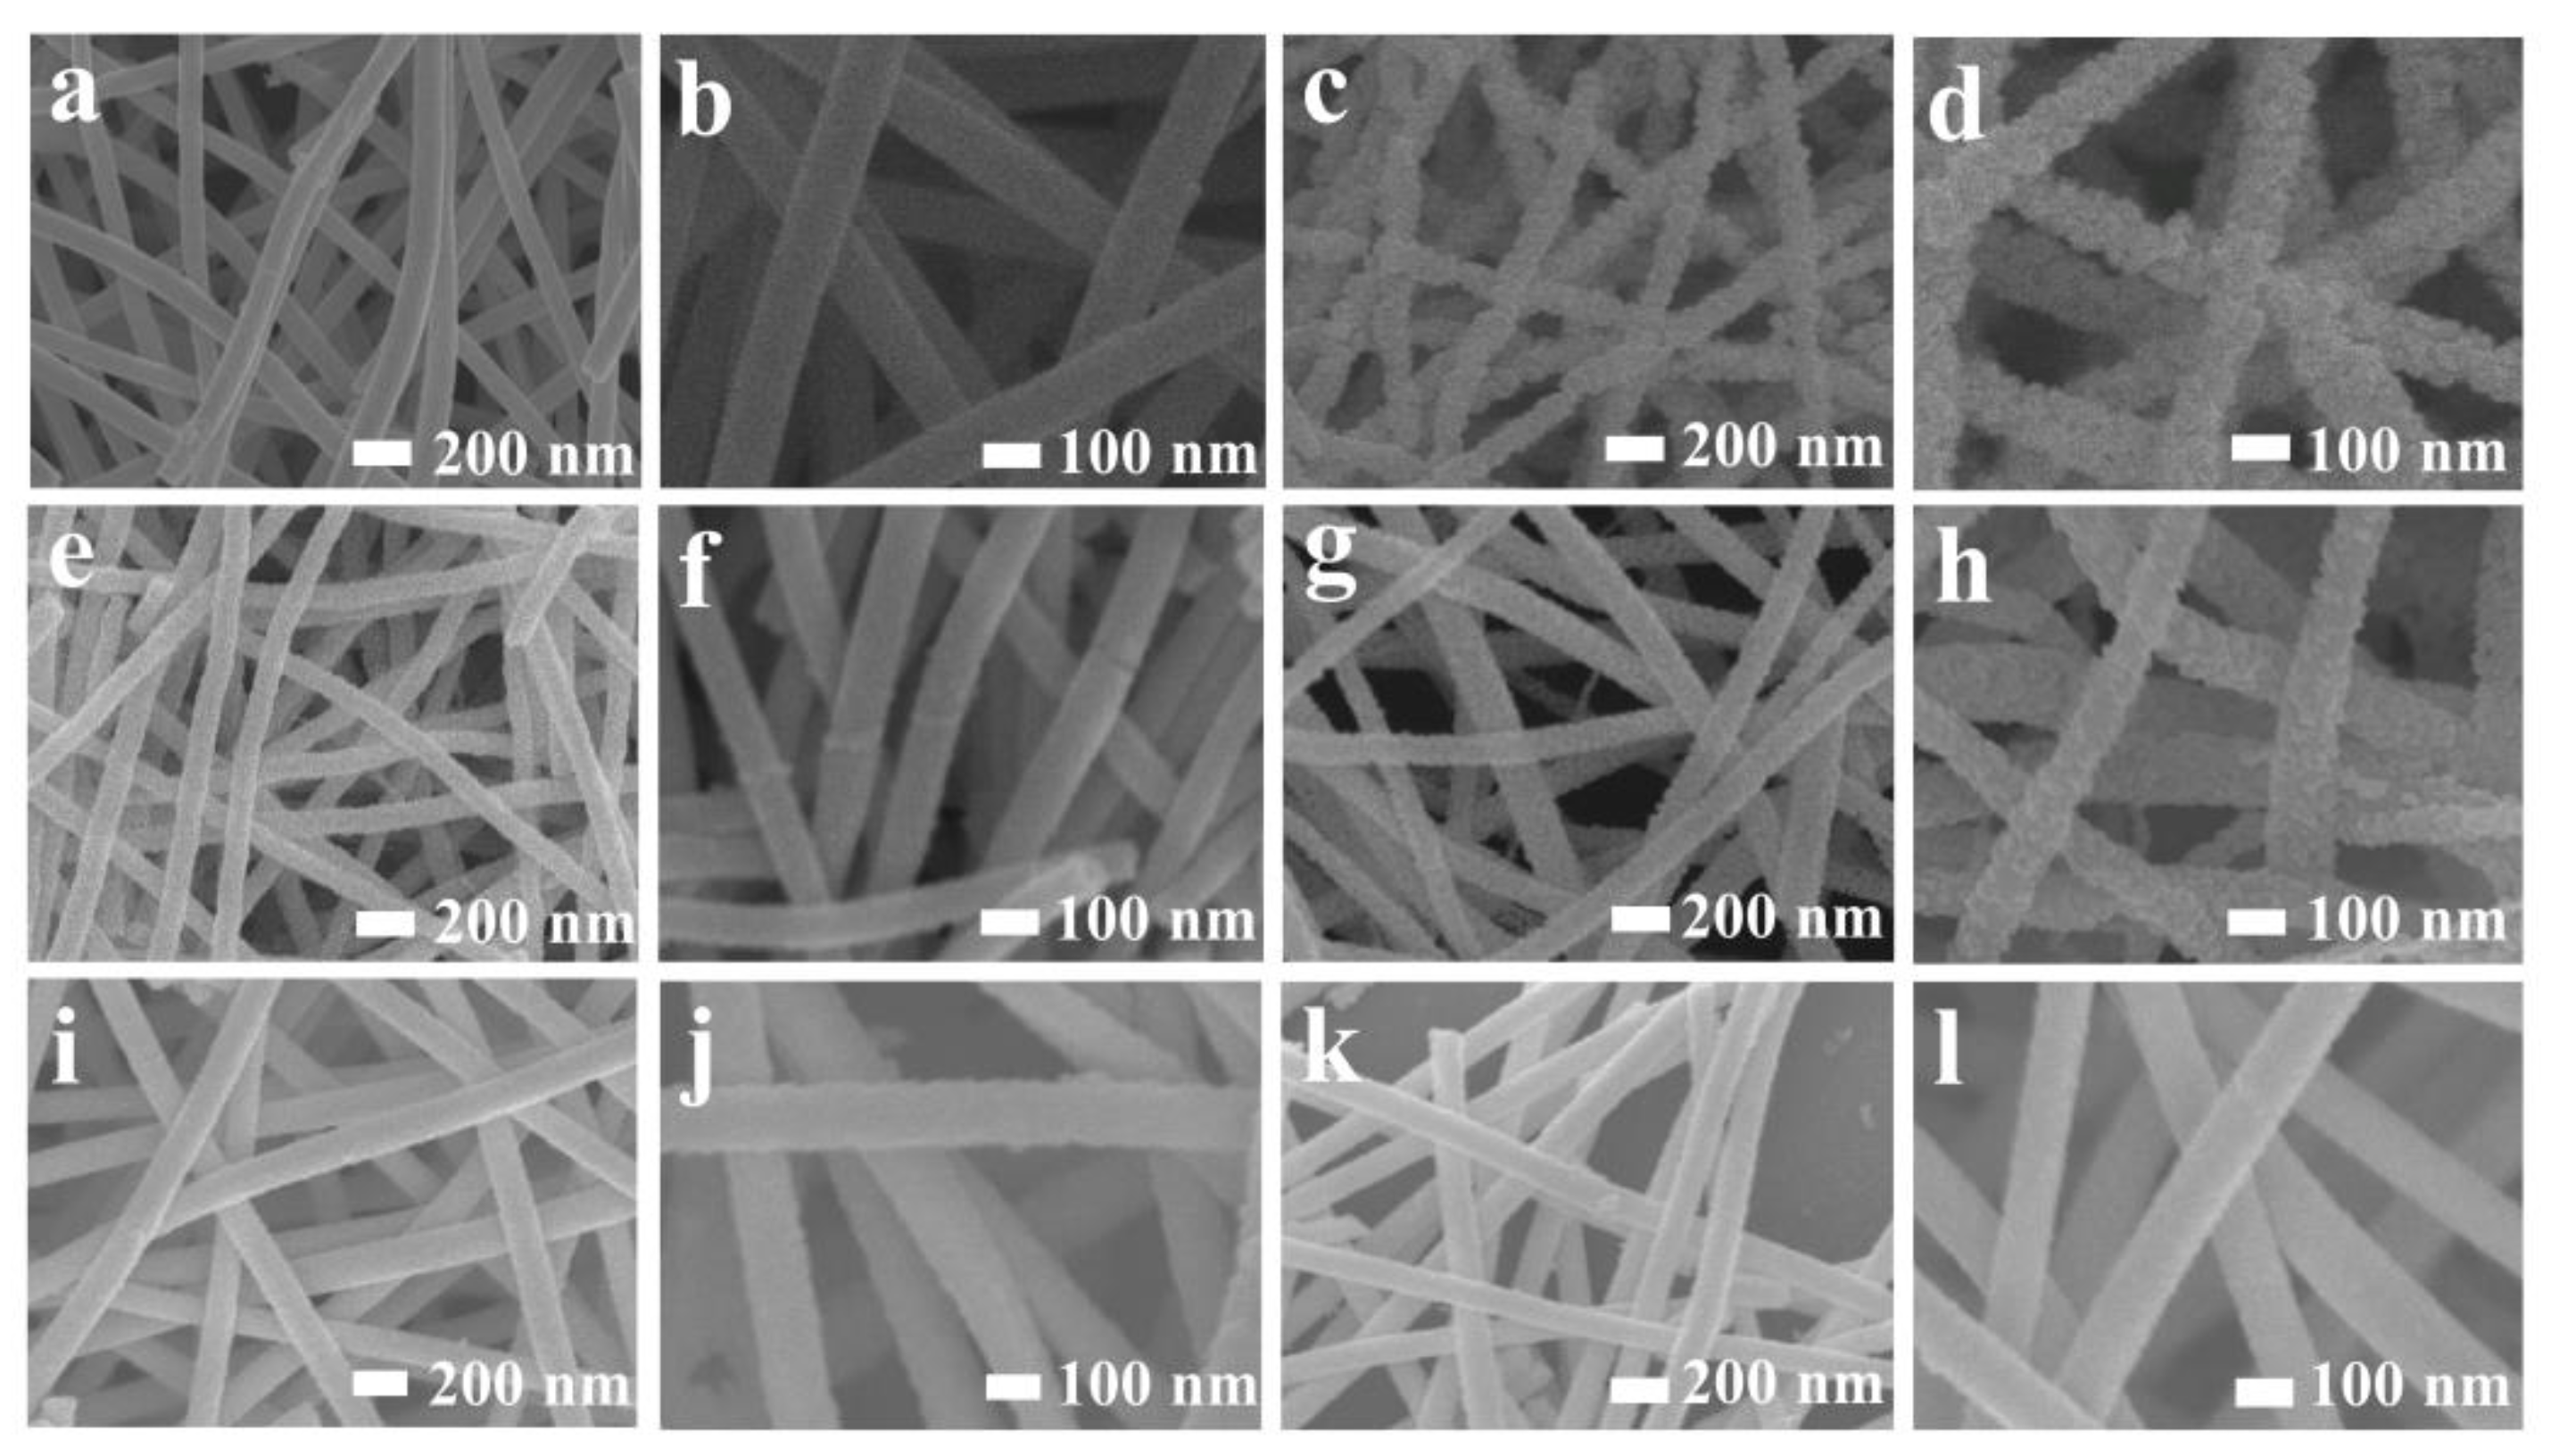
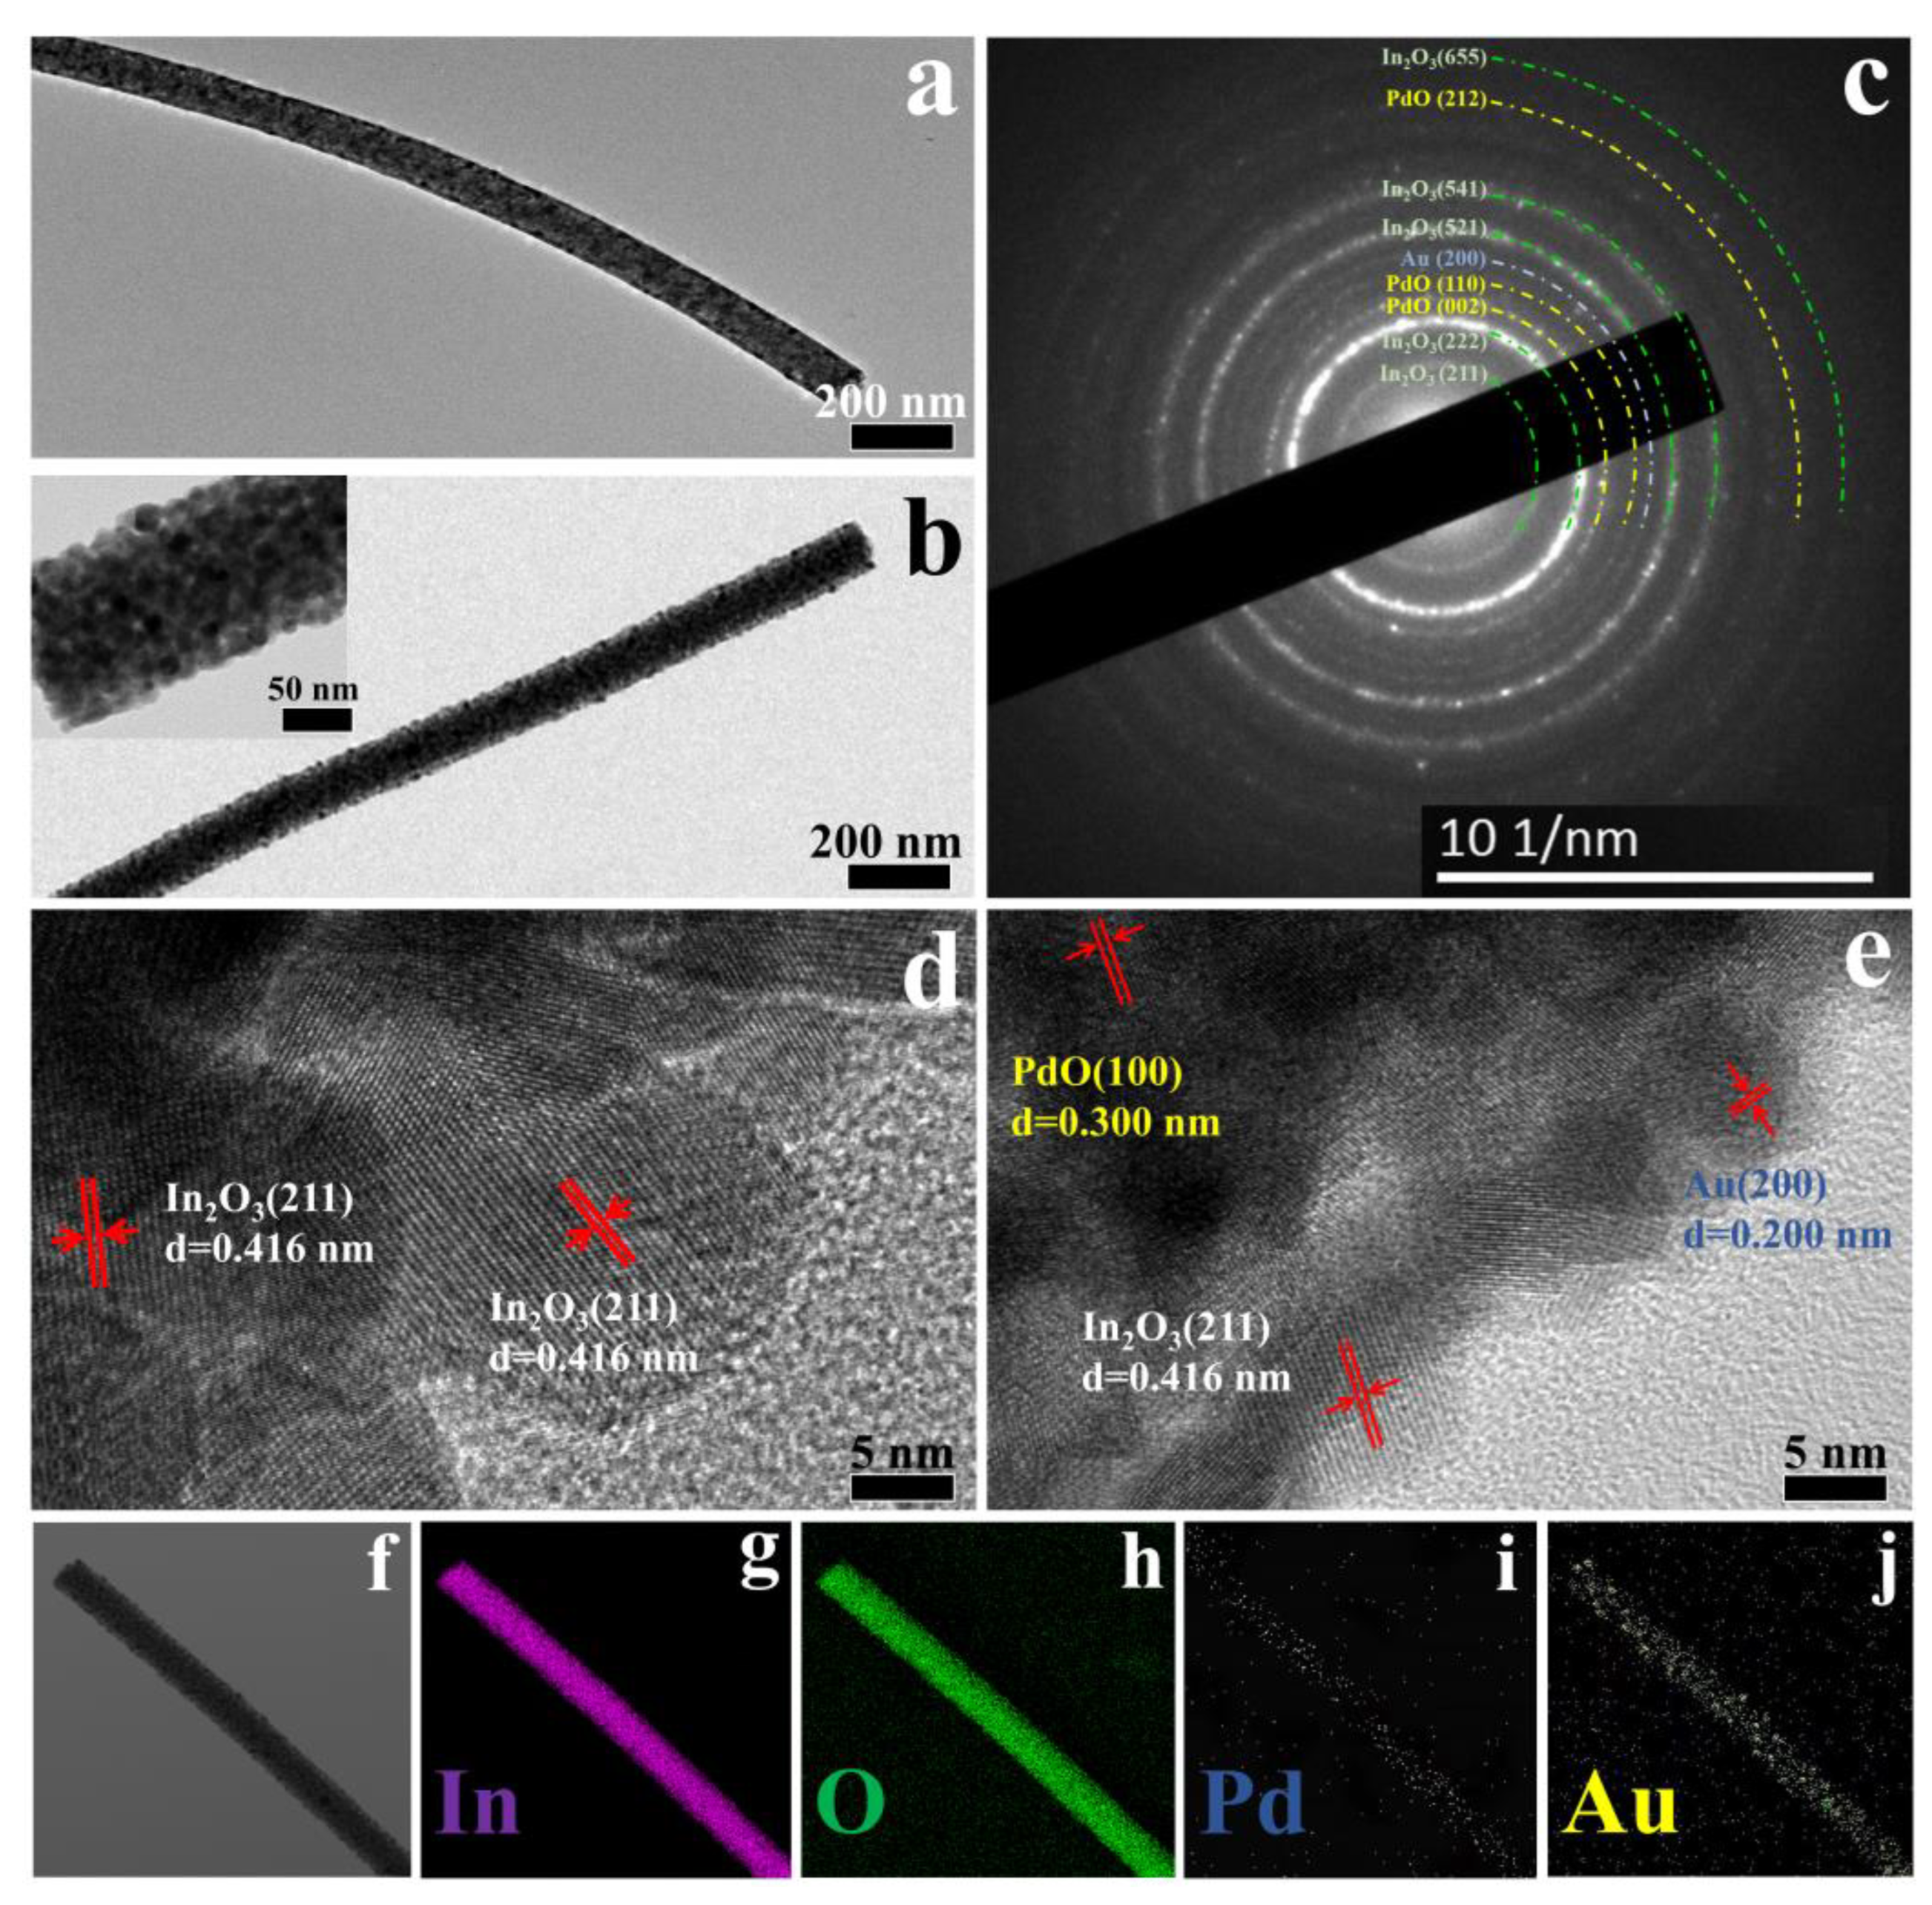
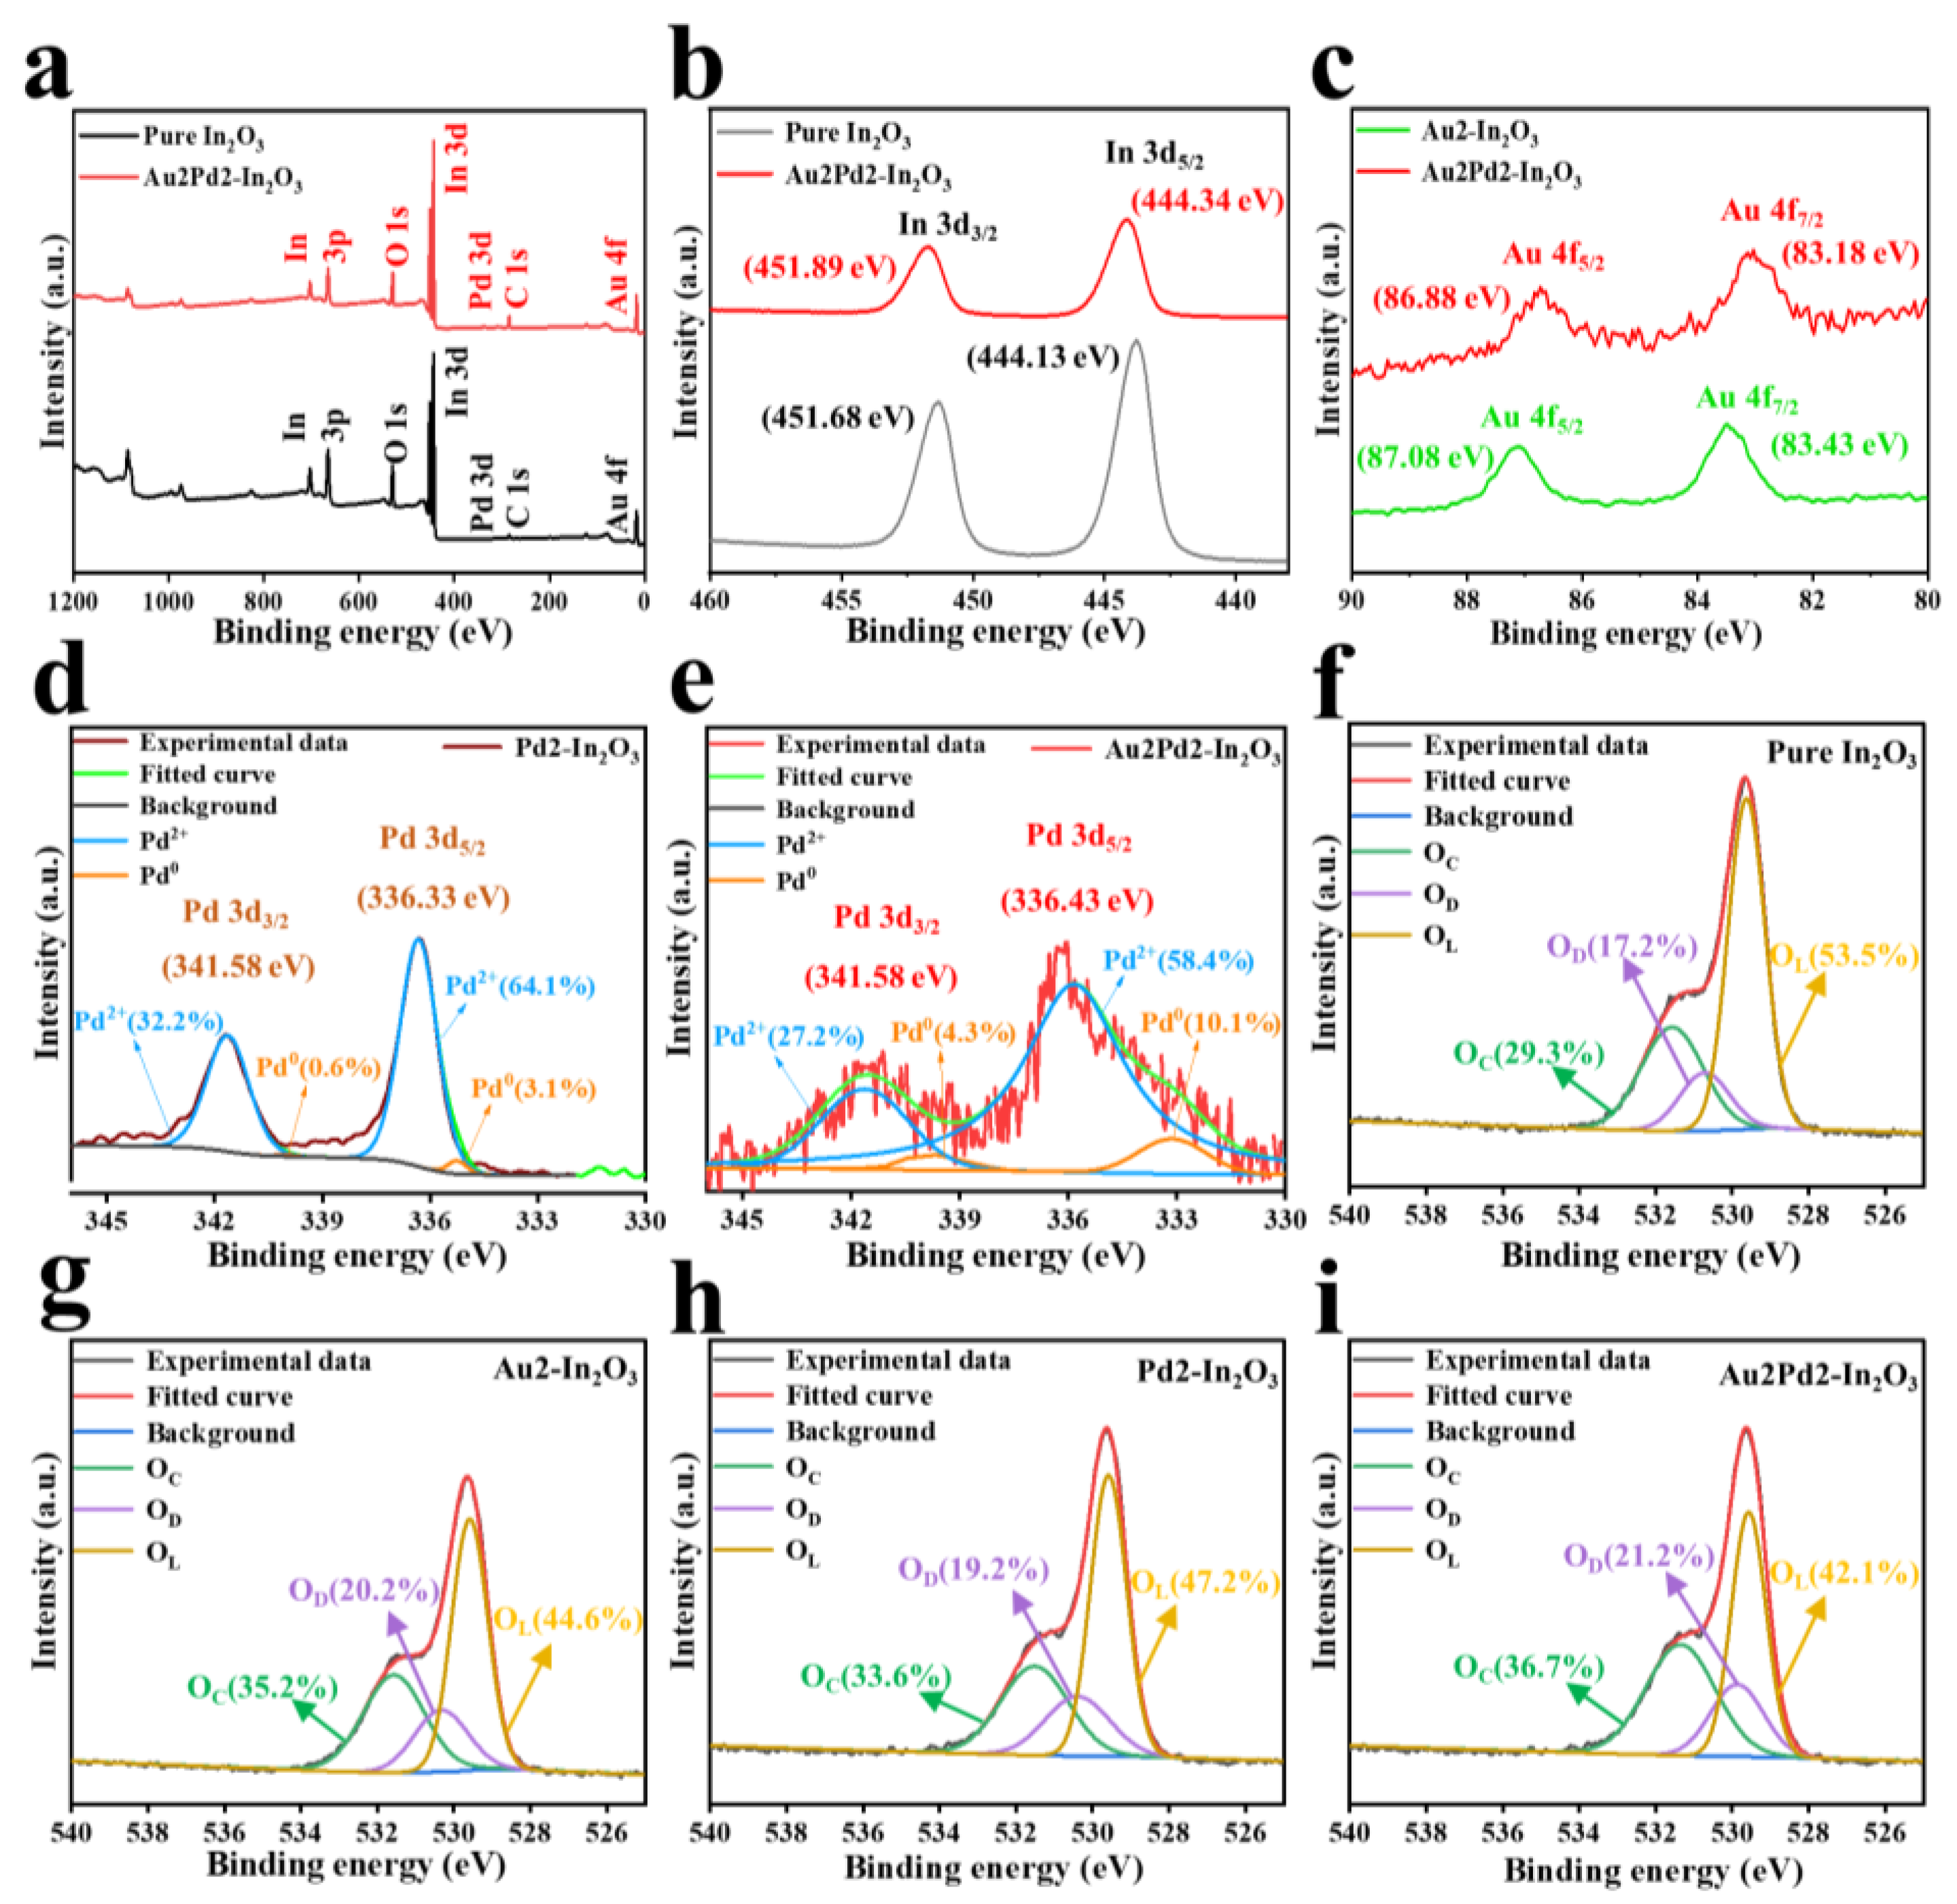
3.1. Structural and Morphological Characteristics

XRD patterns of all samples are presented in Figure 2a. According to XRD patterns (Figure 2a), all diffraction peaks of the as-obtained samples are consistent with the standard card of In2O3 (PDF#06-0416). The diffraction peaks belonging to Au and Pd species can be barely observed due to the low modifying contents of Au and Pd species. Figure 2b displays the patterns of the high resolution (440) peak of all samples. As shown in Figure 2b, the half widths of the diffraction peaks of the other samples gradually increase and shift to small angles with an increase in the modifying amount of Pd species [17]. This is because the radius of a Au atom (0.134 nm) is too large (larger than that of In3+(0.08 nm)) to incorporate into the In2O3 lattice, while the radius of Pd2+(0.085 nm) is only slightly larger than that of In3+, and Pd2+ can replace the position of In ions, which makes the interplanar spacing larger. The grain sizes are calculated according to Scherrer’s formula (D = 0.89 λ/β cosθ) (Table 1). It can be seen that Au modification can only slightly decrease the crystal size, while Pd2+ doping can significantly decrease it, indicating that Pd2+ might enter the In2O3 crystal and effectively inhibit the growth of In2O3 grain size. The reduced grain size is beneficial to the gas-sensing performance [16].
SEM images of the as-obtained samples demonstrate that the solo Au modification can cause the nanofibers to be obviously rougher (Figure 3c,d), while PdO modification cannot change the surface morphology significantly (Figure 3e,f) compared with pure In2O3 nanofibers (Figure 3a,b). The surface will become smoother with an increase in co-modifying amounts of Au and PdO (Figure 3i–l), which is due to a decrease in the grain size with the increase in the modifying amount. However, the nanofiber structure can be well-preserved after noble metal modification, and the target gas can easily transport in and out of the sensing body, which can ensure the high utility ratio of the gas sensors.
TEM images of pure In2O3 (Figure 4a) and Au2Pd2-In2O3 samples (Figure 4c) demonstrate that the surface of the nanofiber will become rougher after the addition of Au and Pd salts, which is in accordance with the SEM results (Figure 3b–j). The SAED image of the Au2Pd2-In2O3 sample is shown in Figure 4b. The (211), (222), (521), (541), and (655) lattice planes of In2O3, the (200) plane of Au, and (002), (110), and (212) planes of PdO lattice planes can be identified, which confirms the co-existence of Au, PdO, and In2O3 in the sensing material. The average lattice spacing of 0.416 nm, 0.200 nm, and 0.300 nm—which are in accordance with the (211) plane of the In2O3, (200) planes of Au, and (100) planes of PdO—can be clearly observed in Figure 4d,e. The results agree well with the SAED characterization, further confirming the co-existence of Au, PdO, and In2O3. Furthermore, elemental mapping images of the Au2Pd2-In2O3 sample demonstrate the uniform distribution of In, O, Au, and Pd elements as shown in Figure 4f–j.
XPS is carried out to analyze the surface chemical compositions as shown in Figure 5. The In 3d5/2 and In 3d3/2 peaks located at 444.13 eV and 451.68 eV for the pure In2O3 nanofiber shift to higher binding energies of 444.34 eV and 451.89 eV after noble metal modification as shown in Figure 5b, while the Au 4f7/2 and Au 4f5/2 peaks of the Au2Pd2-In2O3 sample located at 83.18 eV and 86.88 eV become lower compared with those of metallic Au located at 84.0 eV and 87.6 eV caused by the electron transfer from In2O3 to Au [18,19]. Figure 5d,e are the high-resolution Pd 3d spectra of the Pd2-In2O3 and Au2Pd2-In2O3 samples, indicating the successful Pd modification in In2O3 crystal [20]. Pd 3d3/2 can be divided into 341.10 eV (Pd0) and 342.40 eV (Pd2+), and Pd 3d5/2 can be decomposed into 335.08 eV (Pd0) and 336.90 eV (Pd2+). It is obvious that Pd species mainly existed in the form of Pd2+ in the Pd2-In2O3 sample (96.3%) and the Au2Pd2-In2O3 sample (85.6%). Many works have reported the co-existence of Pd species [21,22], which could lead to a significant increase in gas response. Figure 5f–i are high-resolution O 1s spectra resolved into three peaks, including lattice oxygen (OL) at 529.50 ± 0.6 eV, defective oxygen (OD) at 530.55 ± 0.4 eV, and adsorbed oxygen (OC) at 531.65 ± 0.3 eV [23]. It is clear that the relative percentages of OD and OC are significantly increased after noble metal modification, and the Au2Pd2-In2O3 sample possesses the highest relative percentages of OD and OC. Therefore, the highest response of the Au2Pd2-In2O3 sample can be expected [24]. The percentages of the three different O 1s compositions in the four samples are listed in Table 2.

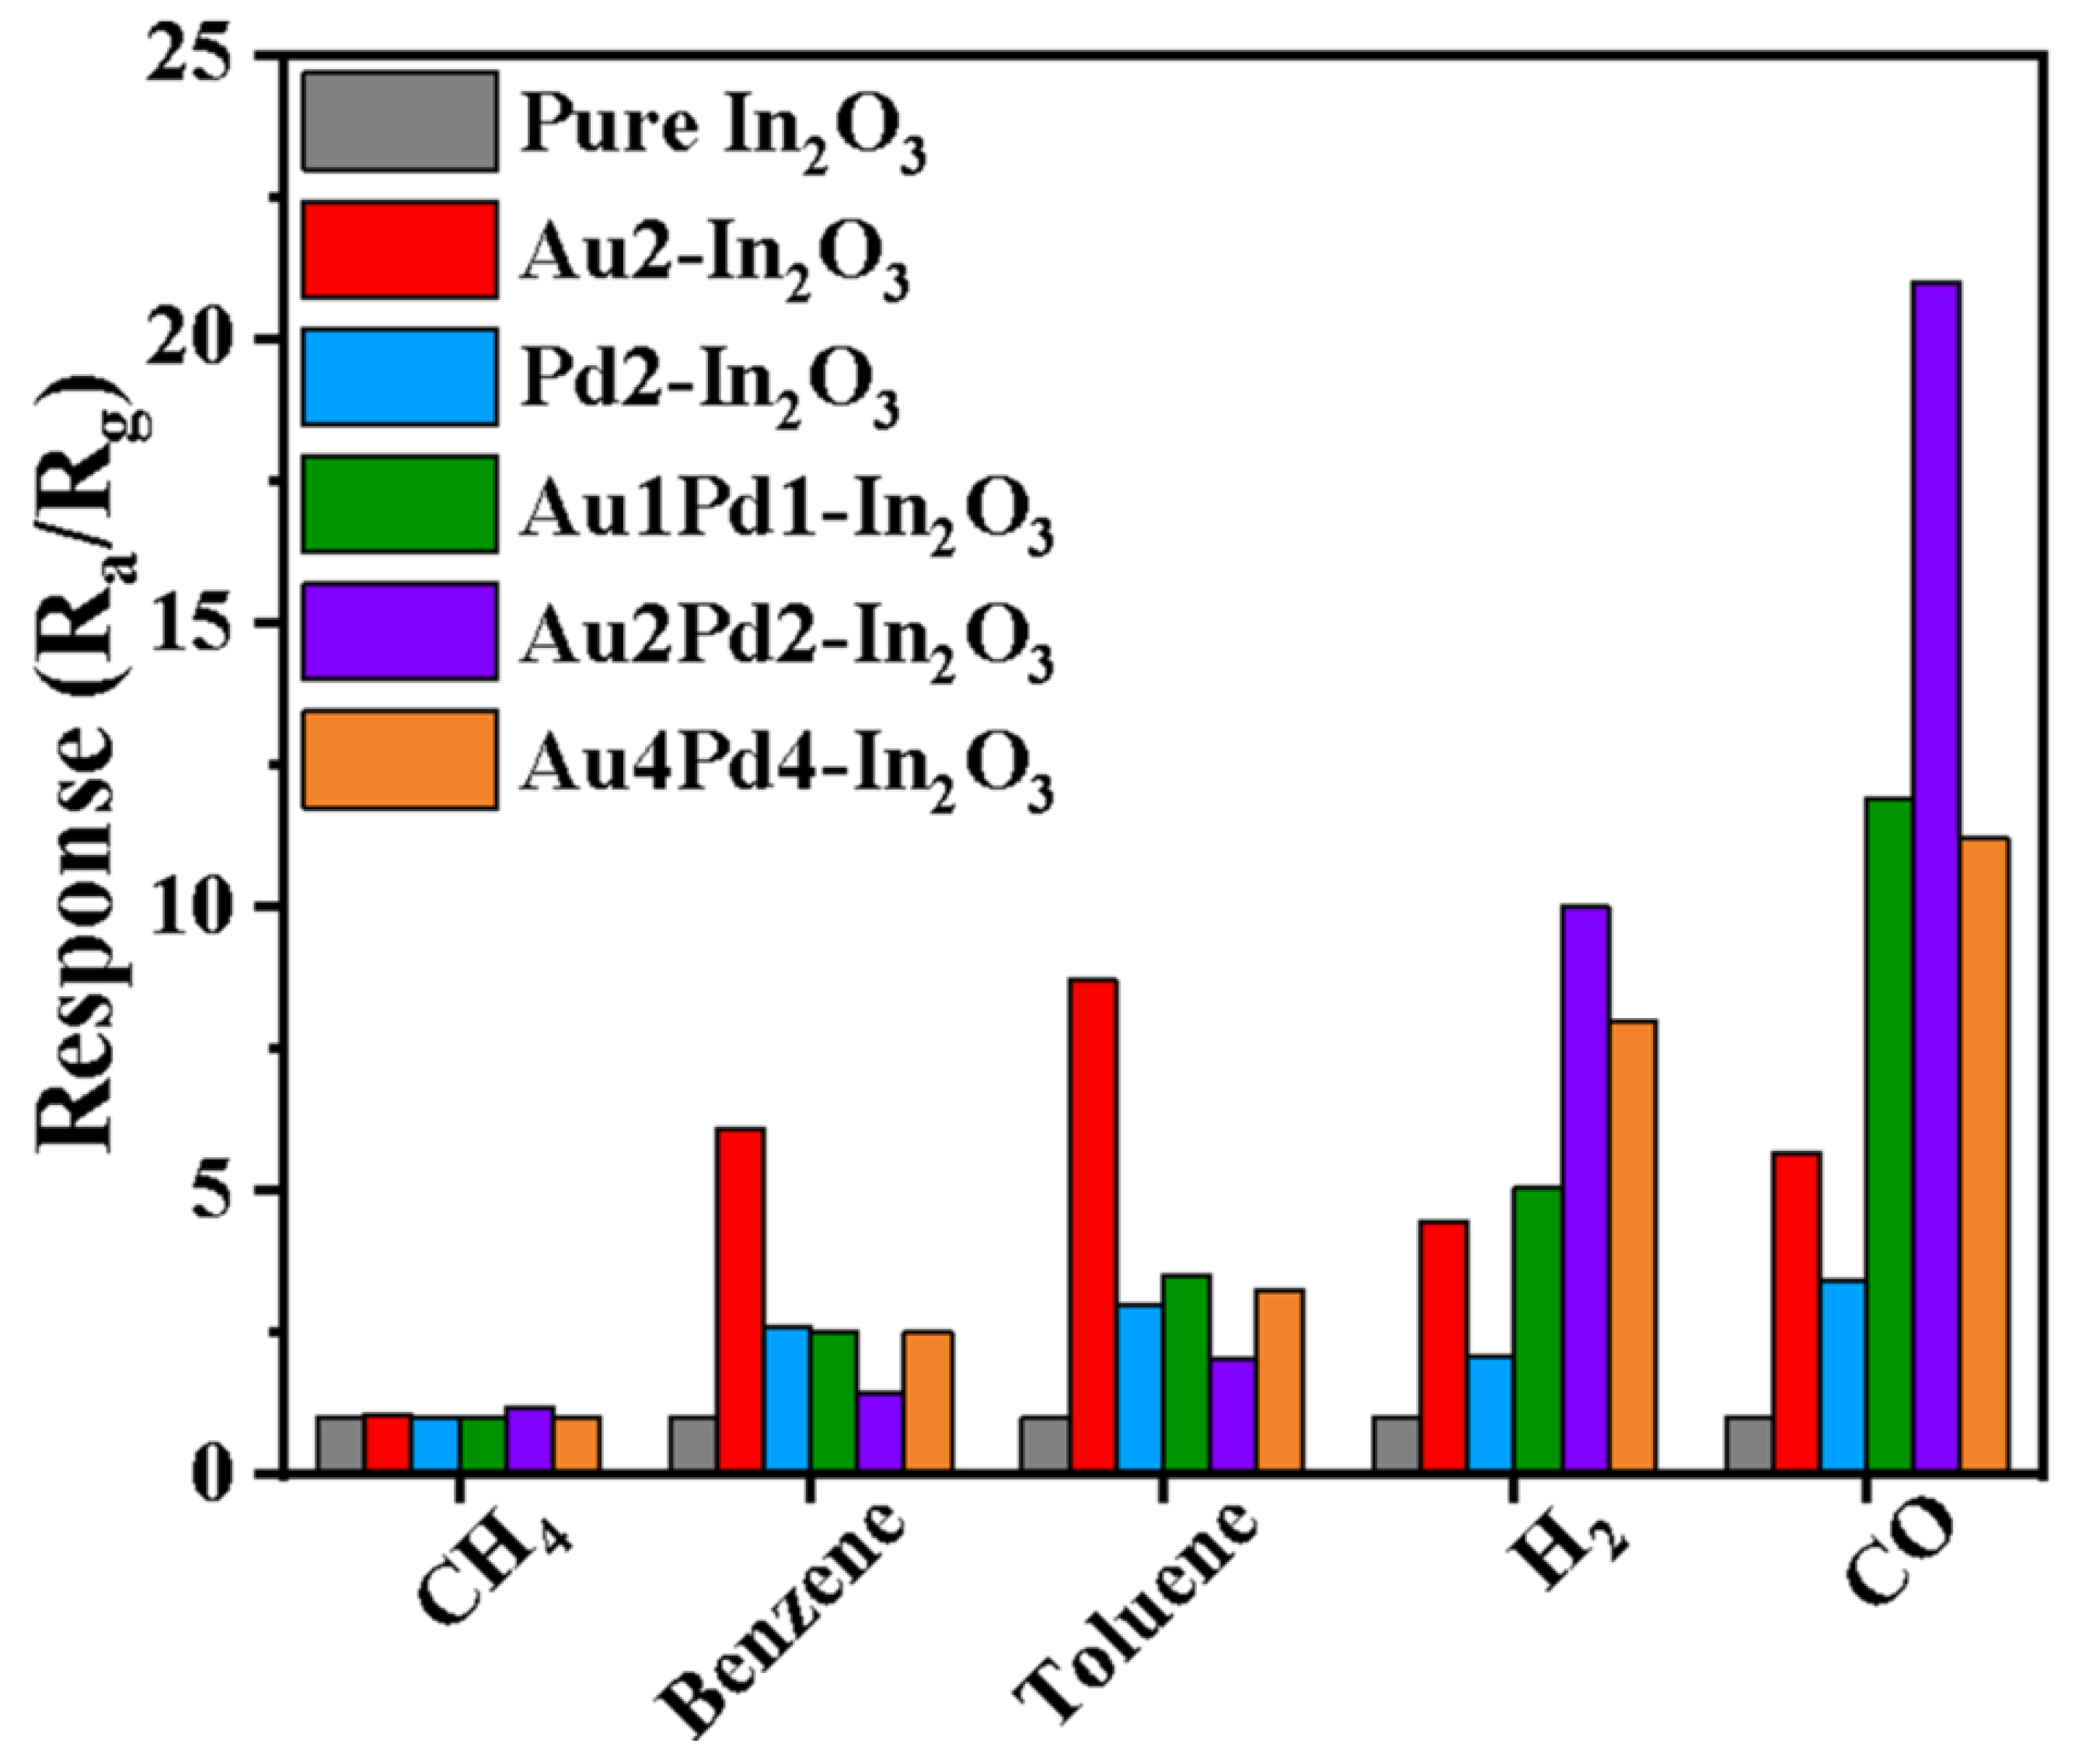
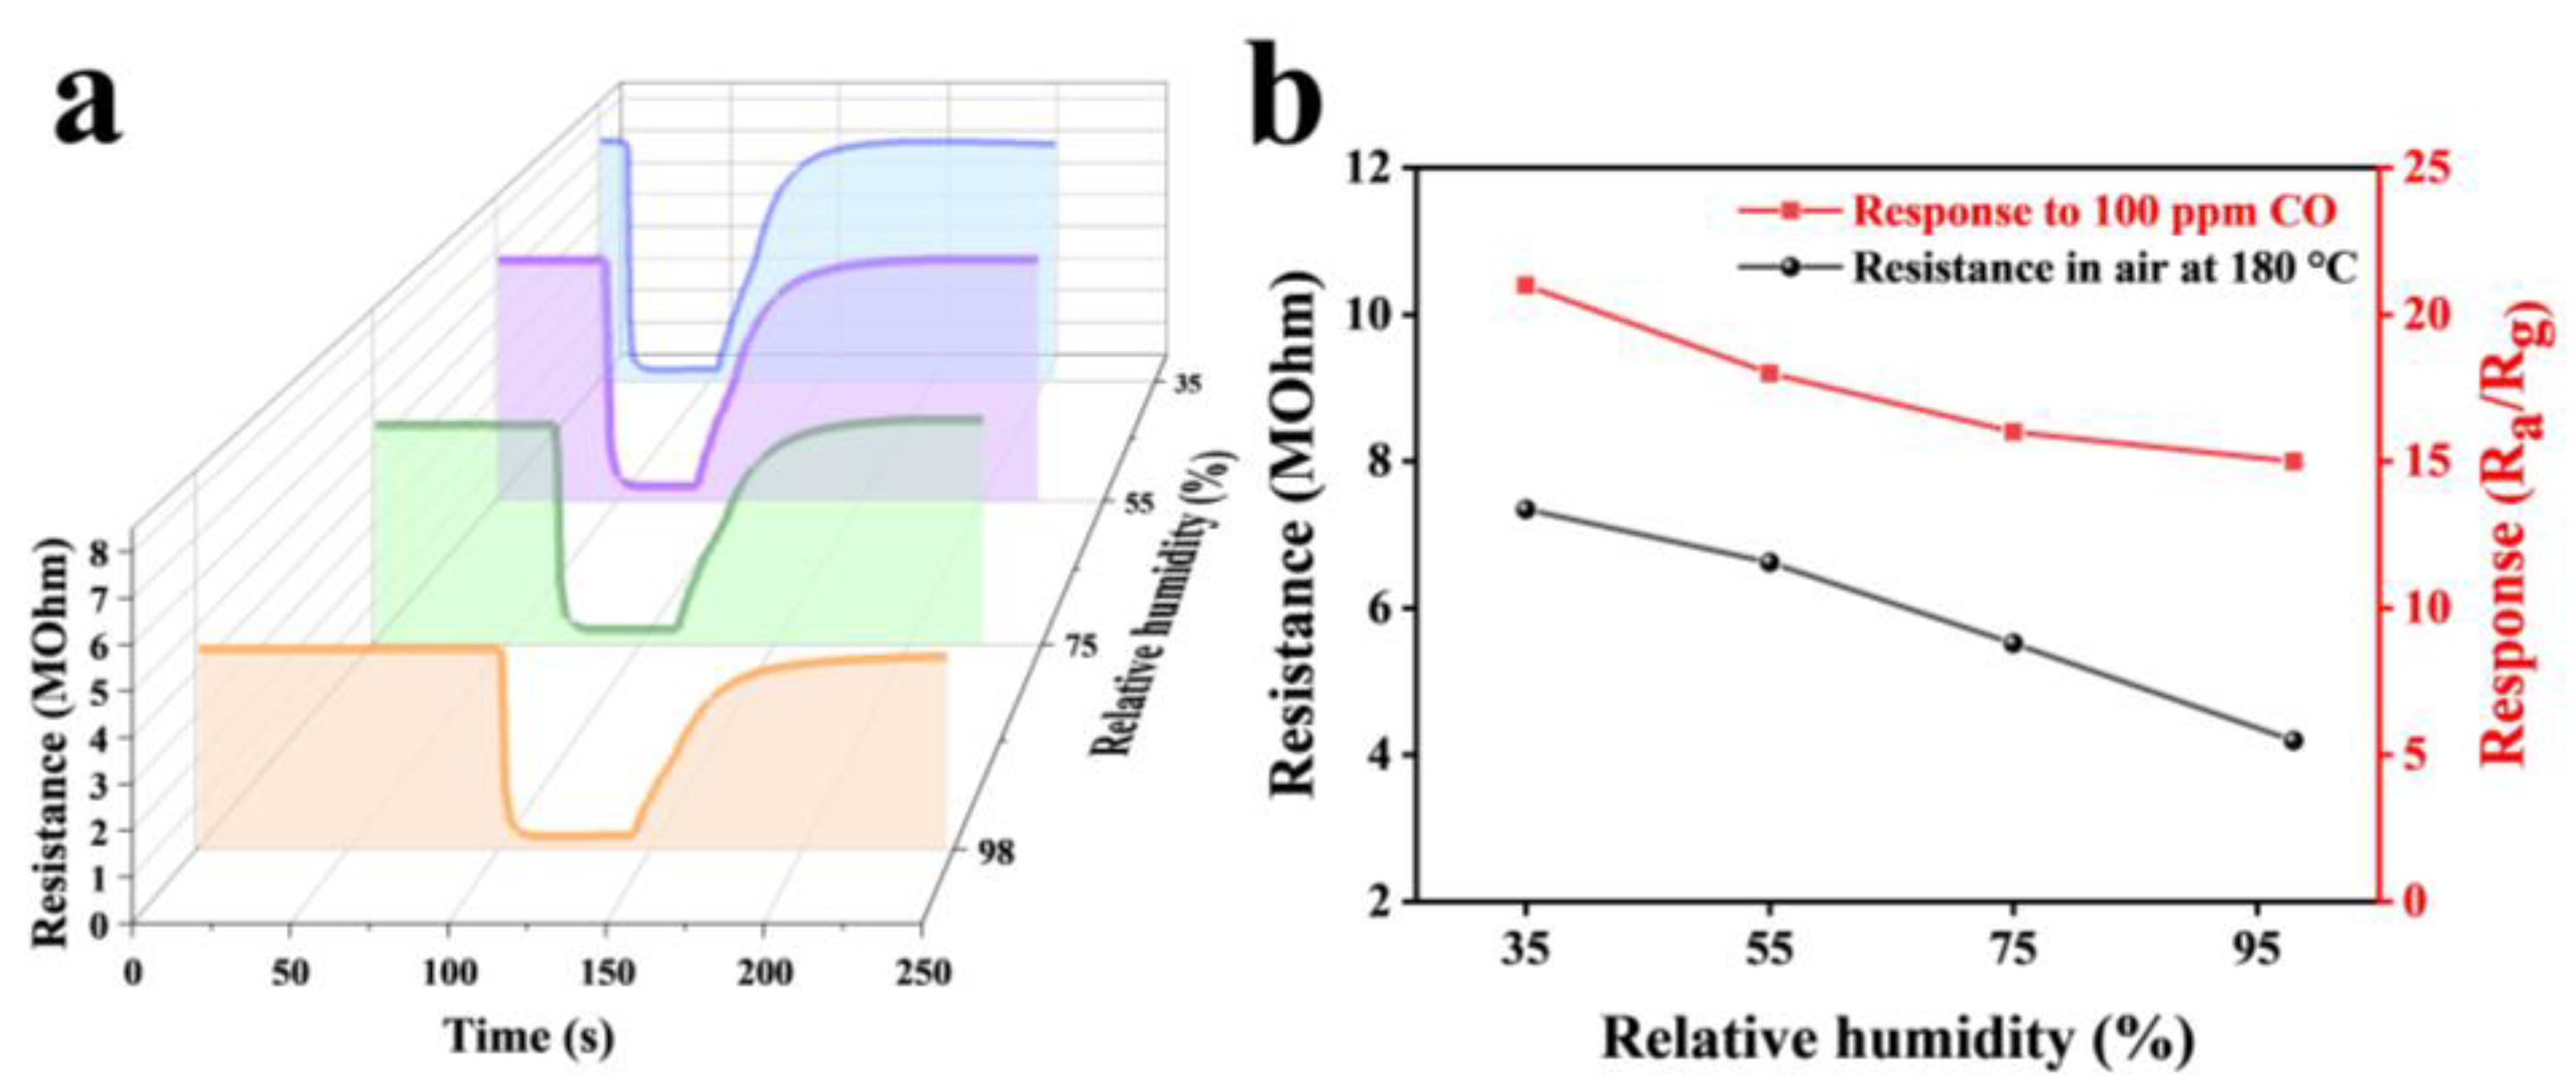
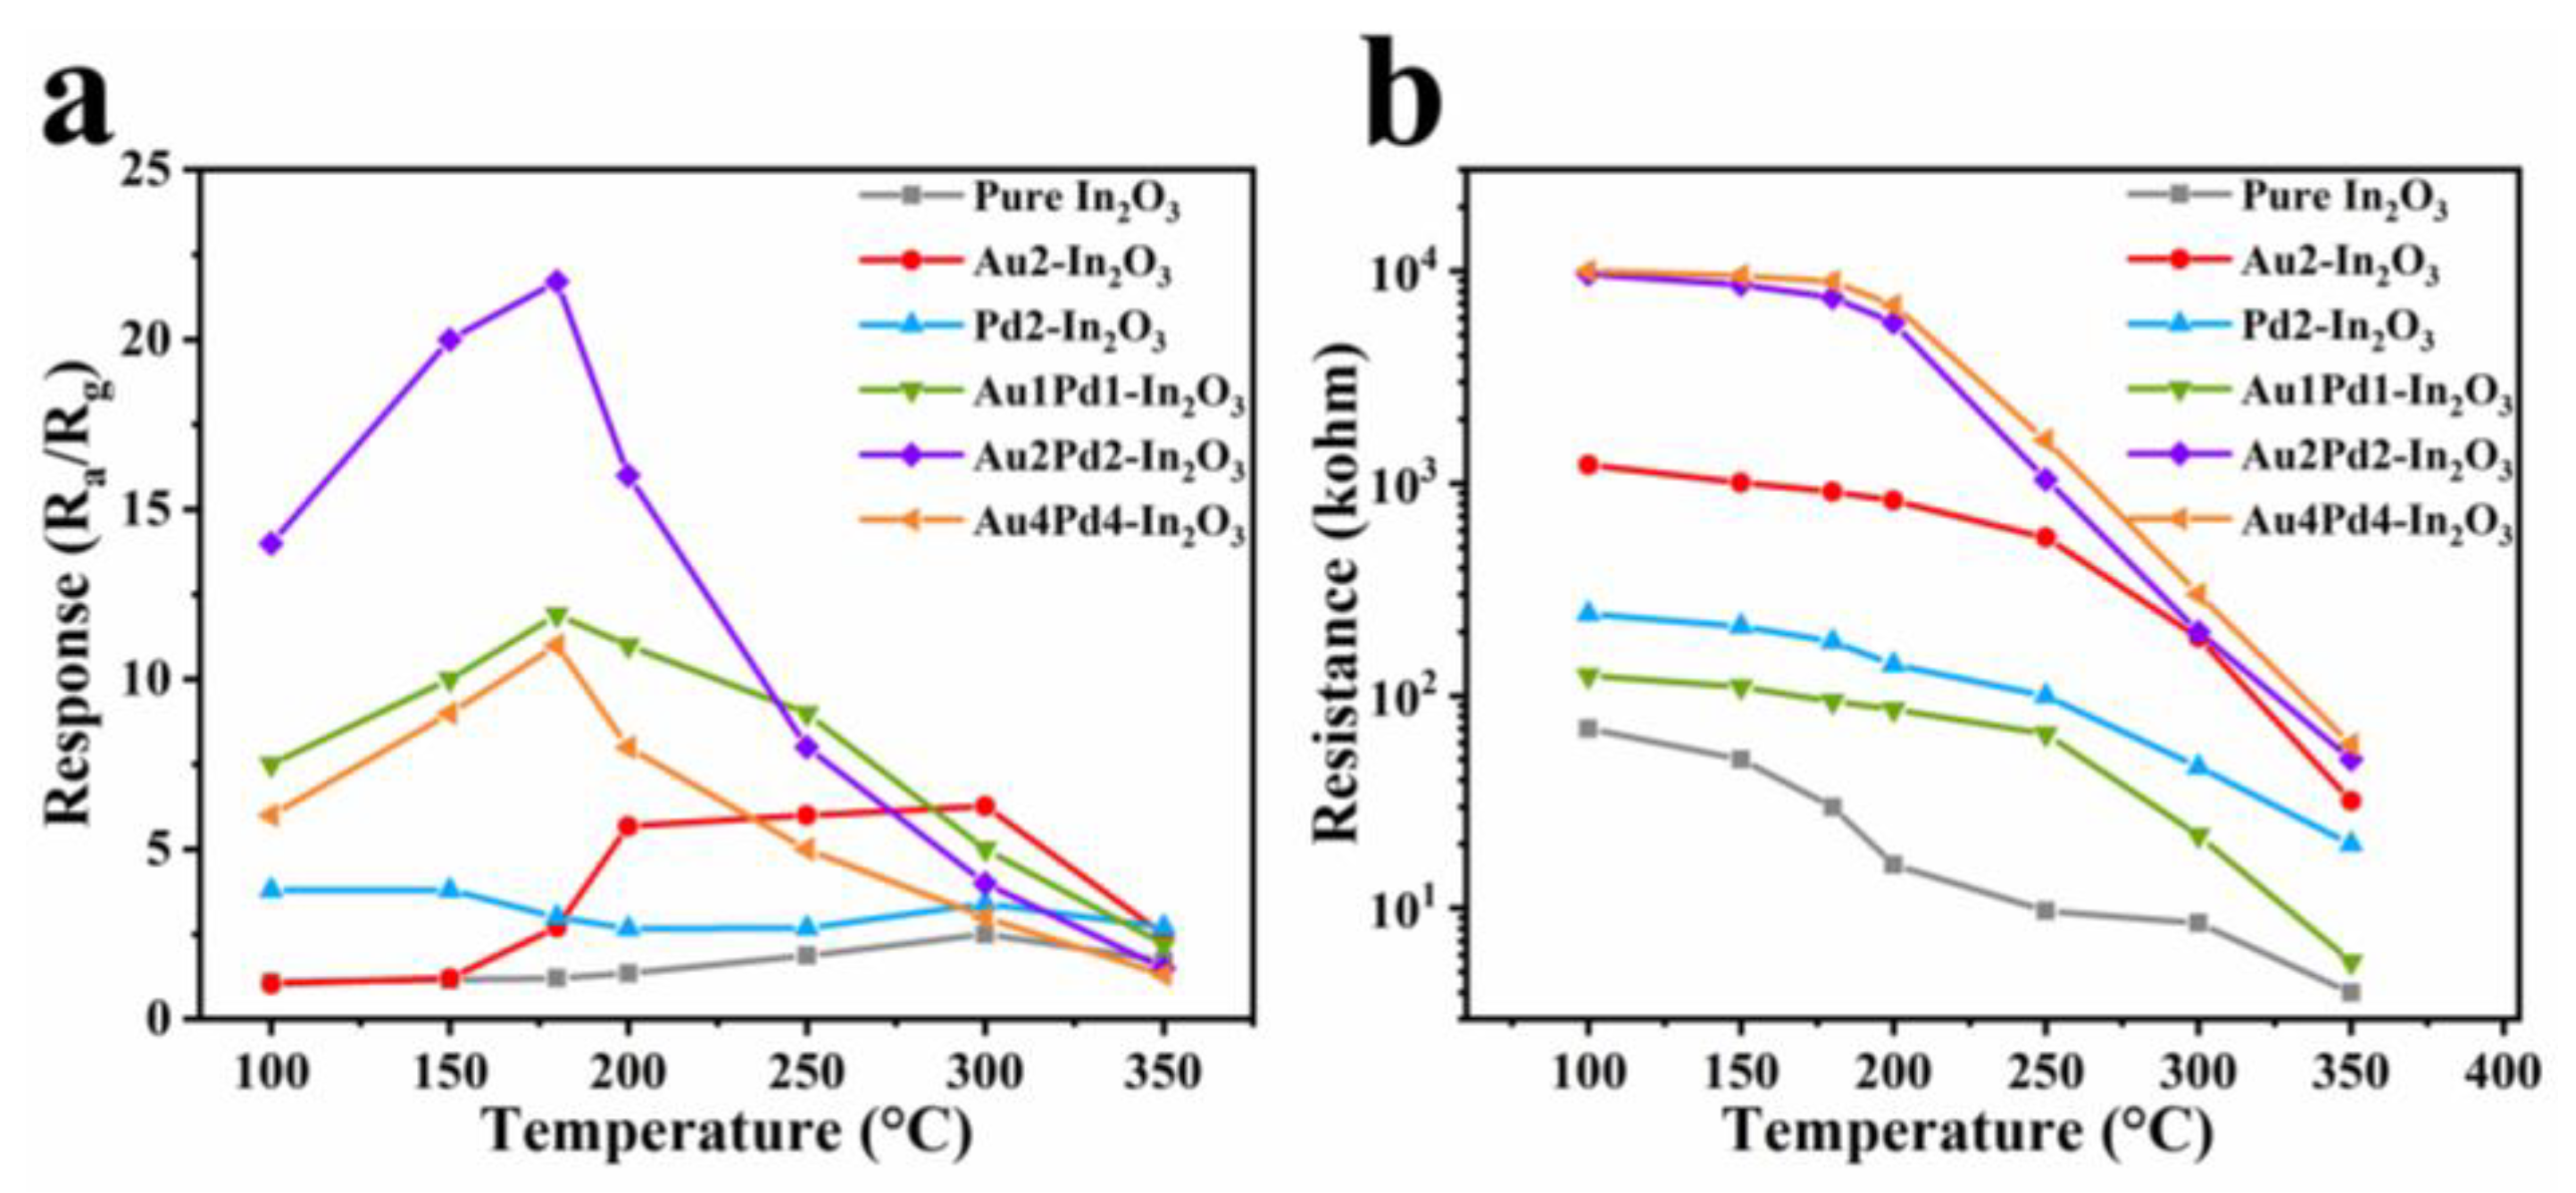
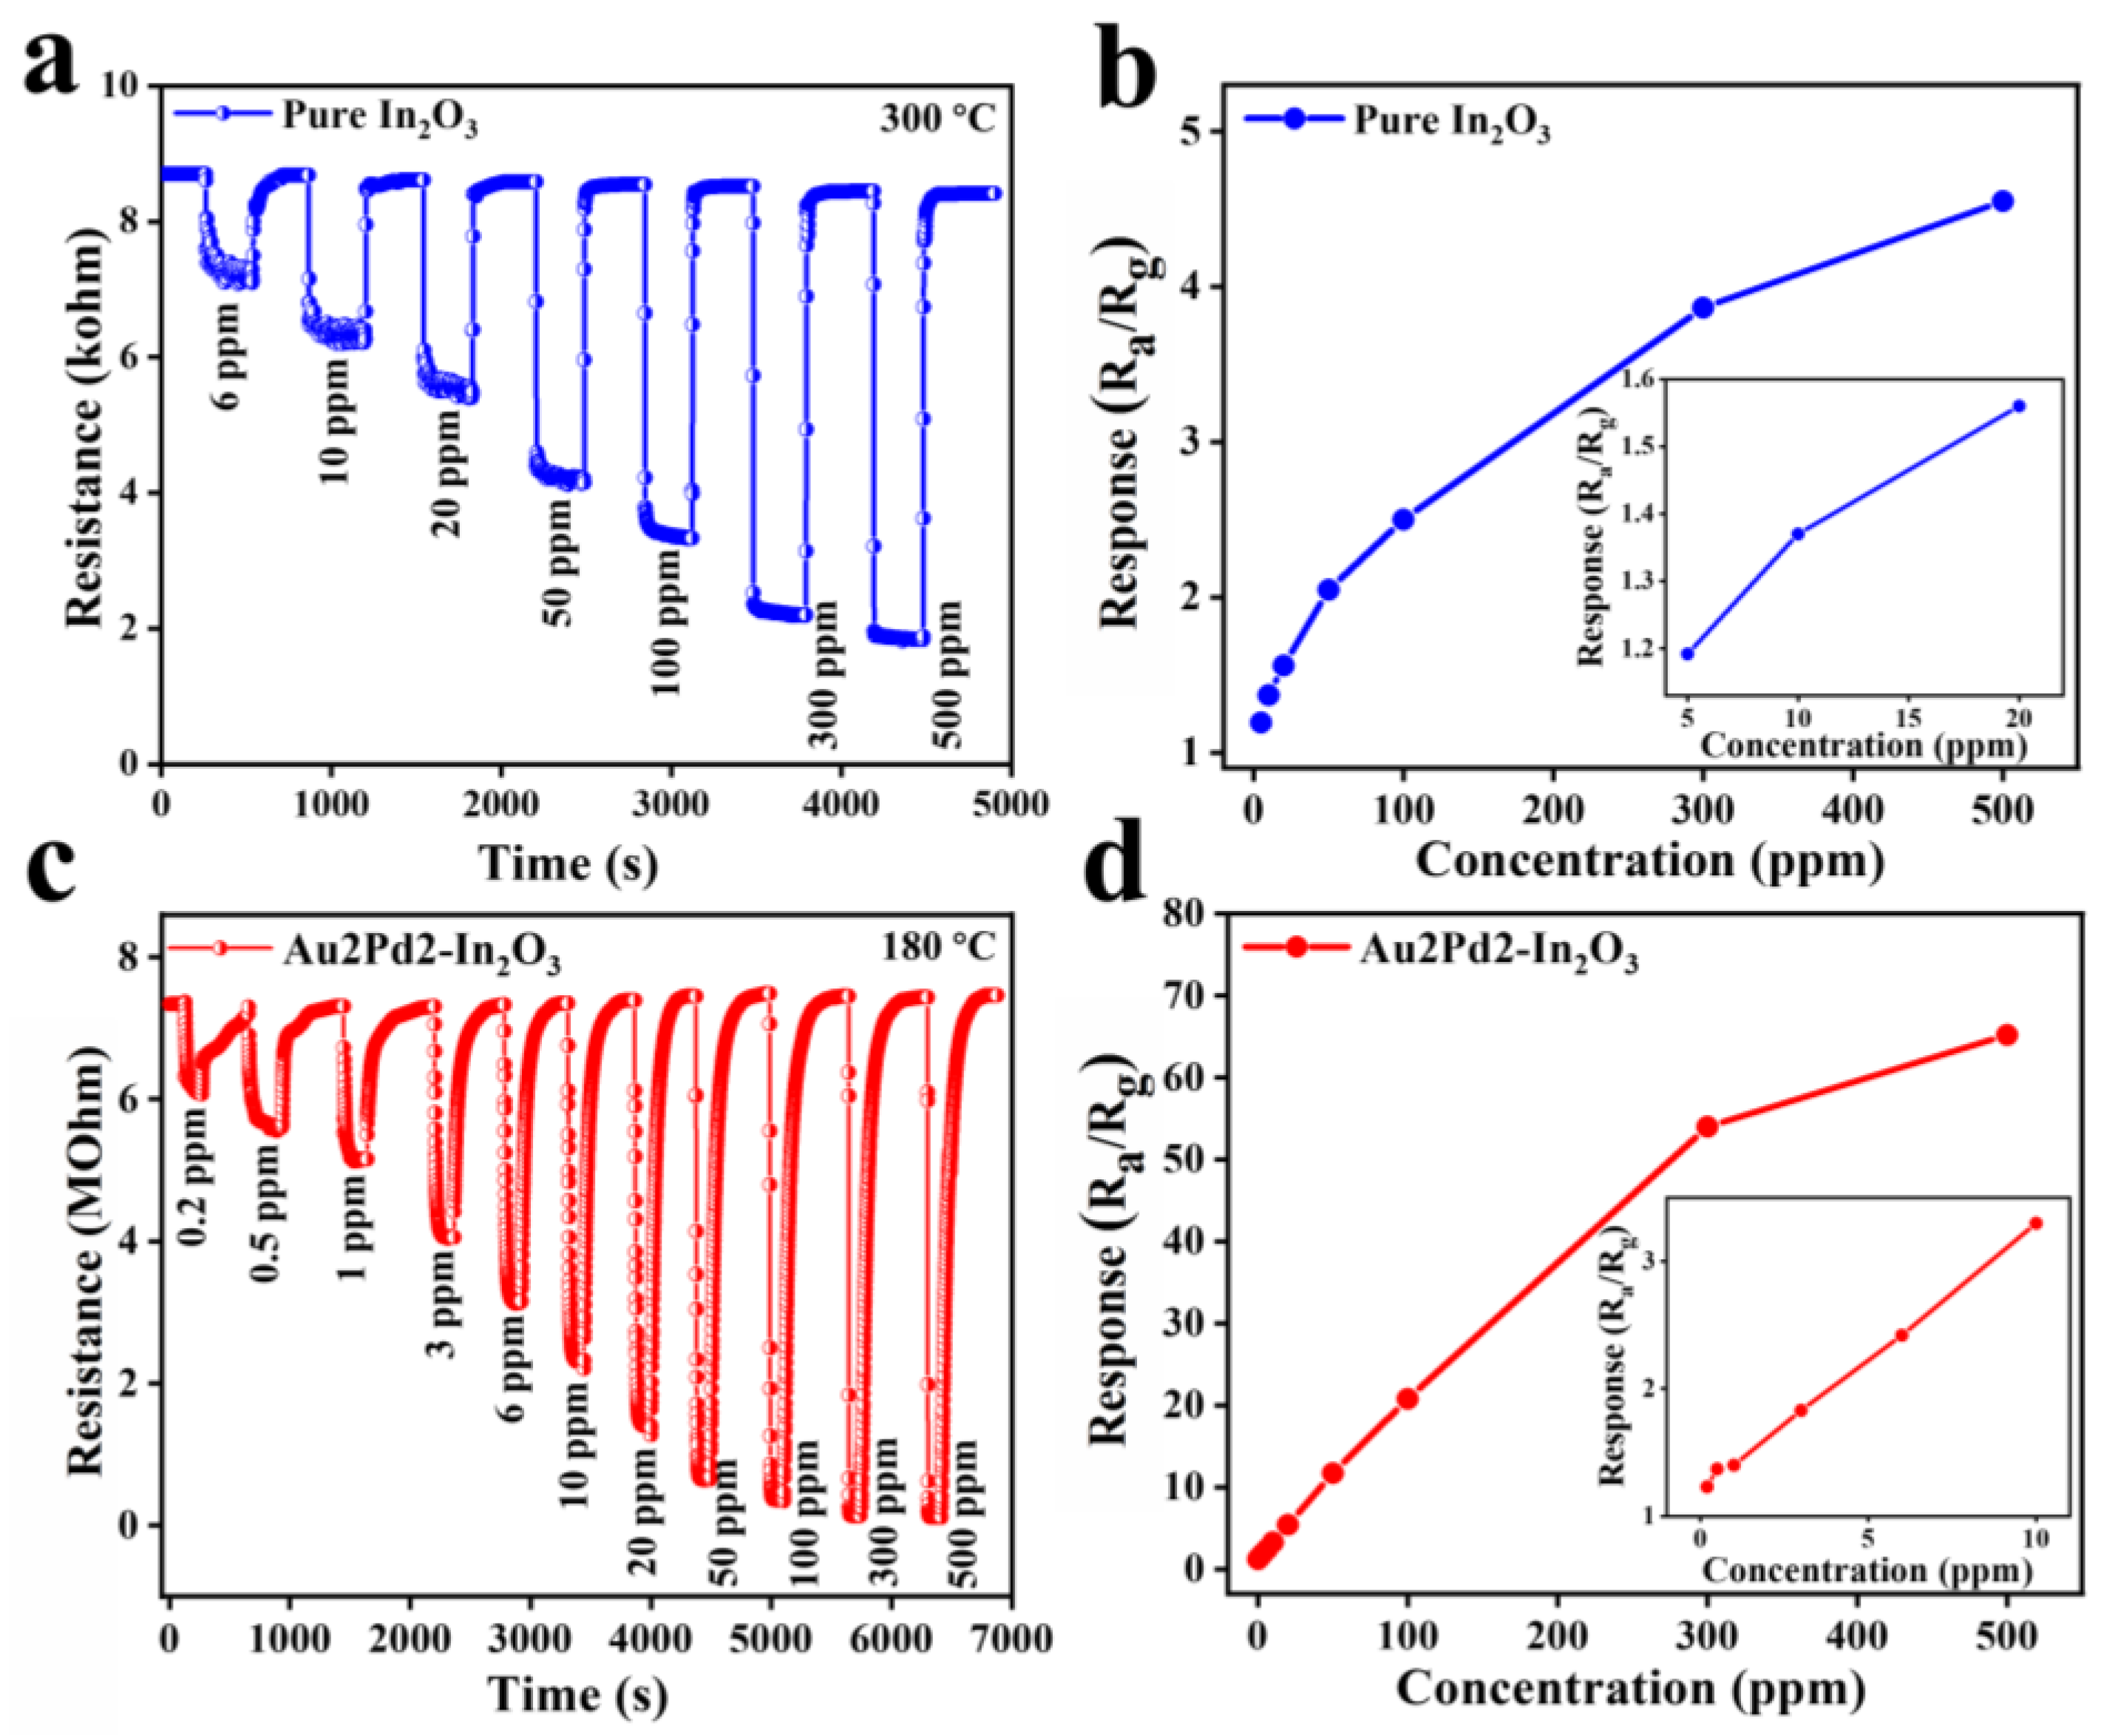
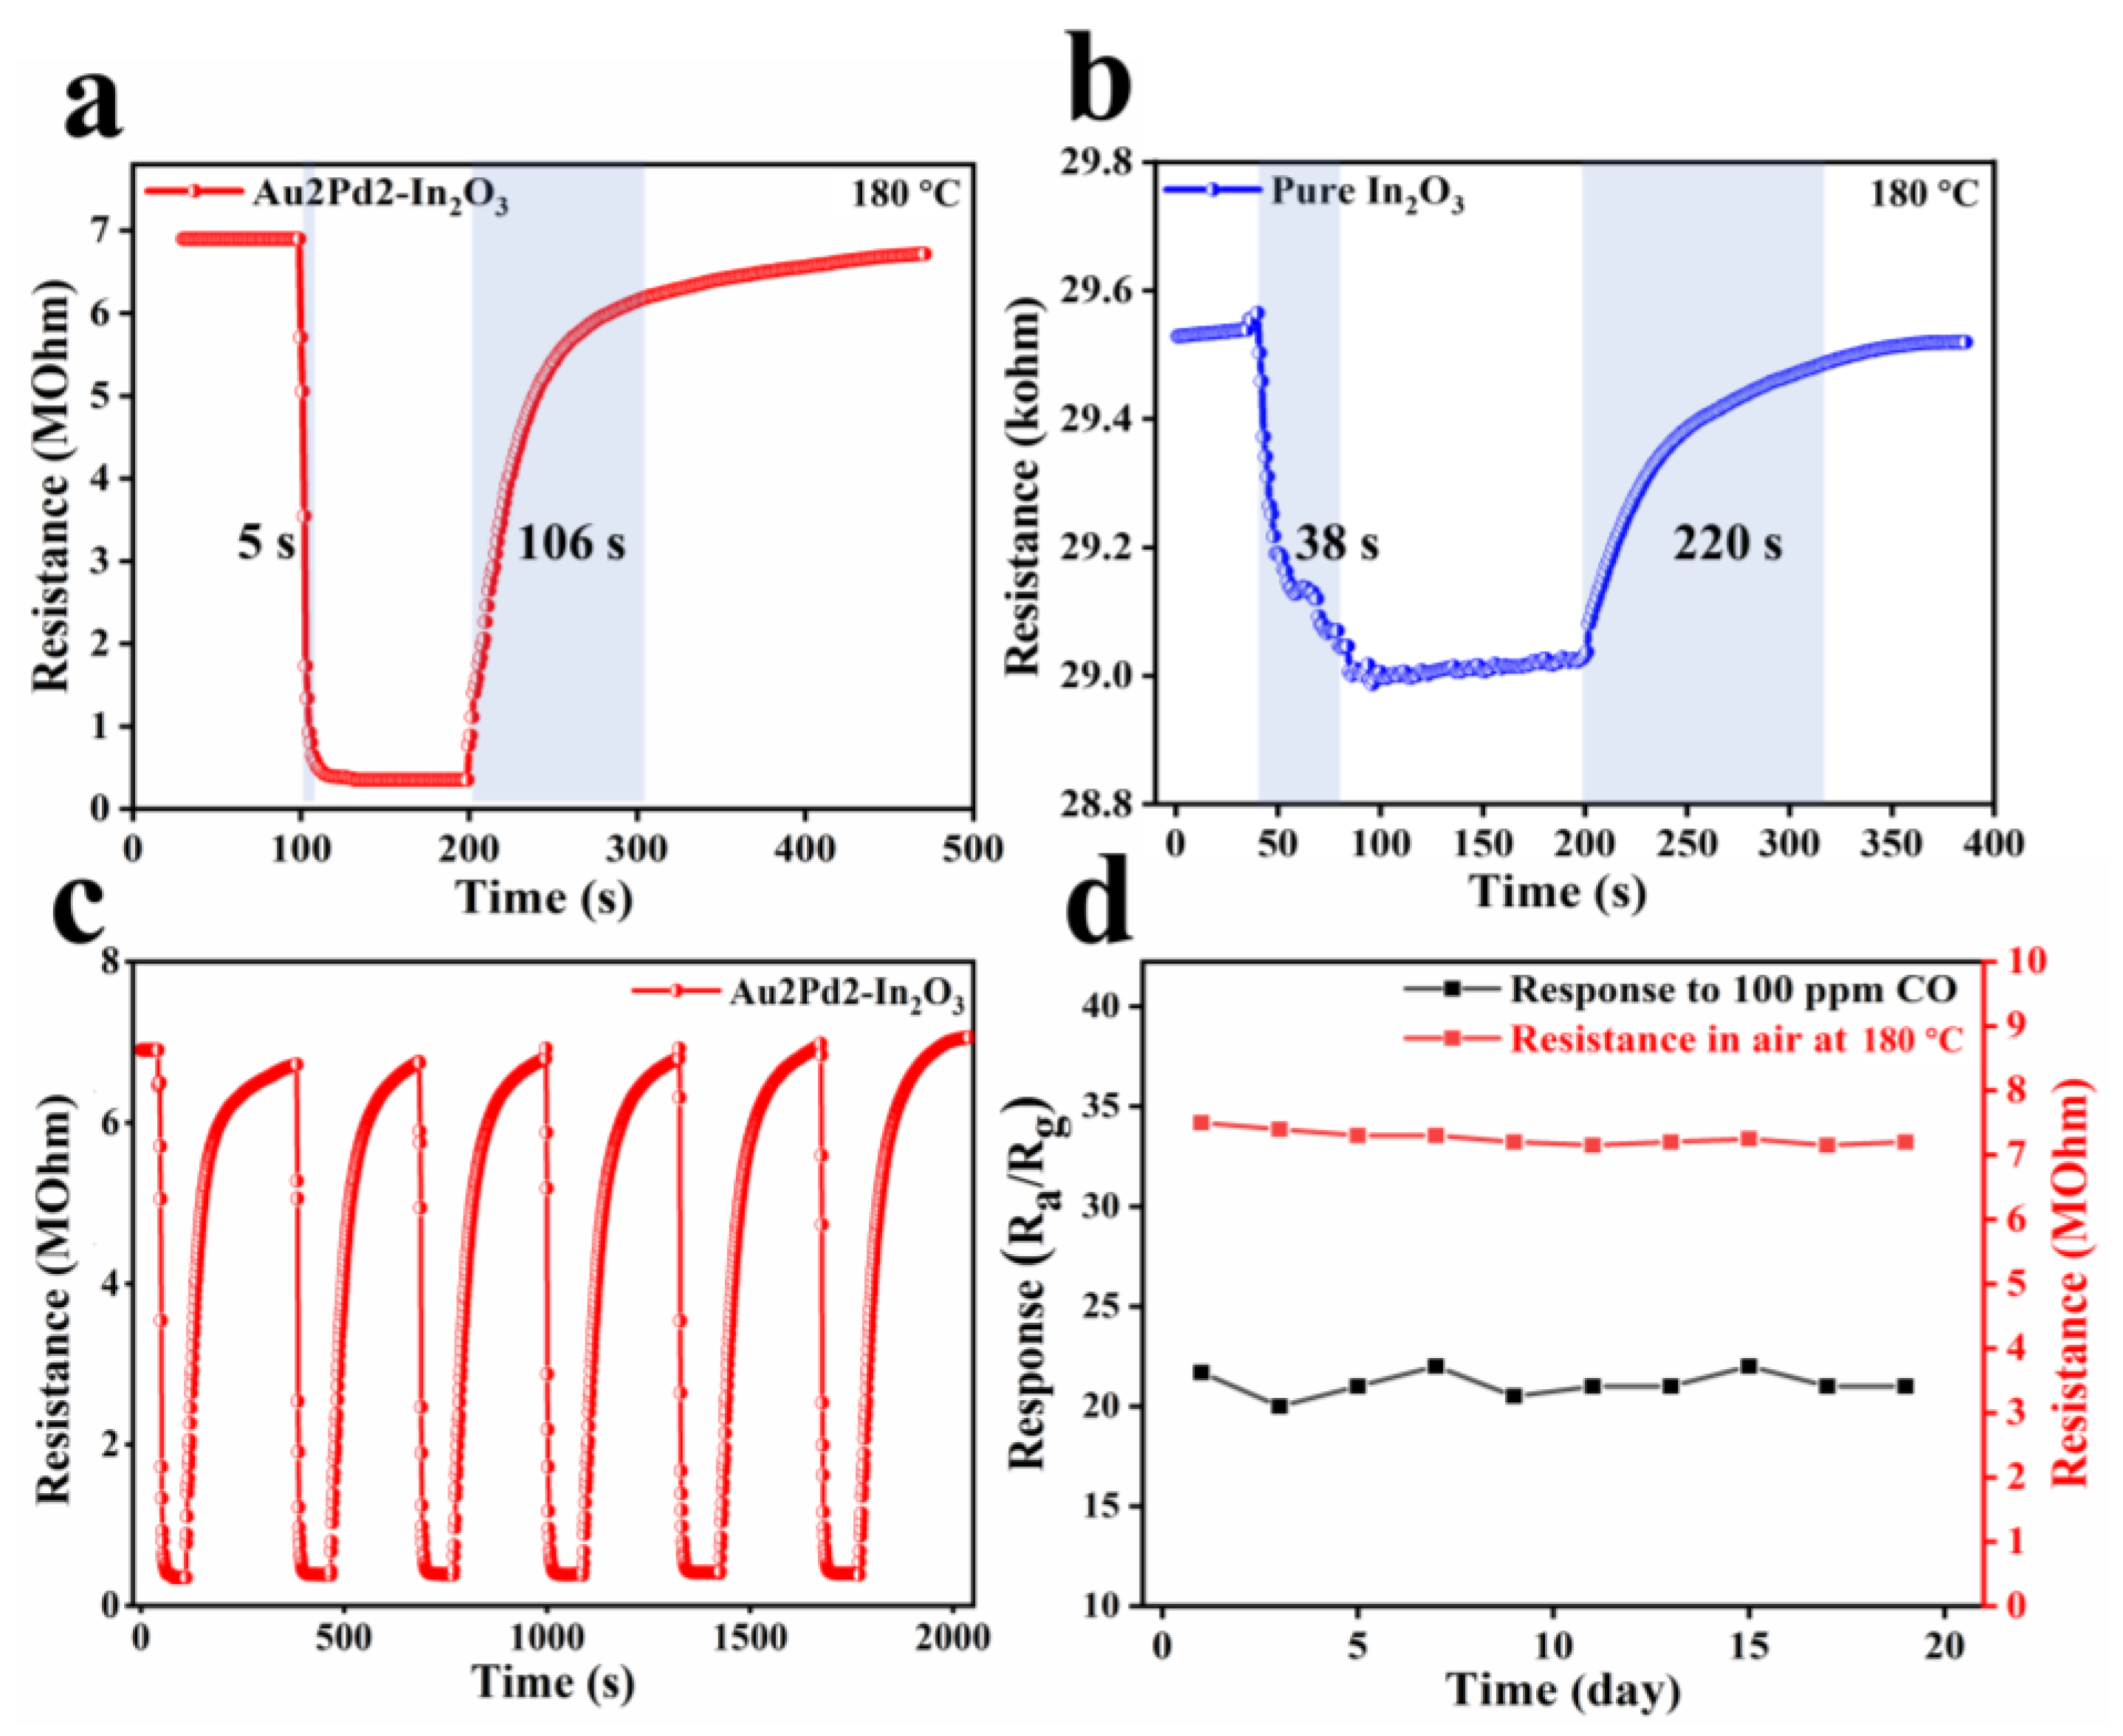
3.2. Sensing Performance

The responses to 100 ppm CO of the gas sensor based on as-obtained samples are shown in Figure 6a. It is clear that both Au modification (Au2-In2O3) and PdO modification (Pd2-In2O3) can increase the gas response to 100 ppm CO compared with pure In2O3, and the sensitization effect of Au is more prominent. However, Au modification does not change the OWT (300 °C), while PdO does lower the OWT to 150 °C [10]. Co-modification of Au and PdO into In2O3 nanofibers can further increase the gas response, and Au2Pd2-In2O3 possesses the highest response (21.7) among these sensors. Higher (Au4Pd4-In2O3, 11.2) and lower (Au1Pd1-In2O3, 11.6) co-modifying contents will decrease the gas response. The OWT of the gas sensors after co-modification of Au and PdO is 180 °C, located between 150 °C (Pd2-In2O3) and 300 °C (Au2-In2O3), indicating the synergistic effect of Au and PdO. The baseline resistance of the gas sensors based on the as-obtained samples will decrease with an increase in the working temperature (Figure 6b), which is a typical property of semiconductors.
Figure 7a–c show the dynamic response curves of pure In2O3 and Au2Pd2-In2O3 sensors at their optimal operating temperatures. The responses will increase with an increase in CO gas concentration for both sensors, and the resistances can recover their original value after exposure to different CO concentrations. The response values of the gas sensor based on pure In2O3 nanofibers to 6, 10, 20, 50, 100, 300, and 500 ppm CO gas at 300 °C are 1.19, 1.37, 1.56, 2.05, 2.30, 3.86, and 4.55, respectively. The response values based on the Au2Pd2-In2O3 sample to 0.2, 0.5, 1, 3, 6, 10, 20, 50, 100, 300, and 500 ppm CO gas at 180 °C are 1.23, 1.37, 1.40, 1.83, 2.42, 3.30, 5.44, 11.7, 21.7, 54.0, and 65.2, respectively. It is clear that the Au2Pd2-In2O3 sensor exhibits a higher gas response to the different concentrations of CO than the pure In2O3 sensor. In addition, the Au2Pd2-In2O3 sensor exhibits an extremely lower detection limit (0.2 ppm) than the pure In2O3 sensor (6 ppm), indicating that noble metal modification can not only enhance the gas response, but can also decrease the detection limit. Figure 7b and Figure 6d demonstrate that the gas responses share an almost linear relationship with CO concentration, which is beneficial for accurate gas concentration detection.
The selectivity of the gas sensors is shown in Figure 8. The ratio of the response values for CO and H2 is taken to evaluate the selectivity. It is clear that Au modification is more effective for increasing the CO gas response than PdO modification, but the selectivity of the Au-modified sensor (~1.3) is smaller than the PdO-modified sensor (~1.6). In addition, the response to benzene and toluene has also been significantly increased. Co-modification using Au and PdO for the Au1Pd1-In2O3 sensor can further increase the gas response to CO and H2 with higher selectivity (2.4), and suppress the response to benzene and toluene at the same time. The response for CO and H2 is further enhanced with an increase in Au and PdO modifying content (Au2Pd2-In2O3), and the selectivity is changed slightly (~2.2). At the same time, the response to benzene and toluene has been further suppressed. The response becomes worse and the selectivity becomes lower (1.5) when the co-modifying content of Au and PdO is too high (Au4Pd4-In2O3). Therefore, the Au2Pd2-In2O3 sensor is more suitable for CO detection in this work.
The response/recovery times for pure In2O3 (38 s/220 s) and Au2Pd2-In2O3 (5 s/106 s) at 180 °C can be observed in Figure 9a,b, indicating that noble metal modification can accelerate the response/recovery speed. Such an improvement in the response/recovery speed can be attributed to the catalytic effect of noble metal modification, which has been verified in many works [25,26]. The six reversible cycling dynamic response curves of Au2Pd2-In2O3 100 ppm CO demonstrate that the Au2Pd2-In2O3 sensor has good reproducibility and repeatability (Figure 9c). The stability test of Au2Pd2-In2O3 for 19 days indicates that the baseline resistance in air and response to 100 ppm CO are almost unchanged (Figure 9d), which is of great significance in practical applications. Overall, the theAu2Pd2-In2O3 sensor has favorable sensing characteristics in its high gas response and low detection limit for CO detection compared with the existing reports as shown in Table 3.
Humidity is also an important factor affecting the sensing performance of oxide semiconductor sensors [30]. The dynamic response curves of the Au2Pd2-In2O3 sensor at 30%, 50%, 70%, and 90% RH were measured under 25 °C (Figure 10a), as well as the baseline resistance and response of the sensor versus humidity change (Figure 10b). When humidity was increased from 35% to 98% RH, baseline resistance of the sensor decreased by 42% and the response value decreased by 28%. This reduction in baseline resistance is due to the reaction of water molecules with oxygen on the surface of the material. Secondly, water molecules can compete with gas molecules and oxygen for adsorption sites on the surface of the sensing material, leading to a decrease in the response value [31]. Nevertheless, response of the Au2Pd2-In2O3 sensor to 100 ppm CO is still up to 15.2 under 98% RH, indicating excellent moisture resistance.

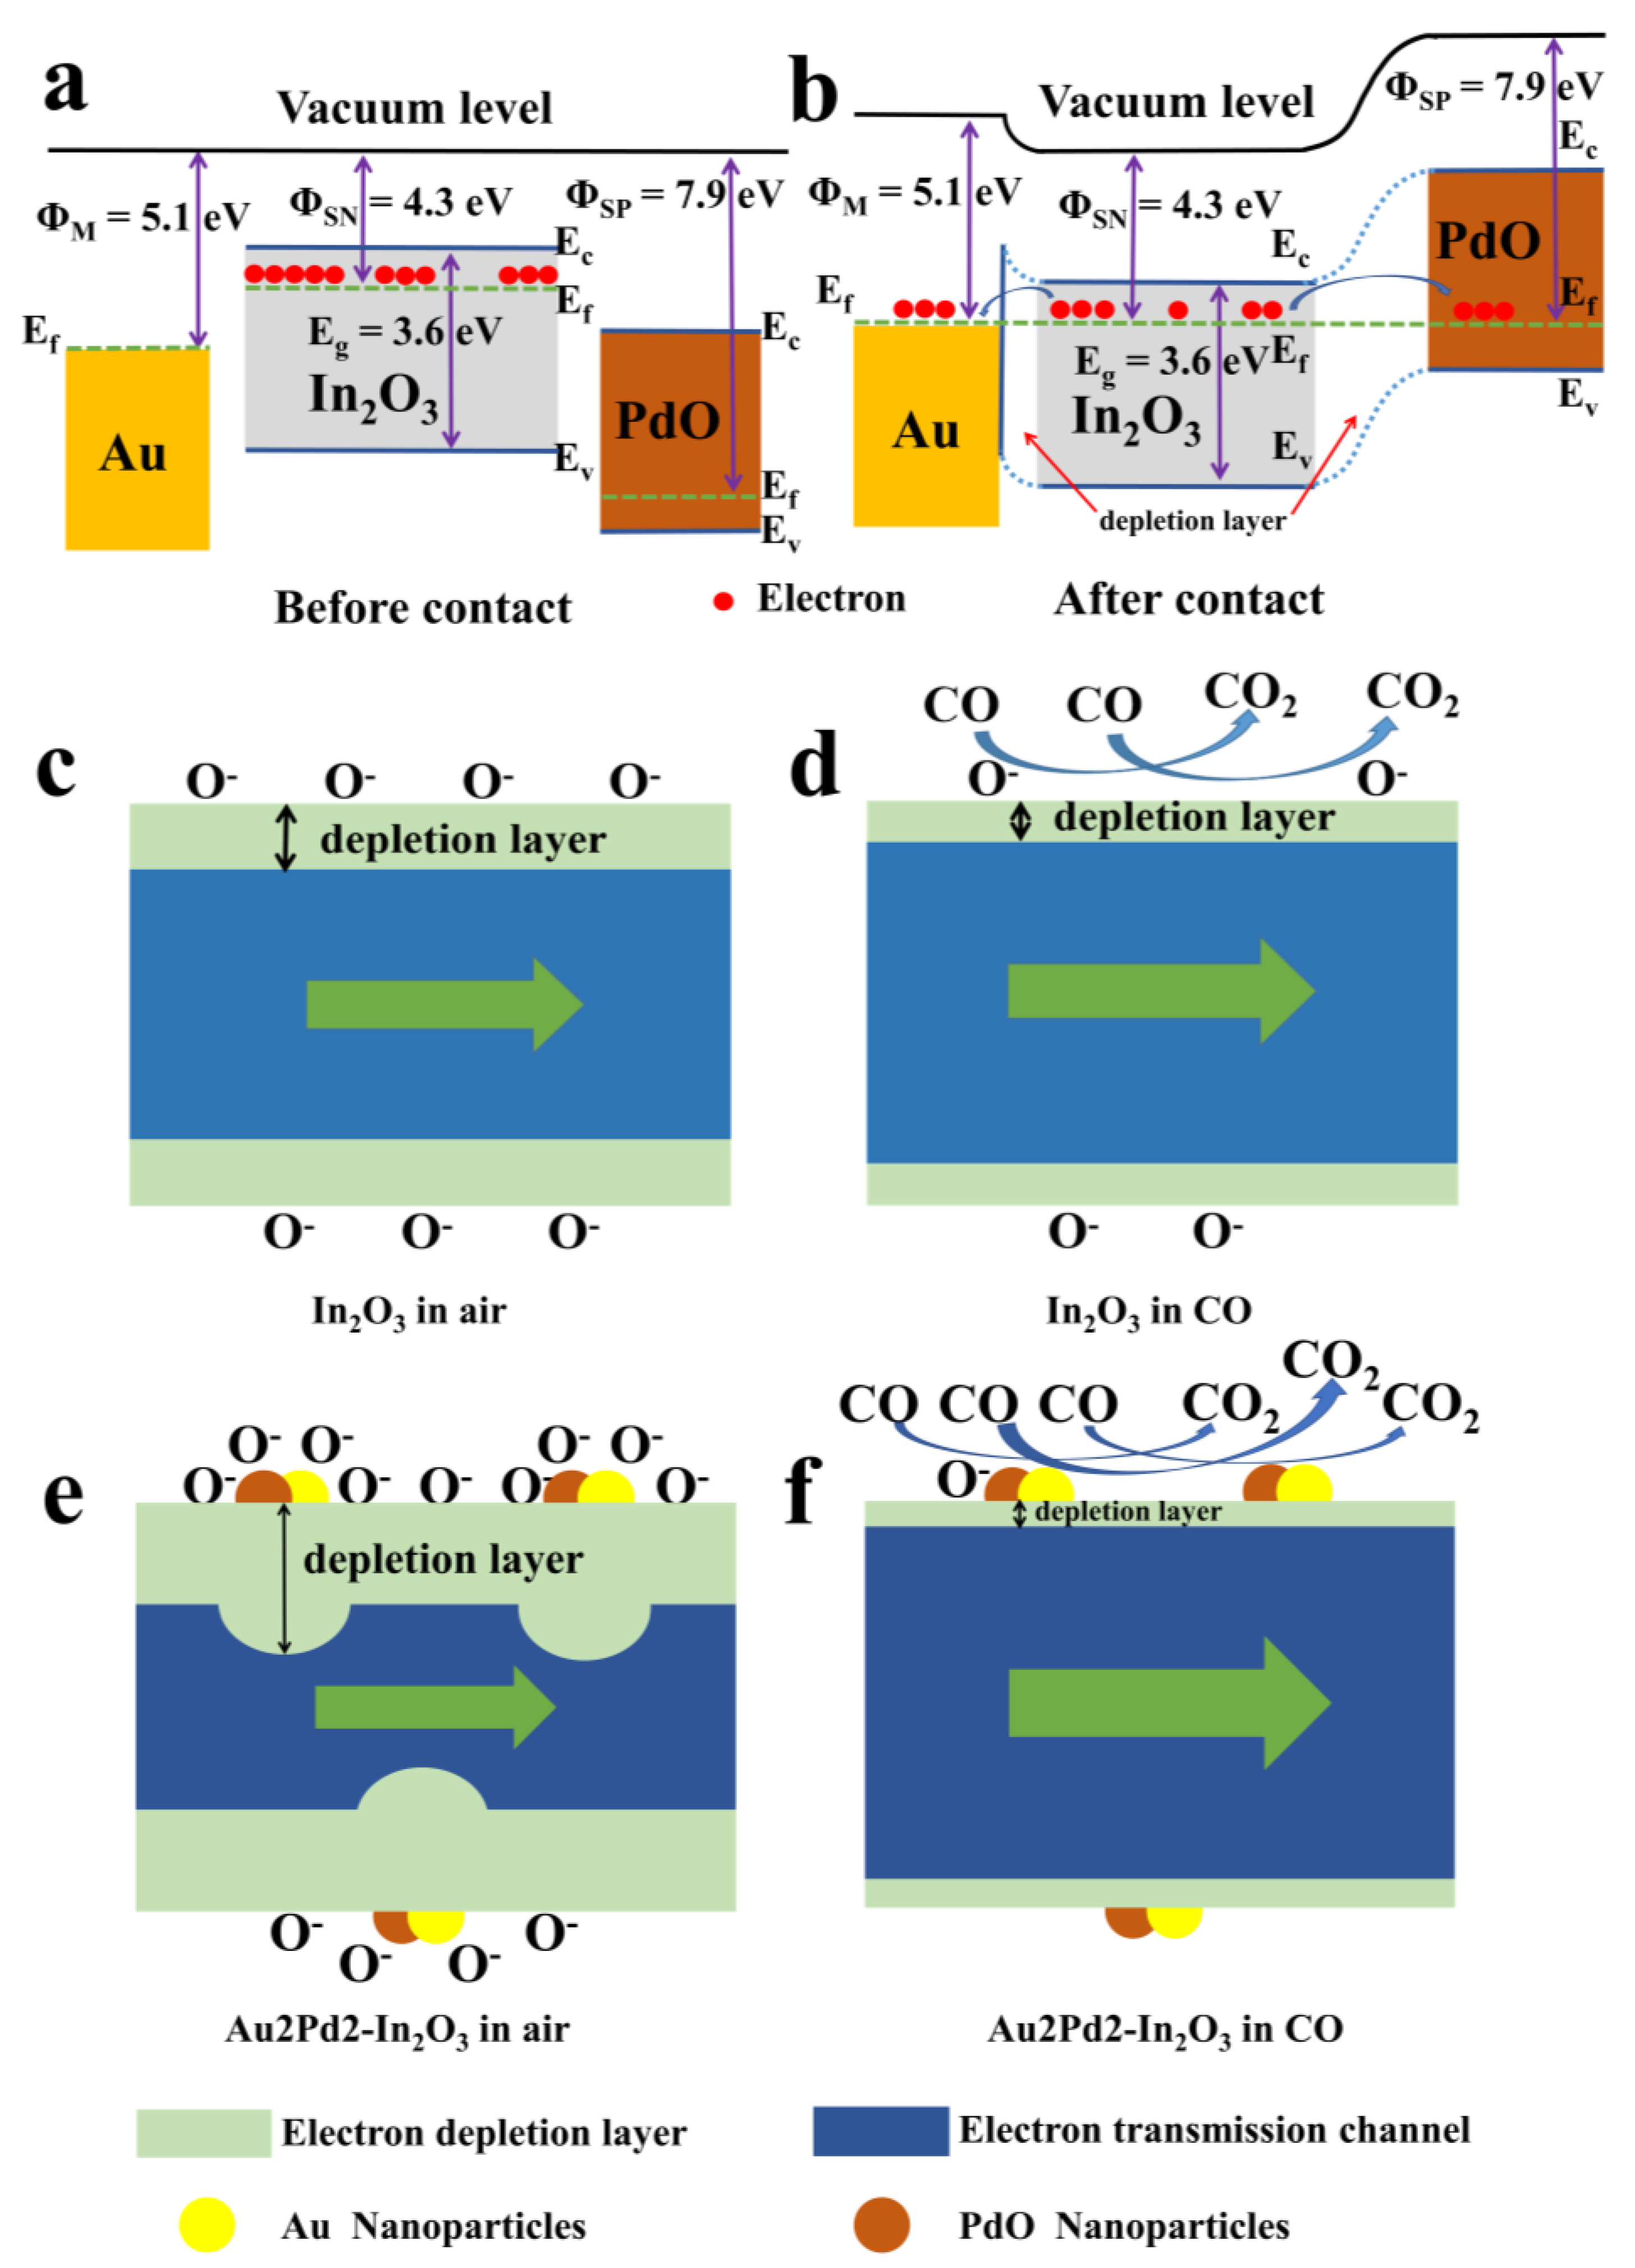
3.3. Sensing Mechanism

The gas-sensing mechanism can be explained by the space-charge layer, oxygen adsorption, and surface reaction between the reducing gases and adsorbed oxygen [32,33]. The sensing enhancement of the gas response can be mainly attributed to the electronic sensitization and chemical sensitization of the noble metals [24,34,35], as well as the synergistic effect of Au and PdO.
The electronic sensitization effect can be seen from the baseline resistance increase after noble metal modification, as shown in Figure 6b. The work functions of In2O3, Au, and PdO are about 4.3 eV [36], 5.1 eV [37], and 7.9 eV [38], respectively. The Schottky contact between Au and In2O3 and p–n heterojunction between PdO and In2O3 will formed after co-modification using Au and PdO [39,40,41]. The electrons will flow from In2O3 to Au and PdO and lead to the formation of the thicker space-charge layer due to the different Fermi levels of these materials as shown in Figure 11. Therefore, the baseline resistance will increase. In addition, Au modification seems to have better effect than PdO modification on the increase in the baseline resistance according to Figure 6b. This may be due to the fact that Au atoms mainly exist on the surface of In2O3 nanofibers and many Au-In2O3 contacts can be formed, while the majority of Pd ions enter into the In2O3 crystal and the formations of the p–n heterojunctions are fewer. However, the increase in baseline resistance after modification with Au and PdO is beneficial in improving the gas response [42].
The chemical sensitization can be verified by the XPS results as shown in Table 2. It is clear that relative chemisorbed oxygen (OC) percentages will significantly increase after noble metal modification, and Au2Pd2-In2O3 has the highest OC content. Therefore, it is reasonable that the Au2Pd2-In2O3 sensor has the highest gas response. The OWT changes from 300 °C to 180 °C after co-modification using Au and PdO. The lower OWT also indicates the chemical sensitization effect, which leads to a higher gas response.
The synergistic effect of Au and PdO can be seen from the OWT after co-modification using Au and PdO. Solo Au modification will not change the OWT obviously (300 °C for Au2-In2O3), while solo PdO modification (Pd2-In2O3) will lower the OWT from 300 °C to 150 °C (Figure 6a). This indicates that the catalytic effect of PdO is much better than that of Au. The OWT after co-modification using Au and PdO is 180 °C. The intermediate OWT between 300 °C and 150 °C indicates the synergistic effect of Au and PdO. Furthermore, we speculate that Au might have higher adsorption ability than PdO to CO gas [43], which might be verified by the higher Oc content (35.2%) of Au2-In2O3 than that (33.6%) of Pd2-In2O3 as shown in Table 2, indicating that Au loading might adsorb more CO gas than Pd modification. However, a high OWT (300 °C) is necessary for solo Au modification to ensure the full reaction between CO gas and adsorbed oxygen due to the low catalytic effect of Au. After PdO modification, the gas response can be significantly increased though fully utilizing the adsorption ability of Au and catalytic effect of PdO with relatively lower OWT. Therefore, both the selectivity and gas response to CO gas can be greatly imporved. In addition, the synergistic effect can be also illustrated by the peak shift of Au 4f7/2 and Au 4f5/2 from 83.43 eV and 87.08 eV (Au2-In2O3, not shown here) to 83.18 eV and 86.88 eV (Au2Pd2-In2O3) as shown in Figure 5d, indicating greater electron transportation to the Au cluster after PdO doping. It is obvious that co-modification using suitable amounts of Au and PdO (Au2Pd2-In2O3) optimizes the electronic sensitization and chemical sensitization, reduces the activation energy of the reaction, greatly improves the detection limit of CO, and enhances the sensitivity of the material to CO gas.

4. Conclusions

In this work, the co-modifying effects of Au and PdO on In2O3 nanofibers are systematically investigated for the enhancement of CO detection compared with pure In2O3 and individual Au and PdO doping. The experimental results indicate that a suitable modifying amount of Au and PdO (Au2Pd2-In2O3) can not only increase the gas response, but can also lower the detection limit down to 200 ppb with a response value of 1.23 and OWT of 180 °C. The enhancement of the gas response to CO can be attributed to the electronic sensitization due to the formation of p–n heterojunctions between PdO and In2O3, Schottky contact between Au and In2O3, the chemical sensitization of PdO verified by lower OWT and higher Oc contents, and the synergistic effect of Au and PdO caused by the high adsorption ability of Au and excellent catalytic effect of PdO. The response to 100 ppm CO for the Au2Pd2-In2O3 sensor is about 8.5 times higher than that for the pure In2O3 sensor. The synergistic effect of Au and PdO also improves the selectivity to CO in different gases, especially the selectivity of CO against H2. Co-modification using Au and PdO might be a promising strategy for the enhancement of gas-sensing performance for CO detection.

Author Contributions

Conceptualization, W.H. and Y.S.; methodology, G.L.; software, L.G.; validation, B.J., J.Y. and X.W.; formal analysis, C.W.; investigation, W.H.; resources, P.S.; data curation, W.H.; writing—original draft preparation, W.H.; writing—review and editing, Y.S.; visualization, W.H.; supervision, F.L.; project administration, Y.S.; funding acquisition, G.L. All authors have read and agreed to the published version of the manuscript.

Funding

This work is supported by the National Key Research and Development Program of China (No. 2021YFB3201300), the National Nature Science Foundation of China (Nos. 61573164, 61520106003, 61327804, 61831011, 61833006), and the National High-Tech Research and Development Program of China (863 Program, No. 2014AA06A505).

Data Availability Statement

The data that support the findings of this study are available from the corresponding author upon reasonable request.

Conflicts of Interest

The authors declare that they have no known competing financial interests or personal relationships that could have appeared to influence the work reported in this paper.

References

  1. Sircar, K.; Clower, J.; Shin, M.K.; Bailey, C.; King, M.; Yip, F. Carbon monoxide poisoning deaths in the United States, 1999 to 2012. Am. J. Emerg. Med. 2015, 33, 1140–1145. [Google Scholar] [CrossRef] [PubMed]
  2. Rose, J.J.; Wang, L.; Xu, Q.Z.; McTiernan, C.F.; Shiva, S.; Tejero, J.; Gladwin, M.T. Carbon Monoxide Poisoning: Pathogenesis, Management, and Future Directions of Therapy. Am. J. Respir. Crit. Care Med. 2017, 195, 596–606. [Google Scholar] [CrossRef]
  3. Heo, J.; Koung, I.; Park, Y.; Im, Y.; Lee, J. Efficient control research in CO PROX reaction. In Proceedings of the 15th International Conference on Control, Automation and Systems (ICCAS), Busan, Korea, 13–16 October 2015; pp. 261–263. [Google Scholar]
  4. Tofighi, G.; Degler, D.; Junker, B.; Muller, S.; Lichtenberg, H.; Wang, W.; Weimar, U.; Barsan, N.; Grunwaldt, J.-D. Microfluidically synthesized Au, Pd and AuPd nanoparticles supported on SnO2 for gas sensing applications. Sens. Actuators B Chem. 2019, 292, 48–56. [Google Scholar] [CrossRef]
  5. Hsu, K.C.; Fang, T.H.; Tang, I.T.; Hsiao, Y.J.; Chen, C.Y. Mechanism and characteristics of Au-functionalized SnO2/In2O3 nanofibers for highly sensitive CO detection. J. Alloys Compd. 2020, 822, 153475. [Google Scholar] [CrossRef]
  6. Arunkumar, S.; Hou, T.F.; Kim, Y.B.; Choi, B.; Park, S.H.; Jung, S.; Lee, D.W. Au Decorated ZnO hierarchical architectures: Facile synthesis, tunable morphology and enhanced CO detection at room temperature. Sens. Actuators B Chem. 2017, 243, 990–1001. [Google Scholar] [CrossRef]
  7. Hiroyuki, Y.; Teruyuki, J.; Jun, T.; Koji, M.; Norio, M.; Noboru, Y. Indium oxide-based gas sensor for selective detection of CO. Sens. Actuators B Chem. 1996, 35, 325–332. [Google Scholar]
  8. Yin, X.T.; Guo, X.M. Sensitivity and selectivity of (Au, Pt, Pd)-loaded and (In, Fe)-doped SnO2 sensors for H2 and CO detection. J. Mater. Sci. -Mater. Electron. 2014, 25, 4960–4966. [Google Scholar] [CrossRef]
  9. Hung, N.L.; Kim, H.; Hong, S.K.; Kim, D. Enhancement of CO gas sensing properties in ZnO thin films deposited on self-assembled Au nanodots. Sens. Actuators B Chem. 2010, 151, 127–132. [Google Scholar] [CrossRef]
  10. Wang, P.J.; Yuan, T.B.; Yuan, H.F.; Zheng, X.Y.; Ijaz, H.; Hui, J.F.; Fan, D.; Zhao, Y.; Hu, S. PdO/SnO2 heterostructure for low-temperature detection of CO with fast response and recovery. Rsc Adv. 2019, 9, 22875–22882. [Google Scholar] [CrossRef]
  11. Luo, N.; Zhang, B.; Zhang, D.; Xu, J.Q. Enhanced CO sensing properties of Pd modified ZnO porous nanosheets. Chin. Chem. Lett. 2020, 31, 2033–2036. [Google Scholar] [CrossRef]
  12. Zhou, Y.; Wang, Z.Y.; Liu, C.J. Perspective on CO oxidation over Pd-based catalysts. Catal. Sci. Technol. 2015, 5, 69–81. [Google Scholar] [CrossRef]
  13. Peterson, E.J.; Delariva, A.T.; Lin, S.; Johnson, R.S.; Guo, H.; Miller, J.T.; Kwak, J.H.; Peden, C.H.F.; Kiefer, B.; Allard, L.F.; et al. Low-temperature carbon monoxide oxidation catalysed by regenerable atomically dispersed palladium on alumina. Nat. Commun. 2014, 5, 4885. [Google Scholar] [CrossRef] [PubMed]
  14. Guo, J.Y.; Zhang, D.Z.; Li, T.T.; Zhang, J.H.; Yu, L.D. Green light-driven acetone gas sensor based on electrospinned CdS nanospheres/Co3O4 nanofibers hybrid for the detection of exhaled diabetes biomarker. J. Colloid Interface Sci. 2022, 606, 261–271. [Google Scholar] [CrossRef] [PubMed]
  15. Yang, J.; Han, W.; Jiang, B.; Wang, X.; Sun, Y.; Wang, W.; Lou, R.; Ci, H.; Zhang, H.; Lu, G. Electrospinning Derived NiO/NiFe2O4 Fiber-in-Tube Composite for Fast Triethylamine Detection under Different Humidity. ACS Sensors. 2022, 7, 995–1007. [Google Scholar] [CrossRef] [PubMed]
  16. Wang, X.; Lu, J.Y.; Han, W.J.; Cheng, P.F.; Wang, Y.L.; Sun, J.B.; Ma, J.; Sun, P.; Zhang, H.; Sun, Y.; et al. Carbon modification endows WO3 with anti-humidity property and long-term stability for ultrafast H2S detection. Sens. Actuators B Chem. 2022, 350, 130884. [Google Scholar] [CrossRef]
  17. Yang, M.; Lu, J.Y.; Wang, X.; Zhang, H.; Chen, F.; Sun, J.B.; Yang, J.; Sun, Y.; Lu, G. Acetone sensors with high stability to humidity changes based on Ru-doped NiO flower-like microspheres. Sens. Actuators B Chem. 2020, 313, 127965. [Google Scholar] [CrossRef]
  18. Wang, H.T.; Li, Y.Y.; Wang, C.C.; Li, Y.; Bai, J.H.; Liu, Y.Y.; Zhou, L.; Liu, F.; Shimanoe, K.; Lu, G. N-pentanol sensor based on ZnO nanorods functionalized with Au catalysts. Sens. Actuators B Chem. 2021, 339, 129888. [Google Scholar] [CrossRef]
  19. Yang, T.H.; Huang, L.D.; Harn, Y.W.; Lin, C.C.; Chang, J.K.; Wu, C.I.; Wu, J.-M. High Density Unaggregated Au Nanoparticles on ZnO Nanorod Arrays Function as Efficient and Recyclable Photocatalysts for Environmental Purification. Small 2013, 9, 3169–3182. [Google Scholar] [CrossRef]
  20. Rai, P.; Yoon, J.W.; Kwak, C.H.; Lee, J.H. Role of Pd nanoparticles in gas sensing behaviour of Pd@In2O3 yolk-shell nanoreactors. J. Mater. Chem. A 2016, 4, 264–269. [Google Scholar] [CrossRef]
  21. Wang, C.; Zhang, Y.; Sun, X.; Sun, Y.; Liu, F.; Yan, X.; Wang, C.; Sun, P.; Lu, G. Preparation of Pd/PdO loaded WO3 microspheres for H2S detection. Sens. Actuators B Chem. 2020, 321, 128629. [Google Scholar] [CrossRef]
  22. Guo, L.; Wang, Y.; Shang, Y.; Yang, X.; Zhang, S.; Wang, G.; Wang, Y.; Zhang, B.; Zhang, Z. Preparation of Pd/PdO@ ZnO-ZnO nanorods by using metal organic framework templated catalysts for selective detection of triethylamine. Sens. Actuators B Chem. 2022, 350, 130840. [Google Scholar] [CrossRef]
  23. Han, B.Q.; Wang, H.R.; Yang, W.Y.; Wang, J.H.; Wei, X.Y. Hierarchical Pt-decorated In2O3 microspheres with highly enhanced isoprene sensing properties. Ceram. Int. 2021, 47, 9477–9485. [Google Scholar] [CrossRef]
  24. Wan, K.C.; Wang, D.; Wang, F.; Li, H.J.; Xu, J.C.; Wang, X.Y.; Yang, J. Hierarchical In2O3@SnO2 Core-Shell Nanofiber for High Efficiency Formaldehyde Detection. ACS Appl. Mater. Interfaces 2019, 11, 45214–45225. [Google Scholar] [CrossRef]
  25. Choi, S.W.; Katoch, A.; Sun, G.J.; Kim, S.S. Bimetallic Pd/Pt nanoparticle-functionalized SnO2 nanowires for fast response and recovery to NO2. Sens. Actuators B Chem. 2013, 181, 446–453. [Google Scholar] [CrossRef]
  26. Wang, X.; Han, W.J.; Yang, J.Q.; Cheng, P.F.; Wang, Y.L.; Feng, C.H.; Wang, C.; Zhang, H.; Sun, Y.; Lu, G. Conductometric ppb-level triethylamine sensor based on macroporous WO3-W18O49 heterostructures functionalized with carbon layers and PdO nanoparticles. Sens. Actuators B Chem. 2022, 361, 131707. [Google Scholar] [CrossRef]
  27. Lai, H.Y.; Chen, C.H. Highly sensitive room-temperature CO gas sensors: Pt and Pd nanoparticle-decorated In2O3 flower-like nanobundles. J. Mater. Chem. 2012, 22, 13204–13208. [Google Scholar] [CrossRef]
  28. Yin, X.T.; Guo, X.M. Selectivity and sensitivity of Pd-loaded and Fe-doped SnO2 sensor for CO detection. Sens. Actuators B Chem. 2014, 200, 213–218. [Google Scholar] [CrossRef]
  29. Chen, K.W.; Liu, J.P.; Hsu, Y.S.; Liu, C.H.; Pai, Y.H.; Chen, C.H. Controlled synthesis of Pt and Co3O4 dual-functionalized In2O3 nanoassemblies for room temperature detection of carbon monoxide. New J. Chem. 2018, 42, 16478–16482. [Google Scholar] [CrossRef]
  30. Jeong, S.Y.; Moon, Y.K.; Kim, J.K.; Park, S.W.; Jo, Y.K.; Kang, Y.C.; Lee, J.H. A General Solution to Mitigate Water Poisoning of Oxide Chemiresistors: Bilayer Sensors with Tb4O7 Overlayer. Adv. Funct. Mater. 2021, 31, 2007895. [Google Scholar] [CrossRef]
  31. Chen, Q.; Wang, Y.H.; Wang, M.X.; Ma, S.Y.; Wang, P.Y.; Zhang, G.H.; Chen, W.; Jiao, H.; Liu, L.; Xu, X. Enhanced acetone sensor based on Au functionalized In-doped ZnSnO3 nanofibers synthesized by electrospinning method. J. Colloid Interface Sci. 2019, 543, 285–299. [Google Scholar] [CrossRef]
  32. Wang, X.; Lu, J.Y.; Han, W.J.; Yang, J.Q.; Jiang, B.; Sun, Y.F.; Zhang, H.; Lu, G. Co-PBA MOF-derived hierarchical hollow Co3O4@NiO microcubes functionalized with Pt for superior H2S sensing. Sens. Actuators B Chem. 2021, 342, 130028. [Google Scholar] [CrossRef]
  33. Wang, Y.; Meng, X.N.; Cao, J.L. Rapid detection of low concentration CO using Pt-loaded ZnO nanosheets. J. Hazard. Mater. 2020, 381, 120944. [Google Scholar] [CrossRef] [PubMed]
  34. Sakai, Y.; Kadosaki, M.; Matsubara, I.; Itoh, T. Preparation of total VOC sensor with sensor-response stability for humidity by noble metal addition to SnO2. J. Ceram. Soc. Jpn. 2009, 117, 1297–1301. [Google Scholar] [CrossRef]
  35. Dong, X.W.; Qin, L.P.; Xu, J.Q.; Pan, Q.Y.; Cheng, Z.X.; Qun, X. Gas sensing properties of Au modified SnO2 micron rods. Curr. Nanosci. 2008, 4, 236–239. [Google Scholar]
  36. Feng, C.; Li, X.; Ma, J.; Sun, Y.; Wang, C.; Sun, P.; Zheng, J.; Lu, G. Facile synthesis and gas sensing properties of In2O3-WO3 heterojunction nanofibers. Sens. Actuators B Chem. 2015, 209, 622–629. [Google Scholar] [CrossRef]
  37. Li, F.; Zhang, T.; Gao, X.; Wang, R.; Li, B.H. Coaxial electrospinning heterojunction SnO2/Au-doped In2O3 core-shell nanofibers for acetone gas sensor. Sens. Actuators B Chem. 2017, 252, 822–830. [Google Scholar] [CrossRef]
  38. Hu, Q.; Huang, B.Y.; Li, Y.; Zhang, S.M.; Zhang, Y.X.; Hua, X.H.; Liu, G.; Li, B.; Zhou, J.; Xie, E.; et al. Methanol gas detection of electrospun CeO2 nanofibers by regulating Ce3+/Ce4+ mole ratio via Pd doping. Sens. Actuators B Chem. 2020, 307, 127638. [Google Scholar] [CrossRef]
  39. Motsoeneng, R.G.; Kortidis, I.; Rikhotso, R.; Swart, H.C.; Ray, S.S.; Motaung, D.E. Temperature-dependent response to C3H7OH and C2H5OH vapors induced by deposition of Au nanoparticles on SnO2/NiO hollow sphere-based conductometric sensors. Sens. Actuators B Chem. 2020, 316, 128041. [Google Scholar] [CrossRef]
  40. Liu, J.J.; Zhang, L.Y.; Fan, J.J.; Yu, J.G. Semiconductor Gas Sensor for Triethylamine Detection. Small 2022, 18, 2104984. [Google Scholar] [CrossRef]
  41. Chinh, N.D.; Haneul, Y.; Hieu, N.M.; Hung, N.M.; Quang, N.D.; Kim, C.; Kim, D. pn-Heterojunction of the SWCNT/ZnO nanocomposite for temperature dependent reaction with hydrogen. J. Colloid Interface Sci. 2021, 584, 582–591. [Google Scholar] [CrossRef]
  42. Wang, X.; Chen, F.; Yang, M.; Guo, L.L.; Xie, N.; Kou, X.Y.; Song, Y.; Wang, Q.; Sun, Y.; Lu, G. Dispersed WO3 nanoparticles with porous nanostructure for ultrafast toluene sensing. Sens. Actuators B Chem. 2019, 289, 195–206. [Google Scholar] [CrossRef]
  43. Kim, J.H.; Mirzaei, A.; Kim, H.W.; Kim, S.S. Flexible and low power CO gas sensor with Au-functionalized 2D WS2 nanoflakes. Sens. Actuators B Chem. 2020, 313, 128040. [Google Scholar] [CrossRef]
Figure 1. (a) Actual image of a hexapod ceramic tube gas sensor; (b) Illustration of ceramic tube Au electrode.
Nanomaterials 12 03267 g001
Figure 2. (a) XRD patterns and (b) high resolution of (440) peak of all the obtained samples.
Nanomaterials 12 03267 g002
Figure 3. SEM images of (a,b) pure In2O3; (c,d) Au2-In2O3; (e,f) Pd2-In2O3; (g,h) Au1Pd1-In2O3; (i,j) Au2Pd2-In2O3; (k,l) Au4Pd4-In2O3 nanofibers.
Nanomaterials 12 03267 g003
Figure 4. (a,b) TEM of pure In2O3 and Au2Pd2-In2O3; (c) SAED pattern of Au2Pd2-In2O3; (d,e) HRTEM of pure In2O3 and Au2Pd2-In2O3; (fj) elemental mapping images of Au2Pd2-In2O3.
Nanomaterials 12 03267 g004
Figure 5. (a) XPS survey scan; high-resolution XPS spectra of (b) In 3d of pure and Au2Pd2-In2O3; (c) Au 4f Pd 3d of (d) pure and (e) Au2Pd2-In2O3; (fi) O 1s XPS spectra of pure, Au2-In2O3, Pd2-In2O3, Au2Pd2-In2O3.
Nanomaterials 12 03267 g005
Figure 6. (a) Response values to 100 ppm CO gas; (b) baseline resistance values in air of nanofiber gas sensors based on six samples at different operating temperatures.
Nanomaterials 12 03267 g006
Figure 7. The sensor dynamic response curves of (a) pure In2O3 and (c) Au2Pd2-In2O3 samples; the corresponding response values of (b) pure In2O3 and (d) Au2Pd2-In2O3 samples at different concentrations of CO at 180 °C.
Nanomaterials 12 03267 g007
Figure 8. Gas responses of gas sensors based on six samples to various 100 ppm gases at 180 °C.
Nanomaterials 12 03267 g008
Figure 9. Dynamic response transients of sensors based on (a) Au2Pd2-In2O3 nanofibers and (b) pure In2O3 nanofibers to 100 ppm CO at 180 °C; (c) six dynamic cycling response curves and (d) one-week response and baseline resistance values of Au2Pd2-In2O3 sensor at 180 °C to 100 ppm CO.
Nanomaterials 12 03267 g009
Figure 10. (a) The dynamic response curves and (b) the corresponding response and resistance relations of the sensors based on Au2Pd2-In2O3 nanofibers under different humidity conditions (35%, 55%, 75%, 98%) at the operating temperature of 200 °C.
Nanomaterials 12 03267 g010
Figure 11. (a,b) energy-band diagrams of In2O3 before and after contact with Au and PdO; the schematic illustration of the sensing mechanism for (c,d) pure In2O3 and (e,f) Au2Pd2-In2O3 nanofibers to CO.
Nanomaterials 12 03267 g011
Table 1. Grain size of all samples.
SampleIn2O3Au2-In2O3Pd2-In2O3Au1Pd1-In2O3Au2Pd2-In2O3Au4Pd4-In2O3
grain sizes (nm)16.215.912.013.810.410.2
Table 2. Percentages of three different O 1s components in the four samples.
SampleLattice Oxygen OL (%)Defect Oxygen OD (%)Chemisorbed Oxygen OC (%)Sum of OD and OC (%)
Pure In2O353.517.229.346.5
Au2-In2O344.620.235.255.4
Pd2-In2O347.219.233.652.8
Au2Pd2-In2O342.121.236.757.9
Table 3. Comparison of different gas sensors for detecting CO.
MaterialsMorphologyT/°C and RH (%)Conc.
(ppm)
ResponseLOD (ppm)Res./Rec. Time (s)Ref.
AuPd/SnO2Nanoparticles300 and 50506 a50-/-[4]
Au/SnO2/In2O3Nanofibers200 and -5029 b1080/400[5]
Au/ZnONanostars35 and dry5015 a508/15[6]
Pd/In2O3NanobundlesRT10012 c5050/60[27]
Pd/Fe/SnO2Nanoparticles350 and -200022 a200-/50[28]
Pt/Co3O4/In2O3Nano-branchesRT100~14 c5~120/~20[29]
Au/PdO/In2O3Nanofibers180 and 3010021.7 a0.25/106This work
T and RH represents working temperature and humidity; conc. represents gas concentration; a: (Ra/Rg), b: ([Ra−Rg]/Ra, %), c: (Ig/Ia); LOD represents low limit of detection; Res./Rec. time represents response/recovery time and Ref. represents reference.
Publisher’s Note: MDPI stays neutral with regard to jurisdictional claims in published maps and institutional affiliations.

