Article

Microwave Synthesized 2D WO3 Nanosheets for VOCs Gas Sensors

1
School of Chemistry and Chemical Engineering, Henan Institute of Science and Technology, Xinxiang 453003, China
2
Shanghai Yaolu Instrument & Equipment Co., Ltd., Shanghai 200444, China
3
NEST Lab, Department of Physics, Department of Chemistry, College of Sciences, Shanghai University, Shanghai 200444, China
*
Author to whom correspondence should be addressed.
Nanomaterials 2022, 12(18), 3211; https://doi.org/10.3390/nano12183211
Submission received: 18 August 2022 / Revised: 10 September 2022 / Accepted: 13 September 2022 / Published: 15 September 2022
(This article belongs to the Special Issue Advanced Nanomaterials and Nanodevices for VOCs Gas Sensor)

Abstract

:
As an n-type semiconductor material, tungsten oxide (WO3) has good application prospects in the field of gas sensing. Herein, using oxalic acid (OA), citric acid (CA) and tartaric acid (TA) as auxiliary agents, three homogeneous tungsten oxide nanosheets were prepared by the rapid microwave-assisted hydrothermal method. The potential exhaled gases of various diseases were screened for the gas sensitivity test. Compared with WO3-OA and WO3-TA, WO3-CA exhibits significant sensitivity to formaldehyde, acetone and various alkanes. Photoluminescence (PL) chromatography and photoelectric properties show that its excellent gas sensitivity is due to its abundant oxygen vacancies and high surface charge migration rate, which can provide more preferential reaction sites with gas molecules. The experiment is of great significance for the sensor selection of the large disease exhaled gas sensor array.

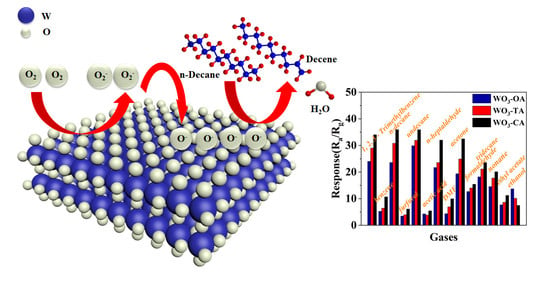
Graphical Abstract

1. Introduction

The detection and identification of organic pollutants are receiving large amounts of attention. Some volatile organic compounds (VOCs) are the target gases of pollution [1], and even the exhaled gas of cancer patients also contains some VOCs components [2], of which ketones, aldehydes and alkanes are the most common. VOCs have been used as biomarkers of some diseases or cancers, and they have been applied in the diagnosis and treatment of lung cancer, liver disease, breast cancer, gastric cancer, asthma, heart disease, diabetes and other diseases [3,4,5,6,7,8]. For example, acetone can diagnose diabetes when the exhaled gas concentration is higher than that of the standard value of healthy people [4]. Thirteen components such as nonane and undecane in exhaled gas have been identified as biomarkers of breast cancer [5]. Furfural, 1,2,3-trimethylbenzene and other gases have been found in the exhaled gas of gastric cancer patients [6]. Hua et al. [7] found that some volatile organic compounds in exhaled gas may screen for lung cancer, especially alkanes and aldehydes, including decane, undecane, n-heptaldehyde, etc. Modern analytical techniques such as gas chromatography-mass spectrometry (GC-MS), proton transfer reaction mass spectrometry (PTR-MS) and other methods can be used for gas analysis and determination [8]. However, the bionic electronic nose sensing technology based on nano-semiconductor materials has the advantage of overall determination, which can realize the overall identification of a variety of biomarkers in exhaled gas. It can avoid the failure to detect the content of a biomarker due to the low sensitivity of a single sensitive element, so it is more suitable to use the overall detection of exhaled gas to realize the rapid screening of diseases, and it has good promise in the rapid screening of diseases.
WO3 has been extensively studied for its good stability, suitable band gap and non-toxic properties [9]. Researchers have synthesized WO3 with different morphologies, including nanosheets [10,11,12,13,14], nanorods [15,16], nanotubes [17,18], nanowires [19] and hollow microspheres [20,21], among which the performance of two-dimensional (2D) structures is often superior to that of 1D and 3D structures. Two-dimensional (2D) nanosheets are stacked into mesoporous structures, which is conducive to the diffusion of gas molecules. Although there are numerous reports about the hydrothermal synthesis of WO3, the ordinary hydrothermal method has a long heating cycle, and it often takes several hours to synthesize WO3. The microwave-assisted hydrothermal synthesis method can improve the preparation process and make the particle size uniform. It is faster than the traditional method and has broad application prospects. Mehta et al. [22] provided a rapid and efficient microwave preparation method to obtain WO3 with layered structures for acetone sensing devices. Cavalcante et al. [23] heat-treated SrMoO4 powder with microwave water at 140 °C and observed PL at different time chamber temperatures, which were related to the strength and surface defects. Liquid phase microwave heating can improve the photocatalytic activity of WO3 [24,25]. Therefore, microwave-assisted synthesis also has the potential to improve the properties of functional materials [22]. Surface defects in oxide semiconductors can significantly accelerate surface reactions, facilitate charge separation, and adjust band structures to improve surface properties such as catalysis, adsorption, and gas sensing [26]. Typically, 2D nanosheet structures facilitate electron separation due to defects in oxygen vacancies on the surface [27]. For example, Ma et al. [28] proposed that increasing oxygen vacancies could increase oxygen absorption and reduce the activation energy of WO3. Tong et al. [29] prepared a high-performance gas sensor by using p-type copper ferrate CuCrO2 with enhanced oxygen vacancy defects.
In this paper, within 30 min, WO3 nanosheets were prepared by microwave-assisted hydrothermal synthesis with OA, CA and TA as carboxylic acid auxiliary agents. According to PL, the electrochemical impedance spectroscopy (EIS) and transient photocurrent phenomena, WO3-CA has higher sensitivity and response–recovery performance in gas sensing tests compared to WO3-TA and WO3-OA due to the role of surface oxygen vacancies and high surface charge migration rate. More than a dozen volatile organic compounds were tested to explore the gas sensitivity and application prospects of synthetic materials for exhaled gas biomarkers of serious diseases. Compared with WO3-OA and WO3-TA, WO3-CA nanosheets shows good gas sensitivity to formaldehyde, acetone and alkanes and other VOCs.

2. Materials and Methods

2.1. Materials

A reagent grade sodium tungstate dihydrate (Na2WO4·2H2O, 99.5%), citric acid (C6H8O7·H2O, 99.5%), oxalic acid (C2H2O4·2H2O, 99.5%), tartaric acid (C4H6O6, 95%, Shanghai Macklin Biochemical Co., Ltd., Shanghai, China), hydrochloric acid (HCl, 37%, Da Mao Chemical Reagent Factory, Tianjin, China) and ethanol (C2H5OH, 99.5%) were used directly without further purification. All reagents except those indicated are from Sinopharm Chemical Reagent Co., Ltd., (Shanghai, China).

2.2. Synthesis

The sodium tungstate dihydrate (Na2WO4·2H2O) and OA with a molar ratio of 2:1 were dissolved in 40 mL of distilled water. After stirring for 20 min at room temperature, 2.5 mL of hydrochloric acid was added, which was followed by further stirring for another 10 min. The solution was transferred to a 100 mL Teflon-lined reactor and heated by microwave at 200 °C for 30 min. Finally, the sample was washed with deionized water and ethanol and dried at 80 °C for 12 h. The sample was recorded as WO3-OA. Na2WO4·2H2O/CA and Na2WO4·2H2O/TA with the molar ratio of 1:1 were dissolved in 30 mL of distilled water, respectively. The other synthesis steps were the same as above, and these two samples were denoted as WO3-CA and WO3-TA, respectively.

2.3. Characterization

The crystal structure was investigated by X-ray diffraction (XRD, DX-2700B, Hao Yuan Instrument, Dandong, China). The morphological features of the obtained WO3 nanoarchitectures were investigated by field emission scanning electron microscope (FESEM, Regulus 8220, Hitachi, Tokyo, Japan) and field emission transmission electron microscope (FETEM, FEI Tecnai G2 f20, FEI company, Hillsboro, OR, USA). Nitrogen (N2) adsorption–desorption was conducted through Specific surface and pore structure analyzer (3H-2000PS2, BSD instrument, Beijing, China). Brunauer–Emmett–Teller (BET) schemes were used to calculate the specific surface area. The selected batches were degassed under vacuum at 150 °C for 6 h prior to BET analysis. The absorption spectra were analyzed with a double beam UV–vis spectrophotometer (UV, TU-1901, Beijing General Analytical Instrument, Beijing, China). UV–vis DRS spectra were recorded with BaSO4 as a reference chemical. The gas sensitivity characteristics of sensitive materials to target gas were tested by the CGS-8 intelligent gas sensitivity analysis system. X-ray photoelectron spectroscopy (XPS) measurements were conducted on a Thermo Fisher Scientific spectrometer (XPS, ESCALAB250Xi, Thermo Scientific K-Alpha, Waltham, MA, USA) employing Al K Alpha radiation. PL spectra were recorded with an Agilent Cary Eclipse fluorescence spectrophotometer (Agilent Technologies, Santa Clara, CA, USA).

2.4. Gas Sensing Measurement

Firstly, an appropriate amount of organic support (terpineol, ethyl cellulose) was added in 5 mg of WO3 powder to form a uniform slurry and then coated on the ceramic electrode. We heated it at 500 °C for 2 h to remove moisture and organic carrier and put it into an AS-20 aging system at 125 mA for 24 h. For the gas sensitivity test, a 500 mL gas chamber was used for static air distribution. When the resistance (Ra) of the sensor material in air was basically stable, the target gas was introduced into the gas chamber with a micro sampler. When the baseline was stabilized again, the stability value was Rg. The resistance response value is expressed as Ra/Rg.

3. Results and Discussion

3.1. Structure Analysis

The XRD pattern exhibits the characteristic peak of monoclinic WO3 (JCPDS No.83-0950). Figure 1a shows that the addition of different auxiliary agents changed the relative intensity of the (002), (020), and (200) crystal planes, reflecting the change of sample morphology. The highest peak diffraction intensity in WO3-TA and WO3-OA was corresponding to the (002) and (200) crystal planes, respectively, which is consistent with the HRTEM results in Figure 2. The main exposed crystal planes of WO3 are crystal plane (002) and crystal plane (200), respectively. To further explore the relative content of the three main peaks, the respective peak areas of the (002), (020) and (200) planes were calculated by integrating the peak areas of XRD patterns (Figure S1 Supplementary Materials), and then, we calculated the percentage of the three crystal planes. The proportions of the (002) peak area of WO3-OA, WO3-TA and WO3-CA are 33.54%, 32.03% and 34.05%, respectively, and the proportions of (200) peak area are 34.46%, 35.18% and 33.86%, respectively. The results indicate that WO3-CA has a high (002) crystal surface content. The other two samples have the highest content of the crystal plane (200). XPS was used to analyze the valence states and chemical structures of elements. The full XPS spectrum of WO3 is illustrated in Figure 1b, and the S orbital and P orbital of the W atom suggest the characteristic features of W6+. The O 1s spectrum is fitted into two peaks (Figure 1c). The fitted peak at 530.2 eV is attributed to the W-O bond in WO3, and the peak at 531.8 eV is attributed to the hydroxide on its surface [30]. The W spectrum shows loss features at 41.06 eV, 41.42 eV and 41.07 eV, respectively (Figure 1d). The locations of WO3-OA, WO3-TA and WO3-CA are 37.7 eV and 35.5 eV, 37.8 eV and 35.6 eV, and 37.7 eV and 35.6 eV, respectively, both corresponding to orbital peaks of W6+ 4f5/2 and W6+ 4f7/2. All W 4f and O 1s regions are consistent with the reported XPS spectra of tungsten trioxide, indicating only W6+ is present in the synthesized WO3. Figure 1e and f show the UV-visible diffuse reflectance spectra and the optical band gap of three samples. The Eg of OA, TA and CA is 2.53 eV, 2.49 eV and 2.57 eV at 400 nm, respectively. The difference between OA, TA and CA is 0.04 eV, which can be explained by the nano-size effect and impurity level transition caused by the crystal plane distortion and lattice defect [31].

3.2. Morphology Analysis

SEM images show that WO3-OA is a mostly irregular stacked sheet structure with a length of 150–300 nm and a thickness of about 25–30 nm. WO3-TA samples are about 80–200 nm in length and 50 nm in width, which are rectangular nanosheets with a thickness of 30–40 nm (Figure S2, Supplementary Materials). The morphology and size of WO3-CA are similar to WO3-OA, but the thickness is larger, about 40–45 nm. The crystal plane spacing of WO3-OA and WO3-TA is 0.384 nm, corresponding to the (002) crystal plane, while the (200) crystal plane spacing of WO3-CA is 0.365 nm. WO3-CA lattice stripes clearly show (200) crystal planes, which is consistent with XRD results. Otherwise, lamellar WO3 could not be obtained without an adjuvant. (Figure S2, Supplementary Materials). The three organic acids act as auxiliary agents and favor for the formation of the WO3 flake.

3.3. Gas Sensing Performance and Photoelectric Property

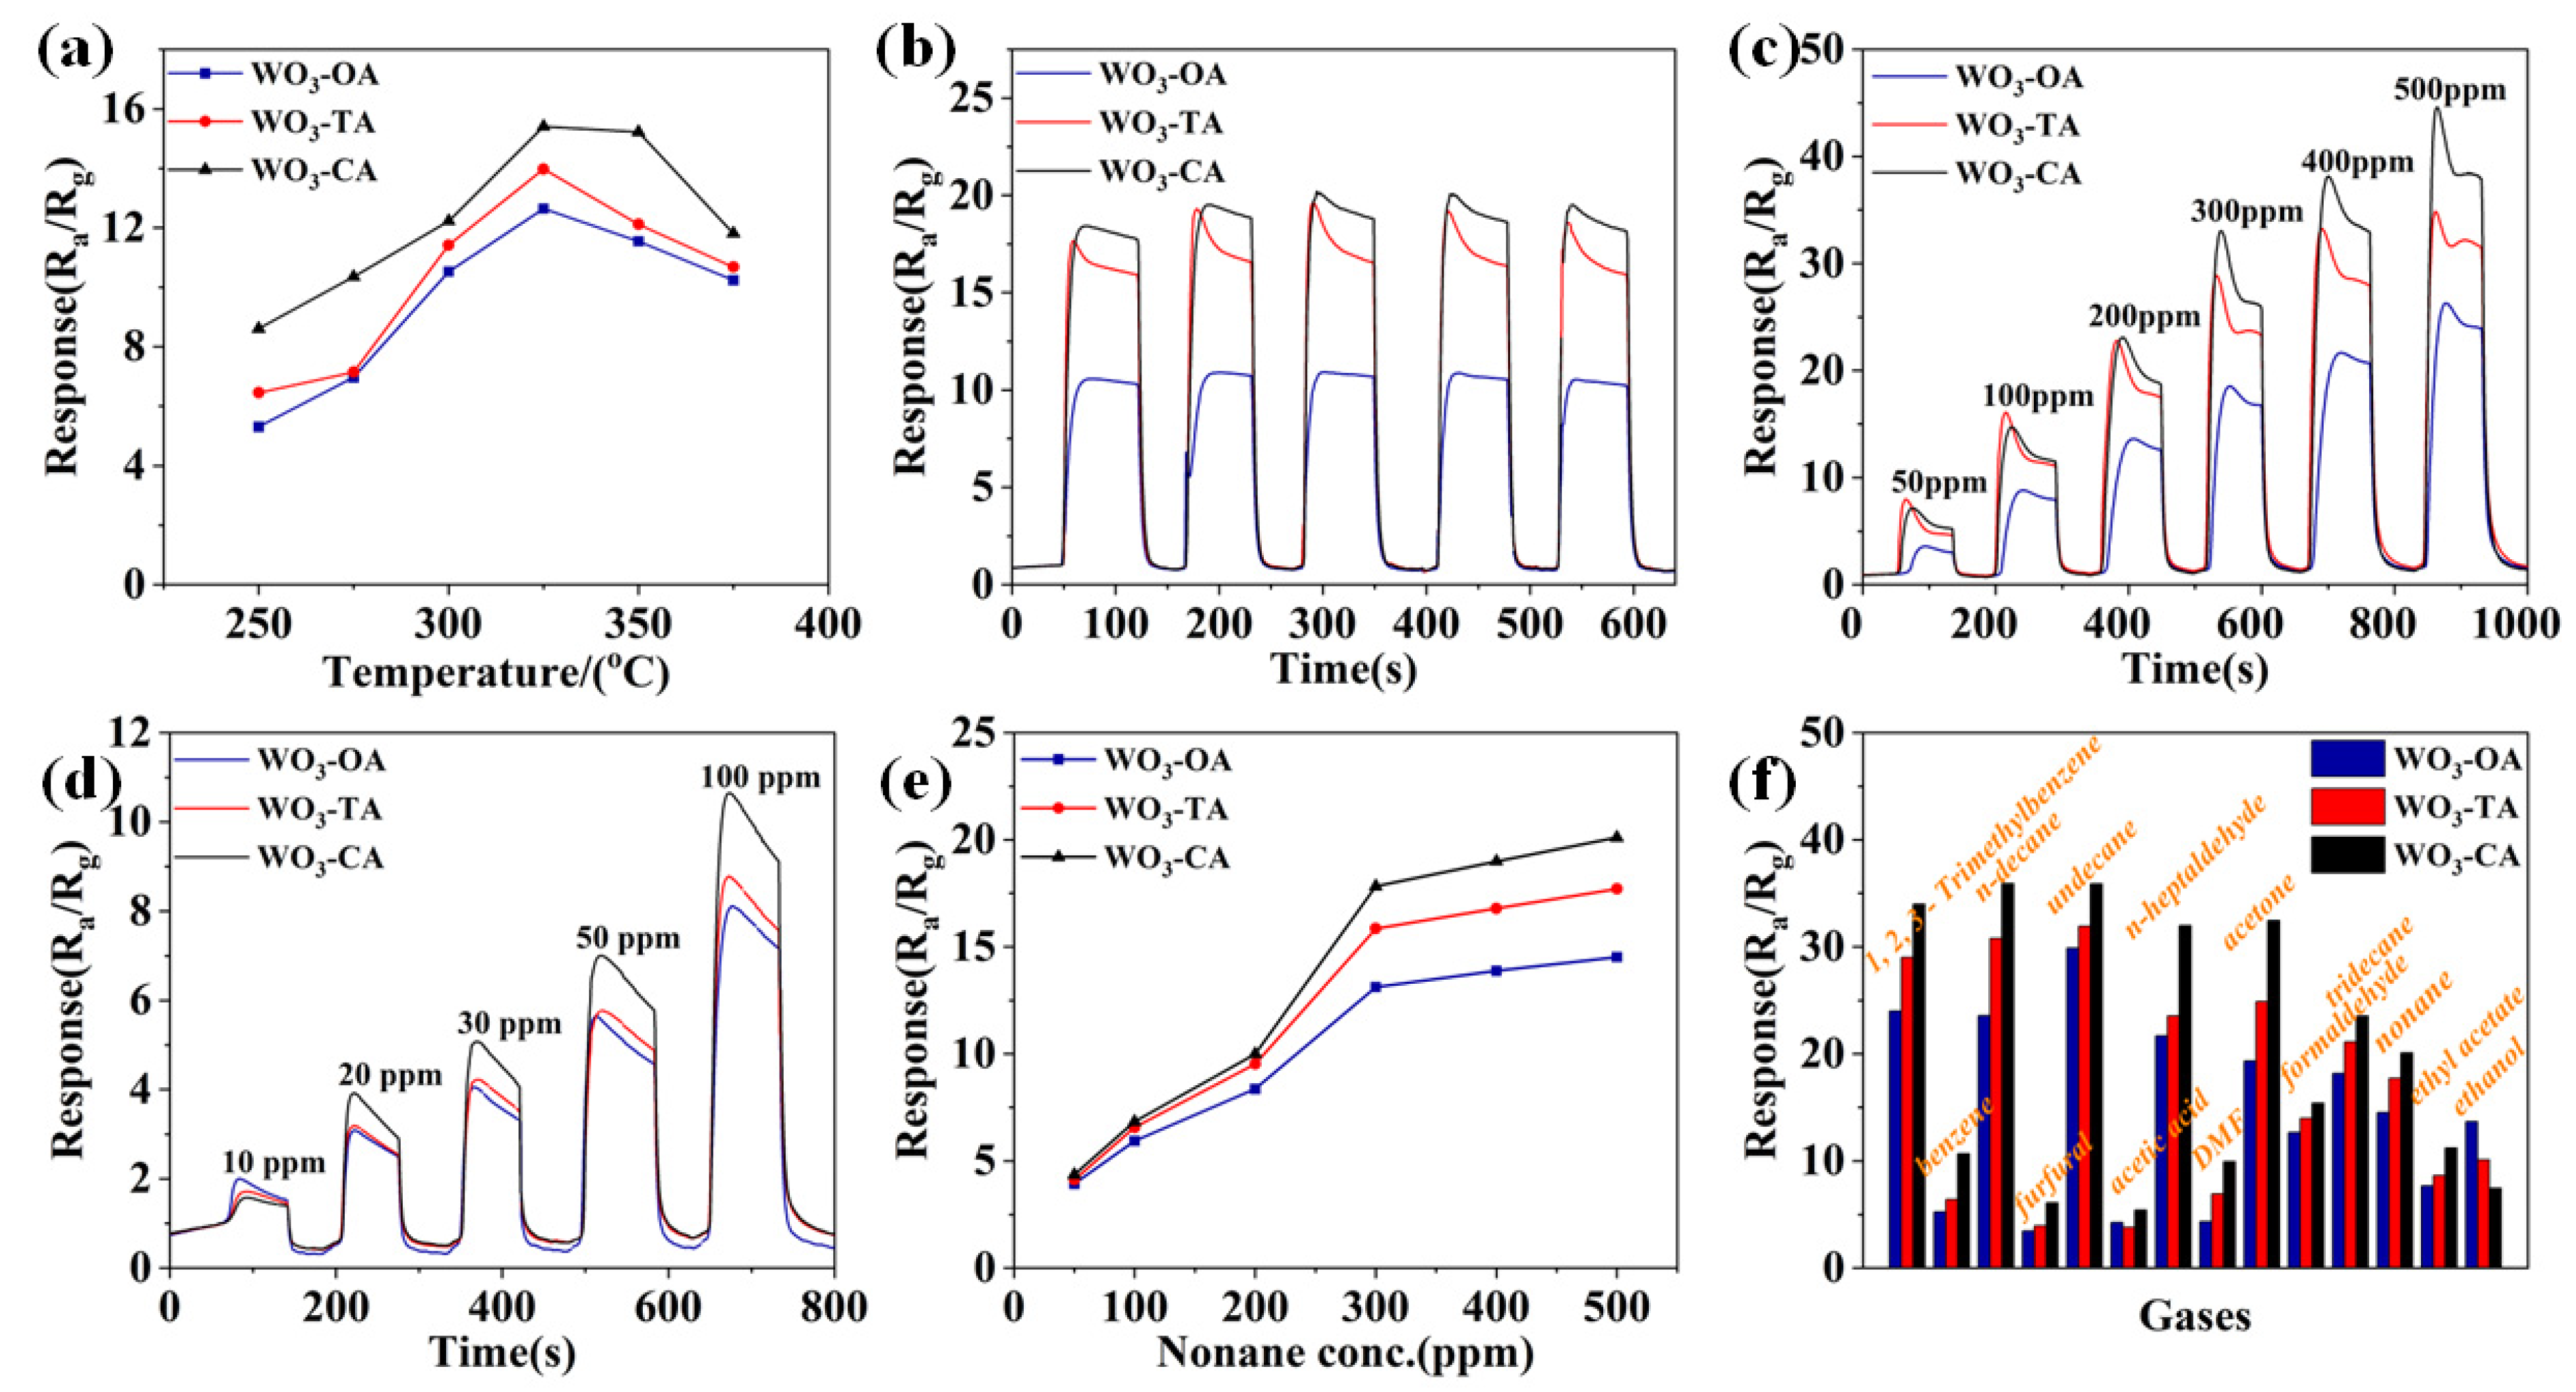
The formaldehyde response diagram with working temperature is shown in Figure 3a. The gas sensitivity increases gradually with the increase in temperature, and it maximizes at 325 °C. As the temperature continues to rise, the desorption rate is higher than the adsorption rate, resulting in fewer gas molecules adsorbed on the surface of the material, and the response speed slows down [32]. The optimal working temperature of other gases is consistent with that of formaldehyde, and the subsequent tests were all carried out at the 325 °C. The stability of three samples was tested in 300 ppm acetone, and all show the good repeatability (Figure 3b). Even at a higher decane concentration, there is still a faster response–recovery rate, among which WO3-CA has the highest sensitivity (Figure 3c). The higher the concentration of decane, the greater the difference in test sensitivity between the three samples. The response–recovery curve shows that the three sensors exhibit good responses at a lower undecane concentration (Figure 3d). WO3-CA still shows higher sensitivity than the other two. When the carrier density of the material reaches saturation, the response of nonane gradually slows down at high concentration (Figure 3e). The comparison diagram of the response values of different gas at 500 ppm (Figure 3f) shows the response of the three sensors to a variety of VOCs. It can be seen that the WO3-CA has high sensitivity to 1,2,3-trimethylbenzene, tridecane, undecane, decane, nonane, acetone, formaldehyde and n-heptaldehyde. In addition, the responses for benzene, furfural, acetic acid and N, N-dimethylformamide (DMF) were significantly lower than those gases, indicating the good selectivity of the sensor for these gases. It is necessary to add that isopropanol, methanol, propylene glycol and toluene have sensitivity values less than 3, as shown in Figure S3 (Supplementary Materials), indicating that the prepared sensor has better selectivity for these gases.
The sensitivity of gas sensors is not only related to the active site of the material but also to the adsorption and kinetic transport of the measured gas [33]. In the actual measurement process, adsorbed oxygen is activated to anion adsorbed oxygen. Only when the measured substance is close enough to the adsorbed anionic oxygen can electron transfer be carried out, showing the performance of gas sensitivity. However, different substances have different adsorption mechanisms due to their different polarity and steric hindrance. For non-polar molecules, since there is no electrostatic repulsion between them, they can better approach the oxygen adsorbed by anions, thus showing better gas-sensing properties. For polar molecules, there is a certain electrostatic repulsion between them and the anion-adsorbed oxygen, and it is more difficult to adsorb near the anion-adsorbed oxygen and reach the distance of electron transfer, thus affecting the sensitivity. Since WO3-CA has the most (002) crystalline surface content and the most anion-adsorbed oxygen [26], it has a greater electrostatic repulsive force to ethanol; therefore, for ethanol testing, WO3-CA shows a lower sensitivity.
Long-term operating stability is an important indicator for testing sensor performance. The stability test was carried out with acetone at 598 K and 100 ppm gas concentration, and the samples were measured every ten days. The WO3-CA sensor still exhibits good response performance even after 40 days (Figure 4a), and it approaches 90% of the initial response value, indicating the good long-term stability of the sensor [34]. Furthermore, sensors are often in contact with humid environments in practical operating conditions, so it is also important to explore the effect of humidity on sensors. The sensitivity of the sensor was performed in acetone at 598 K,100 ppm, with different humidity environments (Figure 4b). With increasing relative humidity, water molecules may react with chemisorbed oxygen or adsorb on the metal oxide surface, and this competing adsorption [35] of acetone and water molecules at relatively high operating temperatures limits the availability of active sites for the adsorption of gas molecules, leading to a decrease in sensitivity [36,37].
The PL spectra of WO3 samples at an excitation wavelength of 321 nm exhibit the main emission band at 400–470 nm and the maximum peak at 423 nm (Figure 5a). The PL spectra in the blue and violet light region (423 nm) can be interpreted as crystal structure defects [38]. The emission of light in the visible region (486 nm) is attributed to the oxygen vacancy defect, and its intensity is positively correlated with the defect density [39], among which WO3-CA has the highest defect density. This enhanced defect feature leads to an increase in the number of reaction sites for gas adsorption. Since the oxygen vacancy defect is an active center for oxygen adsorption, more oxygen vacancy defects can adsorb more oxygen molecules to form a thicker electron depletion layer, leading to the increase in Ra. At the same time, the redox reaction between the adsorbed oxygen and the measured gas is strengthened, leading to the reduction in Rg. Therefore, the highest response of the WO3-CA gas sensing element could be caused by the maximum oxygen vacancy concentration [40].
In order to further investigate the reasons for the higher sensitivity of WO3-CA, photocurrent and EIS were used to detect the separation efficiency and the movement of charge carriers on the surface of the material. The photocurrent response shows rapid response during the switching cycle of simulated sunlight illumination (Figure 5b). Compared to WO3-TA and WO3-OA, WO3-CA shows higher photocurrent response changes. The EIS Nyquist plot exhibits that the impedance arc radius of WO3-CA is smaller than that of WO3-TA and WO3-OA, indicating a higher charge transfer efficiency (Figure 5c). The reason for this phenomenon may be due to the synergistic effect of exposed (200) crystal surfaces, oxygen vacancies and higher specific surface areas (WO3-OA:12.56 m2/g, WO3-TA:12.05 m2/g, WO3-CA:13.28 m2/g, Figure S4, Supplementary Materials). These results indicate that the higher surface electron activity means that surface electrons of WO3-CA materials can easily bind to free oxygen in air, thus improving gas sensitivity [27]. The specific surface area of WO3-CA is higher than that of WO3-TA and WO3-OA, which can provide more active sites and increase the contact area between the material and gas molecules, thus improving the gas sensitivity. Although the specific surface area of WO3-OA is larger than that of WO3-TA, this increased specific surface area is not sufficient to produce the high electrical response for which their synergistic results with tailored crystalline surfaces seem to be effective [41]. Therefore, the relatively small difference in the specific surface area between the three materials is explained by the synergistic effect between the three materials and the active crystal surface.
The crystal surface exposure of semiconductor metal oxides will affect their performance as gas sensors [42,43], The shape control order of the surface energy of WO3 nanocrystals with monoclinic structure is (002) (1.56 J m−2) > (020) (1.54 J m−2) > (200) (1.43 J m−2), indicating that (002) is the most active in the surface-mediated reaction [44]. In this work, the main exposed surface of the WO3-CA nanosheet is the (200) crystal surface, but its (002) crystal surface has a high content, which is conducive to oxygen atom adsorption in the air. There are a large number of W atoms on the (020) crystal surface, indicating that there are a large number of hanging bonds, which is conducive to sensor performance. The (200) plane consists of a mixture of O and W atoms, with the number of W atoms being smaller than that of the (020) plane [42]. Facet (200) has the advantage of easy chemisorption of oxygen and high reactivity of the suspended bond of W atoms [45]. The synergistic effect brought by the different crystal surface content, exposure surface, specific surface area, and oxygen vacancy concentration differences of the three WO3 types is the key to the excellent gas sensitivity of WO3-CA. The gas sensitivity mechanism is explained as follows.
CnH2n+2 (gas) + O→CnH2n+1• + O2− + H+;
CnH2n+1• + O→CnH2n (gas)+ O2− + H+;
O2− + 2H+→H2O (gas).
Due to the chemisorption of gas molecules and the reaction with oxygen molecules, a depletion layer of oxygen anions is formed. The gas adsorption [46] on the surface of the material reacts with the adsorbed oxygen on the surface, liberating electrons to return. The above gas-sensitive mechanism is shown in Equations (1)–(3); taking alkane as an example, when the sensor material is exposed to a specific concentration of alkane atmosphere, the alkane molecules adsorb on the surface of the material. At a high temperature, the C-H bond at the end group of the alkane molecule breaks, forming a methylene group. The sensor surface captures hydrogen, forming a double bond between the alkene and the connected C atoms [47]. The adsorbed alkyl group can proceed to another mechanism, including the formation of surface oxide intermediates, which can be further oxidized to aldehydes and carboxylate and eventually to carbon oxides.

4. Conclusions

In this paper, WO3 nanosheets with different properties were prepared by the microwave hydrothermal method with three carboxylic acids as structural guides. The gas sensitivity of WO3 nanosheets was studied, and more than a dozen potential VOCs in exhaled gases from serious diseases were tested. The WO3-CA gas sensor is suitable for 1,2,3-trimethylbenzene, tridecane, undecane, decane, nonane, acetone, formaldehyde and n-heptaldehyde, with higher sensitivity, response recovery performance and stability, while it has certain selectivity with ethyl acetate, dimethylamine, methanol, isopropanol, toluene, furfural, acetic acid, DMF, benzene and ethanol. XRD, PL, EIS and transient photocurrent test results show that WO3-CA has more surface oxygen vacancy defects, higher surface charge mobility, and a possibly synergistic effect between the crystal surface and specific surface area and oxygen vacancy defects, which makes WO3-CA significantly better than WO3-OA and WO3-TA. This study provides a simple and rapid method for the synthesis of WO3 nanosheets, and the prepared sensor has an important reference value for the selection of alkane biomarker sensors in the exhaled gas sensor array.

Supplementary Materials

The following supporting information can be downloaded at: https://www.mdpi.com/article/10.3390/nano12183211/s1, Figure S1: Peak area and full-width at the half of the maximum (FEHM) after XRD integration; (a) WO3-OA, (b) WO3-TA, (c) WO3-CA; Figure S2: SEM images of three samples without adjuvants, and sample thickness diagram (a,d) WO3-OA, (b,e) WO3-TA, (c,f) WO3-CA; Figure S3: Schematic diagram of three sensor selectivity with tridecane as control; Figure S4: N2 adsorption/desorption isotherms for (a) WO3-OA, (b) WO3-TA, (c) WO3-CA.

Author Contributions

Conceptualization, H.L. and Z.H.; methodology, H.L.; software, H.L.; validation, L.D., K.X. and H.L.; formal analysis, Y.L. and S.D.; investigation, H.L.; resources, H.L.; data curation, H.L.; writing—original draft preparation, H.L.; writing—review and editing, K.X., L.D. and H.L.; visualization, H.L. and Y.C.; supervision, K.X., J.X. and L.D.; project administration, L.D. and K.X.; funding acquisition, L.D. and K.X. All authors have read and agreed to the published version of the manuscript.

Funding

This work was financially supported by the program of Science and Technology Department of Henan province (Nos. 222102230035, 222102240087).

Institutional Review Board Statement

Not applicable.

Informed Consent Statement

Not applicable.

Data Availability Statement

Not applicable.

Acknowledgments

The authors thank the Analytical and Testing Center of Henan Institute of Science and Technology (HIST) for allowing use its facilities.

Conflicts of Interest

The authors declare no conflict of interest.

References

  1. Shinohara, N.; Kai, Y.; Mizukoshi, A.; Fujii, M.; Kumagai, K.; Okuizumi, Y.; Jona, M.; Yanagisawa, Y. On-site passive flux sampler measurement of emission rates of carbonyls and VOCs from multiple indoor sources. Build. Environ. 2009, 44, 859–863. [Google Scholar] [CrossRef]
  2. Broza, Y.Y.; Zhou, X.; Yuan, M.; Qu, D.; Zheng, Y.; Vishinkin, R.; Khatib, M.; Wu, W.; Haick, H. Disease Detection with Molecular Biomarkers: From Chemistry of Body Fluids to Nature-Inspired Chemical Sensors. Chem. Rev. 2019, 119, 11761–11817. [Google Scholar] [CrossRef]
  3. Zhou, J.; Huang, Z.; Kumar, U.; Chen, D.D.Y. Review of recent developments in determining volatile organic compounds in exhaled breath as biomarkers for lung cancer diagnosis. Anal. Chim. Acta 2017, 996, 1–9. [Google Scholar] [CrossRef] [PubMed]
  4. Choi, K.-I.; Hwang, S.-J.; Dai, Z.; Kang, Y.C.; Lee, J.-H. Rh-catalyzed WO3 with anomalous humidity dependence of gas sensing characteristics. RSC Adv. 2014, 4, 53130–53136. [Google Scholar] [CrossRef]
  5. Phillips, M.; Altorki, N.; Austin, J.H.M.; Cameron, R.; Cataneo, R.; Greenberg, J.; Kloss, R.; Maxfield, R.; Munawar, M.; Pass, H.; et al. Prediction of breast cancer using volatile biomarkers in the breath. Breast Cancer Res. Treat. 2006, 99, 19–21. [Google Scholar] [CrossRef] [PubMed]
  6. Amal, H.; Leja, M.; Funka, K.; Skapars, R.; Sivins, A.; Ancans, G.; Liepniece-Karele, I.; Kikuste, I.; Lasina, I.; Haick, H. Detection of precancerous gastric lesions and gastric cancer through exhaled breath. Gut 2016, 65, 400–407. [Google Scholar] [CrossRef]
  7. Hua, Q.; Zhu, Y.; Liu, H. Detection of volatile organic compounds in exhaled breath to screen lung cancer: A systematic review. Future Oncol. 2018, 14, 1647–1662. [Google Scholar] [CrossRef]
  8. Nakhleh, M.K.; Amal, H.; Jeries, R.; Broza, Y.Y.; Aboud, M.; Gharra, A.; Ivgi, H.; Khatib, S.; Badarneh, S.; Har-Shai, L.; et al. Diagnosis and Classification of 17 Diseases from 1404 Subjects via Pattern Analysis of Exhaled Molecules. ACS Nano 2017, 11, 112–125. [Google Scholar] [CrossRef]
  9. Zeb, S.; Peng, X.; Yuan, G.; Zhao, X.; Qin, C.; Sun, G.; Nie, Y.; Cui, Y.; Jiang, X. Controllable synthesis of ultrathin WO3 nanotubes and nanowires with excellent gas sensing performance. Sens. Actuators B Chem. 2019, 305, 127435. [Google Scholar] [CrossRef]
  10. Du, Y.; Jiang, C.; Song, L.; Gao, B.; Gong, H.; Xia, W.; Sheng, L.; Wang, T.; He, J. Regulating surface state of WO3 nanosheets by gamma irradiation for suppressing hydrogen evolution reaction in electrochemical N2 fixation. Nano Res. 2020, 13, 2784–2790. [Google Scholar]
  11. Bi, Z.; Li, X.; Chen, Y.; He, X.; Xu, X.; Gao, X. Large-Scale Multifunctional Electrochromic-Energy Storage Device Based on Tungsten Trioxide Monohydrate Nanosheets and Prussian White. ACS Appl. Mater. Interfaces 2017, 9, 29872–29880. [Google Scholar] [CrossRef] [PubMed]
  12. Li, H.; Wang, J.; Shi, G.; Wang, H.; Zhang, Q.; Li, Y. Construction of hydrated tungsten trioxide nanosheet films for efficient electrochromic performance. RSC Adv. 2015, 5, 196–201. [Google Scholar] [CrossRef]
  13. Li, F.; Li, C.; Zhu, L.; Guo, W.; Shen, L.; Wen, S.; Ruan, S. Enhanced toluene sensing performance of gold-functionalized WO3 ·H2O nanosheets. Sens. Actuators B Chem. 2016, 223, 761–767. [Google Scholar] [CrossRef]
  14. Lee, J.H.; Yim, D.; Park, J.H.; Lee, C.H.; Ju, J.M.; Lee, S.U.; Kim, J.H. Tuning d-band centers by coupling PdO nanoclusters to WO3 nanosheets to promote the oxygen reduction reaction. J. Mater. Chem. A 2020, 8, 13490–13500. [Google Scholar] [CrossRef]
  15. Kim, S.; Park, S.; Park, S.; Lee, C. Acetone sensing of Au and Pd-decorated WO3 nanorod sensors. Sens. Actuators B Chem. 2015, 209, 180–185. [Google Scholar] [CrossRef]
  16. Park, S.; Kim, H.; Jin, C.; Choi, S.-W.; Kim, S.S.; Lee, C. Enhanced CO gas sensing properties of Pt-functionalized WO3 nanorods. Thermochim. Acta 2012, 542, 69–73. [Google Scholar] [CrossRef]
  17. Hara, K.; Zhao, Z.; Cui, Y.; Miyauchi, M.; Miyashita, M.; Mori, S. Nanocrystalline electrodes based on nanoporous-walled WO3 nanotubes for organic-dye-sensitized solar cells. Langmuir 2011, 27, 12730–12736. [Google Scholar] [CrossRef]
  18. Chi, X.; Liu, C.; Liu, L.; Li, Y.; Wang, Z.; Bo, X.; Liu, L.; Su, C. Tungsten trioxide nanotubes with high sensitive and selective properties to acetone. Sens. Actuators B Chem. 2014, 194, 33–37. [Google Scholar] [CrossRef]
  19. Hieu, N.V.; Quang, V.V.; Hoa, N.D.; Kim, D. Preparing large-scale WO3 nanowire-like structure for high sensitivity NH3 gas sensor through a simple route. Curr. Appl. Phys. 2011, 11, 657–661. [Google Scholar] [CrossRef]
  20. Gui, Y.; Dong, F.; Zhang, Y.; Zhang, Y.; Tian, J. Preparation and gas sensitivity of WO3 hollow microspheres and SnO2 doped heterojunction sensors. Mater. Sci. Semicond. Process. 2013, 16, 1531–1537. [Google Scholar] [CrossRef]
  21. Zhai, C.; Zhu, M.; Jiang, L.; Yang, T.; Zhao, Q.; Luo, Y.; Zhang, M. Fast triethylamine gas sensing response properties of nanosheets assembled WO3 hollow microspheres. Appl. Surf. Sci. 2019, 463, 1078–1084. [Google Scholar] [CrossRef]
  22. Mehta, S.S.; Chikhale, L.P.; Mulla, I.S.; Suryavanshi, S.S. Microwave synthesis and acetone sensing properties of WO3 hierarchical nanostructures. J. Mater. Sci.-Mater. Electron. 2017, 28, 17227–17233. [Google Scholar] [CrossRef]
  23. Sczancoski, J.C.; Cavalcante, L.S.; Joya, M.R.; Varela, J.A.; Pizani, P.S.; Longo, E. SrMoO4 powders processed in microwave-hydrothermal: Synthesis, characterization and optical properties. Chem. Eng. J. 2008, 140, 632–637. [Google Scholar] [CrossRef]
  24. Hernandez-Uresti, D.B.; Sánchez-Martínez, D.; Martínez, C.A.; Sepúlveda-Guzmán, S. Torres-Martínez, L.M. Characterization and photocatalytic properties of hexagonal and monoclinic WO3 prepared via microwave-assisted hydrothermal synthesis. Ceram. Int. 2017, 40, 4767–4775. [Google Scholar] [CrossRef]
  25. Parthibavarman, M.; Karthik, M.; Prabhakaran, S. Role of Microwave on Structural, Morphological, Optical and Visible Light Photocatalytic Performance of WO3 Nanostructures. J. Clust. Sci. 2019, 30, 495–506. [Google Scholar] [CrossRef]
  26. Ding, Q.; Li, J.; Zou, Z.; Sun, K.; Wang, Y.; He, D. Fluoride-assisted highly-active tungsten oxide with modulating exposed facets and defect sites for efficient ppb-level acetone detection. Appl. Surf. Sci. 2022, 584, 152554. [Google Scholar] [CrossRef]
  27. Wu, J.; Qiao, P.; Li, H.; Ren, L.; Xu, Y.; Tian, G.; Li, M.; Pan, K.; Zhou, W. Surface-oxygen vacancy defect-promoted electron-hole separation of defective tungsten trioxide ultrathin nanosheets and their enhanced solar-driven photocatalytic performance. J. Colloid Interface Sci. 2019, 557, 18–27. [Google Scholar] [CrossRef] [PubMed]
  28. Ma, J.; Ren, Y.; Zhou, X.; Liu, L.; Zhu, Y.; Cheng, X.; Xu, P.; Li, X.; Deng, Y.; Zhao, D. Pt Nanoparticles Sensitized Ordered Mesoporous WO3 Semiconductor: Gas Sensing Performance and Mechanism Study. Adv. Funct. Mater. 2017, 28, 1705268. [Google Scholar] [CrossRef]
  29. Tong, B.; Deng, Z.; Xu, B.; Meng, G.; Shao, J.; Liu, H.; Dai, T.; Shan, X.; Dong, W.; Wang, S.; et al. Oxygen Vacancy Defects Boosted High Performance p-Type Delafossite CuCrO2 Gas Sensors. ACS Appl. Mater. Interfaces 2018, 10, 34727–34734. [Google Scholar] [CrossRef]
  30. Zhang, N.; Chen, C.; Mei, Z.; Liu, X.; Qu, X.; Li, Y.; Li, S.; Qi, W.; Zhang, Y.; Ye, J.; et al. Monoclinic Tungsten Oxide with {100} Facet Orientation and Tuned Electronic Band Structure for Enhanced Photocatalytic Oxidations. ACS Appl. Mater. Interfaces 2016, 8, 10367–10374. [Google Scholar] [CrossRef] [PubMed]
  31. Zhao, T.; Zai, J.; Xu, M.; Zou, Q.; Su, Y.; Wang, K.; Qian, X. Hierarchical Bi2O2CO3 microspheres with improved visible-light-driven photocatalytic activity. CrystEngComm 2011, 13, 4010–4017. [Google Scholar] [CrossRef]
  32. Yu, J.; Wang, C.; Yuan, Q.; Yu, X.; Wang, D.; Chen, Y. Ag-Modified Porous Perovskite-Type LaFeO3 for Efficient Ethanol Detection. Nanomaterials 2022, 12, 1768. [Google Scholar] [CrossRef] [PubMed]
  33. Walker, J.M.; Akbar, S.A.; Morris, P.A. Synergistic effects in gas sensing semiconducting oxide nano-heterostructures: A review. Sens. Actuators B Chem. 2019, 286, 624–640. [Google Scholar] [CrossRef]
  34. Yadav, A.A.; Lokhande, A.C.; Kim, J.H.; Lokhande, C.D. Improvement in CO2 sensing characteristics using Pd nanoparticles decorated La2O3 thin films. J. Ind. Eng. Chem. 2017, 49, 76–81. [Google Scholar] [CrossRef]
  35. Zhang, D.; Fan, Y.; Li, G.; Ma, Z.; Wang, X.; Cheng, Z.; Xu, J. Highly sensitive BTEX sensors based on hexagonal WO3 nanosheets. Sens. Actuators B Chem. 2019, 293, 23–30. [Google Scholar] [CrossRef]
  36. Yadav, A.A.; Lokhande, A.C.; Kim, J.H.; Lokhande, C.D. Highly sensitive CO2 sensor based on microrods-like La2O3 thin film electrode. RSC Adv. 2016, 6, 106074–106080. [Google Scholar] [CrossRef]
  37. Hunge, Y.M.; Yadav, A.A.; Kulkarni, S.B.; Mathe, V.L. A multifunctional ZnO thin film based devises for photoelectrocatalytic degradation of terephthalic acid and CO2 gas sensing applications. Sens. Actuators B Chem. 2018, 274, 1–9. [Google Scholar] [CrossRef]
  38. Sakthiraj, K.; Balachandrakumar, K. Influence of Ti addition on the room temperature ferromagnetism of tin oxide (SnO2) nanocrystal. J. Magn. Magn. Mater. 2015, 395, 205–212. [Google Scholar] [CrossRef]
  39. Li, F.; Li, Y.; Jing, F.; Zhou, J.; Chen, Y.; Sun, D.; Ruan, S. Low-temperature synthesis of WO3 nanolamella and their sensing properties for xylene. RSC Adv. 2015, 5, 85598–85605. [Google Scholar] [CrossRef]
  40. Li, N.; Fan, Y.; Shi, Y.; Xiang, Q.; Wang, X.; Xu, J. A Low Temperature Formaldehyde Gas Sensor Based on Hierarchical SnO/SnO2 Nano-flowers Assembled from Ultrathin Nanosheets: Synthesis, Sensing Performance and Mechanism. Sens. Actuators B Chem. 2019, 294, 106–115. [Google Scholar] [CrossRef]
  41. D’Arienzo, M.; Armelao, L.; Mari, C.M.; Polizzi, S.; Ruffo, R.; Scotti, R.; Morazzoni, F. Surface interaction of WO3 nanocrystals with NH3. Role of the exposed crystal surfaces and porous structure in enhancing the electrical response. RSC Adv. 2014, 4, 11012–11022. [Google Scholar] [CrossRef] [Green Version]
  42. Han, X.; Han, X.; Li, L.; Wang, C. Controlling the morphologies of WO3 particles and tuning the gas sensing properties. New J. Chem. 2012, 36, 2205–2208. [Google Scholar] [CrossRef]
  43. Zheng, G.; Wang, J.; Zu, G.; Che, H.; Lai, C.; Li, H.; Murugadoss, V.; Yan, C.; Fan, J.; Guo, Z. Sandwich structured WO3 nanoplatelets for highly efficient photoelectrochemical water splitting. J. Mater. Chem. A 2019, 7, 26077–26088. [Google Scholar] [CrossRef]
  44. Xie, Y.; Liu, G.; Yin, L.; Cheng, H.-M. Crystal facet-dependent photocatalytic oxidation and reduction reactivity of monoclinic WO3 for solar energy conversion. J. Mater. Chem. 2012, 22, 6746–6751. [Google Scholar] [CrossRef]
  45. Xue, D.; Wang, J.; Wang, Y.; Sun, G.; Cao, J.; Bala, H.; Zhang, Z. Enhanced Methane Sensing Properties of WO3 Nanosheets with Dominant Exposed (200) Facet via Loading of SnO2 Nanoparticles. Nanomaterials 2019, 9, 351. [Google Scholar] [CrossRef] [PubMed]
  46. Agrawal, A.V.; Kumar, N.; Kumar, M. Strategy and Future Prospects to Develop Room-Temperature-Recoverable NO2 Gas Sensor Based on Two-Dimensional Molybdenum Disulfide. Nano-Micro Lett. 2021, 13, 2–58. [Google Scholar] [CrossRef]
  47. Carotta, M.C.; Guidi, V.; Martinelli, G.; Nagliati, M.; Puzzovio, D.; Vecchi, D. Sensing of volatile alkanes by metal-oxide semiconductors. Sens. Actuators B Chem. 2008, 130, 497–501. [Google Scholar] [CrossRef]
Figure 1. (a) XRD patterns, (b) The full-scale XPS spectra, (c) O1s, (d) W4f, (e) UV-vis absorption spectra of different samples, (f) Plots of the (ahν) 1/2 vs. photon energy (hν) for WO3 samples.
Nanomaterials 12 03211 g001
Figure 2. SEM, TEM and HRTEM images of (a,d,g) WO3-OA, (b,e,h) WO3-TA and (c,f,i) WO3-CA.
Nanomaterials 12 03211 g002
Figure 3. Gas sensitivity test at 35–50% relative humidity: (a) Working temperature and sensitivity; (b) Stability test at 300 ppm of acetone; (c) Decane response–recovery curve; (d) The response–recovery curve of undecane at lower concentrations; (e) The relationship between the sensitivity and the gas concentration in a nonane atmosphere; (f) Response values for 500 ppm VOCs gas at optimal operating temperature.
Nanomaterials 12 03211 g003
Figure 4. (a) Stability of the three WO3 in 100 ppm acetone and optimal operating temperature for 40 days. (b) Variation of acetone gas response at different relative humidity.
Nanomaterials 12 03211 g004
Figure 5. (a) The PL spectra of the different WO3 samples. (b,c) Transient photocurrent responses and EIS Nyquist plots.
Nanomaterials 12 03211 g005
Publisher’s Note: MDPI stays neutral with regard to jurisdictional claims in published maps and institutional affiliations.