Article

Investigation on Crystal-Structure, Thermal and Electrical Properties of PVDF Nanocomposites with Cobalt Oxide and Functionalized Multi-Wall-Carbon-Nanotubes

1
Department of Chemistry, Islamia College University, Peshawar 25120, Pakistan
2
Department of Chemistry, Hazara University, Mansehra 21120, Pakistan
3
Department of Chemistry, University of Haripur, Haripur 22620, Pakistan
4
School of Chemistry and Chemical Engineering, Shaanxi Normal University, Chang’an West Street 620, Xi’an 710119, China
5
Physics Department, Aljamoum University College, Umm Al-Qura University, Makkah 25375, Saudi Arabia
6
Department of Chemistry, College of Science, Princess Nourah bint Abdulrahman University, P.O. Box 84428, Riyadh 11671, Saudi Arabia
7
School of Physical Science and Technology, Lanzhou University, Lanzhou 730000, China
*
Authors to whom correspondence should be addressed.
Nanomaterials 2022, 12(16), 2796; https://doi.org/10.3390/nano12162796
Submission received: 25 July 2022 / Revised: 9 August 2022 / Accepted: 11 August 2022 / Published: 15 August 2022

Abstract

:
Nanocomposites of polyvinylidene fluoride (PVDF) with dimensional (1D) cobalt oxide (Co3O4) and f-MWCNTs were prepared successfully by the solution casting method. The impact of 1D Co3O4 filler and 1D Co3O4/f-MWCNTs co-fillers on the structural, thermal, and electrical behavior of PVDF were studied. The crystal structural properties of pure PVDF and its nanocomposite films were studied by XRD, which revealed a significant enhancement of β-phase PVDF in the resulting nanocomposite films. The increase in β-phase was further revealed by the FTIR spectroscopic analysis of the samples. TG, DTA, and DSC analyses confirmed an increase in thermal stability of PVDF with the addition of nano-fillers as well as their increasing wt.%. From impedance spectroscopic studies, it was found that the DC conductivity of PVDF increases insignificantly initially (up to 0.1 wt.% of nano-fillers addition), but a significant improvement in DC conductivity was found at higher concentrations of the nano-fillers. Furthermore, it was observed that the DC conductivity decreases with frequency. The increase in DC conductivity corresponded to the strong interactions of nano-fillers with PVDF polymer chains.

1. Introduction

Poly (vinylidene fluoride) (PVDF) is one of the most important polymers and exists in four various crystalline forms, i.e., α, β, δ, and γ phases. Of all the polymorphs, the polar β-phase is the most attractive for researchers because of its technologically important characteristics, such as a high dielectric constant and pyro and piezoelectric properties [1,2]. Therefore, PVDF is used extensively in applied research and is equally preferred in technological applications [3,4,5]. For example, PVDF has found prospective uses in the field of electronics, actuators, sensors, optics, biological imaging, batteries, transducers, electro-optical devices, and membranes [6]. Several methods, such as crystallization from solution, mechanical deformation, high-pressure melt crystallization, and applying a strong electric field, have been utilized to induce the β phase in PVDF [7]. Among them, the solution casting method is preferred owing to the fact that the polar β-phase can be created easily by reinforcing PVDF with a suitable filler, particularly nano-based conducting materials [8].
Nano-fillers are nano-sized structures such as clay, multi-wall carbon nanotubes (MWCNTs), metal oxides, etc., which display a significant role in the conversion of non-polar α-phase PVDF to polar β-phase on the one hand, and on the other, improves its thermal and electrical properties. However, the extent of the induction of these properties into the resulting PVDF nanocomposites is limited by the poor dispersion of nano-fillers in the matrix [9]. For example, it has been observed and reported that using pristine MWCNTs as reinforcement impacted the PVDF conversion to β-phase insignificantly. This was owed to the weak interfacial interaction of MWCNTs with the polymer chains. However, a significant improvement in β-phase formation was observed by using functionalized MWCNTs (f-MWCNTs) as nano-fillers [7]. The enhancement in the dispersibility of MWCNTs corresponded to the enhanced interfacial interactions of the MWCNTs with PVDF upon the functionalization of the former [10]. Although functionalized MWCNTs have served the purpose to some extent, the high cost of MWCNTs is one of the grave concerns for the potential application of such PVDF nanocomposites. Because of this reason, low-cost alternative fillers such as metal oxides, including TiO2, SnO2, ZnO, etc., have received incredible attention during the last couple of years. Moreover, the matrix and contents of these metal-oxide-based nano-fillers have been shown to be more effective in altering the properties of PVDF [11]. However, the structure (geometrical shape) of the nano-filler is important for altering the characteristics of the matrices [12]. One of the examples is MWCNTs, which have a one-dimensional (1D) nano-architecture and show a tremendous impact on the β-phase formation of PVDF. Therefore, in this paper, we focus on the use of 1D metal-oxide nano-fillers for tailoring the properties of the resulting PVDF nanocomposites [13]. It is pertinent to mention here that anisotropic, e.g., one-dimensional (1D) nanomaterials, have played a significant role in developing new devices for practical applications in diverse areas, including but not limited to catalysis, sensors, field effect transistors, and energy storage systems [14,15,16,17,18,19].
Co3O4 is widely used as an anode material in Lithium-ion batteries (LIBs) owing to its high theoretical-based energy storage capacity of 890 mAhg−1. Therefore, various preparation processes have been utilized to synthesize nanoscale structures of Co3O4 with different morphologies and have been used for different purposes, including as nano-fillers in a number of polymeric materials [20,21]. However, to the best of our knowledge, it has not been used as a 1D nano-filler alone or in combination with f-MWCNTs for the formation of PVDF composites.
Therefore, here in this article, we present the preparation of PVDF nanocomposites with 1D nanostructures and explore their impact on the different properties of the resulting PVDF nanocomposites. Properties, such as thermal stability and electrical conductivity, were thoroughly investigated as a function of the nature and concentration of nano-fillers in the resulting nanocomposites.

2. Experimental Section

2.1. Materials

Powder Poly (vinylidenefluoride) (PVDF), (average molecular weight; Mw~534,000), polyvinylpyrrolidone (PVP), with an average molecular weight; Mw~1,300,000, tetrahydrofuran (THF), dimethylformamid (DMF), sulphuric acid (H2SO4), nitric acid (HNO3), and finally, cobalt nitrate hexahydrate [Co(NO3)2·6H2O] were acquired from Sigma-Aldrich. Multi-wall carbon nanotubes (MWCNTs) were used after functionalization in our own research lab following the reported protocol by Saddiqa Begum et al. [8].

2.2. Synthesis of 1D Co3O4 Nanostructures

The 1D Co3O4 nanostructures were synthesized by the electrospinning technique. Prior to the electrospinning, the salt solution of the cobalt was prepared by dissolving 1.5 g of Co(NO3)2·6H2O in 10 mL of DMF. After the salt was completely dissolved under constant stirring in DMF, 1.2 g of PVP granules were added, and this mixture was stirred for about 5 h; finally, a clear solution was obtained. A 5 mL syringe was filled with this solution for electrospinning, which was then mounted on the syringe pump. The needle of the syringe was connected to a high-voltage supply while the collector was grounded. The voltage was increased gradually, and the formation of the nanowires started by coming out of the needle, and they were deposited on the metal plate covered with aluminum foil. The distance between the needle tip and the collector surface was set at 15 cm, and a maximum voltage of 15 kV was applied. The nanowires deposited on the collector were then scratched with a spatula and stored in a glass vial. These polymeric cobalt-containing nanowires were then calcined at a temperature of 600 °C to remove the PVP, and finally, the pure Co3O4 nanostructures were obtained.

2.3. Functionalization of the MWCNTs

The functionalized MWCNTs were prepared following the protocol/method published elsewhere [8].

2.4. Preparation of Co3O4/PVDF and Co3O4/f-CNTs/PVDF Nanocomposites

To prepare the films of the Co3O4/PVDF, two separate dispersions of the Co3O4 nanostructures and PVDF were prepared. The Co3O4 dispersion was prepared by sonicating its powder in a given amount of DMF. Similarly, in a separate centrifuge tube, the proper amount of PVDF was dissolved in DMF and was sonicated at room temperature for about 1 h. Both of these dispersions were mixed together and were kept in the sonicator for further sonication to achieve a homogenous mixture of the two dispersions. This composite dispersion was further refluxed at 70 °C for 6 h followed by 3-h sonication to achieve a satisfactory distribution of the Co3O4 nano-fillers in the PVDF matrix. Finally, the nanocomposite dispersion was poured into a petri dish and kept in an oven for 5 h at 70 °C. After the given time and temperature, the solvent was completely evaporated, and the Co3O4/PVDF nanocomposite film/membrane was ready, which was stored for further analysis and applications.
To prepare the Co3O4/f-MWCNTs/PVDF nanocomposite films/membranes, the same procedure was followed with the introduction of f-MWCNTS as co-fillers. First, the dispersion of Co3O4/f-MWCNTs was prepared by sonication for 2 h. Meanwhile, the dispersion of the PVDF was prepared separately by sonication. Both of these dispersions were then mixed together, followed by excessive sonication for an appropriate time. The dispersion slurry of these mixtures was then poured into a flat dish and kept in an oven for 6 h, during which the solvent was evaporated, and the composite films of the Co3O4/f-MWCNTs/PVDF were obtained as final products. The f-MWCNTs were mixed in three different weight percentages (wt.%), i.e., 0.1 wt.%, 0.15 wt.%, and 0.3 wt.%, while keeping the amount of Co3O4 and PVDF fixed. In total, five nanocomposite films were prepared, i.e., a blank film that consisted of only PVDF (blank), a Co3O4/PVDF (PC1), and Co3O4/f-MWCNTs/PVDF in which the f-MWCNTs amount varied from 0.1 wt.% (PC1CNT1) to 0.15 wt.% (PC1CNT1.5) and 0.3 wt.% (PC1CNT3). A detailed description of the composition of different PVDF nanocomposites films is given in Table 1.

2.5. Characterization of the Co3O4 and Its Nanocomposites

After electrospinning and calcination, the nanostructures of the Co3O4 were characterized by X-ray diffraction (XRD) analysis, Fourier-transformed infrared (FTIR) spectroscopy, and transmission electron microscopy (TEM). While the nanocomposite films, PVDF, Co3O4/PVDF, and Co3O4-f-MWCNTs/PVDF, were characterized by XRD, FTIR, thermogravimetric analysis (TGA), thermal differential analysis (TDA), differential scanning calorimetry (DSC), and DC conductivity. The XRD patterns of the samples were taken by Xpert Pro. The diffractometer was equipped with a copper (Cu)-based X-ray source, which yields K-α radiation (λ: 1.542 Å). The FTIR spectra of each of the samples were obtained using a Varian 2000 FTIR-spectrometer attenuated total reflection (ATR) mode in the range of 4000 cm−1 to 400 cm−1. The JEOL, Japan (Model: JSM 6490) TEM analyzer was used to study the effect of the surface 2D morphology of Co3O4. The TGA patterns were taken by using a TGA analyzer (Perkin-Elmer TGA-7) in the temperature range ~20–800 °C, at a heating rate of 5 °C min−1 under an N2 environment. The TDA data were extracted from the TGA patterns. DSC thermograms were taken under a dry N2 environment for the nanocomposite films in the temperature range of 0 °C to 200 °C at a heating rate of 10 °C min−1. To measure the dielectric properties of the nanocomposite films, an impedance spectrometer was carried out using inductance, L-capacitance, C-Resistance, and R (LCR) meters. The spectra were obtained for the silver (Ag) painted films, which were cut into 10 mm × 10 mm size. The Ag paste was applied to both sides of films for better contact. The silver-painted films were prepared by adding silver metal to isoamyl acetate, which was then mixed well using a brush. The same was coated on blank PVDF and its nanocomposite films. The isoamy acetate was evaporated at a high temperature, in a range from 250 to 450 °C over a few minutes. The silver paste was then used as an electrode to determine the DC conductivity of the thin nanocomposite films [22]. For the impedance measurement, the two red clips, i.e., HD/HS terminals of the LCR meter, were connected to one silver paste side of the film, and the two black clips, i.e., the LS/LD terminals, were connected to the other silver paste side of the film, and the program was run for further processes. The digital LCR meter uses four terminals to apply a current to the test films, with one pair of terminals (High Drive/Low Drive) to measure the impedance across the films with the other pair (High Sense/Low Sense) of terminals.

3. Results and Discussion

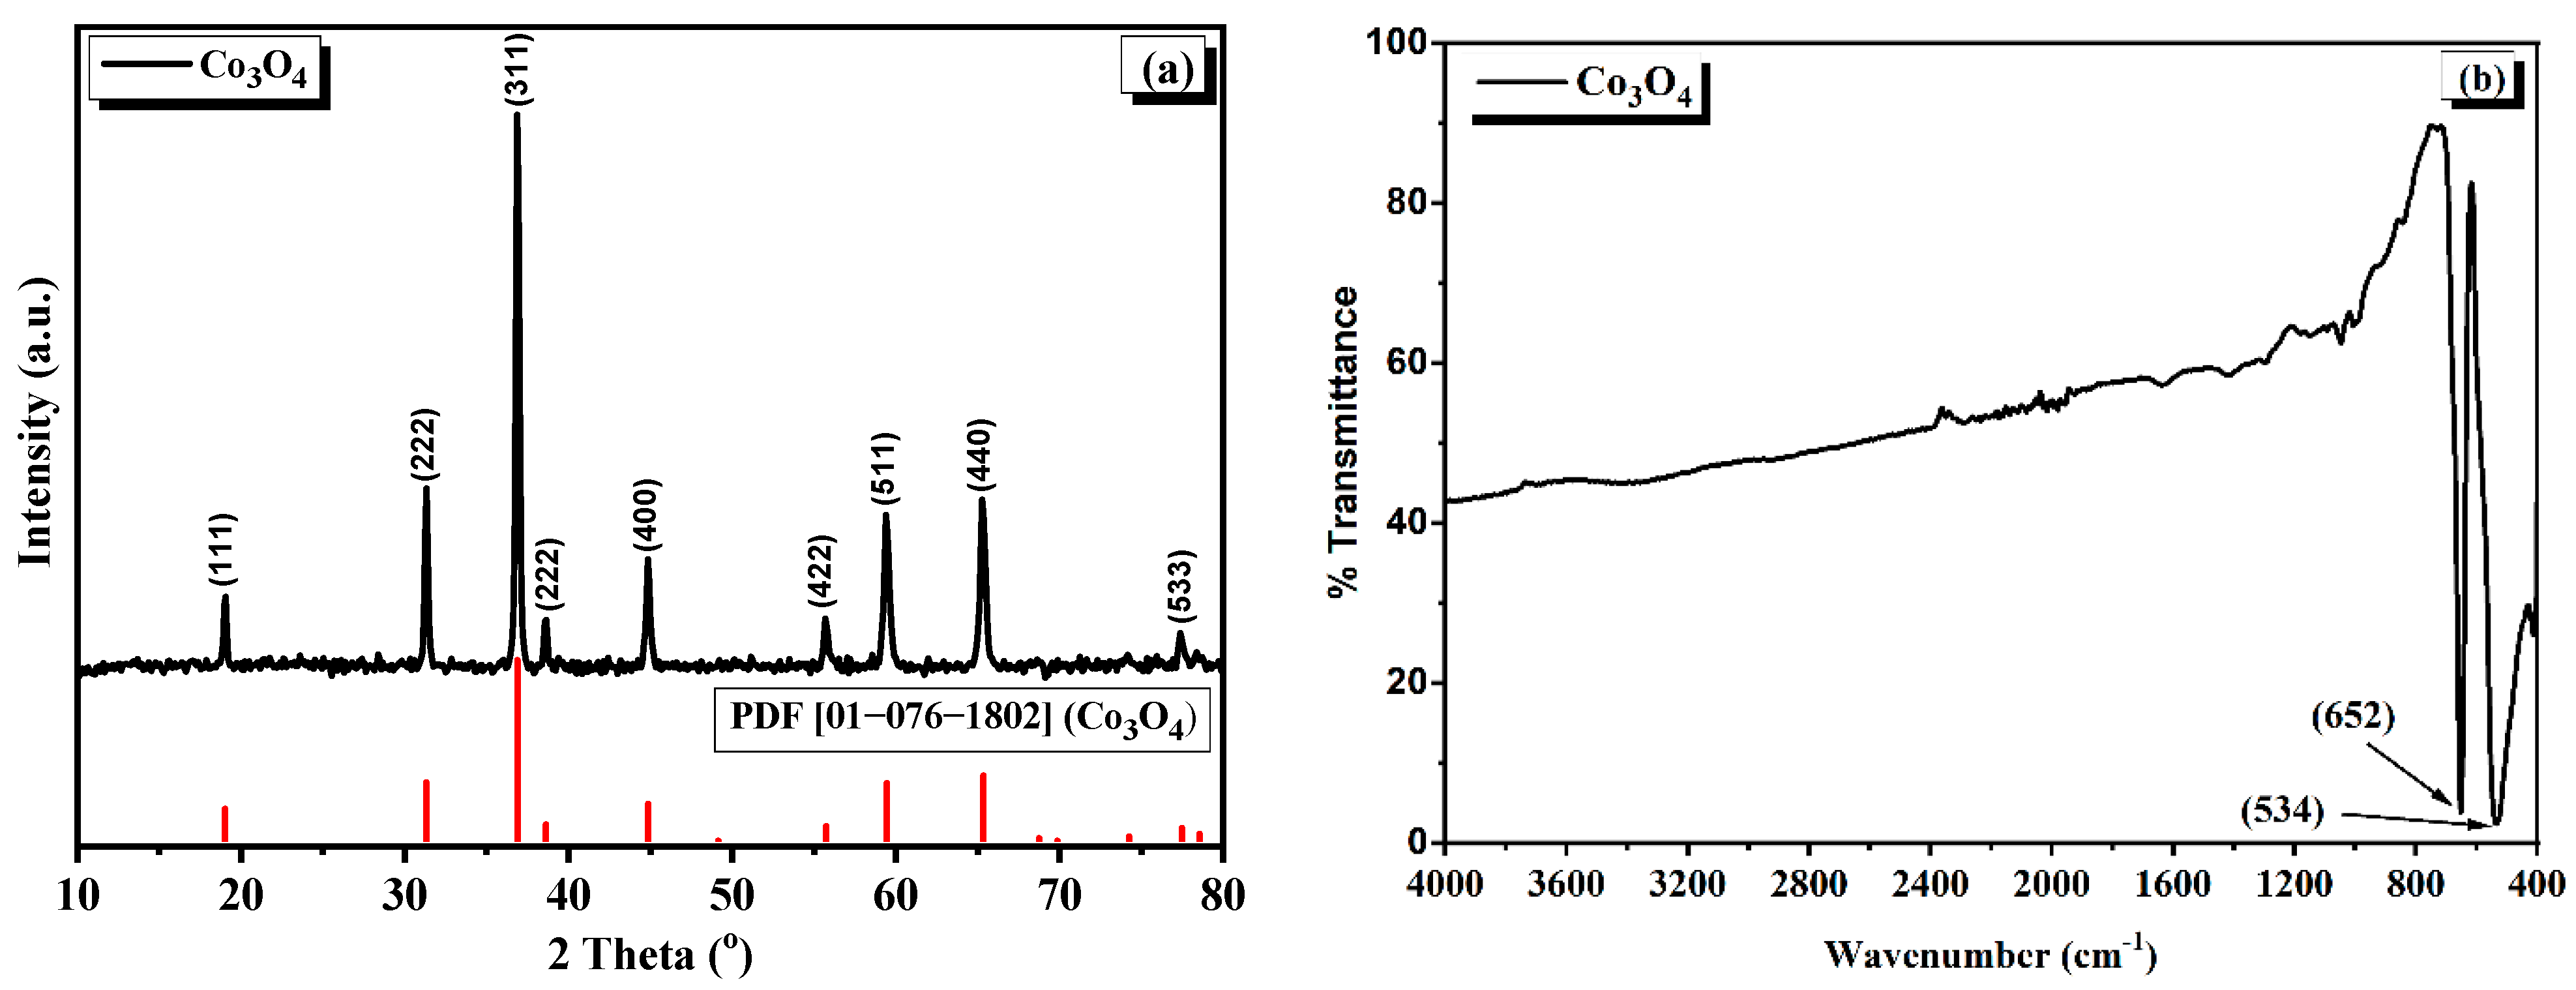
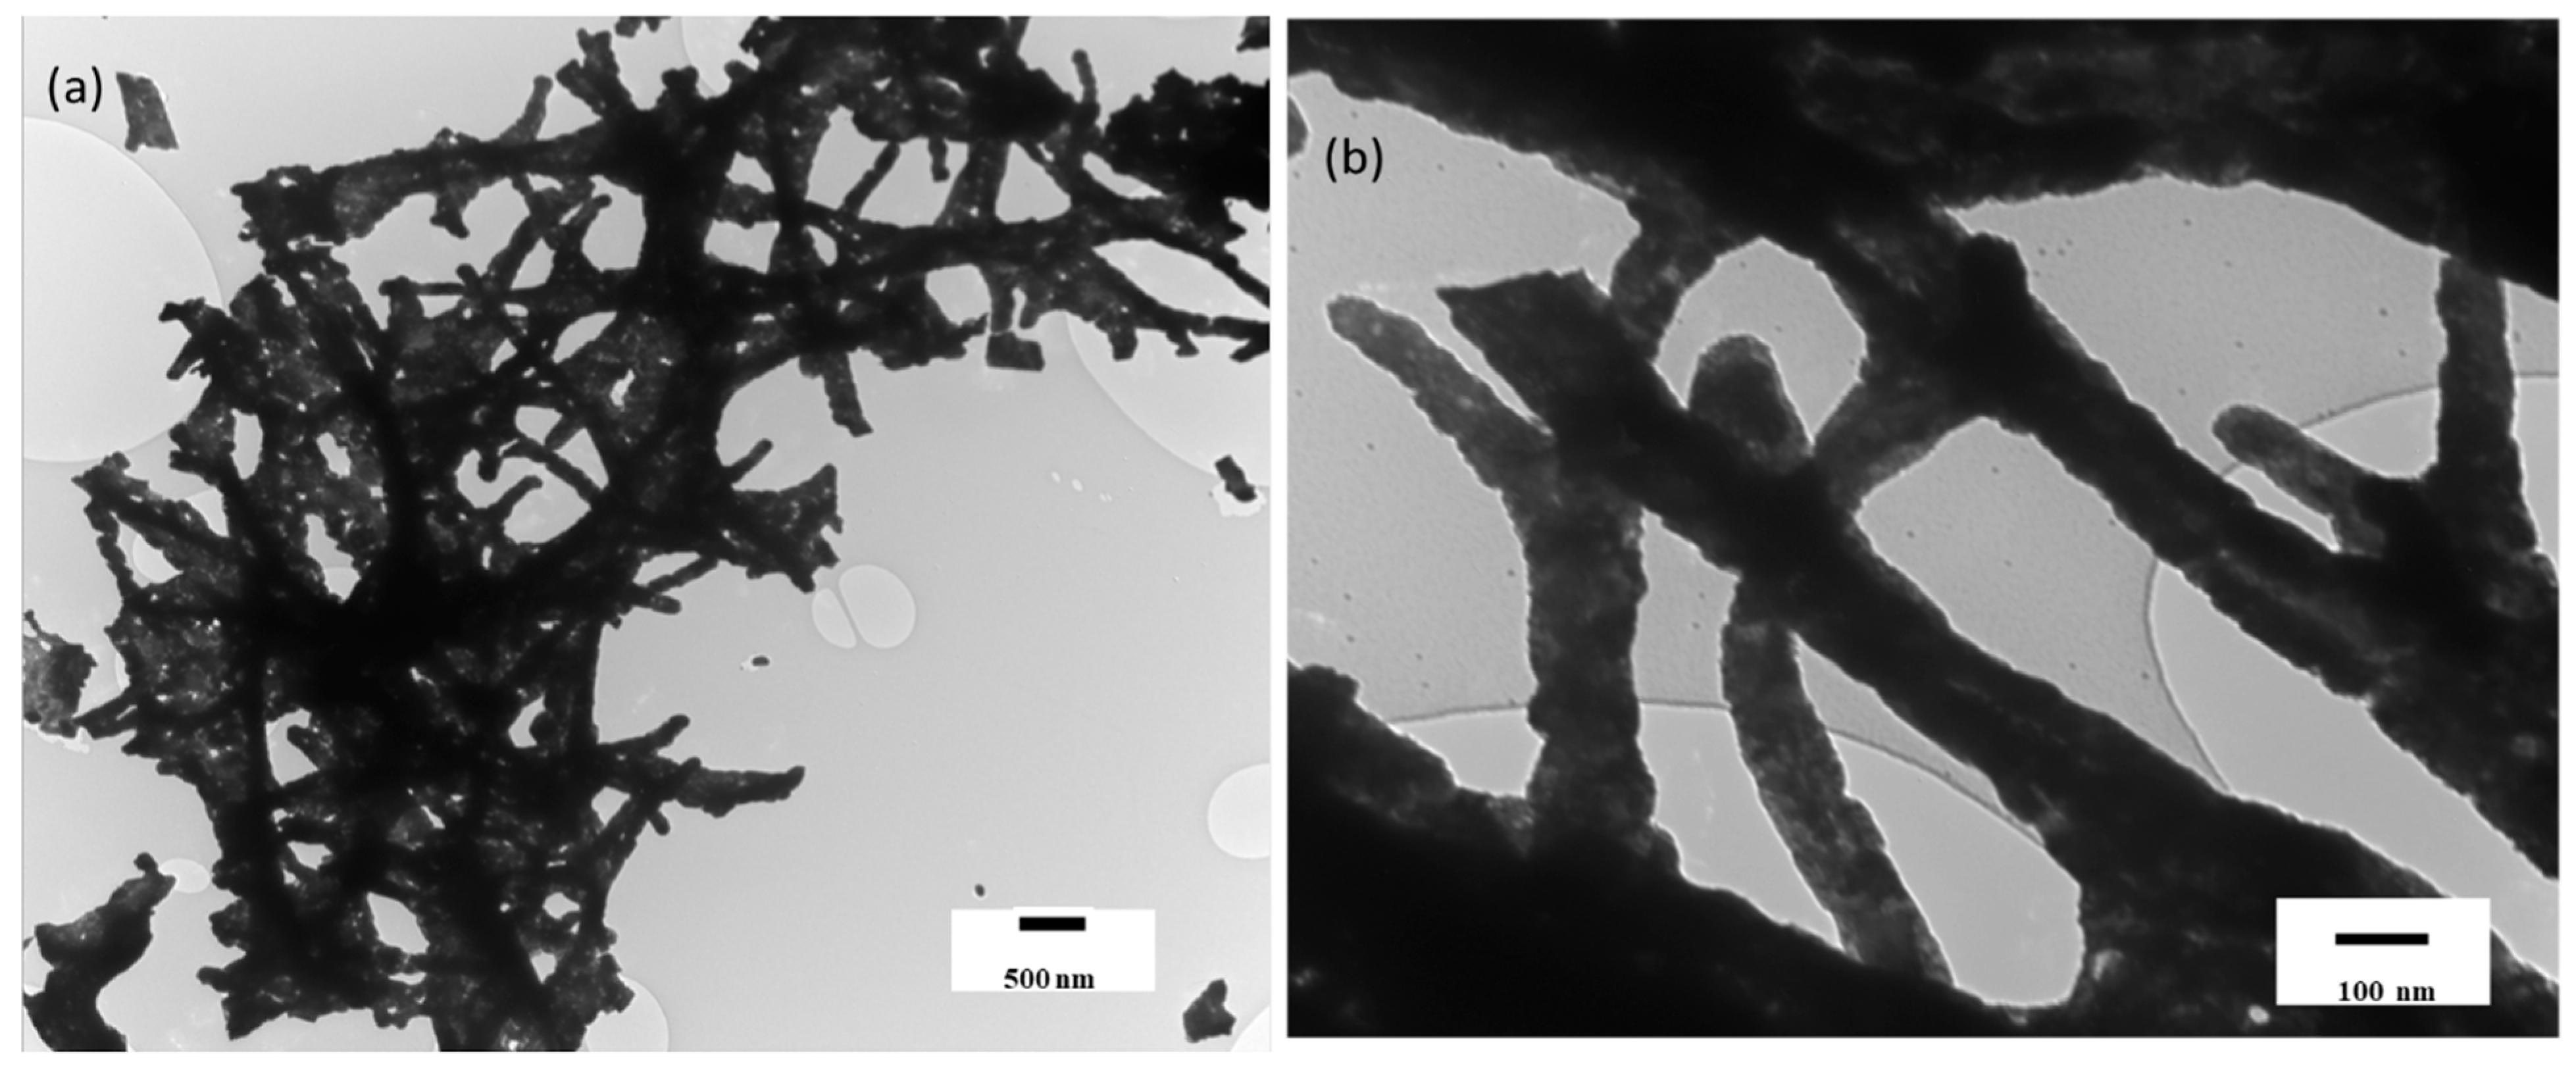
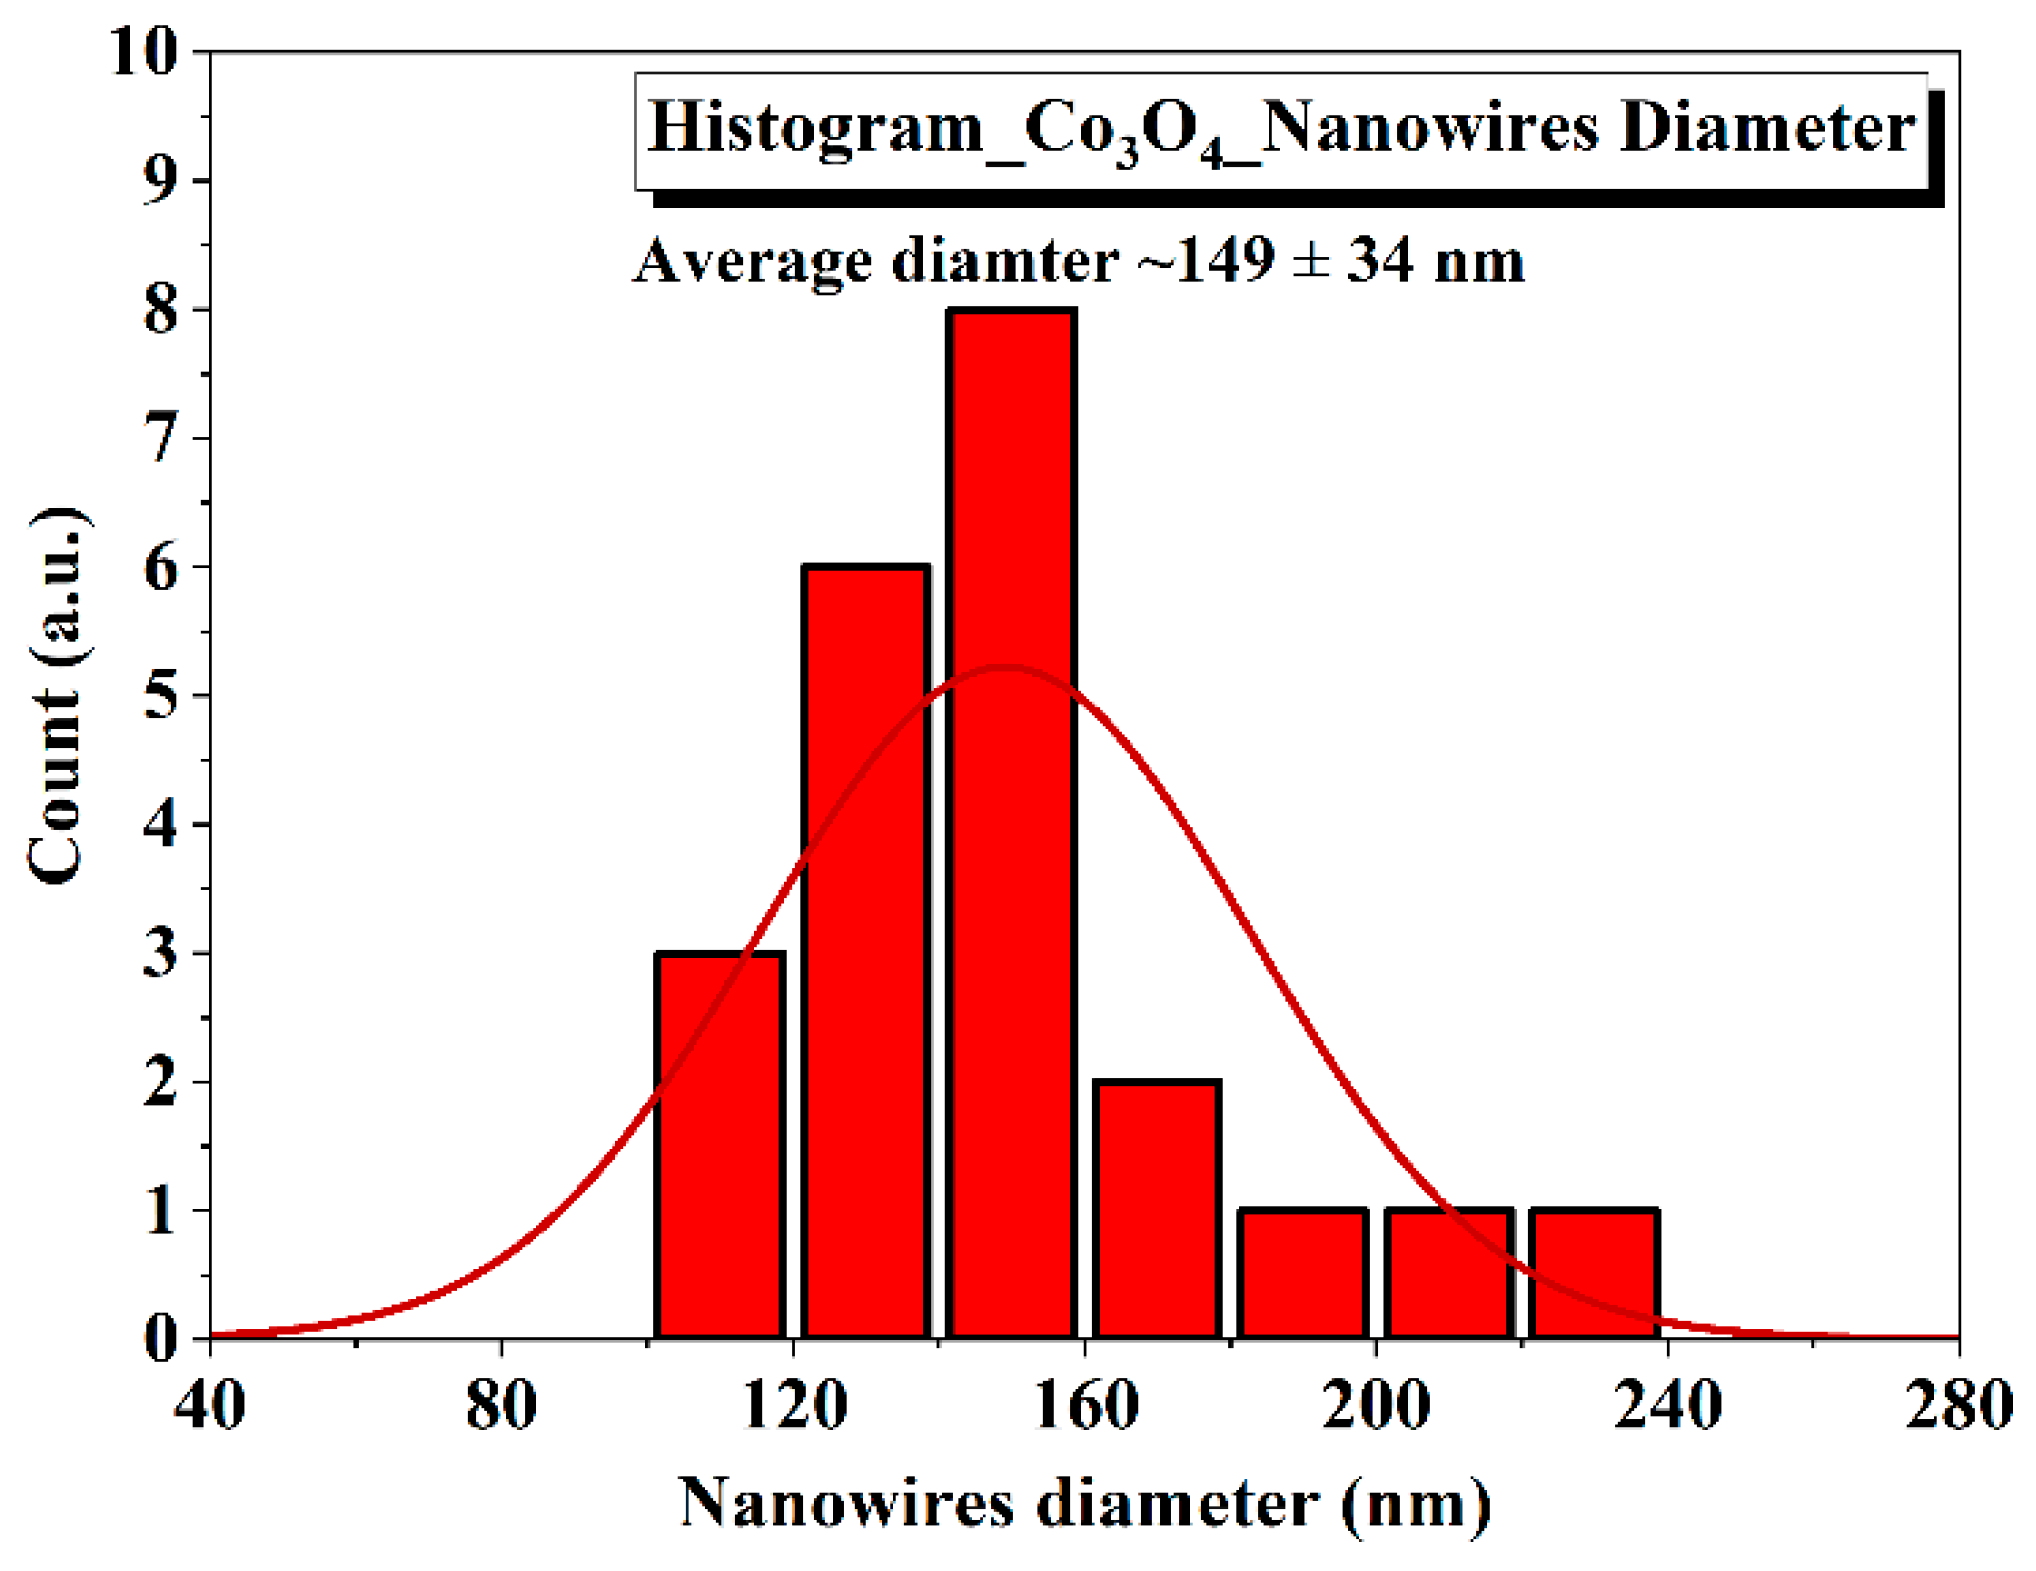
3.1. Analysis of Co3O4 Nanostructures

The XRD pattern of Co3O4 is given in Figure 1a, which was evaluated for phase identification and the nature of the crystallinity. The diffraction pattern of the Co3O4 nanostructures correspond to the crystalline phase of Co3O4 upon matching with the standard (powder diffraction file (PDF) number 01-076-1802), which possesses a cubic spinel crystal system having space group and space group number of Fd3m and 227, respectively. The reflections in the diffraction pattern of Co3O4 appeared at 2theta positions of 19.02°, 31.31°, 36.90°, 38.60°, 44.88°, 55.74°, 59.45°, 65.34°, and 77.47° which correspond to their respective miller indices (111), (222), (311), (222), (400), (422), (511), (411), and (533), respectively [23]. It is clear from the XRD pattern that there are no impurities present in the Co3O4 nanostructures, as the peaks that appeared are only in the cubic spinel phase of Co3O4. Furthermore, the broad hump-like peak usually appears for polymeric materials; in this case, PVF in the XRD patterns is also absent, showing that the electrospun-polymer was removed completely at the selected calcination temperature. The crystallite size was calculated by using Scherrer’s formula, Equation (1).
L c = 0.9 λ β c o s 2 θ
The mean crystallite size of Co3O4 nanostructures was calculated by using Equation (1) and found to be 18.15 nm.
The FTIR spectrum of the crystalline Co3O4 nanostructures is given in Figure 1b. In addition to the XRD studies, the FTIR study also confirms the formation of spinel-type Co3O4 nanowires. In the given FTIR spectrum, there are two prominent absorption bands appearing at 534 cm−1 and 652 cm−1. The absorption band appearing at 534 cm−1 is assigned to the Co-O vibration of the B-O atoms (where B is Co3+) setting in the octahedral sites of the cubic spinel lattice, and the second absorption band at 652 cm−1 is assigned to the vibration of the Co-O of A-O atoms (where A is Co2+) setting in the tetrahedral sites of the spinel lattice [1]. No other peaks could be seen in the FTIR spectrum, indicating that the PVP polymer was completely removed at the selected temperature regime.
The morphology of the Co3O4 nanostructures was studied by TEM, which confirms that the synthesized material is obtained in the form of ID nanostructures. The low- and high-magnification TEM images can be seen in Figure 2a,b, respectively. The surface of these 1D Co3O4 nanostructures looks compact, grainy, and rough at the edges, while some of the nanostructures have collapsed, which normally happens during the process of calcination. The roughness in the nanowires normally comes due to the elimination of the solvent molecules and PVP, after which the grains fill the space, and the surface becomes rough. The lengths of these nanowires are more than a micrometer (µm), while their diameters range between 104 nm and 194 nm. These 1D nanostructures of Co3O4 are interwoven, forming a matt-like structure with an enhanced surface area, which will be beneficial in strengthening the PDVF films when mixed with it, providing a better surface interaction.
A histogram diagram which is presented in Figure 3 was plotted to present the average diameter (nm) of Co3O4 nanostructures. The average diameter calculated from the histogram was 149 ± 34 nm (Figure 3).

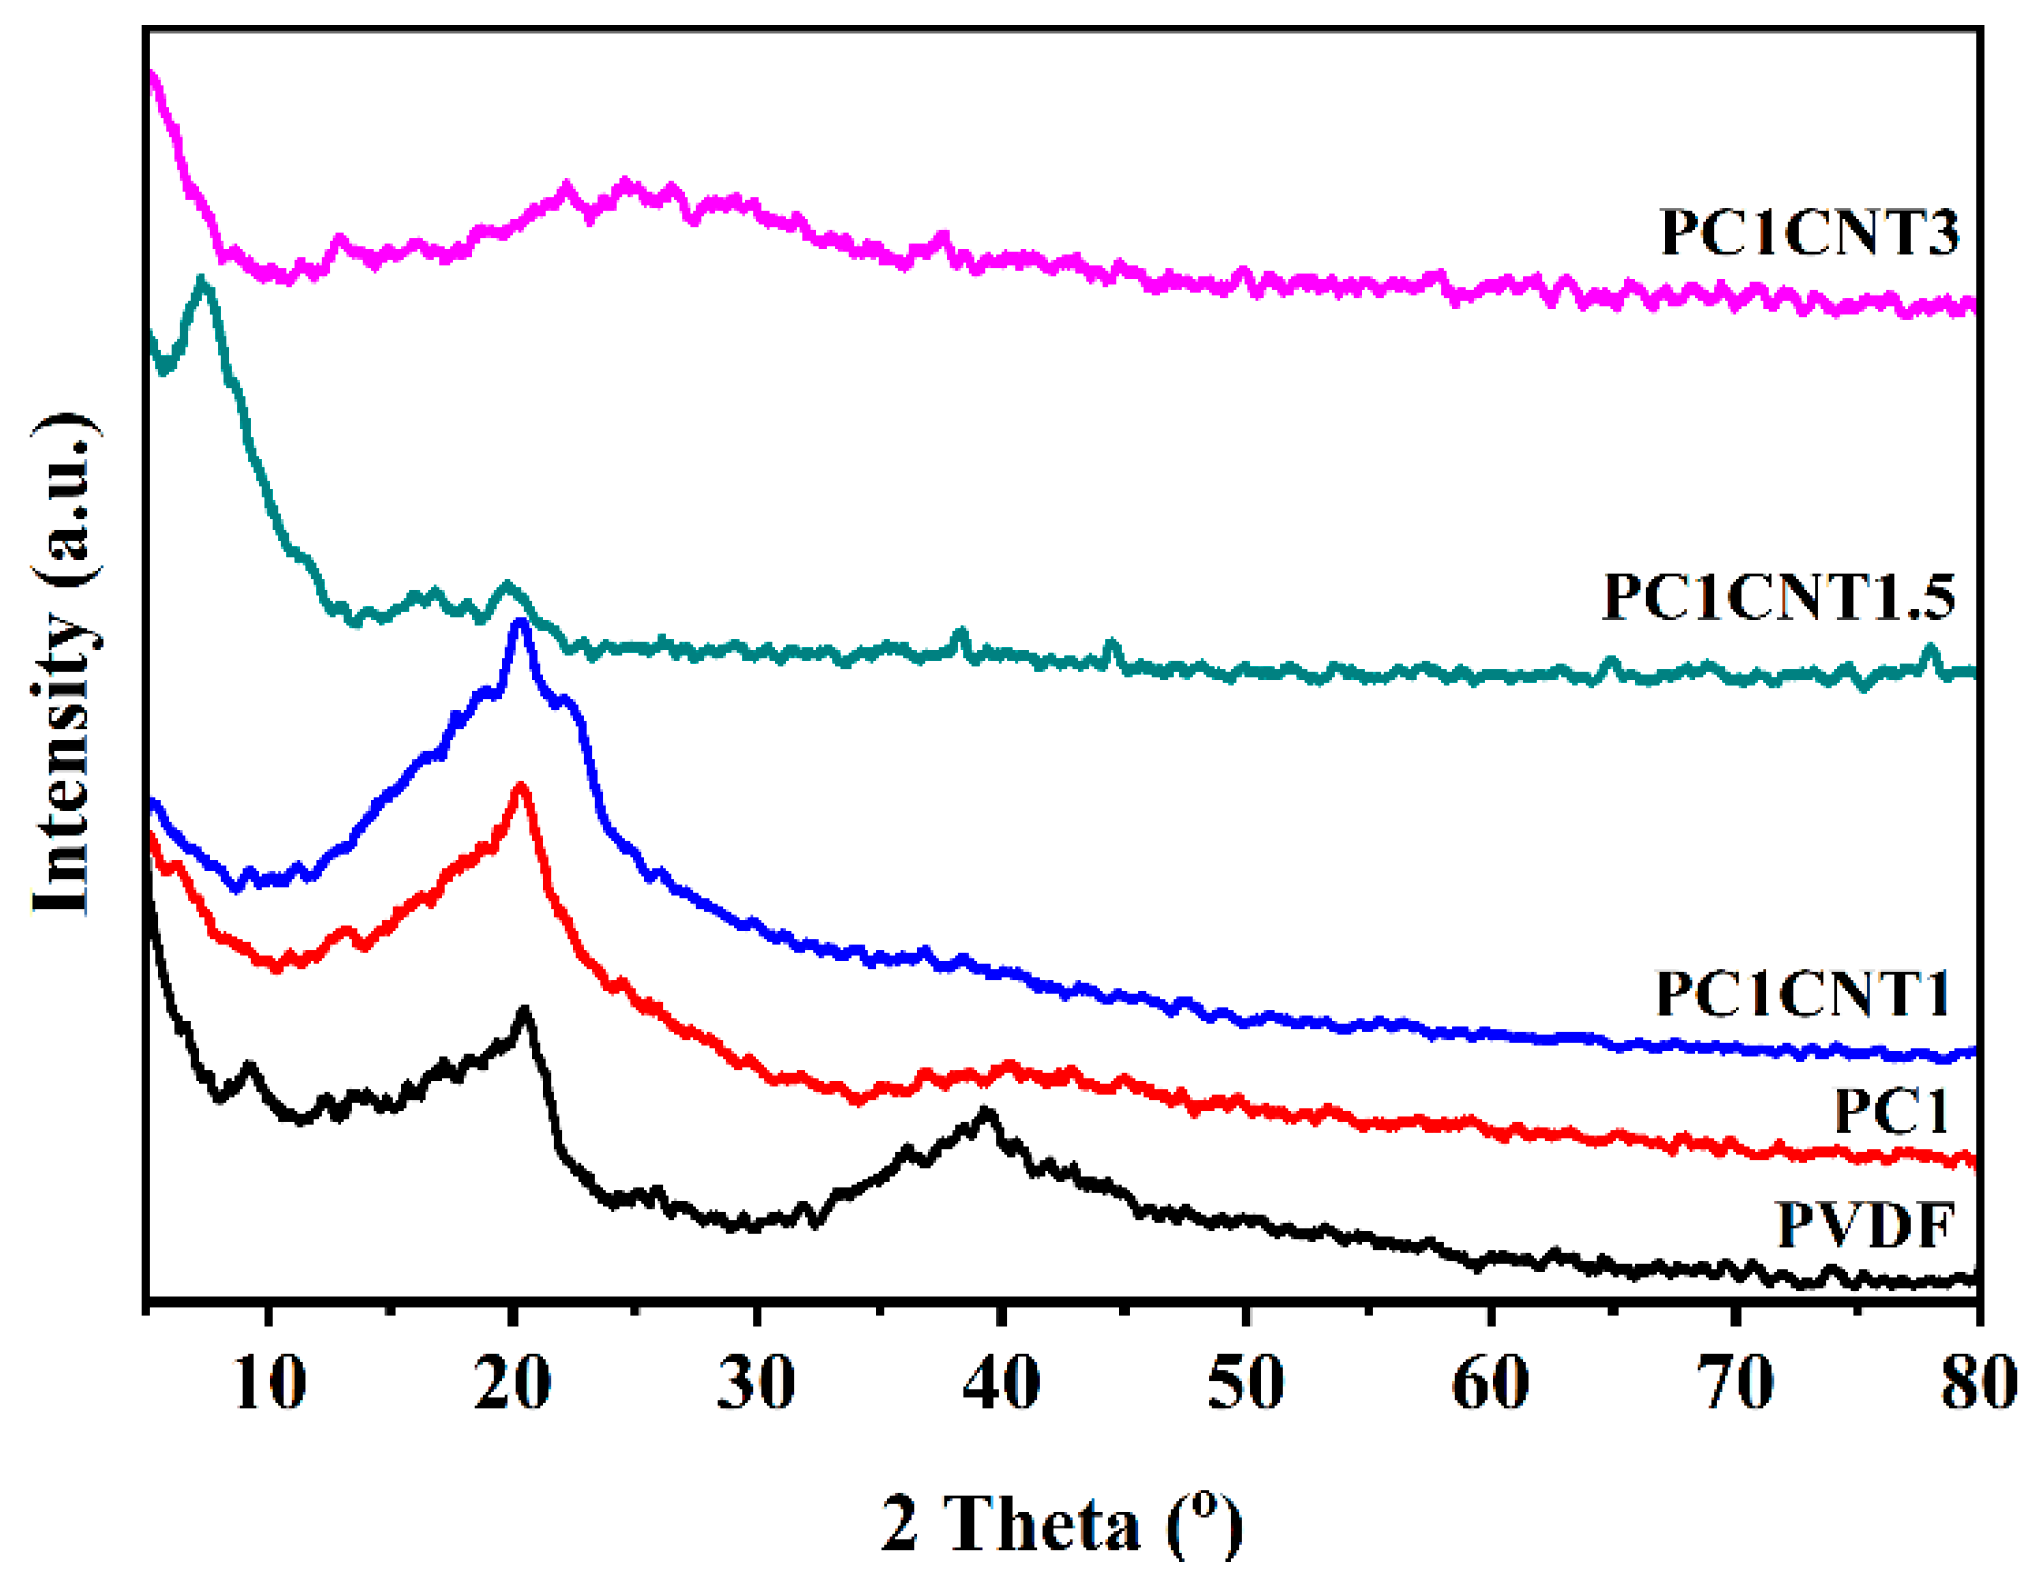
3.2. Structural Analysis of PVDF Nanocomposite Films
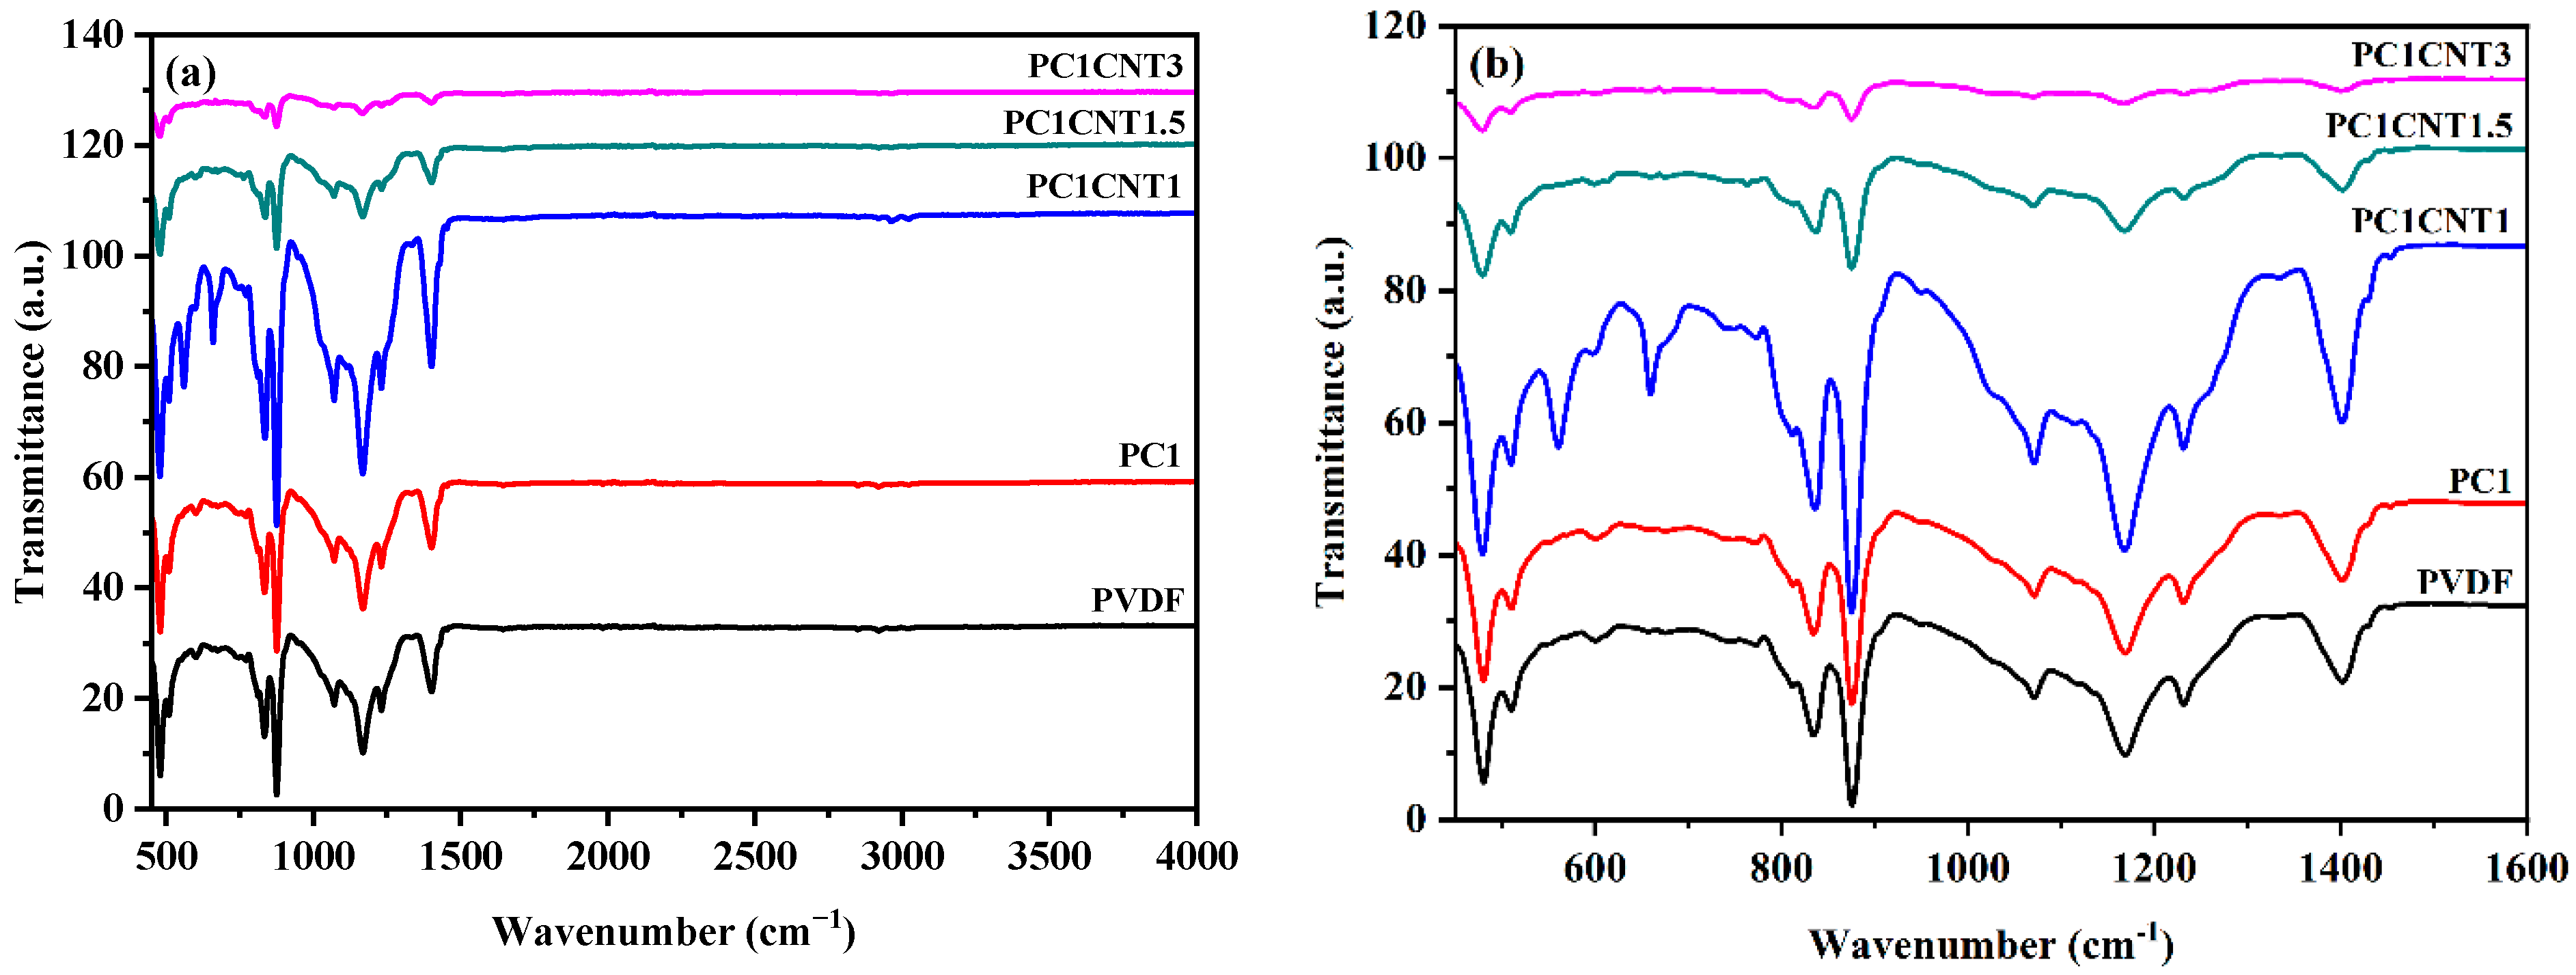
The XRD analysis was performed over the nanocomposites to see the effect of the filler and co-fillers, i.e., Co3O4 nanostructures and Co3O4/f-MWCNTs over the crystallinity of the PVDF nanocomposites. Figure 4 shows the XRD patterns of pure (blank) PVDF, Co3O4/PVDF, and Co3O4-f-MWCNTs/PVDF films in the range of 2theta 5° to 80°. The diffractogram of pure PVDF shows two diffraction peaks at 20.5° and 39.3°, respectively. The peak at 2θ of 20.5° refers to the typical α-phase PVDF, while the peak at 39.3° refers to the (γ) phase PVDF [23,24,25,26]. In the XRD pattern of the Co3O4/PVDF nanocomposites, one can see that, on the one hand, the diffraction peak at 20.5° has become less intense, and on the other, the peak at 39.43° has nearly vanished. Furthermore, the β-phase peak intensified and showed higher intensity than that which appeared in pure PVDF. This peak appearing at 2theta shows that upon the addition of Co3O4 nanostructures, a significant transformation from α- to β-phase occurred. Furthermore, the technologically less-important γ-phase no longer exists.
The XRD pattern of the PC1CNT1 membrane shows one distinct peak at the 2θ position of 20.2° with little deviation from pure PVDF showing reflection for (110). In the XRD pattern of PC1CNT1.5, the intensity of the main peak of PVDF reduces greatly, and two new peaks develop at the 2θ position of 7.60 and 16.45. The peak at 7.60 is of high intensity, and the peak at 16.96 is comparatively of low intensity. These new peaks appearing as a consequence of the reinforcement of the composite with nano-fillers correspond to the formation of β-phase PVDF. Similarly, the intensity of peaks for α-phase PVDF decreases upon increasing the concentration of the nano-fillers in the resulting composite films (Figure 4). Furthermore, in the case of PC1CNT3, the XRD pattern gives three low intensities peaks at 2θ positions of 13.23°, 22.27°, and 37.40°. The peak showing the reflection plane (110/200) of the polar β-phase PVDF could be seen in the XRD patterns of all the PVDF nanocomposite-loaded fillers, and the intensity of this peak increased with the increasing number of nano-fillers. From the XRD data, it is obvious that the transformation of α- to β-phase PVDF occurs upon loading of nano-fillers into the nanocomposite on the one hand, and on the other hand, the crystallinity of the resulting films improves.

3.3. FTIR Analysis

FTIR analysis was carried out to see the effect of the nano-fillers incorporation into the crystal structure and crystallinity of the PVDF films. The FTIR spectra of the blank PVDF film and various wt.% nano-fillers loaded PVDF nanocomposite films are given in Figure 5. The pure PVDF FTIR spectrum shows various absorption peaks at a wavenumber of 479 cm−1, 509 cm−1, 600 cm−1, 876 cm−1, 1166 cm−1, and 1400 cm−1, which corresponds to those reported in the literature [27,28,29]. However, upon the addition of nano-fillers, the peaks for the α- and γ-phase weakened or diminished, and new bands at 559 cm−1, 659 cm−1, and 772 cm−1 appeared. These new peaks correspond to the β- phase PVDF and are thus an indication of the formation of the β- phase [30,31]. The intensities of the β- phase PVDF peaks increase with the increasing nano-fillers content in the resulting nanocomposites. The FTIR results are in good agreement with the XRD data and show that the crystallinity of PVDF was enhanced with the addition of nano-fillers. Furthermore, the amount of β-phase in the resulting PVDF nanocomposites was enhanced.

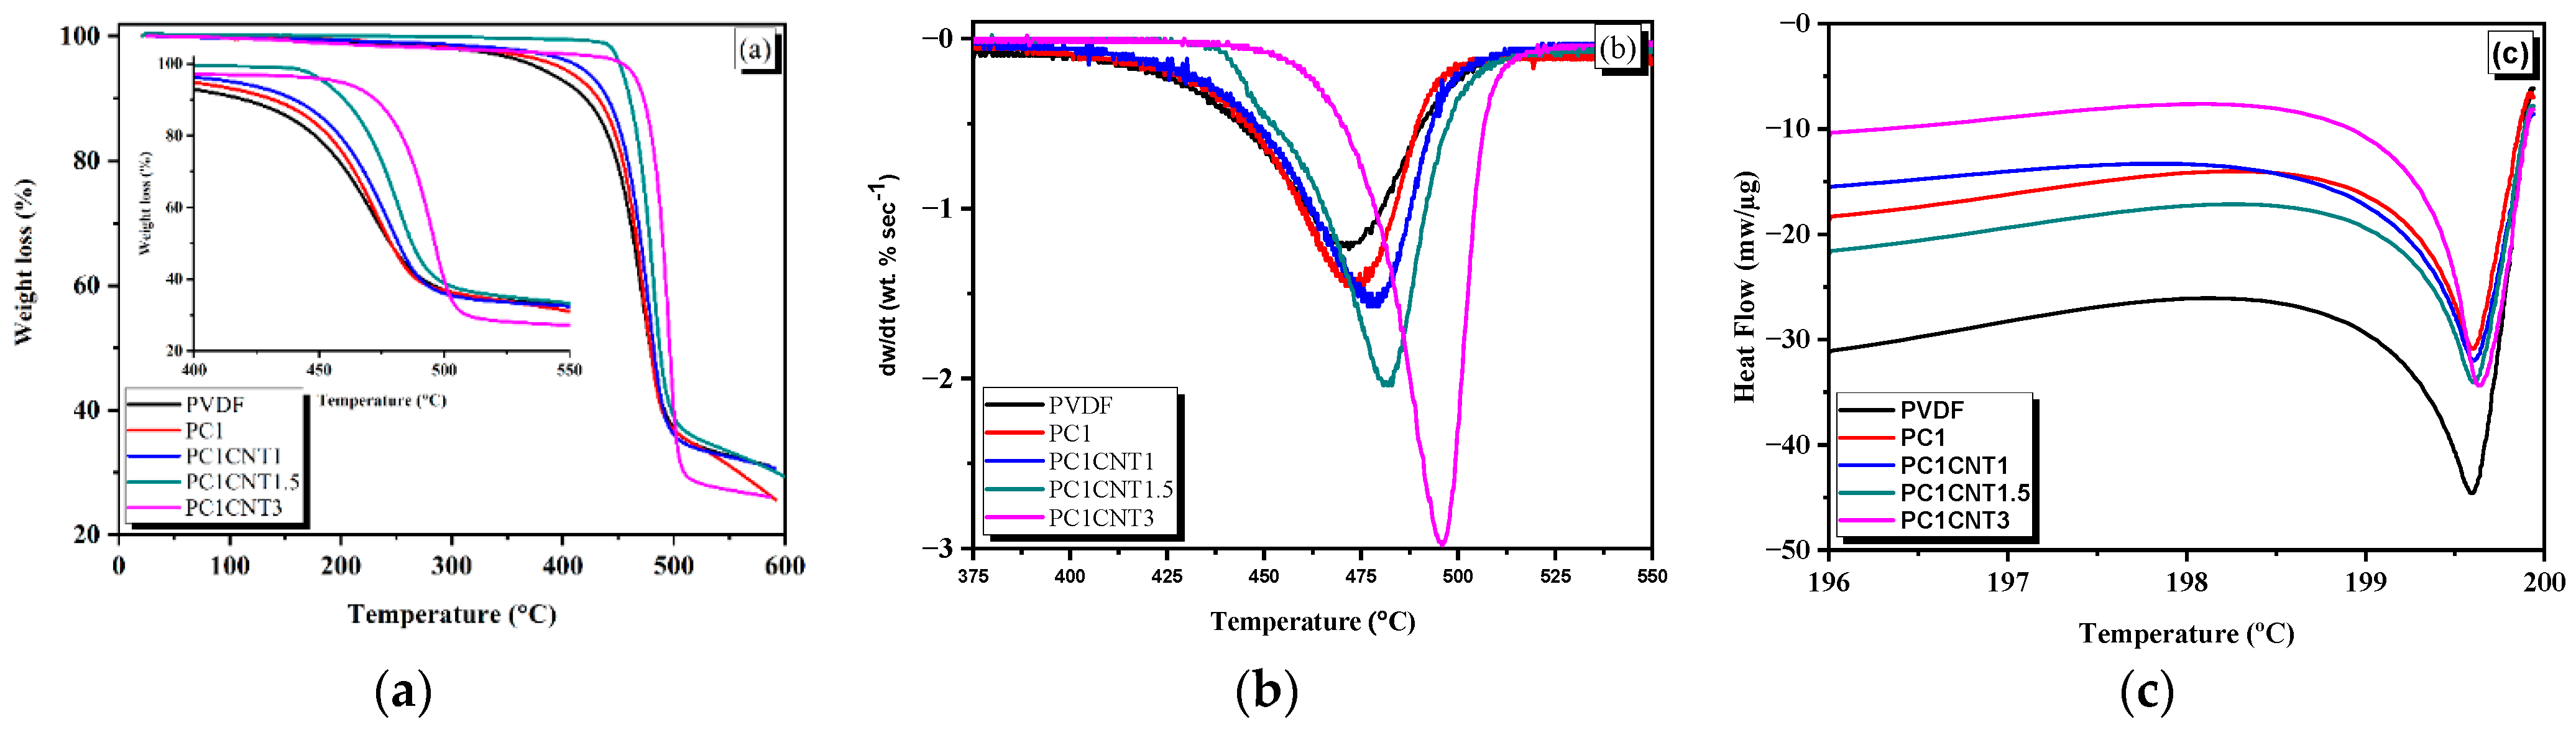
3.4. Thermal Analysis of PVDF Nanocomposite Films

The prepared nanocomposite films of PVDF with single (Co3O4) and co-nano-fillers (Co3O4/f-MWCNTs) were subjected to thermal analysis in order to see the impact of these nano-fillers upon the thermal behavior of the prepared films. Figure 6a shows the TGA curves of blank PVDF film and its nanocomposites. The films were heated continuously from 25 °C to 600 °C with a heating rate of 10 °C min−1. As shown in Figure 6a, the blank film of the PVDF is stable up to 340 °C, after which it follows a one-step degradation. The total weight loss calculated is approximately 66%. The residue may be carbonaceous material as the degradation was carried out under an N2 atmosphere. The nanocomposite films of PVDF under study are also showing a single-step thermal degradation process similar to that of the pure PVDF. However, there is a significant difference in the thermogram of pure PVDF and those of nanocomposite films in terms of their thermal degradation temperature and the remaining residue. The TGA pattern of PC1 (Co3O4/PVDF nanocomposite) shows an onset temperature (Tonset = 374 °C) higher than that of pure PVDF while lesser weight loss (~60%).
The thermal stability of PVDF increases upon the formation of its nanocomposites with the nano-fillers. An increase in the thermal stability of the polymers upon reinforcing with fillers was also observed previously [32,33,34,35]. Furthermore, the thermal stability increases with increasing the amount of the nano-fillers in the resulting nanocomposites. As can be seen in Figure 6a, Tonset was enhanced to 401 °C, 440 °C, and 449 °C upon PVDF nanocomposite formation with Co3O4/(0.1 wt.%)f-MWCNTs, Co3O4/(0.15 wt.%)f-MWCNTs and Co3O4/(0.3 wt.%)f-MWCNTs, respectively. The shift in Tonset corresponds to the better interaction of the polymer with the nano-fillers. Mendes et al. [2] explained that the enhancement in thermal degradation temperature was as a result of the increased wt.% of silica on the basis that silica nanoparticles do not allow the volatility of the decomposed product during pyrolysis, hence restricting the continuous decomposition of PVDF. The other reason for this high stability against thermal degradation may be due to the large number of ceramic particles that provide effective thermal shielding. Here in our case, the strong interaction between the nano-fillers and the polymer chains enabled the resulting nanocomposites to withstand heating.
The differential thermal analysis (DTA) data of the pure PVDF film and its nanocomposites (Co3O4/PVDF and Co3O4/f-MWCNTs/PVDF) are presented in Figure 6b. The peak temperatures (Tp) of all the samples were analyzed, and it was observed that the Tp of PVDF increases with the addition of nano-fillers as well as the concentration of nano-fillers. The values of different temperatures are given in Table 2.
Furthermore, the thermal behavior of pure PVDF and its nanocomposites with Co3O4 (PC1) and Co3O4/f-MWCNTs (0.1 wt.% PC1CNT1, 0.15 wt.% PC1CNT2, and 0.3 wt.% PC1CNT3) were carried out by DSC at a heating rate of 20 °C/min. The DSC thermograms are presented in Figure 6c. The aim of the DSC analysis was to study in detail the phase change of PVDF upon the loading of nano-fillers [36]. The DSC study of the Co3O4/PVDF and Co3O4/f-MWCNTs nanocomposites shows that the melting temperature (Tm) of PVDF increases upon the addition of nano-fillers and their concentration compared to that of pure PVDF film. Although the increase in melting temperature is small, a trend is clearly shown. This increase in Tm as a function of the addition of nano-fillers and their concentration is corroborated by the phase change of PVDF from α to β, which is further owed to the better distribution of reinforcement in the polymer matrix. [37,38]. The pertinent values of the Tm are given in Table 2.

3.5. Electrical Behavior of PVDF Nanocomposites Films

The prepared PVDF films with an incorporated amount of Co3O4 and Co3O4/f-MWCNTs nano-fillers were studied for their electrical properties, and the pertinent data are presented in Figure 7a,b. The DC-conductivity of PVDF in the resulting Co3O4/PVDF and Co3O4/f-MWCNTs/PVDF nanocomposite films were measured in the frequency range of 2.5 × 101 Hz to 2.00 × 10⁶ Hz at room temperature. Pure PVDF has shown very-low conductivity, i.e., 1 × 10⁻⁶ (S/m), which shows a decreasing trend as the frequency enhances (Figure 7a). Similarly, DC conductivity is also negligible in the case of PC1 (Co3O4/PVDF) and PC1CNT1 (Co3O4/(0.1 wt.%)f-MWCNTs/PVDF). However, a very good DC conductivity is shown by the PVDF nanocomposites with nanofillers containing 0.15 wt.% (sample PC1CNT1.5) and 0.3 wt.% (sample PC1CNT3) f-MWCNTs (Figure 7a); as was the case with pure PVD, PC1, and PC1CNT1, the DC-conductivities of samples PC1CNT2 and PC1CNT3 also decreased with increasing frequency, initially very quickly, and then slowly. The higher values of DC-conductivity in the cases of PC1CNT1.5 and PC1CNT3 could correspond to the increase in polar, i.e., the β-phase of PVDF in the resulting nanocomposites.
The dielectric loss (tan δ) is a critical quantity for the fabrication of electrical storage devices. In this regard, the dielectric losses of the resulting Co3O4/PVDF and PVDF/Co3O4/f-MWCNTs nanocomposite films were measured at room temperature and plotted as a function of frequency (Figure 7b). As shown in Figure 7b, the tan δ of pure PVDF as well as of the nanocomposites (Co3O4/PVDF and Co3O4/f-MWCNTs/PVDF) films decreases with increasing frequency. No strong fluctuation in tan δ was observed. This indicates the strong interfacial polarization along the surface of PVDF polymer, whichs follow the Maxwell–Wagner–Sillars (MWS) polarization effect [39,40].

4. Conclusions

The pure form of PVDF polymer mostly exists in the α-phase. However, the phase of the polymer can be modified by reinforcing it with suitable nano-fillers. We present here the successful transformation of PVDF from the pre-dominant α-phase to achieve PVDF nanocomposites with a dominant β-phase. To benefit from their anisotropic properties, we have employed 1D nanostructures as nano-fillers. The 1D Co3O4 nanostructures were prepared by using an electrospinning technique, while the MWCNTs were functionalized to achieve a better dispersion in the PVDF matrix. The synthesized Co3O4/PVDF and Co3O4/f-MWCNTs/PVDF nanocomposites were characterized by different techniques. The crystal phase transformation and the improvement in crystallinity were confirmed by XRD. Furthermore, FTIR spectroscopy was also used to confirm the formation of dominant β-phase PVDF in the resulting nanocomposites. The thermal stability of the resulting PVDF nanocomposite films was followed by TGA, DTA, and DSC. It was found that the thermal stability of PVDF is significantly enhanced by reinforcement with mono- and bi-nano-fillers. The electrical properties were studied using impedance spectroscopy, and it was found that the DC-conductivity of the nanocomposites increased with increasing nano-fillers content. The enhancement of DC conductivity and the decrease in tan δ with the addition of nano-fillers to PVDF corresponded to the even dispersion of the fillers and co-fillers in the polymer matrix, owing to the strong interfacial interactions of nano-fillers and the polymer. Owing to the enhanced thermal and electrical properties, the fabricated nanocomposites could be used in electronics such as sensors and capacitors.

Author Contributions

Conceptualization: H.U. and S.A.; methodology, F., Z.U.R. and I.U.; software, F.; validation, H.U., S.A., M.N. and A.P.; formal analysis, F.; investigation, F.; resources, H.R.A., H.U., S.A., M.S.J.; data curation, F., S.A., H.U. and N.S.A.; writing—original draft preparation, F., H.U. and Z.U.R.; writing—review and editing, S.A., M.N., A.P., H.R.A., N.S.A. and M.S.J.; visualization, F., H.U., Z.U.R. and M.S.J.; supervision, S.A. and H.U.; project administration, S.A., H.U., H.R.A. and M.S.J.; funding acquisition, H.R.A., N.S.A. and M.S.J. All authors have read and agreed to the published version of the manuscript.

Funding

This research was funded by the Deanship of Scientific Research at Umm Al-Qura University by Grant Code/ number (22UQU4281760DSR01). And this research was also funded by Princess Nourah bint Abdulrahman University Researchers Supporting Project Number (PNURSP2022R19), Princess Nourah bint Abdulrahman University, Riyadh, Saudi Arabia.

Institutional Review Board Statement

Not applicable.

Informed Consent Statement

Not applicable.

Data Availability Statement

Not applicable.

Acknowledgments

The authors would like to thank the Deanship of Scientific Research at Umm Al-Qura University for supporting this work by Grant Code (22UQU4281760DSR01). This research was also funded by Princess Nourah bint Abdulrahman University Researchers Supporting Project Number (PNURSP2022R19), Princess Nourah bint Abdulrahman University, Riyadh, Saudi Arabia. M.S. Javed acknowledge the Supporting Fund for Young Researchers and Supercomputing Center of Lanzhou University.

Conflicts of Interest

The authors declare no conflict of interest.

References

  1. Safarpour, M.; Khataee, A.; Vatanpour, V. Effect of reduced graphene oxide/TiO2 nanocomposite with different molar ratios on the performance of PVDF ultrafiltration membranes. Sep. Purif. Technol. 2015, 140, 32–42. [Google Scholar] [CrossRef]
  2. Chang, X.; Wang, Z.; Quan, S.; Xu, Y.; Jiang, Z.; Shao, L. Exploring the synergetic effects of graphene oxide (GO) and polyvinylpyrrodione (PVP) on poly(vinylylidenefluoride) (PVDF) ultrafiltration membrane performance. Appl. Surf. Sci. 2014, 316, 537–548. [Google Scholar] [CrossRef]
  3. Gregorio, R., Jr. Determination of the α, β, and γ crystalline phases of poly (vinylidene fluoride) films prepared at different conditions. J. Appl. Polym. Sci. 2006, 100, 3272–3279. [Google Scholar] [CrossRef]
  4. Kim, I.-H.; Baik, D.H.; Jeong, Y.G. Structures, electrical, and dielectric properties of PVDF-based nanocomposite films reinforced with neat multi-walled carbon nanotube. Macromol. Res. 2012, 20, 920–927. [Google Scholar] [CrossRef]
  5. Javed, M.S.; Shah, S.S.A.; Najam, T.; Siyal, S.H.; Hussain, S.; Saleem, M.; Zhao, Z.; Mai, W. Achieving high-energy density and superior cyclic stability in flexible and lightweight pseudocapacitor through synergic effects of binder-free CoGa2O4 2D-hexagonal nanoplates. Nano Energy 2020, 77, 105276. [Google Scholar] [CrossRef]
  6. Ameduri, B. From Vinylidene Fluoride (VDF) to the Applications of VDF-Containing Polymers and Copolymers: Recent Developments and Future Trends. Chem. Rev. 2009, 109, 6632–6686. [Google Scholar] [CrossRef] [PubMed]
  7. Begum, S.; Ullah, H.; Kausar, A.; Siddiq, M.; Aleem, M.A. Epoxy functionalized multi-walled carbon nanotubes/polyvinylidene fluoride nanocomposites: Microstructure, morphology, thermal, piezoelectricity and conductivity investigations. Polym. Compos. 2019, 40, e776–e794. [Google Scholar] [CrossRef]
  8. Begum, S.; Ullah, H.; Kausar, A.; Siddiq, M.; Aleem, M.A. Fabrication of epoxy functionalized MWCNTs reinforced PVDF nanocomposites with high dielectric permittivity, low dielectric loss and high electrical conductivity. Compos. Sci. Technol. 2018, 167, 497–506. [Google Scholar] [CrossRef]
  9. Sorayani Bafqi, M.S.; Bagherzadeh, R.; Latifi, M. Fabrication of composite PVDF-ZnO nanofiber mats by electrospinning for energy scavenging application with enhanced efficiency. J. Polym. Res. 2015, 22, 130. [Google Scholar] [CrossRef]
  10. Levi, N.; Czerw, R.; Xing, S.; Iyer, P.; Carroll, D.L. Properties of Polyvinylidene Difluoride−Carbon Nanotube Blends. Nano Lett. 2004, 4, 1267–1271. [Google Scholar] [CrossRef]
  11. Ojha, S.; Paria, S.; Karan, S.K.; Si, S.K.; Maitra, A.; Das, A.K.; Halder, L.; Bera, A.; De, A.; Khatua, B.B. Morphological interference of two different cobalt oxides derived from a hydrothermal protocol and a single two-dimensional metal organic framework precursor to stabilize the β-phase of PVDF for flexible piezoelectric nanogenerators. Nanoscale 2019, 11, 22989–22999. [Google Scholar] [CrossRef] [PubMed]
  12. Nam, H.M.; Seo, D.M.; Yun, H.D.; Thangavel, G.; Park, L.S.; Nam, S.Y. Transparent Conducting Film Fabricated by Metal Mesh Method with Ag and Cu@Ag Mixture Nanoparticle Pastes. Metals 2017, 7, 176. [Google Scholar] [CrossRef]
  13. Wei, Y.; Chu, H.-Q.; Dong, B.-Z.; Li, X.; Xia, S.-J.; Qiang, Z.-M. Effect of TiO2 nanowire addition on PVDF ultrafiltration membrane performance. Desalination 2011, 272, 90–97. [Google Scholar] [CrossRef]
  14. Huang, W.; Edenzon, K.; Fernandez, L.; Razmpour, S.; Woodburn, J.; Cebe, P. Nanocomposites of poly (vinylidene fluoride) with multiwalled carbon nanotubes. J. Appl. Polym. Sci. 2010, 115, 3238–3248. [Google Scholar] [CrossRef]
  15. Xia, Y.; Yang, P.; Sun, Y.; Wu, Y.; Mayers, B.; Gates, B.; Yan, H. One-dimensional nanostructures: Synthesis, characterization, and applications. Adv. Mater. 2003, 15, 353–389. [Google Scholar] [CrossRef]
  16. Joshi, R.K.; Schneider, J.J. Assembly of one dimensional inorganic nanostructures into functional 2D and 3D architectures. Synthesis, arrangement and functionality. Chem. Soc. Rev. 2012, 41, 5285–5312. [Google Scholar] [CrossRef] [PubMed]
  17. Nie, Z.; Petukhova, A.; Kumacheva, E. Properties and emerging applications of self-assembled structures made from inorganic nanoparticles. Nat. Nanotechnol. 2010, 5, 15–25. [Google Scholar] [CrossRef] [PubMed]
  18. Gonçalves, R.; Martins, P.M.; Caparrós, C.; Martins, P.; Benelmekki, M.; Botelho, G.; Barandiarán, J.M. Nucleation of the electroactive β-phase, dielectric and magnetic response of poly (vinylidene fluoride) composites with Fe2O3 nanoparticles. J. Non-Cryst. Solids 2013, 361, 93–99. [Google Scholar] [CrossRef]
  19. Liu, S.; Wang, J.; Shen, B.; Zhai, J. Enhanced discharged energy density and efficiency of poly (vinylidene fluoride) nanocomposites through a small loading of core-shell structured BaTiO3@Al2O3 nanofibers. Ceram. Int. 2017, 43, 585–589. [Google Scholar] [CrossRef]
  20. Song, Z.; Zhang, Y.; Liu, W.; Zhang, S.; Liu, G.; Chen, H.; Qiu, J. Hydrothermal synthesis and electrochemical performance of Co3O4/reduced graphene oxide nanosheet composites for supercapacitors. Electrochim. Acta 2013, 112, 120–126. [Google Scholar] [CrossRef]
  21. Son, M.Y.; Kim, J.H.; Kang, Y.C. Study of Co3O4 mesoporous nanosheets prepared by a simple spray-drying process and their electrochemical properties as anode material for lithium secondary batteries. Electrochim. Acta 2014, 116, 44–50. [Google Scholar] [CrossRef]
  22. Park, K.; Seo, D.; Lee, J. Conductivity of silver paste prepared from nanoparticles. Colloids Surf. A Physicochem. Eng. Asp. 2008, 313, 351–354. [Google Scholar] [CrossRef]
  23. Siyal, S.H.; Javed, M.S.; Ahmad, A.; Sajjad, M.; Batool, S.; Khan, A.J.; Akram, S.; Alothman, A.A.; Alshgari, R.A.; Najam, T. Free-standing 3D Co3O4@NF micro-flowers composed of porous ultra-long nanowires as an advanced cathode material for supercapacitor. Curr. Appl. Phys. 2021, 31, 221–227. [Google Scholar] [CrossRef]
  24. Datta, J.; Nandi, A.K. Cocrystallization of poly (vinylidene fluoride) and vinylidene fluoride-tetrafluoro-ethylene copolymer blends: 3. Structural study. Polymer 1997, 38, 2719–2724. [Google Scholar] [CrossRef]
  25. Okada, D.; Kaneko, H.; Kato, K.; Furumi, S.; Takeguchi, M.; Yamamoto, Y. Colloidal Crystallization and Ionic Liquid Induced Partial β-Phase Transformation of Poly (vinylidene fluoride) Nanoparticles. Macromolecules 2015, 48, 2570–2575. [Google Scholar] [CrossRef]
  26. Cai, X.; Lei, T.; Sun, D.; Lin, L. A critical analysis of the α, β and γ phases in poly (vinylidene fluoride) using FTIR. RSC Adv. 2017, 7, 15382–15389. [Google Scholar] [CrossRef]
  27. Mohammadi, B.; Yousefi, A.A.; Bellah, S.M. Effect of tensile strain rate and elongation on crystalline structure and piezoelectric properties of PVDF thin films. Polym. Test. 2007, 26, 42–50. [Google Scholar] [CrossRef]
  28. Kim, G.H.; Hong, S.M.; Seo, Y. Piezoelectric properties of poly (vinylidene fluoride) and carbon nanotube blends: β-phase development. Phys. Chem. Chem. Phys. 2009, 11, 10506–10512. [Google Scholar] [CrossRef]
  29. Chatterjee, J.; Nash, N.; Cottinet, P.J.; Wang, B. Synthesis and characterization of poly (vinylidene fluoride)/carbon nanotube composite piezoelectric powders. J. Mater. Res. 2012, 27, 2352–2359. [Google Scholar] [CrossRef]
  30. Xu, L.; Ma, J.; Wei, G.; Gu, C.; Tao, J. Improved surface-enhanced Raman scattering performance enabled by hydrophilic-hydrophobic piezoelectric PVDF-silver substrate. Sens. Actuators B Chem. 2022, 132431. [Google Scholar] [CrossRef]
  31. Kobayashi, M.; Tashiro, K.; Tadokoro, H. Molecular Vibrations of Three Crystal Forms of Poly (vinylidene fluoride). Macromolecules 1975, 8, 158–171. [Google Scholar] [CrossRef]
  32. Ke, K.; Petra, P.; Dieter, J.; Dieter, F.; Brigitte, V. Achieving β-phase poly (vinylidene fluoride) from melt cooling: Effect of surface functionalized carbon nanotubes. Polymer 2014, 55, 611–619. [Google Scholar] [CrossRef]
  33. Olmos, D.; Rodríguez-Gutiérrez, E.; González-Benito, J. Polymer structure and morphology of low density polyethylene filled with silica nanoparticles. Polym. Compos. 2012, 33, 2009–2021. [Google Scholar] [CrossRef]
  34. Sanchez, F.A.; González-Benito, J. PVDF BaTiO3/carbon nanotubes ternary nanocomposites: Effect of nanofillers and processing. Polym. Compos. 2017, 38, 227–235. [Google Scholar] [CrossRef]
  35. Gurunathan, T.; Nayak, S.K. The influence of reactive organoclay on a biorenewable castor oil-based polyurethane prepolymers toughened polylactide nanocomposites. Polym. Adv. Technol. 2016, 27, 1484–1493. [Google Scholar] [CrossRef]
  36. Gurunathan, T.; Chung, J.S. Physicochemical Properties of Amino–Silane-Terminated Vegetable Oil-Based Waterborne Polyurethane Nanocomposites. ACS Sustain. Chem. Eng. 2016, 4, 4645–4653. [Google Scholar] [CrossRef]
  37. Ma, J.; Nan, X.; Liu, J. Investigation of the dielectric, mechanical, and thermal properties of noncovalent functionalized MWCNTs/polyvinylidene fluoride (PVDF) composites. Polym. Adv. Technol. 2017, 28, 166–173. [Google Scholar] [CrossRef]
  38. Bahader, A.; Gui, H.; Li, Y.; Xu, P.; Ding, Y. Crystallization kinetics of PVDF filled with multi wall carbon nanotubes modified by amphiphilic ionic liquid. Macromol. Res. 2015, 23, 273–283. [Google Scholar] [CrossRef]
  39. Al-Solamy, F.R.; Al-Ghamdi, A.A.; Mahmoud, W.E. Piezoresistive behavior of graphite nanoplatelets based rubber nanocomposites. Polym. Adv. Technol. 2012, 23, 478–482. [Google Scholar] [CrossRef]
  40. Mahmoud, W.E.; Al-Ghamdi, A.A. Charge transport mechanism of graphite-nanosheet-loaded rubber nanocomposites. Polym. Int. 2012, 61, 51–54. [Google Scholar] [CrossRef]
Figure 1. Powder XRD pattern (a) and FTIR spectrum (b) of Co3O4 structures prepared by calcination of the as electrospun nanowires.
Nanomaterials 12 02796 g001
Figure 2. TEM images of Cobalt oxide nanowires at different magnifications, (a) low, and (b) high.
Nanomaterials 12 02796 g002
Figure 3. Histogram showing average diameter of Co3O4 nanostructures.
Nanomaterials 12 02796 g003
Figure 4. XRD patterns of pure PVDF and PVDF nanocomposites with mono- and bi-nano-fillers prepared by solution cast method, PC1, PC1CNT1, PC1CNT1.5, and PC1CNT3.
Nanomaterials 12 02796 g004
Figure 5. FTIR spectra of pure PVDF and its nanocomposites in the range of 4000 cm−1–450 cm−1 (a), and 1600 cm−1–450 cm−1 (b).
Nanomaterials 12 02796 g005
Figure 6. TG (a), DTA (b), and DSC (c) curves of blank and different weight percent loaded nano-fillers PVDF nanocomposites films.
Nanomaterials 12 02796 g006
Figure 7. DC Conductivity (a), and dielectric loss (b) of PVDF and its composites with mono- and bi-nano-fillers consisting of different wt.% of MWCNTs.
Nanomaterials 12 02796 g007
Table 1. Details of Co3O4 and MWCNTs incorporation of different wt.% in PVDF matrix to prepare the resulting nanocomposite films.
Sample CodePVDF (wt.%)Co3O4 (wt.%)f-MWCNTs
PVDF1000.00.0
PC199.90.10.0
PC1CNT199.80.10.1
PC1CNT1.599.750.10.15
PC1CNT399.60.10.3
Table 2. TGA, DTA, and DSC temperatures of pure and nano-fillers loaded PVDF nanocomposites.
TempPVDFPC1PC1CNT1PC1CNT1.5PC1CNT3
Tonset (°C)340374401440449
Tend (°C)496498503508510
TP (°C)471473478481495
Tm (°C)199.59199.6199.60199.61199.64
Publisher’s Note: MDPI stays neutral with regard to jurisdictional claims in published maps and institutional affiliations.

